ann modeling of water sorption isotherm of date fruits ... · models to predict the moisture...
TRANSCRIPT

485
AbstrActWater sorption isotherms of four Date cultivars at temperatures range of 10 to 80°C with increments of 10°C were determined separately over ranging relative humidity from 10 to 90% using an automatic, gravimetric analyzer. The significant differences in equilibrium moisture contents (EMC) of cultivars can be attributed to chemical composition and structure of each cultivar. The adsorption / desorption experimental data for each cultivar were fitted by modified GAB, modified Halsey, modified Smith and modified Oswin models. The modified Oswin was found as best model to describe adsorption isotherm behavior while modified Halsey was the best model to describe desorption isotherm. In addition, many configurations of artificial neural networks (ANN) were examined to obtain the best one to predict either EMC adsorption isotherm or EMC desorption isotherm for each cultivar. Correlation coefficient (R), c2, root mean square error (RMSE) and relative percent errors (PE) were used to measure the performance of the four models as well as ANN model. The ANN model was able to predict EMC over the whole ranges of temperature and relative humidity with an R ranging from 0.9878 to 0.9999. A user-friendly interface program was created to predict EMC based on ANN model as well as the other four models.
ANN modeling of water sorption isotherm of date fruits acquired by dynamic vapor sorptionKhaled A. M. Ahmed1,2*, Bakri H. Hassan2 and AlHussein M. Al-Awaad2
2Department of Agricultural Engineering, and 1chair of Dates technologies and Industry, college of Food & Agriculture Sciences, King Saud University, Riyadh, Saudi [email protected]
1. INtrODUctIONPrediction of shelf life stability of fruits or design and optimization of processing require knowledge and understanding of changes that takes place. those changes are influenced mainly by the moisture content and water activity of fruit material (Jamali et al., 2006). The association between equilibrium moisture content (EMC) and water activity (aw) at constant temperature and pressure is defined as moisture sorption isotherm (MSI) (Alp et al., 2009; Bell and Labuza, 2000; Rahman, 1995). In addition, Berg and Bruin (1981) stated that understanding MSI is one of keys to develop new food products with optimal safety and quality attributes. For each food type, the MsI shape is unique due to differences in its structure and composition effects. For most foods, the isotherm is sigmoidal in shape, although foods that contain large amounts of sugar or small soluble molecules have a J-type isotherm curve (Kapsalis, 1987; Bruin and Luyben, 1980).
the three well-known isotherm methods which classically used for most sample types are: traditional Desiccator Method (TDM), Dynamic Vapor Sorption (DVS) and Dynamic Dewpoint Isotherm (DDI) method, the advantage and disadvantage of each method were quantified and discussed in (Gokhan, et al., 2012; brady and Anthony, 2008; Rahman and Al-Belushi, 2006). However, they claimed that for samples that practice a phase change during sorption measurement or have slow diffusion properties, the results may vary.
A significant amount of theoretical, empirical or semi-empirical correlations has been mentioned in the literature to estimate the equilibrium moisture of biological materials. Van den Berg and Bruin (1981) reported that there are more than 200 EMC/ERH equations are available for foods; however,
486
Proceedings of the Fifth International Date Palm Conference
no single equation has the ability to describe accurately the EMC/ERH relationships for various grains over a broad range of relative humidity and temperature. In addition, temperature level affects isotherms, and some models considers this factor (sun and Woods, 1993; Wang and brennan, 1991; Chen and Morey, 1989; and Chirife and Iglesias, 1978).
Although the massive effort that has been done on developing equilibrium isotherms for different biological materials, very limited literature was found on the sorption and desorption characteristics of date fruits (Ferradji, et al., 2012; belarbi, et al., 2000; Myhara, et al., 1998; and Hassan, 1991),characteristics of date pastes (Alhamdan and Hassan, 1999) and characteristics of date powder (Hassan, 2002)
Date palm is one of the major agricultural crops of the Near East region, where about 90% of the world dates production takes place. the date fruits play an important economical and sociological part in many countries in this region. About 450 cultivars are grown in SA, among these 60 cultivars are well known, date fruits have several stages of maturity they are conventionally described by changes in color, texture and taste/flavor. The date fruit (Phoenix dactylifera L.) is a much-appreciated fruit, not only for its refreshing taste, but also for its nutritional qualities. (Hassan, 1991).
Many researcher in field of food engineering use ANNs technique to solve either prediction or classification problems, most of published studies prove the importance and wide acceptability of this technique in solving such problems. because of the nature of its nonlinear structure, ANNs are particularly useful for detecting complex underlying relationships, which found in many real world problems (Alhassan and Misra, 2011).
In the problem of moisture sorption isotherms prediction, many researchers utilize ANNs to predict this behavior for many food materials (Hamid and Mohsen, 2013 for pistachio powder; Al-Mahasneh et al., 2012 for roasted green wheat; Mohammad et al. 2012 for some of agricultural material include dates; Gazor and Eyvani 2011 for red onion slices; chayjan and Esna-Ashari 2010 for raisin; chayjan 2010 for sesame seed; Paulo et al., 2010 for coffee; Janjai et al., 2009 for longan fruit; Chayjan and Moazez 2008 for three cultivars of paddy; Guilan et al., 2007 for cornstarch; and robert and Sablani 2001 for ten agricultural materials include date fruits).
Hamid and Mohsen (2013) tested several mathematical models to predict the moisture sorption isotherm of pistachio powder; they proved that Caurie model was the most suitable one. In addition, artificial neural network approach was used. the results showed that, ANN could able to predicted adsorption-desorption moisture content with r2 values 0.998 and 0.992, respectively. Comparison of ANN results with conventional sorption
isotherm models showed that ANN modeling had greater accuracy to predict EMc of pistachio powder.
Al-Mahasneh et al., (2012) use both of neural-fuzzy technique and four mathematical models, which are modified Halsey, modified Oswin, modified Henderson, and modified Smith in fitting experimental data from moisture sorption isotherms of roasted green wheat. compared with empirical models, neural-fuzzy modeling provided a much better prediction for moisture sorption isotherms as showed by statistical measures.
Gazor and Eyvani (2011) practice conventional mathematical models and ANNs to find out the moisture sorption isotherms of red onion slices at temperature ranged between 30 to 60 °C using the standard gravimetric static method over a range of relative humidity from 11% to 83%. In Mathematical models, modified Oswin model was better than others. As well, an ANN model with two inputs (temperature and relative humidity), one output (equilibrium moisture content) and two hidden layers was found to be able to predict the equilibrium moisture content after it was adequately trained.
Chayjan and Esna-Ashari (2010) use six empirical models and ANNs for predicting of (EMC) in raisin. the results show the power of ANN, in compare with empirical models. the study suggested that, the empirical models could be replaced with the ANN model.
Paulo et al. (2010) perform desorption isotherms properties of coffee from different processing stages during the drying. the isotherms were determined by a static gravimetric method for various temperature and humidity conditions. Several mathematical models in addition to ANN model correlated EMc data. based on statistical parameters, the ANN model, modified Henderson and GAB models were adequate to describe the sorption characteristics of the samples.
Janjai et al. (2009) developed ANN model to predict the EMc of longan fruit (Dimocarpus longan Lour). After proper train, ANN model is found be better than the well-known Henderson, and GAB models. They concluded that as the ANN model predicts EMc more accurately, therefore better equations for heat of sorption and entropy could be developed based on data from the ANN model.
Guilan et al. (2007) determine the adsorption and desorption isotherms for corn starch powders using a gravimetric technique, then the obtained data were fitted to Halsey, Oswin, Henderson, Modified-BET, GAB, Peleg and ANN. Analysis showed that, within the investigated temperature range, GAB, Peleg and Henderson models better describes the experimental data for corn starch powder.
Robert and Sablani (2001) determine equilibrium moisture content for ten selected fruits experimentally. They concluded

487
Date Palm Processing and Marketing
that unlike the GAB equation, which uses only physical data for modeling, the ANN method uses both physical and chemical compositional data to do the predictions. In addition, the ANN model was able to show a temperature dependent crossing of water sorption isotherms, due to the dissolution of sugar crystals in the fruit. the ANN was also able to predict the extent of crossing, depending on differences in the individual fruit chemical composition.
The purpose of the present study is to experimentally obtain water sorption isotherms for four date fruits cultivars to understand their water behavior in the temperature range of 10 to 80 °C and relative humidity range of 10 to 90%, and correlating experimental data with well-known modified GAB, modified Halsey, modified Smith and modified Oswin models. Additionally, to examine the ability of different ANNs configuration to predict adsorption-desorption moisture content of the selected date fruits cultivar.
2. MAtErIAL AND MEtHOD2.1 sample preparationFour date fruits cultivars were selected for their importance among all cultivars in SA, those cultivars were Sukkari, saqie, Khudari and Khlass. random fruits were picked and pits were manually removed using a sharp knife by cutting the fruit into two longitudinal halves. The date flesh was, carefully cut into small pieces less than one cm long, retaining both the external and internal surfaces of the flesh. The cut flesh pieces were dried in a vacuum oven at about 200 mm Hg vacuum and 65 °C for 48 h or until a constant weight was achieved. The bone dried date pieces were carefully, kept in tightly closed glass jars at 5.0±0.5 °C prior to sorption experiments.
2.2 Dynamic Vapor sorptionthe moisture adsorption and desorption at different humidity (10-95%) and temperature (10-80°C) were measured using an advanced fully automated, gravimetric, dynamic vapor sorption (DVS) instrument (Aquadyne DVS, Quantachrome instruments, Boynton Beach, Florida, USA). The instrument is equipped with two ultrasensitive microbalances which can detect changes in the mass during the adsorption and desorption cycle. The required relative humidity was, generated by mixing dry nitrogen and distilled water saturated nitrogen flows, in the corresponding proportion using mass flow controllers and a calibrated humidity probe. the instrument was calibrated using microcrystalline cellulose (CRM # 302) dry powder. Pre-dried date flesh pieces samples (bone dried) were 80±5 mg in each of the two ultrasensitive microbalances. The software, which provides with the instrumentation, allows real time evaluation and export data through PC-instrument RS 232 interface. Mass, temperature, and humidity data were, recorded in 30 s time
intervals. Equilibrium was, considered to have been, reached when the change in mass was less than 0.001 mg/min.
2.3 Isotherm Model Among all isotherm models, four isotherm models that integrated temperature effects were tested for their widely use. The models were Modified Halsey, Modified Oswin, Modified GAB and Modified Smith as follows:
Modified Halsey model:
Modified Oswin model:
Modified GAB model:
Modified Smith model:
Where: M is the equilibrium moisture content (% d.b.), Hr is the equilibrium relative humidity (decimal), A, B, C, D are individual model dependent empirical constants and T is the temperature (°C).
The curve fitting toolbox 3.4 provided with MATLAB® R2013b (The MathWorks Inc., Natick, MA, USA) was used to fit experimental data to the selected four isotherm and determined constants. The curve fitting toolbox procedure use the Gauss-Newton algorithm with Levenberg-Marquardt method to solve the models. Performance of the isotherm models was evaluated using performance parameters for non-linear models, such as mean relative percent error, standard error, and correlation r (Viswanathan et al., 2003; Menkov, 2000; and Chen and Morey, 1989).
2.4 ANN ModelingMany studies related to ANNs application claimed that, there is no optimum structure for any problem, the optimum structure could be found by experience or try and error (Raju and begum, 2013; Lendaris, 2004; and cho et al., 2000)
Prediction of EMS for each cultivar individually and for all cultivars is accomplished using multilayered feed forward network using standard back propagation method. Multilayered feed forward network is known as a supervised network because it requires a desired output in order to learn (Ripley, 1994).
In this research work, training ANN models completed using commercially available software Qnet 2000 (Vesta

488
Proceedings of the Fifth International Date Palm Conference
Services, 2000). The software also provide a Dynamic Link Library (DLL) file, which can be used to send and receive data from the trained neural networks within the Visual basic programming environment (Brown, 2005). In this research work, one and two hidden layers with 2-10 neurons per hidden layer, learning rate equal to 0.3, momentum coefficient equal to 0.9, activation functions of sigmoid, hyperbolic tangent and Gaussian in each hidden output layer and training iteration (epoch) equal to 5,000; 10,000 and 100,0005000 were used in order to find the best ANN configuration.
2.5 Data manipulationThe data sets were divided into three different sets named training, testing and validation sets. The training set is the largest set and is used by neural network to learn patterns present in the data. The testing is used to evaluate the generalization ability of supposedly trained network. A final check on the performance of the trained network was made using validation set. For each cultivar, 288 data sets used for the proposed architectures, 216 sets of them used for training process, 40 sets used for test process while the rest of data sets didn’t involve to be used in model validation. The data for each set (training, test and validation) selected randomly. For the general model, 576 sets were used in developing model that cover all cultivars. Five hundred sets used as training set, 50 sets as a test while the rest, which equal to 26 sets used for validation process.
the input layer of proposed architectures for consisted of two variables, which are temperature and relative humidity while the output layer is EMc. to standardize data, the input and output values were normalized between 0.15 and 0.85 prior to use with the model, according to the following equation:
Where: t is the original values of input or output variables, X (t) is normalized value, and tmax and tmin are maximum and minimum values of input or output variables.
A graphic user-friendly interface (GUI) was programmed using Microsoft Visual Basic® 6.0 (VB) to provide the user with an intuitive way of interacting with the application. The main purpose of GUI is to make the use of the application simple and quick. GUIs include a set of object buttons, text boxes and scroll bars that users use to work with applications and text elements that display information to the users. However, the behavior of those objects controlled by Vb scripting language associated with each one. then, the associated Dynamic Link Library (DLL) file from Qnet and the acceptable well-trained ANN used to predict EMC through GUI.
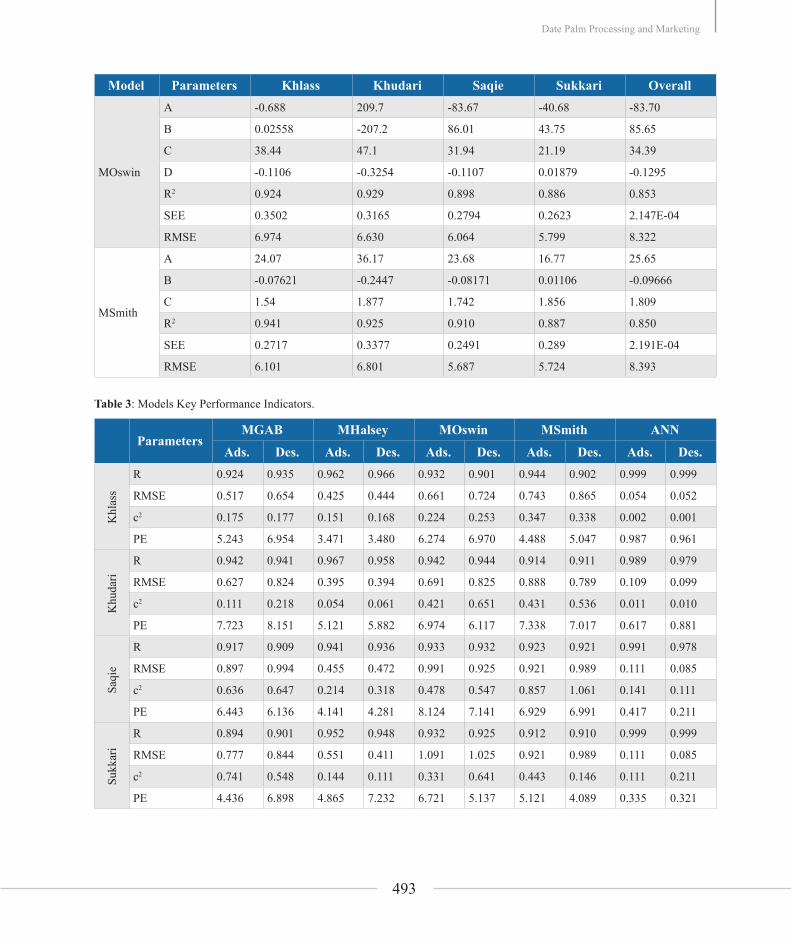
2.6 Model performance The agreement between the predicted data and experimental data for all models is calculated through four key performance indicators (KPIs). The four KPIs were correlation coefficient; root mean square error; Chi- square; and the relative percent errors. those KPIs can be calculated as follows:
Correlation of coefficient (adapts from Raquel, 2010):
chi- square (adapts from babalis et al., 2006):
root mean square error (adapts from Kingsly and Singh, 2007):
= The relative percent errors (adapts from Roberts et al., 2008):
Where: exp,i is the equilibrium moisture content
observed experimentally for instant i; pred,i is the predicted equilibrium moisture content for instant i for the same instant N;N is the number of observations and n is the number of model constants.
those KPIs used to describe the accuracy of models by many researches (saidur and Masjuki, 2008; Dawson et al., 2002; Loague and Green, 1991; and Nash and Sutcliffe, 1970). Model with the highest R and the lowest other KPIs values is the most suitable model (Minaei, et al., 2012).
3. rEsULts AND DIscUssION3.1 Water sorption isothermthe moisture adsorption – desorption isotherms for the four cultivars at different temperatures are shown in Figure (1) and Figure (2) respectively. Adsorption curves of all cultivars with a more or less pronounced sigmoidal and type-III shape where this is the general shape for materials with high sugar content (tsami et al., 1990). The figure showed that date fruits adsorb small amounts of water at low water activities and present a sharp increase in the quantity of adsorbed water at higher water activities. This behavior is typical of products with high sugar contents and several works reported similar results for tropical fruits (telis et al., 2000; Gabas et al., 1999; and Hubinger et al., 1992). EMC inclined to decrease with increasing temperature in a given water

489
Date Palm Processing and Marketing
activity for Saqie, Khudari and Khlass, while Sukkari behave as shown in Figure 1. This could be due to chemical and physical changes induced by temperature. The extent of this decrease depends on the composition of foods (Rizvi, 1995).
3.2 Isotherm Mathematical ModelsThe experimental data were fitted to the four isotherm models, which consider the influence of temperature. Estimated parameters and statistical results for adsorption behavior are shown in Table 2 while Table 3 was for desorption behavior. Although R2 was ranged 0.934 to 0.960, the modified Oswin adsorption model presented relatively high root mean square error, and lower r2 for all cultivars 0.842. On other hand, modified GAB was the best model that characterize desorption behavior for date cultivars.
3.3 ANN modelto obtain an optimum ANN model, minimal structure and minimal errors in training and testing sets were proposed (Sh. Youssefi et al., 2009). Based on these criteria, the most suitable neural network structure with the minimum number of neurons in hidden layers to correlate the input and output parameters was selected as two hidden layer with four neurons in first hidden layer and two neurons in the second hidden layer using sigmoid function as activation function . For this structure, Fig 3 shows the observed-predicted relation for validation data set.
However, to avoid overfitting, the number of epochs was limited to 10,000. Increasing the epoch size may increase the problem of overfitting (Razmi-Rad et al., 2007)
4. cONcLUsIONsbased on the results of this research work it can be conclude that although some mathematical models could have good EMC prediction for the selected four date cultivars, ANN model could achieved EMC more precisely. Additionally, the study result in that the overall ANN model could be used in the range of 10-80°c accurately regardless of date cultivar. It is recommended that more cultivars could be tested within the general ANN model and based on test results ANN model may need re-train.
AcknowledgementThe investigators would like to thank and acknowledge King Abdul-Aziz City for Science and Technology (KACST), for financially supporting project #10-AGR1194-02, under the National Plan for Science & Technology (NPST). Extend thanks and appreciation to the executive unit of NPST at KsU, sA for their keenness and continual support.
5. ReferencesAlhamdan, A.M and Hassan, b.H., 1999. Water sorption isotherms of date pastes as influenced by date cultivar and storage temperature. J. of Food Eng., 39, 301-306.
Alhassan, J. K., and s. Misra, 2011. Using a weightless neural network to forecast stock prices: A case study of Nigerian stock exchange. Scientific Research and Essays Vol. 6 (14), pp. 2934-2940
Al-Mahasneh, M.A., M.M. bani Amer, and t.M. rababah, 2012. Modeling moisture sorption isotherms in roasted green wheat using least square regression and neural-fuzzy techniques. Food and bioproducts processing (90) 165-170.
Alp Akın, Necdet Özbalta., and Ali Güngör, 2009. Equilibrium moisture content and equations for fitting sorption isotherms of capsicum annuum. GIDA (2009) 34 (4): 205-211.
babalis, s.J.,Papanicolaou, E.,Kyriakis, N. and Belessiotis V. G., 2006. Evaluation of thin-layer drying models for describing drying kinetics of figs (Ficuscarica). J. of Food Eng., 75, 205–214.
belarbi A., c. Aymard, J. M. Meto, A. themelin and M. Reynes, 2000. Water desorption isotherms for eleven varieties of dates. J. of Food Eng., 43: 103-107.
bell, L. N., and t. P. Labuza, 2000. Moisture sorption – Practical Aspects of Isotherm Measurement and Use. st. Paul, Minn.: American Association of cereal chemists.
Brady Carter and Anthony Fontana, 2008. Dynamic Dewpoint Isotherm verses Other Moisture Sorption Isotherm Methods. Application Note. Available from http://www.decagon.com
Brown, D. P., 2005. Artificial Intelligence for Creation of rapid, Low-cost Models and simulations. Defense Acquisition Univ. Technology and Engineering. Department, Fort Belvoir, VA, 22060. http://www.dtic.mil/dtic/tr/fulltext/u2/a484107.pdf
bruin, s. and Luyben, K.ch. M., 1980. Drying of food materials: A review of recent developments. In Advances in Drying, Vol. 1, p. 155-216. Hemisphere Publishing co., New York.
chayjan r. Amiri and M. Esna-Ashari, 2010. comparison between artificial neural networks and mathematical models for estimating equilibrium moisture content in raisin. Agric. Eng. Int. CIGR Journal, 12(1): 158-166.
chayjan r. Amiri and Y. Moazez, 2008. Estimation of Paddy Equilibrium Moisture sorption Using ANNs. J. of Applied Sciences 8 (2): 346-351.

490
Proceedings of the Fifth International Date Palm Conference
chayjan reza Amiri, 2010. Modeling of sesame seed dehydration energy requirements by a soft-computing approach. AJCS 4(3):180-184.
chen, c. c., and r. V. Morey., 1989. comparison of four RMC/ERH equations. Trans. ASAE 32(3): 983-989.
chirife, J., and H. A. Iglesias., 1978. Equations for fitting water sorption isotherms of food: Part I - A review. J. Food Tech. 13(3): 159-174.
choi, Y. s.; Kyu seung L., Yeop W. P., 2000. Application of a Neural Network to Dynamic Draft Model. Agricultural and biosystems Engineering Vol.1; No.2; .67-72.
Dawson c.W., c. Harpham, r.L. Wilby and Y. chen, 2002. Evaluation of artificial neural network techniques for flow forecasting in the River Yangtze, China. Hydrology and Earth System Sciences, 6(4), 619–626.
Ferradji, A. and M. A. A. Matallah, 2012. Sorption Isotherms and Isostreric Heats for Algerian Dates Deglet Nour. Am. J. Food Tech., 7(6):352-362.
Gabas, A. L., Telis-Romero, J., Menegalli, F. C., 1999. thermodynamic models for water sorption by grape skin and pulp. Drying technology, 17, 961.
Gazor, Hamid Reza and Eyvani, Afshin, 2011. Adsorption Isotherms for red Onion slices Using Empirical and Neural Network Models. Inte. J. of Food Eng. Vol. 7: Iss. 6, Article 3.
Gokhan Bingol, Bhagwati Prakash and Zhongli Pan, 2012. Dynamic vapor sorption isotherms of medium grain rice varieties. LWT - Food Science and Technology (48) -156-163.
Guilan Peng, Xiaoguang Chen, Wenfu Wu and Xiujuan Jiang, 2007. Modeling of water sorption isotherm for cornstarch. J.of Food Eng. (80) 562–567
Hamid Tavakolipour and Mohsen Mokhtarian, 2013. Application of Neural Network for Estimation of Pistachio Powder sorption Isotherms. American-Eurasian J. Agric. & Environ. Sci., 13 (7): 967-974.
Hassan, b. H., 1991. Water sorption isotherms of dried dates. Bull. Faculty of Agriculture, Cairo University, 42 (4):1224-1231.
Hassan, b. H., 2002. Moisture sorption characteristics of dried date powder. Journal of King Saud University (Agricultural Sciences), 14 (2): 101-108.
Hubinger, M., Menegalli, F. C., Aguerre, R. J:, and Suarez, C., 1992. Water adsorption isotherms of guava, mango and pineapple. J. Food Sci., 57, 1405.
Jamali, A., Kouhila, M., Ait Mohamed, L., Idlimam, A., & Lamharrar, A., 2006. Moisture adsorption-
desorption isotherms of Citrus reticulate leaves at different temperatures. J. of Food Eng. 77, 71-78
Janjai s., P. Intawee, K. tohsing, b. Mahayothee, b.K. bala, M.A. Ashraf and J. Müller, 2009. Neural network modeling of sorption isotherms of longan (Dimocarpus longan Lour.). Computers and Electronics in Agriculture (66) 209–214
Kapsalis, J.G., 1987. Influences of hysteresis and temperature on moisture sorption isotherms. In Water Activity: Theory and Applications to Food, L.A. Rockland and L.R. Beuchat (Ed.), p. 173-213. Marcel Dekker Inc., New York.
Kingsly, A.r.P. and singh, D.b., 2007. Drying kinetics of pomegranate arils J. of Food Eng., 79, 741–744.
Loague K, Green RE, 1991. Statistical and graphical methods for evaluating solute transport models: overview and application. J.Contam. Hydrol. 7:51-73.
MATLAB and Statistics Toolbox Release 2012b, the MathWorks, Inc., Natick, Massachusetts, United states
Menkov, N. D., 2000. Moisture sorption isotherms of vetch seeds at four temperatures. J. Agric. Eng. Res. 76(4): 373-380.
Minaei S., A. Motevali., E. Ahmadi, and M. H. Azizi, 2012. Mathematical Models of Drying Pomegranate Arils in Vacuum and Microwave Dryers. J. Agr. Sci. Tech. Vol. 14: 311-325
Mohammad shekofteh, Hosein shekofteh, Mohammad raza Hojati, 2012. Estimation Equilibrium Moisture content in Agriculture Product Using Neural Network Method. Intl. Res. J. Appl. Basic. Sci. Vol., 3 (11), 2215-2225.
Myhara r. M., M. s. taylor, b. A. slominski and I. Al-bulushi, 1998. Moisture sorption isotherms and chemical composition of Omani dates. J. Food Eng., 37: 471-479.
Nash, J. E. and J. V. Sutcliffe, 1970. River flow forecasting through conceptual models part I — A discussion of principles, Journal of Hydrology, 10 (3), 282–290.
Paulo C. Corre, Andre´ L. D. Goneli, Paulo C. A. Ju´nior, Gabriel H. H. de Oliveira and Domingos S. M. Valente, 2010. Moisture sorption isotherms and isosteric heat of sorption of coffee in different processing levels. Inte. J. of Food Science and Technology 2010, 45, 2016–2022
Rahman M. Shafiur and Rashid H. Al-Belushi, 2006. Dynamic isopiestic method (DIM): measuring Moisture sorption isotherm of freeze-dried Garlic powder and other potential uses of DIM. Inte. J. of Food Properties, 9: 421–437.
Rahman, S., 1995. Water activity and sorption properties of food. In Food Properties Handbook, 1-86. Boca Raton, Fla.: CRC Press.

491
Date Palm Processing and Marketing
raju Prasad Paswan and shahin Ara begum, 2013. regression and Neural Networks Models for Prediction of Crop Production. International Journal of Scientific & Engineering research, Vol 4, Issue 9, 98-108.
Raquel, P. F. G., 2010. Analysis of the drying kinetics of s. bartolomeu pears for different drying systems. EJEAFChe, 9(11), 1772-1783
Razmi-Rad, E.; Ghanbarzadeh, B.; Mousavi, S.M.; Emam-Djomeh, Z.; Khazaei, J., 2007. Prediction of rheological properties of Iranian bread dough from chemical composition of wheat flour by using artificial neural networks. J. of Food Eng., 81, 728–734.
ripley, b. D., 1994. Neural Networks and Related Methods for Classification. J. Royal Statistical Society B, 56, No. 3, 409-456.
Rizvi, S.S.H. Thermodynamic properties of foods in dehydration, In: M.A. rAO; s.s.H. rIZVI Engineering Properties of Foods. New York: Academic Press, 1995, 2nd, p.223-309.
Robert M. Myhara and Shyam Sablani 2001. Unification of fruit water sorption isotherms using artificial neural networks. Drying Technology, 19(8), 1543–1554.
roberts, J.s., Kidd, D. r. and Padilla-Zakour O., 2008. Drying kinetics of grape seeds. J. of Food Eng. 89, 460–465.
Román, F., and O. Hensel., 2010. A sorption isotherm of celery leaves (Apium graveolens var. secalinum). Agric Eng Int: CIGR Journal, 12(3): 137–14
saidur, r. and H.H. Masjuki,2008. Application of Artificial Neural Networks to Investigate the Energy
Performance of Household refrigerator-freezers, J of applied sciences, 8 (11): 2124-2129.
Sh. Youssefi, Z. Emam-Djomeh & S. M. Mousavi, 2009. Comparison of Artificial Neural Network (ANN) and Response Surface Methodology (RSM) in the Prediction of Quality Parameters of spray-Dried Pomegranate Juice, Drying technology: An International Journal, 27:7-8, 910-917
sun, D. W., and J. L. Woods., 1993. the moisture content/relative humidity equilibrium relationship of wheat - A review. Drying Tech. 11(7): 1523-1551.
Telis, V. R. N., Gabas, A. L., Menegalli, F. C., Telis-Romero, J., 2000. Water sorption thermodynamic properties applied to persimmon skin and pulp. thermochimica Acta, 343, 49.
tsami,E., Maroulis, Z.b., Marinos-Kouris, D., and Sarvacose, G.D., 1990. Heat of sorption of water in dried food. Inte. J. of Food Science and Technology, 25, 350-359
Van den Berg, C., and S. Bruin., 1981. Water activity and its estimation in food systems - theoretical aspects. In Water Activity: Influences on Food Quality, 1-61. L. B. Rockland and G. F. Stewart, eds. New York, N.Y.: Academic Press.
Vesta Services, 2000. Vesta Services, Inc. Qnet2000 Shareware, Vesta Services, Inc., 1001 Green bay rd, stE 196, Winnetka, IL 60093
Viswanathan, r., D. s. Jayas, and r. b. Hulasare., 2003. sorption isotherms of tomato slices and onion shreds. Biosystems Eng., 86 (4): 465-472.
Wang, N., and brennan., 1991. Moisture isotherm characteristics of potatoes at four temperatures. J. Food Eng. 14(4): 269-287.
tablesTable 1: Adsorption isotherm models estimated parameters and statistical results.
Model Parameters Khlass Khudari Saqie Sukkari Overall
MGAB
A 11.460 18.30 8.525 4.527 9.813
b 0.976 0.9238 0.994 1.006 0.9655
c 74.47 26.03 81.73 147.20 73.13
r2 0.958 0.961 0.918 0.860 0.830
sEE 0.1778 0.1681 0.2491 0.3468 2.479E-04
rMsE 5.076 4.936 6.009 6.940 9.277

492
Proceedings of the Fifth International Date Palm Conference
Model Parameters Khlass Khudari Saqie Sukkari Overall
MHalsey
A 2.393 2.601 1.955 0.834 2.218
b -0.001302 -0.007032 -0.0008995 0.009166 0.0009109
c 1.018 1.017 0.9546 0.9016 1.06
r2 0.951 0.927 0.921 0.948 0.817
sEE 0.2085 0.3163 0.2411 0.1280 2.662E-04
rMsE 5.498 6.771 5.911 4.217 9.614
Msmith
A -103.3 -75.55 -47.12 -47.45 -103.7
b 93.52 65.47 38.02 37.37 94.49
c 37.52 45.67 32.06 16.43 30.86
D -0.009261 -0.2118 -0.01614 0.1716 0.008094
r2 0.956 0.952 0.917 0.901 0.836
sEE 0.1847 0.2069 0.2526 0.2464 2.295E-04
rMsE 5.211 5.515 6.094 5.891 8.942
MOswin
A 14.82 17.91 11.28 3.205 11.28
b -0.01468 -0.09239 -0.0105 0.05769 0.009324
c 1.2 1.205 1.122 1.02 1.227
r2 0.965 0.943 0.934 0.960 0.842
sEE 0.1462 0.2479 0.2002 0.9813 2.387E-04
rMsE 4.604 5.994 5.386 3.692 9.105
Table 2: Desorption isotherm models estimated parameters and statistical results.
Model Parameters Khlass Khudari Saqie Sukkari Overall
MGAB
A 17.02 33.73 14.82 10.07 18.50
b 0.9063 0.7669 0.8896 0.9185 0.8549
c 89.16 45.82 142.4 506.9 92.77
r2 0.961 0.954 0.928 0.9023 0.878
sEE 0.1817 0.2056 0.1995 0.2240 1.787e-04
rMsE 4.989 5.307 5.09 5.325 7.579
MHalsey
A 3.728 5.168 4.068 4.038 4.492
b -0.005416 -0.01541 -0.005746 0.0006643 -0.00711
c 1.28 1.528 1.412 1.564 1.497
r2 0.941 0.920 0.913 0.894 0.845
sEE 0.2713 0.3578 0.2394 0.2438 2.269E-04
rMsE 6.096 7.001 5.575 5.555 8.542
493
Date Palm Processing and Marketing
Model Parameters Khlass Khudari Saqie Sukkari Overall
MOswin
A -0.688 209.7 -83.67 -40.68 -83.70
b 0.02558 -207.2 86.01 43.75 85.65
c 38.44 47.1 31.94 21.19 34.39
D -0.1106 -0.3254 -0.1107 0.01879 -0.1295
r2 0.924 0.929 0.898 0.886 0.853
sEE 0.3502 0.3165 0.2794 0.2623 2.147E-04
rMsE 6.974 6.630 6.064 5.799 8.322
Msmith
A 24.07 36.17 23.68 16.77 25.65
b -0.07621 -0.2447 -0.08171 0.01106 -0.09666
c 1.54 1.877 1.742 1.856 1.809
r2 0.941 0.925 0.910 0.887 0.850
sEE 0.2717 0.3377 0.2491 0.289 2.191E-04
rMsE 6.101 6.801 5.687 5.724 8.393
Table 3: Models Key Performance Indicators.
ParametersMGAB MHalsey MOswin MSmith ANN
Ads. Des. Ads. Des. Ads. Des. Ads. Des. Ads. Des.
Khl
ass
r 0.924 0.935 0.962 0.966 0.932 0.901 0.944 0.902 0.999 0.999
rMsE 0.517 0.654 0.425 0.444 0.661 0.724 0.743 0.865 0.054 0.052
c2 0.175 0.177 0.151 0.168 0.224 0.253 0.347 0.338 0.002 0.001
PE 5.243 6.954 3.471 3.480 6.274 6.970 4.488 5.047 0.987 0.961
Khu
dari
r 0.942 0.941 0.967 0.958 0.942 0.944 0.914 0.911 0.989 0.979
rMsE 0.627 0.824 0.395 0.394 0.691 0.825 0.888 0.789 0.109 0.099
c2 0.111 0.218 0.054 0.061 0.421 0.651 0.431 0.536 0.011 0.010
PE 7.723 8.151 5.121 5.882 6.974 6.117 7.338 7.017 0.617 0.881
saqi
e
r 0.917 0.909 0.941 0.936 0.933 0.932 0.923 0.921 0.991 0.978
rMsE 0.897 0.994 0.455 0.472 0.991 0.925 0.921 0.989 0.111 0.085
c2 0.636 0.647 0.214 0.318 0.478 0.547 0.857 1.061 0.141 0.111
PE 6.443 6.136 4.141 4.281 8.124 7.141 6.929 6.991 0.417 0.211
sukk
ari
r 0.894 0.901 0.952 0.948 0.932 0.925 0.912 0.910 0.999 0.999
rMsE 0.777 0.844 0.551 0.411 1.091 1.025 0.921 0.989 0.111 0.085
c2 0.741 0.548 0.144 0.111 0.331 0.641 0.443 0.146 0.111 0.211
PE 4.436 6.898 4.865 7.232 6.721 5.137 5.121 4.089 0.335 0.321

494
Proceedings of the Fifth International Date Palm Conference
ParametersMGAB MHalsey MOswin MSmith ANN
Ads. Des. Ads. Des. Ads. Des. Ads. Des. Ads. Des.O
vera
ll
r 0.848 0.852 0.901 0.893 0.872 0.889 0.841 0.862 0.982 0.979
rMsE 0.874 1.241 1.001 1.013 0.981 0.955 0.984 0.900 0.071 0.077
c2 1.041 1.008 1.003 1.111 0.991 1.432 1.113 0.996 0.331 0.282
PE 6.466 7.138 7.285 6.262 6.143 6.713 6.521 6.049 1.104 1.011
Figures
Figure (1): Dynamic vapor adsorption isotherms of date cultivars at different temperatures.

495
Date Palm Processing and Marketing
Figure (2): Dynamic vapor desorption isotherms of date cultivars at different temperatures.
Figure (3): Adsorption- Desorption validation data set for all cultivars by selected ANN model.

496