state bank of pakistan · comments of the participants 88 closing session 90 closing/concluding...
TRANSCRIPT

SSTTAATTEE BBAANNKK OOFF PPAAKKIISSTTAANN
22nndd UUsseerrss--PPrroodduucceerrss WWoorrkksshhoopp oonn CCoollllaabboorraattiioonn aammoonngg DDaattaa CCoommppiilleerrss && UUsseerrss
JJuullyy 2255 –– 2266,, 22000066
WWOORRKKSSHHOOPP PPRROOCCEEEEDDIINNGGSS

Compiled by: Dr. S. M. Husnain Bokhari Junior Joint Director Statistics Department State Bank of Pakistan Karachi. Ph: 021-2453628
2nd Users -Producers Workshop on Co l laborat ion among Data Co mpi l er s & Users
3
TTaabbllee ooff CCoonntteennttss FFOORREEWWOORRDD 0055
IINNAAUUGGUURRAALL SSEESSSSIIOONN 0077
Introductory and Welcome Address by Managing Director of NIBAF 07
Opening Remarks by Deputy Governor of SBP 08
IINNTTRROODDUUCCTTOORRYY SSEESSSSIIOONN 1111
Session Summary 11
Presentation on Statistics Produced by SBP by Director Statistics Dept. of SBP 13
TTEECCHHNNIICCAALL SSEESSSSIIOONN –– EEXXTTEERRNNAALL SSEECCTTOORR 1199
Session Summary 19
Presentation on Balance of Payments by SBP 22
Presentation on International Reserves & Foreign Currency Liquidity by SBP 29
Presentation on International Investment Position by SBP 34
Presentation on Foreign Trade by FBS 39
Presentation on External Debt by EAD 42
TTEECCHHNNIICCAALL SSEESSSSIIOONN –– SSOOCCIIOO--DDEEMMOOGGRRAAPPHHIICC DDAATTAA && FFIINNAANNCCIIAALL SSEECCTTOORR 4455
Session Summary 45
Presentation on Population Statistics by NIPS 47
Presentation on Population Statistics by PCO 50
Presentation on Analytical Accounts of the Central Bank by SBP 54
TTEECCHHNNIICCAALL SSEESSSSIIOONN –– RREEAALL SSEECCTTOORR 5577 Session Summary 57
Presentation on National Accounts 59
Presentation on Price Statistics 63
Presentation on Labour Force Survey 67
Presentation on Production Index 71
TTEECCHHNNIICCAALL SSEESSSSIIOONN –– MMIISSCCEELLLLAANNEEOOUUSS SSEECCTTOORRSS 7744
Session Summary 74
Presentation on Statistics compiled by Security Exchange Commission
of Pakistan 74

2nd Users -Producers Workshop on Co l laborat ion among Data Co mpi l er s & Users
4
Presentation on Statistics compiled by Bureaus of Statistics 77
PPLLEENNAARRYY GGRROOUUPP RREECCOOMMMMEENNDDAATTIIOONNSS’’ 8833
Session Summary 83
Recommendations for External Sector 83
Recommendations for Financial & Fiscal Sector 83
Recommendations for Socio-Demographic Data Sector 85
Recommendations for Real Sector 86
Recommendations for Miscellaneous Sectors 87
Comments of the Participants 88
CCLLOOSSIINNGG SSEESSSSIIOONN 9900
Closing/Concluding Remarks by Mr. Struck, Advisor, FBS 90
Note of Thanks by Director Statistics 91
AANNNNEEXXUURREE 9922
CCoonnffeerreennccee PPrrooggrraammmmee 9922
Day 1 – July 25, 2006 (Tuesday) 92
Day 2 – July 26, 2006 (Wednesday) 93
LLiisstt ooff ppaarrttiicciippaannttss 9966
LLiisstt ooff PPaarrttiicciippaannttss –– PPlleennaarryy SSeessssiioonn WWiissee 9999
WWoorrkksshhoopp MMaannaaggeemmeenntt TTeeaamm//OOrrggaanniizzeerrss 110011
EEvvaalluuaattiioonn CChhaarrtt 110022
AAccrroonnyymmss 110033
2nd Users -Producers Workshop on Co l laborat ion among Data Co mpi l er s & Users
5
FFeeww wwoorrddss aabboouutt tthhee WWoorrkksshhoopp During the recent past, the Statistical System of Pakistan has significantly evolved in response to
the increasing demand for quality statistics to manage and monitor economic developments in
the country. The statistical organizations have made good progress in adopting international
standards and dissemination practices to improve the understanding and availability of statistics
required for planning, research and decision making at various levels. However, much remains to
be done in establishing a high degree of coordination among the data compiling organizations
and users of the statistics.
The user feedback on the relevance of the statistics produced by the statistical agencies is
essential for developing a coherent statistical system. The quality of data produced by various
statistical organizations can be improved through feedback from users by holding seminars,
workshops and mutual coordination. It is very important for the data users to know the
methodology of compiling and computing data and its limitations before attempting to analyze it.
At the same time, it is also necessary for the data compilers to collect and present the data in a
comprehensive manner. Many misperceptions about the data are removed and credibility of the
compiling agencies improves with proper understanding and rapport between the users and
producers of data.
As a first step in this direction, the Statistics Department of State Bank of Pakistan organized two
2-days workshops on "collaboration among data compilers and users" to improve coordination
among data compilers and users. The main objective of conducting these workshops was to
enhance collaboration among all statistical organizations, to make efforts for effective and
efficient production and usage of the statistics, and to create harmony in the needs and
availability of statistics.
The first workshop was successfully held on May 08-09, 2006 at Learning Resource Centre of
the State Bank of Pakistan, Karachi. The 2nd 2-days users-producers workshop was held at
National Institute of Banking & Finance (NIBAF), State Bank of Pakistan, Sector H-8/1, Pitras
Bukhari Road, Islamabad on July 25-26, 2006. The workshop was attended by the speakers
from Federal Bureau of Statistics, Banks, Provincial Bureaus, Export Promotion Bureau,
Newspapers’ Economic Reporters, media, Planning & Development, Economic Affairs Division,
Population Census Organization, Central Board of Revenue, National Institute of Population
Studies, Security Exchange Commission of Pakistan, Ministry of Food Agriculture and
2nd Users -Producers Workshop on Co l labora t ion among Data Compi ler s & Users
6
Livestock, Ministry of Finance, State Bank of Pakistan, World Bank, International Monetary
Fund, academicians, and researchers.
In addition to the inaugural, introductory and concluding sessions, the workshop comprised of
four technical sessions on external, socio-demographic, real, financial and miscellaneous sectors.
Plenary sessions encompassing these sectors were arranged for collective discussions, feedback
and suggestions for further improvements in the statistics relevant to sector based on experiences
of the participants.
The honourable Deputy Governor, State Bank of Pakistan inaugurated the workshop. Mr. K. K.
Suri Executive Director, Export Promotion Bureau and Dr. Naushin Mahmood Additional
Director, Pakistan Institute of Development Economics chaired the technical sessions on external
and socio-demographic sectors on the 1st day of workshop. Dr. N. M. Larik Ex–Director
General, Federal Bureau of Statistics and Dr. Faqir Muhammad Chairman Department of
Economics, Allama Iqbal Open University chaired technical sessions on real & financial sector
and miscellaneous sectors on the 2nd day of the workshop.
The proceedings provide valuable and updated information on statistics compiled by agencies as
was delivered by the presenters/speakers in the workshop. We hope that this document would be
useful for analysts, researchers and policy makers using official statistics in providing them the
information on methodology, coverage and dissemination practices of the compilers and will
help them to identify gaps in the statistical system of the country.
We acknowledge with thanks the efforts of all those involved in organizing this workshop. Our
special thanks go to the members of steering committee, presenters, the chair persons of the
technical sessions and the closing sessions. We are also indebted to Dr. Ishrat Hussain, Ex-
Governor for his patronage and encouragement for initiating this project, continuous guidance of
Economic Adviser, and the patronage and personal interests of the Deputy Governors and
Governor State Bank of Pakistan.
The Team
2nd Users -Producers Workshop on Co l laborat ion among Data Co mpi l er s & Users
7
IInnaauugguurraall SSeessssiioonn The inaugural session started with recitation from the Holy Quran. Dr. Azizullah Khattak,
Director, Statistics Department invited Mr. Kazi Abdul Muktadir, MD – NIBAF to welcome the
participants of the workshop.
WWeellccoommee AAddddrreessss bbyy MMDD –– NNIIBBAAFF Honourable Deputy Governor, Mr. Mansur-ur-Rehman Khan, distinguished guests, Ladies and
gentlemen,
At the outset, I thank Mr. Mansur-ur-Rehman Khan for sparing his valuable time to inaugurate
the “Workshop on Collaboration among Data Compilers & Users”. The patronage of Governor
and Deputy Governors of SBP, for arranging this workshop is a reflection of their vision,
involvement and support for the development of a sound, efficient and effective statistical
system of Pakistan.
Ladies and Gentlemen: I am also thankful to you all for sparing your precious time to attend this
workshop.
Initiating the Project “Collaboration among the data producers and users” Statistics Department
of SBP aims at developing a highly interactive environment among analysts, decision makers
and the information providers from all over the country leading to produce high-quality and
meaningful statistics coping with the needs of the users at national as well as at international
level.
With the purpose of achieving this goal, we conducted a similar workshop at Karachi during
May 2006. The workshop was attended by a large number of researchers and representatives
from various field of life and useful suggestions were provided for improvements in the
statistical system of Pakistan. I am sure that implementation of these recommendations will lead
towards significant improvements in the existing system. The involvement of the statistical
organizations and the users of data in the relevant areas play a pivotal role in establishing a
sound ground for accomplishment of the sublime mission. The improvement in the quality of
statistical product largely depends upon the adoption of modern technologies, innovation in the
field, transparency in the processes of collection, compilation and dissemination, and most
importantly, the users’ feedback on effectiveness of the data. Through the workshop, we are
2nd Users -Producers Workshop on Co l laborat ion among Data Co mpi l er s & Users
8
trying to provide a forum for interaction and communication between the two parties for the
achievement of the common goal.
I am thankful to the representatives and coordinators of all organizations for their participation
and involvement in the process of conducting this workshop. We hope to get benefits from the
presence of the organizational Coordinators, technical committees and the presenters for success
of the workshop.
During the plenary session of the workshop in the areas of External, Real, Fiscal, Financial,
Socio-demographic Data and Other sectors, useful recommendations are expected for improving
grey areas and identifying gaps in data requirements and availability in each sector. The Steering
Committees will also devise strategies for filling the gaps, improvements in the methodologies,
eliminate duplications and provide proposals for implementation based on workshops’
recommendations. These recommendations will be communicated to the relevant organizations
for implementation through the nominated coordinators. It is hoped that the workshop will
enhance interaction among users and producers of statistics and will lead towards improvements
in the quality of data through input by the participants.
In the end, I would like to thank you again and hope your active participation in this workshop
will be rewarding and enjoyable... Thanks
Now I would like to invite the chief guest, Mr. Mansur-ur-Rehman, the Deputy Governor of
SBP. With his deep insight and in depth understanding, he now holds as a senior central banker
in Pakistan. Besides his involvement in managing affairs of the central bank, he supervises and
controls the management and development of information system in the State Bank. Very
humbly, I would now request Mr. Mansur-ur-Rehman to inaugurate the workshop and deliver his
inaugural speech.
DDeeppuuttyy GGoovveerrnnoorr’’ss IInnaauugguurraall SSppeeeecchh Kazi Abdul Muktadir, Managing Director, NIBAF, Dr. Azizullah Khattak, Director Statistics,
Heads of Research institutions, Chief Executive Officers of various organizations, Distinguished
participants, Ladies and Gentlemen !

2nd Users -Producers Workshop on Co l laborat ion among Data Co mpi l er s & Users
9
I feel pleasure to be among you to inaugurate the workshop on “Collaboration among Data
Compilers & Users”. This is the second workshop, which the Statistics Department of State
Bank has organized to enhance interaction among data compiling organizations and data users.
The first workshop conducted at Karachi on May 08–09, 2006, received useful feedback from
the participants of the workshop for further improving the quality of the statistical data.
Today’s workshop is another step ahead towards a sound, effective and efficient statistical
system in the country. The workshop will strengthen interactions between statisticians, policy
makers, analysts and researchers. It will improve relevance and quality of statistics produced by
various statistical organizations, thus increasing the level of satisfaction and confidence amongst
the users. The workshop would also help the participants in enhancing their understanding on
the compilation methodologies, identifying gaps in need and availability of statistics through
mutual discussions and interaction. The quality of statistics is assured in the context of being “fit
for use” and the extent to which information serve the purpose for which it is produced. The
users’ feedback in this workshop will assist the data compilers for setting their priorities in future
and pave the way towards a coherent statistical system. I would therefore, expect the workshop
to bring together information on key statistical activities currently undertaken by the statistical
organizations and to identify what more can be done to further improve the quality and timely
availability of statistics.
Statistics produced and financed by the government not only serve the need of government for
efficient administration and management but also for long-term policy formulation. It must also
serve the need of the public to monitor the activities of government and the change in public well
being. The statistical organizations are therefore, required to pay ample attention to the
dissemination of statistical outputs, make it easier to access, and use by the public. Adequate
feedback from users of statistical products would give appropriate signals to the managers of
statistical agencies for investment in new activities.
In today’s age of information technology, the statistical information has gained enormous
importance for effective decision-making process. Timely, accurate, reliable and result oriented
decisions whether taken at an individual level or at an organization or country level are highly
dependent on the quality, reliability and timely availability of the statistical data. Therefore, we
need to adopt best practices in all dimensions of data quality including legal framework,
automation in processes, relevance, accuracy, timeliness, comparability and accessibility.

2nd Users -Producers Workshop on Co l laborat ion among Data Co mpi l er s & Users
10
There has been a strong temptation for statistical agencies to undertake new data gathering
activities to satisfy the government machinery and the international organisations for monitoring
their programmes. This sometimes leads to duplication of work among these agencies. Besides
the data compiled often varies significantly which not only create doubts in mind of users but
also involve time consuming and costly reconciliation process. An open dialogue among all
organizations with a strong sense of partnership, sharing of needs and users’ feedback would be
effective in addressing these issues. Better coordination among data producers and users needed
to sustain a well-harmonized, nationally agreed set of data, which is up-to-date and easily
accessible. The National Statistical Council, as a governing body can significantly contribute to
inter-agency coordination.
The ever-increasing innovations in various sectors of the economy, rapid growth of knowledge
base and the rapid changes in the social, demographic and economic scenarios led to a strong
demand for innovation, creation and sophistication in methodologies used for compilation of
statistical data. At the same time users’ feedback is very important in adding value to the
statistical products and in helping the data compiling agencies to evolve in the face of the
changing scenarios. Notwithstanding their individual role, a high degree of cooperation and
coordination is also required among statistical agencies for creation of a coherent statistical
system, efficient use of the available databases and development of a system harmonized with
the international standards of quality and dissemination.
I hope that this workshop will educate the data users on the methodologies used in data
collection and processing and will improve confidence among the public about official statistics.
It will prove to be a milestone in increasing interaction amongst the data compilers and users.
The event will increase awareness of the importance of good statistics and will lead towards
enhanced cooperation and building trust on the statistics generated by the statistical
organizations.
In the end, I would like to congratulate the Statistics Department for taking the initiative in
organizing this workshop and I am confident that this interaction would result in generating
efficient and effective statistics.
I sincerely thank you for allowing me to share my thoughts and wish you all a fruitful and
enjoyable workshop.

2nd Users -Producers Workshop on Co l laborat ion among Data Co mpi l er s & Users
11
IInnttrroodduuccttoorryy SSeessssiioonn
SSeessssiioonn SSuummmmaarryy Dr. Azizullah Khattak, Director, Statistics Department started the technical session with a
detailed presentation on the functions of Statistics Department, State Bank of Pakistan. The
objective of this session was to give an introduction of Statistics Department and to highlight the
business process of the department. The annual business plan of the regular operational
functions of the department and the developmental projects initiated during the recent past to
improve its existing compilation methodologies in line with the international practices as well as
to adopt new developments in the era were put across in the presentation. The important statistics
compiled and disseminated under the operational plan on daily, monthly, quarterly, half-yearly,
and annua basis was presented in detail.
Dr. Khattak said, the department has initiated a number of developmental projects to improve the
quality of data being compiled as well as to meet the international standards. Today’s workshop
is also a part of one the developmental projects to enhance Collaboration among Data Compilers
and Users. The 1st two-days users-producers workshop on Collaboration among Data Compilers
& Users was successfully held at Learning Resource Centre, State Bank of Pakistan, on May 08-
09, 2006 at Karachi. It was attended by a large number of users from various sectors of economy
and useful feedback received for further improving the quality and scope of the statistics
presently compiled. He hoped that these workshops will enhance interaction among users and
producers of statistics and will lead towards improvements in the quality of data through input by
the participants.
At the end of his presentation, he explained Workshop’s program and objectives of various
sessions of the workshop. The participants of the workshop were divided into five groups
according to five data categories for the plenary sessions and their specific relevance to a
particular area. He emphasized on the importance of the plenary session and requested the
participants to actively participate in this session and provide their candid feedback on the
shortcomings in scope, coverage, methodologies of the statistics to be presented by the data
compiling organisations. The user’s feedback would be very important for the data compiling
agencies to further enhance scope, coverage and quality of data to be produce in future. This
feedback will be used in preparing the final recommendations of the workshop and will be
conveyed to relevant organisations for implementation. Steering Committees of organisational
Coordinators from each data compiling agency will monitor progress and report the status of

2nd Users -Producers Workshop on Co l laborat ion among Data Co mpi l er s & Users
12
implementation to the SC. He hoped that recommendations of the workshop will help to set
future direction of the compilation methodologies and dissemination processes of the Statistical
System of Pakistan. Dr. Khattak emphasized the participants for time management during the
workshop and their candid feedback.
2nd Users -Producers Workshop on Col laborat ion among Data Compi lers & Users
13
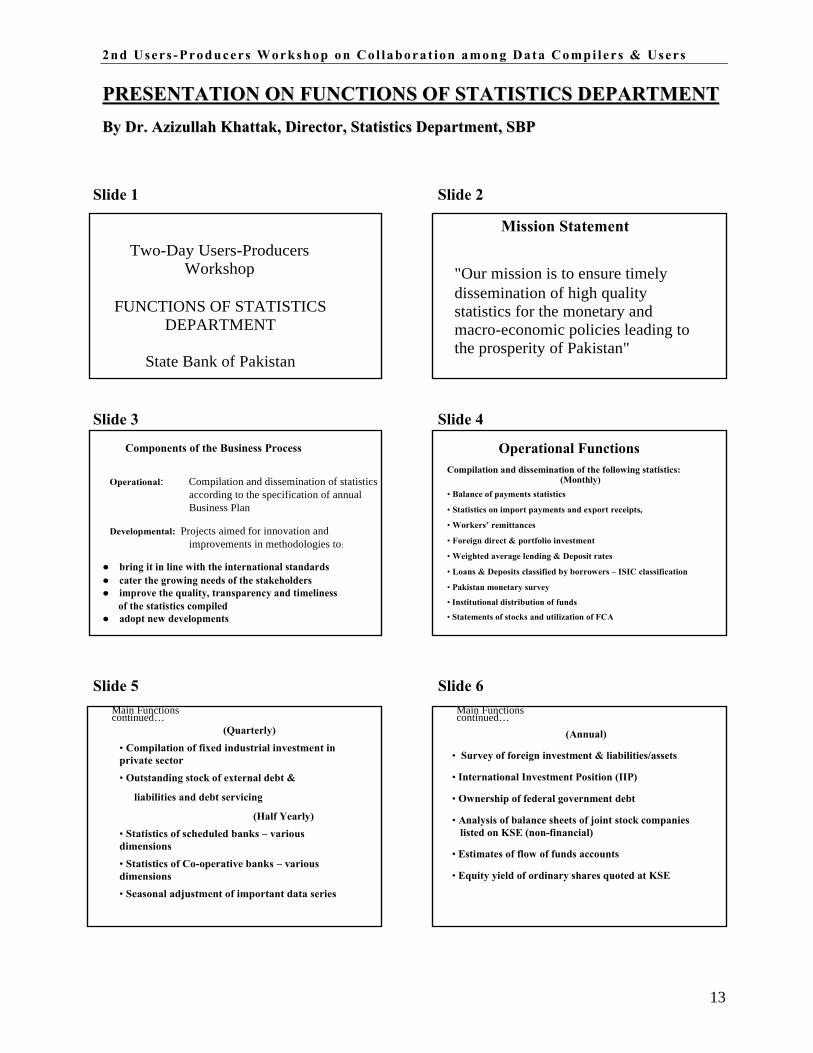
PPRREESSEENNTTAATTIIOONN OONN FFUUNNCCTTIIOONNSS OOFF SSTTAATTIISSTTIICCSS DDEEPPAARRTTMMEENNTT BByy DDrr.. AAzziizzuullllaahh KKhhaattttaakk,, DDiirreeccttoorr,, SSttaattiissttiiccss DDeeppaarrttmmeenntt,, SSBBPP
Slide 1 Slide 2
Mission Statement
Two-Day Users-Producers Workshop
FUNCTIONS OF STATISTICS
DEPARTMENT
State Bank of Pakistan
"Our mission is to ensure timely dissemination of high quality statistics for the monetary and macro-economic policies leading to the prosperity of Pakistan"
Slide 3 Slide 4
Components of the Business Process
Operational: Compilation and dissemination of statistics
according to the specification of annual Business Plan
Developmental: Projects aimed for innovation and
improvements in methodologies to: ● bring it in line with the international standards ● cater the growing needs of the stakeholders ● improve the quality, transparency and timeliness of the statistics compiled ● adopt new developments
Operational Functions Compilation and dissemination of the following statistics:
(Monthly) • Balance of payments statistics
• Statistics on import payments and export receipts,
• Workers’ remittances
• Foreign direct & portfolio investment
• Weighted average lending & Deposit rates
• Loans & Deposits classified by borrowers – ISIC classification
• Pakistan monetary survey
• Institutional distribution of funds
• Statements of stocks and utilization of FCA
Slide 5 Slide 6
Main Functions continued…
(Quarterly)
Main Functions continued…
(Annual) • Compilation of fixed industrial investment in private sector
• Outstanding stock of external debt &
liabilities and debt servicing
(Half Yearly) • Statistics of scheduled banks – various dimensions
• Statistics of Co-operative banks – various dimensions
• Seasonal adjustment of important data series
• Survey of foreign investment & liabilities/assets • International Investment Position (IIP) • Ownership of federal government debt • Analysis of balance sheets of joint stock companies listed on KSE (non-financial) • Estimates of flow of funds accounts • Equity yield of ordinary shares quoted at KSE

2nd Users -Producers Workshop on Col laborat ion among Data Compi lers & Users
14
Slide 7 Slide 8
Main Functions continued… Publications (11 +)
• Position of SCRA
(Daily) Publication
Statistical Bulletin Export Receipts
Frequency
Monthly Monthly
• Index numbers of stock exchange securities traded at KSE
Statistics on Scheduled Banks in Pakistan Export Receipts Annual Report (Statistical Annexure) Pakistan’s Balance of Payments Balance Sheet Analysis of Joint Stock Co’s listed at Karachi Stock Exchange Banking Statistics of Pakistan Equity Yields on Ordinary Shares Foreign Liabilities & Assets and Foreign Investment in Pakistan
Index Numbers of Stock Exchange Securities Handbook of statistics on Pakistan’s economy Updating statistics on SBP Website
Half Yearly Annual Annual Annual Annual Annual Annual Annual
Annual 5 years
Regularly
Slide 9 Slide 10
Key Developmental Projects
• Adoption of HS classification of commodities for trade data
• Implementation of 5th Manual for compilation of
Balance of payments
• Coordinated Portfolio Investment Survey
• Review of all publications on the basis of users’ feedback
• Adoption of ISIC for classification of private sector business
• Implementation of SNA 93 for compilation of FFA
• Compilation of IIP
Key Developmental Projects • Implementation of MFSM 2000
• Seasonal adjustment of data
• Handbook of statistics on Pakistan economy
• Preparation of Data Revision Policy
• Data Dissemination Policy
• Improve effectiveness of banking and
monetary data … in progress
• Collaboration among data compilers and users
Slide 11 Slide 12
Key Developmental Projects Collaboration among data compilers and users
Objectives • To establish interaction among data providers & users • to create awareness on the methodologies and
availability of statistics • to identify shortfalls in scope and coverage of available
data .to identify gaps in availability and needs of users
• to formulate strategies and recommendations for filling gaps
• implementation of strategies relating to SBP
Pakistan Balance of Payments • Provides an account of all economic transactions with
rest of the world • Compiled under Balance of Payments Manual BPM5 • Source: Banks, SBP, Exchange Cos, Foreign &
Pakistani, shipping/air Cos, EAD, Pak/Foreign diplomatic missions, etc
2nd Users -Producers Workshop on Col laborat ion among Data Compi lers & Users
15
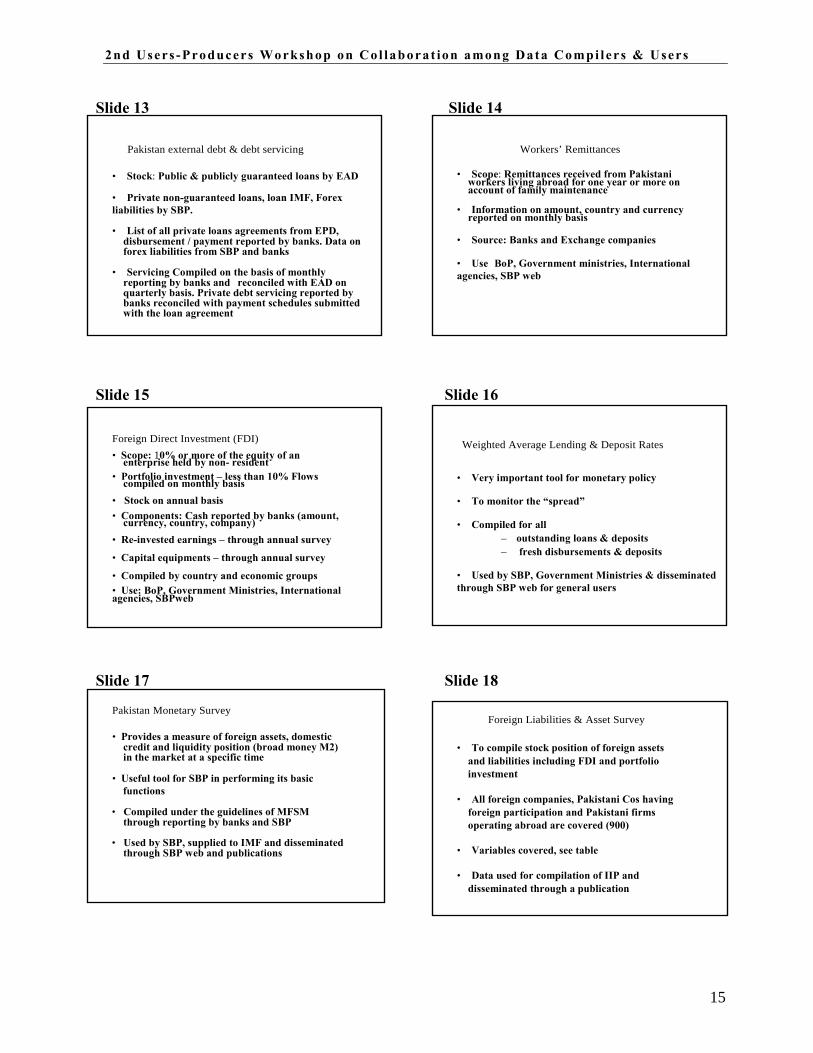
Slide 13 Slide 14
Pakistan external debt & debt servicing
• Stock: Public & publicly guaranteed loans by EAD
• Private non-guaranteed loans, loan IMF, Forex liabilities by SBP.
• List of all private loans agreements from EPD,
disbursement / payment reported by banks. Data on forex liabilities from SBP and banks
• Servicing Compiled on the basis of monthly
reporting by banks and reconciled with EAD on quarterly basis. Private debt servicing reported by banks reconciled with payment schedules submitted with the loan agreement
Workers’ Remittances • Scope: Remittances received from Pakistani
workers living abroad for one year or more on account of family maintenance
• Information on amount, country and currency
reported on monthly basis • Source: Banks and Exchange companies • Use BoP, Government ministries, International agencies, SBP web
Slide 15 Slide 16
Foreign Direct Investment (FDI) • Scope: 10% or more of the equity of an
enterprise held by non- resident • Portfolio investment – less than 10% Flows
compiled on monthly basis • Stock on annual basis • Components: Cash reported by banks (amount,
currency, country, company) • Re-invested earnings – through annual survey
• Capital equipments – through annual survey
• Compiled by country and economic groups • Use: BoP, Government Ministries, International agencies, SBPweb
Weighted Average Lending & Deposit Rates • Very important tool for monetary policy • To monitor the “spread” • Compiled for all
– outstanding loans & deposits – fresh disbursements & deposits
• Used by SBP, Government Ministries & disseminated through SBP web for general users
Slide 17 Slide 18
Pakistan Monetary Survey
• Provides a measure of foreign assets, domestic credit and liquidity position (broad money M2) in the market at a specific time
• Useful tool for SBP in performing its basic
functions
• Compiled under the guidelines of MFSM through reporting by banks and SBP
• Used by SBP, supplied to IMF and disseminated
through SBP web and publications
Foreign Liabilities & Asset Survey
• To compile stock position of foreign assets
and liabilities including FDI and portfolio investment
• All foreign companies, Pakistani Cos having
foreign participation and Pakistani firms operating abroad are covered (900)
• Variables covered, see table • Data used for compilation of IIP and
disseminated through a publication

2nd Users -Producers Workshop on Col laborat ion among Data Compi lers & Users
16
Slide 19 Slide 20
Foreign Investment Survey Import Payments and Export Receipts Foreign Liabilities
A. Short Term Debt
a) Capital
b) Debt payable to Non- Residents on or before December,31
B. Long Term
Debt a) Capital
b) Debt payable to Non- Residents on or before December,31
C. Holding of Securities and shares as nominees, agents or custodian
Foreign Assets A Short Term
a) Deposit abroad
b) Loan and Advances to Non-
Residents
B. Long Term
a) Time Deposits
b Loan and Advances to
Non-Residents
c) Securities Shares &
Debentures
• Scope: Export receipts realized and Import payments
made through banking channel • Fob basis • Information on amount, commodity (HS), currency and country • Transactions not covered by banks (land borne trade, EPZ,
personal baggage, Imports under foreign economic assistance) are collected from the relevant sources
• Use: BoP, Government Ministries, International agencies, SBP
web through statements and publications
Slide 21 Slide 22
Flow of Funds Accounts
• Accounts provide information on sources and use of funds among various sectors of economy and the financial instrument being used
• Information on Income, expenditure, saving,
investment, lending and borrowing of each sector of economy
• Under SNA 93, data collected through
questionnaire through a survey
• Information collected through questionnaire from Financial institutions (banks, DFIs, NBFIs), corporate sector (cos listed at stock exchange), non listed having foreign participation, NPIs
Fixed Industrial Investment in Private sector • Data on banks long term investment in private
sector for capital formation • Data compiled by economic groups based on the classification of ISIC • Data can be used for studying the performance of various sectors
Slide 23 Slide 24
Credit Classified by Borrowers
• Data useful for devising credit plan, monetary policy and to study the performance of various sectors of economy
International Investment Position (IIP) IIP shows stock of an economy’s external asset and liabilities at a particular point of time
• information on borrowing by Government,
PSEs, Private sector classified by ISIC, NBFIs, Non Profit Organizations & Consumer Finance
• Used in compilation of PMS and Government Ministries
Assets Direct investment Portfolio investment
– Equity securities – Debt securities
Other investment – Trade credits – Loans
Reserve Assets
Liabilities Direct investment
Portfolio investment
Other Investment

2nd Users -Producers Workshop on Col laborat ion among Data Compi lers & Users
17
Slide 25 Slide 26
Seasonal Adjustment of Data
Most of banking and economic data follow seasonal patterns and unadjusted data is usually misleading
Data series of advances, deposits, imports, exports, workers’ remittances, borrowing from SBP, currency in circulation, M1 and M2
The analysis is carried out regularly according to the frequency of the data series
Index Numbers of Stock Exchange Securities Objective To measure changes in the prices of shares traded at KSE for the 641 Cos listed at KSE. Coverage The index of share prices cover ordinary shares of all companies traded at KSE on a particular day Scope Overall and economic group wise general index, sensitive index and market capitalization on daily basis
Slide 27 Slide 28
Balance sheet analysis of joint stock companies listed at KSE
Objective
Objective
Equity yields on ordinary shares
To evaluate the performance of non-financial Cos /sectors listed at KSE
through various indicators developed from the data provided in Cos’
published annual reports
Coverage
The analysis is based on the published annual reports of non financial
sector companies listed at KSE
Scope
The performance indicators include:
• Current ratio
• Debt equity ratio
• Cash flow ratio
The term yields indicates return per hundred rupees of capital cost of investment. The objective of the study is to evaluate the performance of different investments in ordinary shares. Coverage
All listed companies
Scope
Overall, economic group-wise indicators such as
• Dividend yield
• Earning yield
• Index of dividend
• index of earning
Slide 29 Slide 30
Half yearly Statistics on Scheduled Banks
• Objective To provide comprehensive and reliable statistics
covering major aspects of banking such as. – Deposits
• By category of deposit holder • By type of account • By rate of return
– Advances • By borrower • By collateral • By rate of margin retained • By rate of return
– Bills purchased and discounted – Investment
• By institution • By securities
– Liability & Asset
Ownership classification of Federal Government Debt
Sources (2000)
• Scheduled & Cooperative banks • NBFCs • Insurance Companies • Govt sponsored institutions • Other public institutions • Local authorities • staff provident funds • Joint stock companies
Classification of debt
. Federal Govt securities/bonds • National prize bonds • National saving schemes • Treasury bills

2nd Users -Producers Workshop on Col laborat ion among Data Compi lers & Users
18
Slide 31 Slide 32
Users-Producers Workshop
Special Convertible Rupee Accounts (SCRA)
Scope: Special accounts of Non-residence
for investment in stock exchange securities
Flows used as proxy for foreign portfolio investment
Flows in SCRAs compiled on daily basis to monitor foreign investment in stock exchanges
Country-wise statement disseminated daily on SBP web
Final Request • Time management
• Uses’ Feedback
Slide 33
Thanks
2nd Users -Producers Workshop on Co l laborat ion among Data Co mpi l er s & Users
19
TTeecchhnniiccaall SSeessssiioonn oonn EExxtteerrnnaall SSeeccttoorr
SSeessssiioonn SSuummmmaarryy
The objective of this session was to review the scope, coverage, compilation methodologies of
the data on external sector to users for their feedback. The were presentations on the external
sector were in the area of Pakistan’s Balance of Payments, Data Template on International
Reserves and Foreign Currency Liquidity, International Investment Position, Foreign Trade
Statistics of Pakistan and External Debt. Speakers were from the State Bank of Pakistan, Federal
Bureau of Statistics and Economic Affairs Division. Mr K.K. Suri, Senior Econmist &
Consultant Export Promotion Bureau chaired the session.
Mr. Zafar, Joint Director, Statistics Department, SBP presented the compilation methodology on
Pakistan’s Balance of Payments. After introduction, he discussed the basic concepts and
importance of BOP data being used by government authorities for monitoring economic
activities, devising appropriate balance of payments mechanism and evaluating various
economic strategies. Academia, researchers, policy makers and international bodies such as IMF,
World Bank and other external stakeholders also use BOP data to assess performance of the
country’s external sector. Elaborating further, he said, BOP statistics is compiled both in Pak.
Rupees as well as in Us Dollar on monthly, quarterly and annual basis. He discussed standard
components of BOP and system of compilation under the guidelines of the 5th manual of Balance
of Payments. Regarding periodicity and timeliness of BOP data, Mr. Zafar explained, monthly
data is finalised by the time lag of 35 days, whereas quarterly data by one quarter after the
reference period. Data collection procedures from all sources will also discussed in details.
Mr. Ghulam Rabbani, Assistant Director, Accounts Department, SBP gave a detailed
presentation on Data Template on International Reserves and Foreign Currency Liquidity. He
started his presentation by explaining the background and importance for developing a data
template and its scope and coverage. He then discussed the New Data Template Framework that
captures several dimensions of country’s international reserve & related currency obligations.
The template includes information on the liquidity of country’s international reserves,
identifying encumbered assets, and its exposure to exchange rate fluctuations, he further
explained.

2nd Users -Producers Workshop on Co l laborat ion among Data Co mpi l er s & Users
20
Mr. Shamsul Arifeen, Junior Joint Director, Statistics Department, SBP presented the conceptual
framework of International Investment Position (IIP), its compilation methodologies and
dissemination process and practices. He discussed in detail the concepts and definition of
International Investment Position. Explaining further he said that since information on
components of IIP are compiled by more than one agency, a strong coordination is therefore
important among all the stakeholders. Moreover data on the subsets of the IIP need to be
consistent with each other. At the end of his presentation he discussed the classification of IIP its
links with BOP and sources of the required data. It was informed that with the compilation of
IIP, the SBP has fulfilled all the requirements for SDDS of IMF. The data on IIP is disseminated
on SBP website as well as in the Annual report of SBP.
Mr. Khalid Siddiqui, Director, FBS gave a detailed presentation on foreign trade statistics of
Pakistan. He informed that Foreign Trade Statistics is essential for planning of economic
development, framing trade policies, conducting trade negotiations, making bilateral, regional
and international arrangements for promotion of trade. He explained the historical background of
foreign trade statistics and methodologies used for it compilation. He clarified that FBS records
the data on the basis of movement of goods into or from Pakistan’s Custom boundary.
Explaining further he said that imports statistics includes all merchandise coming from foreign
countries into Pakistan through lawful channels under private and government accounts via sea,
air, land routes, parcel post released by the customs either directly or form the bonds. The goods
imported and deposited into bonds are not taken into account. Goods exported and returned to
Pakistan by the importing countries without any modification or change in the original form or
shape are considered re-imported and excluded from imports. At the end of his presentation, he
also gave details for dissemination of trade data in different national and international
publication.
Malik Muhammad Afaq, Assistant Chief, Economic Affairs Division gave presentation on
external debt statistics. At the outset, he discussed the dissemination and uses of external debt
statistics. He explained in detail the classification of external debt by creditors and debtors, types
of loan and modes of disbursements. He also discussed in details the problems of data collection,
and application of DMFAS, the external debt monitoring system. The dissemination practices of
external debt data were all discussed.
At the end of the presentations, the participants were invited for questions on classification,
comments on methodologies of the statistics presented in the sessions.

2nd Users -Producers Workshop on Co l laborat ion among Data Co mpi l er s & Users
21
Mr. K. K. Suri, Senior Economists and Consultant, Export Promotion Bureau concluded the
session with his remarks on the importance of statistics on external sector and various issues
presently faced by the external sector data. He suggested that data on export and import of
services should be compiled by SBP for a more clear picture of country’s exports and imports as
shown in the BOP account. He also suggested HS Code System needs further expansion for
enhancing its coverage up to 10 digits (which is currently up to 8 digits).

2nd Users -Producers Workshop on Col laborat ion among Data Compi lers & Users
22
PPrreesseennttaattiioonn oonn PPaakkiissttaann‘‘ss BBaallaannccee ooff PPaayymmeennttss BByy MMrr.. ZZaaffaarr IIqqbbaall,, JJooiinntt DDiirreeccttoorr,, SSttaattiissttiiccss DDeeppaarrttmmeenntt,, SSBBPP Slide 1 Slide 2
Pakistan’s
Balance of Payments Presentation for
Workshop:
Collaboration among Data compilers & Users
On 25-26/07/2006 NIBAF, Islamabad
By Zafar Iqbal Joint Director
Statistics Department State Bank of Pakistan
Slide 3 Slide 4
INTRODUCTION
„ What is BOP ? „ Why is it important ? „ Who does Compile it ? „ Periodicity and Timeliness? „ Conceptual Framework & standard
Components of BOP „ Data Sources ? „ System of compilation. „ Dissemination
Legal Framework of Pakistan’s
Balance Of Payment Under the Foreign Exchange Regulation Act 1947, the State Bank is monitoring and regulating Foreign Exchange policies including collection, processing and dissemination of all external sector data like reserves, trade statistics, balance of payments, workers’ remittances, foreign direct and portfolio investment, debt servicing, etc.
Slide 5 Slide 6
What is BOP ?
Balance of payments is a statistical statement designed to provide for a specific period of time, a systematic record of an economy’s transactions with the rest of the world.
An “economy” is comprised of economic entities (residents) that have closer association with that specific economy than with any other. Economic entities that have closer association with other economies are nonresidents.
CONCEPTUAL FRAMEWORK OF
BOP „ BOP primary registers transactions
between residents and non-residents. „ BOP deals with flows. „ BOP uses double entry accounting system. „ BOP adopts the principal of accrual
accounting (time of recording). „ BOP are normally expressed in domestic
currency or in stable unit of account.
2nd Users -Producers Workshop on Col laborat ion among Data Compi lers & Users
23
Slide 7 Slide 8
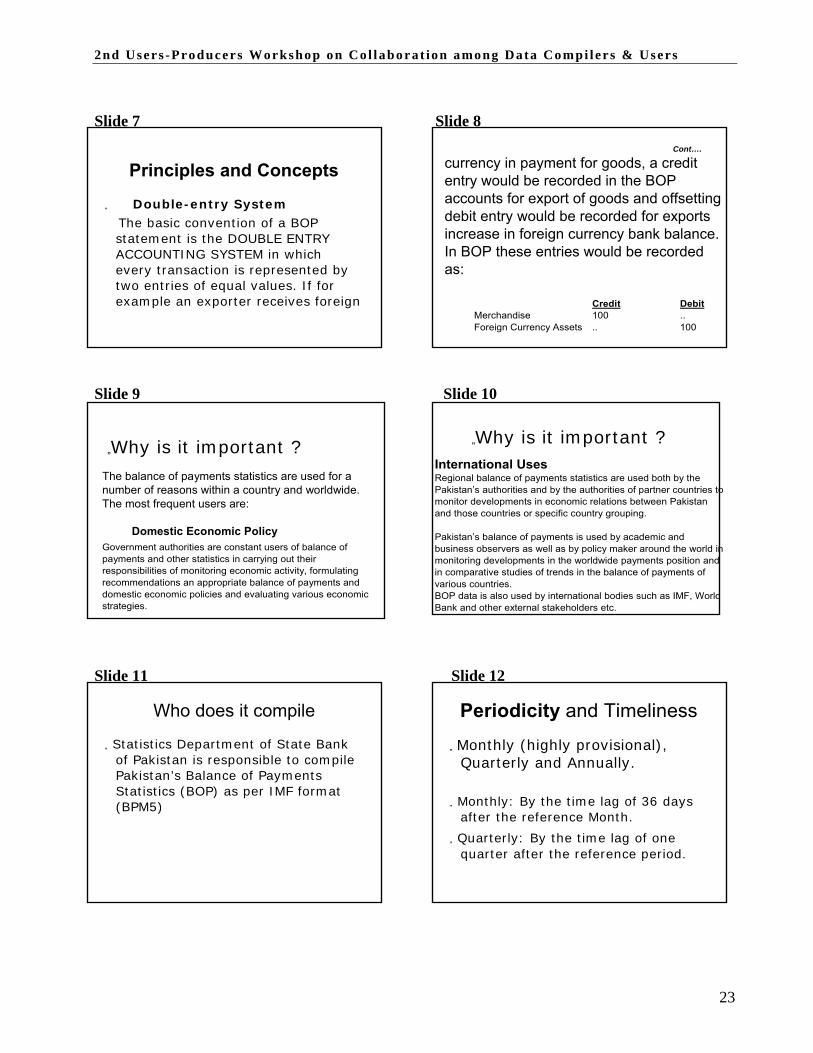
Principles and Concepts
„ Double-entry System The basic convention of a BOP statement is the DOUBLE ENTRY ACCOUNTING SYSTEM in which every transaction is represented by two entries of equal values. If for example an exporter receives foreign
Cont….
currency in payment for goods, a credit entry would be recorded in the BOP accounts for export of goods and offsetting debit entry would be recorded for exports increase in foreign currency bank balance. In BOP these entries would be recorded as:
Credit Debit
Merchandise 100 .. Foreign Currency Assets .. 100
Slide 9 Slide 10
„Why is it important ?
The balance of payments statistics are used for a number of reasons within a country and worldwide. The most frequent users are:
Domestic Economic Policy
Government authorities are constant users of balance of payments and other statistics in carrying out their responsibilities of monitoring economic activity, formulating recommendations an appropriate balance of payments and domestic economic policies and evaluating various economic strategies.
„Why is it important ? International Uses Regional balance of payments statistics are used both by the Pakistan’s authorities and by the authorities of partner countries to monitor developments in economic relations between Pakistan and those countries or specific country grouping. Pakistan’s balance of payments is used by academic and business observers as well as by policy maker around the world in monitoring developments in the worldwide payments position and in comparative studies of trends in the balance of payments of various countries. BOP data is also used by international bodies such as IMF, World Bank and other external stakeholders etc.
Slide 11 Slide 12
Who does it compile
„ Statistics Department of State Bank of Pakistan is responsible to compile Pakistan’s Balance of Payments Statistics (BOP) as per IMF format (BPM5)
Periodicity and Timeliness „ Monthly (highly provisional),
Quarterly and Annually.
„ Monthly: By the time lag of 36 days
after the reference Month.
„ Quarterly: By the time lag of one quarter after the reference period.

2nd Users -Producers Workshop on Col laborat ion among Data Compi lers & Users
24
Slide 13 Slide 14
Standard Components of BPM5
„ Minimum disclosure by an economy in a coherent manner is known as Standard Components
Current Account
Exceptiona l financing
Capital
Account Financial Accounts
Errors &
Omissions Slide 15 Slide 16
Standard Components of BOP Standard Components of BOP-
Contd…
„ I. Goods FOB Credit Debit Net
„
„ General merchandise. „ Goods for processing. „ Repairs on goods. „ Goods procured in ports by carriers „ Non-monetary gold.
„ II. Services Credit Debit Net ™ Transportation.
™ Travel.
™ Communication ™ Construction
™ Insurance
™ Financial
Slide 17 Slide 18
Standard Components of BOP- Contd…
„ II. Services Credit Debit Net
™ Computer and information
™ Royalties and license fees
™ Other business services
™ Entertainment
™ Cultural and recreational ™ Government services
Standard Components of BOP- Contd…
� III. Income Credit Debit Net
¾ Compensation of employees ¾ Investment income � ► Direct investment � ► Portfolio investment � ► Other investment � • Monetary authority � • General govt. „ • Banks „ • Others „ .

2nd Users -Producers Workshop on Col laborat ion among Data Compi lers & Users
25
Slide 19 Slide 20
Standard Components of BOP- Standard Components of BOP-
Contd… Contd… V. Capital account Credit Debit Net
„ IV. Current transfers Credit Debit Net
„ General government „ Other sectors „ ► Workers’ remittance . � ► Resident FCAs . � ► Others .
� Capital transfers General government
• Debt forgiveness • Others
Other sectors • Debt forgiveness • Others
� Acquisition/disposal of non-produced non-financial assets
Slide 21 Slide 22
Standard Components of BOP- Contd…
VI. Financial account Credit Debit Net
Direct investment
Direct investment abroad Direct investment in reporting economy
� Portfolio investment
Portfolio investment – Asset
Portfolio investment – Liability
� Financial Derivatives
Standard Components of BOP- Contd…
¾ Other investment Credit Debit Net
Assets • Trade Creditors • Loan • Currency and Deposits • Other assets
Liabilities
• Trade Creditors • Loan • Currency and Deposits • Other assets
Slide 23 Slide 24
Standard Components of BOP- Contd…
¾ Reserves Assets Credit Debit Net
BALANCE OF PAYMENTS INPUT
™ Monetary gold ™ SDRs ™ Reserve position in the Fund. ™ Foreign exchange ™ Other claims
VII. Errors and omissions –Net VIII. Exceptional financing.
Sector
0
Source
All Authorized Dealers
Reporting
ITRS Forms/
Summary statements & Schedules
BOP Head
Goods, services,
income. Current transfers, capital account and financial account.
Description
Exports, imports, services
(transportation, travel, Communication, Construction, Insurance, Financial, Computer & information, royalties & license fees, other business services and government) current transfers( workers’ remittances, private donation, official donation) capital transfers, Financial account (Direct investment, portfolio investment, other investment and reserves assets)

2nd Users -Producers Workshop on Col laborat ion among Data Compi lers & Users
26
Slide 25 Slide 26
1 Accounts Department SBP Abstract containing
Goods, services, income. Current transfers, and financial account t
Imports, services (transportation, travel, Communication, Construction, Insurance, Financial, Computer & information, royalties & license fees, other business services and government) current transfers( workers’ remittances, official donation), Financial account (Direct investment, portfolio investment, other investment and reserves assets)
3 Pak Diplomatic Missions abroad
4 Customs/Duty Free
Shops
Statement of accounts
Statement of Non-financial transactions between residents and non-residents
Services and financial account
Goods and current transfers
Government services (Earnings –credit * expenditure – debit) and balances under financial account Imports and its contra is adjusted under current transfers ( other sectors).
5 Survey of Foreign
Invest. & Liabilities. Capital equipment
Imports, income and Financial
Imports (capital equipment), reinvested
2 Foreign Airline/Shipping Companies
Freight and passage form
Exports, transportation, Travel and Financial account
Freight on Exports, passage earnings, local disbursement and outstanding balances (other liabilities of Financial account)
brought in Re- account invested earnings,
earnings (investment income) and contra is adjusted under direct investment in Pakistan (cap.eq. + reinvested earnings)
Slide 27 Slide28
6 Economic Affairs Division
7 Economic Affairs Division
8 All Authorized Dealers &
SBP
9 Abandoned
10 FBS/SBP/ Ads /EDMD
Status Report of EAD
Status Report of EAD
F.E.Returns, SBP abstract. Repayment advises by EAD and repayment sch. of for. private enterprises
Hard copy - no specific Performa
Goods and services, current transfers and capital account
Goods, services, and Financial account
Financial account
Goods, services, investment income, current transfers and Financial account assets,
Imports, services (transportation, insurance, government) current transfers(General Govt.) and Capital transfers(General Govt.) .
Imports, services (transportation, insurance, government) and financial account( loans long-term and short- term)
Financial account (Repayment of principal long-term & short-term official and private un-guaranteed)
Adjustment of outstanding export bills in Exports ant its contra under Financial account (assets). Adjustment of land borne exports & imports and adjustment of resident FCAs under current transfer. Adjustment of principal payments of sp. $ bonds under financial account (portfolio investment – govt. securities )
11 Abandoned
12 Pakistani
Airline/Shipping Companies
13 Foreign embassies
and offices of international org. in Pakistan
14 Exchange Companies
Statement of Summary of Foreign exchange receipts/pay ments
Statement of earning and expenditures in Pakistan ITRS/ Summary & schedules
Goods, services, investment income and financial account Goods and services, General Government, Direct investment Goods, services, current transfers
Freight on export, freight & passage collection from abroad, loans receipts , imports , oil/fuel purchased from abroad interest payments under investment income , principal payments and reserves under financial account. Data on earning and expenditures in Pakistan.
Imports, travel, royalty, other business services, workers’ remittances, other current transfers
Slide 29 Slide 30
General Merchandise f.o.b. ƒ EXPORT (FOB)
a) Exports c. & f. (exchange record) b) Less freight on exports by foreign Air / Shipping cos. c) Less freight on exports by Pakistani Air / Shipping
cos. d) Timing adjustment
i) increase ii) decrease
e) Unrequited exports f) Others
i) Export of crude oil ii) Export Credits iii) Land borne exports iv) Export samples
„ IMPORT (FOB) a) Imports c.f. (exchange record )
b) Less freight on import ( 8% ) c) Imports under personal baggage/ NRI d) Unclassified imports
e) Imports under foreign economic
assistance f) Others
i) Capital equipment ii) Land borne
iii) PIA/PNSC vi) Saudi Oil Facility
2nd Users -Producers Workshop on Col laborat ion among Data Compi lers & Users
27
Slide 31 Slide 32
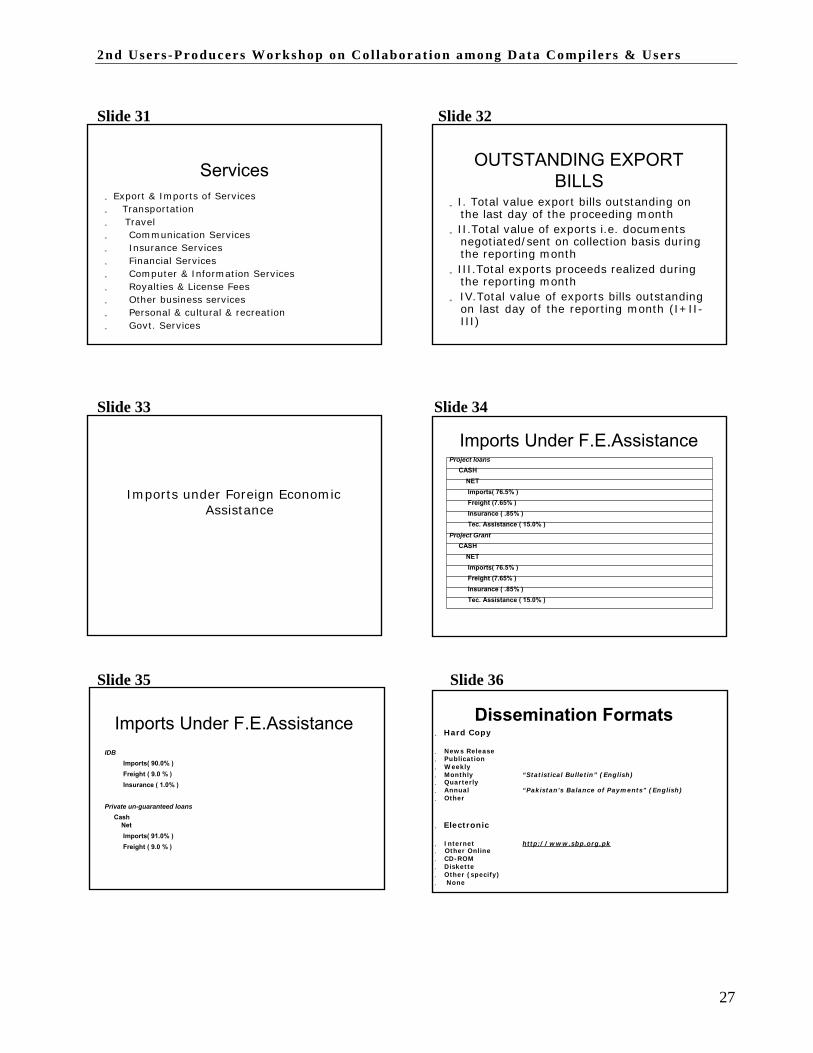
Services
„ Export & Imports of Services „ Transportation „ Travel „ Communication Services „ Insurance Services „ Financial Services „ Computer & Information Services „ Royalties & License Fees „ Other business services „ Personal & cultural & recreation „ Govt. Services
OUTSTANDING EXPORT BILLS
„ I. Total value export bills outstanding on the last day of the proceeding month
„ II.Total value of exports i.e. documents negotiated/sent on collection basis during the reporting month
„ III.Total exports proceeds realized during the reporting month
„ IV.Total value of exports bills outstanding on last day of the reporting month (I+II- III)
Slide 33 Slide 34
Imports Under F.E.Assistance
Imports under Foreign Economic Assistance
Project loans CASH
NET Imports( 76.5% ) Freight (7.65% ) Insurance ( .85% ) Tec. Assistance ( 15.0% )
Project Grant CASH
NET Imports( 76.5% ) Freight (7.65% ) Insurance ( .85% ) Tec. Assistance ( 15.0% )
Slide 35 Slide 36
Imports Under F.E.Assistance Dissemination Formats „ Hard Copy
IDB
Imports( 90.0% ) Freight ( 9.0 % ) Insurance ( 1.0% )
„ News Release „ Publication „ Weekly „ Monthly “Statistical Bulletin” (English) „ Quarterly „ Annual “Pakistan's Balance of Payments” (English) „ Other
Private un-guaranteed loans Cash
Net Imports( 91.0% ) Freight ( 9.0 % )
„ Electronic „ Internet http://www.sbp.org.pk „ Other Online „ CD-ROM „ Diskette „ Other (specify) „ None

2nd Users -Producers Workshop on Col laborat ion among Data Compi lers & Users
28
Slide 37 Slide 38
Dissemination Reports „ Monthly/Quarterly/Annual Balance of Payments (BOP) „ IMF Table-2003. Standard format, Summary BOP-BPM5
and Summary BOP-MOF format-BPM4. „ Workers’ Remittance – Country wise „ Foreign Direct Investment Country wise & Sector wise „ Portfolio Investment - Country wise „ Forget Currency Accounts & its Utilization „ Quarter wise Debt servicing „ Quarter wise Outstanding stock Foreign debt/liabilities „ Export receipts –Monthly & Annual „ Balance of Payment Booklet- Quarterly/Annual Country
wise & County groups i.e. OIC, EEC, EE & I.I etc
Dissemination Reports „ Weekly/Monthly Gold and Foreign
Exchange Reserves. „ Foreign Exchange Budget „ Quarterly Report form of IMF „ Outstanding Export Bills „ Imports payments by commodities „ Invisible & Capital Receipts /
Payments
Slide 39 Slide 40
QUESTIONS AND
ANSWERS

2nd Users -Producers Workshop on Col laborat ion among Data Compi lers & Users
29
PPrreesseennttaattiioonn oonn DDaattaa TTeemmppllaattee oonn IInntteerrnnaattiioonnaall RReesseerrvveess aanndd FFoorreeiiggnn CCuurrrreennccyy LLiiqquuiiddiittyy BByy MMrr.. GGhhuullaamm RRaabbbbaannii,, AAssssiissttaanntt DDiirreeccttoorr,, AAccccoouunnttss DDeeppaarrttmmeenntt,, SSBBPP Slide 1 Slide 2
Data Template on International Reserves and Foreign Currency Liquidity
Presented By:
Ghulam Rabbani Assistant Director
Financial Accounts Division, Accounts Department, SBP, Karachi
Background ƒ International Financial crisis in the late 1990s ƒ Country experiences highlighted the importance of
accessing foreign exchange liquidity from a broader perspective
ƒ IMF and the working group of the Bank for
International Settlements (BIS) Committee on the Global Financial System, jointly developed in 1999 the new data template
ƒ On March 1999, the template was made a component
of the Special Data Dissemination Standard (SDDS) established by the IMF in 1996
Slide 3 Slide 4
Data Deficiencies Revealed by Financial Crisis in the 1990s:
• Some countries include pledged assets in reserve
assets
• foreign currency deposits held in financially weak
domestic banks
• Valuation practices could depart significantly from
market values
• Coverage of international reserve assets varied
among countries
Lack of Publicly Available Information on Official Short-term Foreign Currency
Obligations: • off-balance sheet activities • data on forward commitments of foreign
exchange under financial derivative contracts • information on options • information on principal and interest payments in
foreign currency on loans and advances • Information on government foreign exchange
guarantees and callable debt. • unused conditional lines of credit
Slide 5 Slide 6
The New Data Template Framework
• The new data template captures several dimensions of country’s international reserve and related currency obligations and addresses the inadequacies described before
• Takes account of the off-balance sheet activities • Takes note of the future schedule and potential
flows of contracts involving financial derivatives such as options, forwards and futures as well as un-drawn credit lines and loan guarantees
• The template includes information on the liquidity of country’s international reserves, identifying encumbered assets, and on its exposure to exchange rate fluctuations
Forestalling Future Crisis • strengthen the accountability of the authorities on
policy action and foreign currency exposure • correction of unsustainable policies and limit the
adverse effects of contagion in times of financial turbulence
• It allows market participants to form a more accurate view of the condition of individual countries
• Access to more transparent data may also enhance the effectiveness of the multilateral organizations.
2nd Users -Producers Workshop on Col laborat ion among Data Compi lers & Users
30
Slide 7 Slide 8
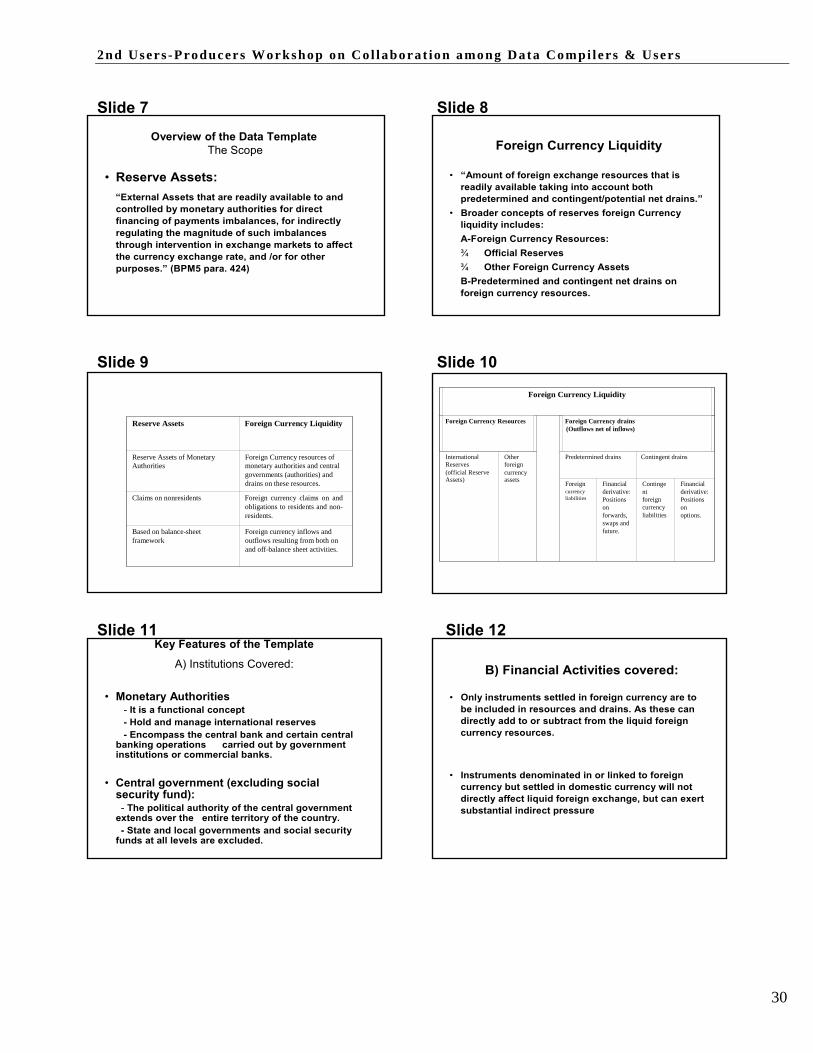
Overview of the Data Template The Scope
• Reserve Assets:
“External Assets that are readily available to and controlled by monetary authorities for direct financing of payments imbalances, for indirectly regulating the magnitude of such imbalances through intervention in exchange markets to affect the currency exchange rate, and /or for other purposes.” (BPM5 para. 424)
Foreign Currency Liquidity • “Amount of foreign exchange resources that is
readily available taking into account both predetermined and contingent/potential net drains.”
• Broader concepts of reserves foreign Currency liquidity includes: A-Foreign Currency Resources: ¾ Official Reserves ¾ Other Foreign Currency Assets B-Predetermined and contingent net drains on foreign currency resources.
Slide 9 Slide 10
Foreign Currency Liquidity
Reserve Assets Foreign Currency Liquidity Foreign Currency Resources Foreign Currency drains
(Outflows net of inflows)
Reserve Assets of Monetary Authorities
Foreign Currency resources of monetary authorities and central governments (authorities) and
International Reserves (official Reserve
Other foreign currency
Predetermined drains Contingent drains
drains on these resources.
Claims on nonresidents Foreign currency claims on and obligations to residents and non- residents.
Assets) assets Foreign currency liabilities
Financial derivative: Positions on forwards, swaps and
Continge nt foreign currency liabilities
Financial derivative: Positions on options.
Based on balance-sheet framework
Foreign currency inflows and outflows resulting from both on and off-balance sheet activities.
future.
Slide 11 Slide 12
Key Features of the Template
A) Institutions Covered:
• Monetary Authorities - It is a functional concept - Hold and manage international reserves - Encompass the central bank and certain central
banking operations carried out by government institutions or commercial banks.
• Central government (excluding social
security fund): - The political authority of the central government
extends over the entire territory of the country. - State and local governments and social security
funds at all levels are excluded.
B) Financial Activities covered: • Only instruments settled in foreign currency are to
be included in resources and drains. As these can directly add to or subtract from the liquid foreign currency resources.
• Instruments denominated in or linked to foreign
currency but settled in domestic currency will not directly affect liquid foreign exchange, but can exert substantial indirect pressure

2nd Users -Producers Workshop on Col laborat ion among Data Compi lers & Users
31
Slide 13 Slide 14
C) Treatment of financial derivative activities:
• The template covers: ¾ Predetermined foreign currency flows pertaining to the authorities’ forwards, futures, and swap contracts ¾ Potential flows arising from options positions ¾ Net, marked to market value of outstanding financial derivative contracts
• The template focuses financial derivatives settled in foreign currencies. (NDF and options settled in domestic currency are reported as memo items.
• Separate information is to be reported for short and long positions.
• Stress testing is to be included to assess risk exposure to fluctuations in exchange rates.
D) Valuations Principals: • Positions are to be valued at market prices on the
reference date or at approximate market values. • Drains on foreign currency resources are to be
valued at nominal terms. (i.e cash flow value when the currency flows are to take place.)
• For financial derivatives: ¾ Inflows and outflows in nominal terms for forwards, futures, and swaps ¾ Notional values for options ¾ Net, marked to market values for outstanding financial derivative contracts.
Slide 15 Slide 16
E) Time Horizon:
• As the focus is on liquidity, the time horizon is short-term, up to one year. Further time horizon is proposed for assessing liquidity positions ¾ up to one month ¾ More than one month and up to three months ¾ More than three months and up to one year
• Residual maturity is used to determine the time
horizon.
Other Reporting and Dissemination
Considerations : • Currency:
Currency same as used to disseminate data on official reserves.
• Reference Date: End date of reporting period. (Usually month end) ¾ Positions are the outstanding stocks. ¾ Flows are anticipated amount within the reference period. ¾ Transaction dates are used for determining time of recording.
• Sign Conventions: ¾ Plus (+) for assets and inflows ¾ Minus (-) for liabilities and outflows ¾ Items not applicable are left blank
Slide 17 Slide 18
Other Reporting and Dissemination Considerations
• Country Notes to Disclose Information:
¾ Country-specific exchange rate arrangements ¾ Specific reserve management policies ¾ Accounting Practices ¾ Statistical treatment of some financial transactions
• SBP data template is disseminated on its website
http://www.sbp.org.pk/ecodata/liquidity.pdf
• Monthly frequency of dissemination
• More details on data template standards at IMF: http://www.imf.org/external/np/sta/ir/index.htm
Major Sources of Data • Accounts Department, SBP • SBP Banking Services Corporation Bank • Exchange Policy Department, SBP • Exchange and Debt Management
Department, SBP
2nd Users -Producers Workshop on Col laborat ion among Data Compi lers & Users
32
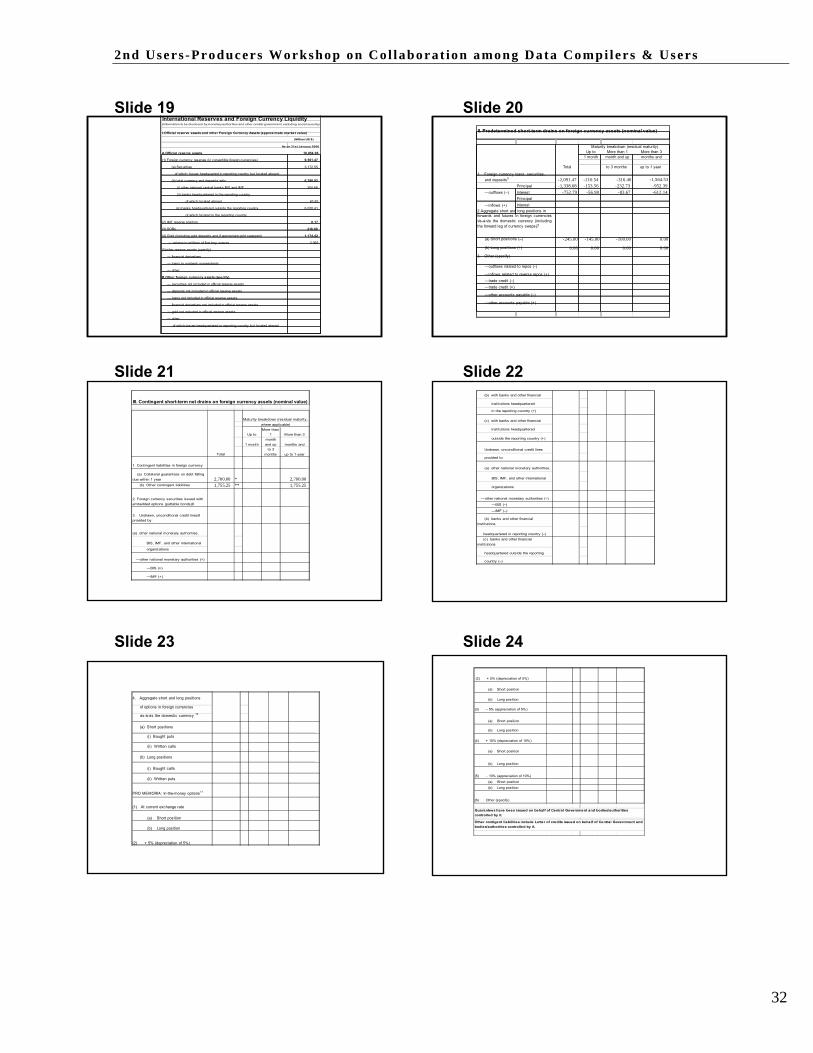
Slide 19 Slide 20 International Reserv es and Foreign Currency Liquidity (Inform ation to be dis clos ed by m onetary authorities and other central governm ent, excluding s ocial s ecurity)
I.Official reserve assets and other Foreign Currency Assets (approximate market value)
(Million US $)
As on 31st January 2006
A.Official reserve assets 10,954.06
(1) Foreign currency reserves (in convertible foreign currencies) 9,561.47
II. Predetermined short-term drains on foreign currency assets (nominal value)
Maturity breakdown (residual maturity)
Up to More than 1 More than 3 1 month month and up months and
(a) Securities 3,172.55
of which: Issuer headquarted in reporting country but located aboard. 1. Foreign currency loans, securities,
Total to 3 months up to 1 year
(b) total currency and deposits with: 6,388.92 and deposits6 -2,091.47 -210.54 -316.40 -1,564.53
(i) other national central banks,BIS and IMF 304.69
(ii) banks headquartered in the reporting country
of which:located abroad 63.82
(iii) banks headquartered outside the reporting country 6,020.41
—outflows (–)
—inflows (+)
Principal -1,338.68 -153.56 -232.73 -952.39 Interest -752.79 -56.98 -83.67 -612.14 Principal Interest
of which:located in the reporting country
(2) IMF reserve position 0.17
(3) SDRs 218.00
(4) Gold (including gold deposits and,if appropriate,gold swapped) 1,174.42
— volume in millions of fine troy ounces 2.065
(5)other reserve assets (specify)
— financial derivatives
— loans to nonbank nonresidents
— other
B.Other foreign currency assets (specify)
— securities not included in official reserve assets
— deposits not included in official reserve assets
— loans not included in official reserve assets
— financial derivatives not included in official reserve assets
— gold not included in official reserve assets
— other
of which:issuer headquartered in reporting country but located abroad
2.Aggregate short and long positions in forwards and futures in foreign currencies vis-à-vis the domestic currency (including the forward leg of currency swaps)7
(a) Short positions (–)
(b) Long positions (+)
3. Other (specify)
—outflows related to repos (–)
—inflows related to reverse repos (+) —trade credit (–) —trade credit (+)
—other accounts payable (–)
—other accounts payable (+)
-245.00 -145.00 -100.00 0.00
0.00 0.00 0.00 0.00
Slide 21 Slide 22
III. Contingent short-term net drains on foreign currency assets (nominal value)
Maturity breakdown (residual maturity,
where applicable) More than
(b) with banks and other financial
institutions headquartered
in the reporting country (+)
(c) with banks and other financial
institutions headquartered Up to 1 More than 3
month outside the reporting country (+)
1. Contingent liabilities in foreign currency
(a) Collateral guarantees on debt falling
Total
1 month and up months and to 3
months up to 1 year Undrawn, unconditional credit lines
provided to:
(a) other national monetary authorities,
due within 1 year 2,700.00 * 2,700.00 (b) Other contingent liabilities 1,755.25 ** 1,755.25
2. Foreign currency securities issued with embedded options (puttable bonds)8
3. Undrawn, unconditional credit lines9 provided by:
(a) other national monetary authorities,
BIS, IMF, and other international
organizations
—other national monetary authorities (+)
—BIS (+)
—IMF (+)
BIS, IMF, and other international
organizations
—other national monetary authorities (–)
—BIS (–)
—IMF (–)
(b) banks and other financial institutions
headquartered in reporting country (–) (c) banks and other financial
institutions
headquartered outside the reporting
country (–)
Slide 23 Slide 24
(2) + 5% (depreciation of 5%)
4. Aggregate short and long positions
of options in foreign currencies
vis-à-vis the domestic currency 10
(a) Short positions
(i) Bought puts
(ii) Written calls
(b) Long positions
(i) Bought calls
(ii) Written puts
PRO MEMORIA: In-the-money options11
(1) At current exchange rate
(a) Short position
(b) Long position
(2) + 5% (depreciation of 5%)
(a) Short position
(b) Long position
(3) – 5% (appreciation of 5%)
(a) Short position
(b) Long position
(4) + 10% (depreciation of 10%)
(a) Short position
(b) Long position
(5) – 10% (appreciation of 10%)
(a) Short position
(b) Long position
(6) Other (specify)
Gua ra ntee s ha ve be en issue d on behalf of Centra l Gove rnment and bodies/authoritie s controlle d by it.
Othe r contigent liabilitie s include Lette r of cre dits issued on behalf of Ce ntral Government and bodies/a uthorities controlle d by it.

2nd Users -Producers Workshop on Col laborat ion among Data Compi lers & Users
33
Slide 25 Slide 26
IV. Memo items
(1) To be reported with standard periodicity and timeliness: 12
(a) short-term domestic currency debt indexed to the exchange rate (b) financial instruments denominated in foreign currency and settled by other
means (e.g., in domestic currency) 13
—nondeliverable forwards —short positions —long positions
—other instruments
(c) pledged assets 14
—included in reserve assets —included in other foreign currency assets
(d) securities lent and on repo 15
—lent or repoed and included in Section I —lent or repoed but not included in Section I —borrowed or acquired and included in Section I —borrowed or acquired but not included in Section I
(e) financial derivative assets (net, marked to market) 16
(-) 245.00 —forwards (-) 35.00 —futures —swaps (-) 210.00 —options —other
(f) derivatives (forward, futures, or options contracts) that have a residual maturity greater than one year, which are subject to margin calls. —aggregate short and long positions in forwards and futures in foreign
leg of currency swaps) (a) short positions (–) (b) long positions (+)
—aggregate short and long positions of options in foreign currencies vis-à-vis the domestic currency
(a) short positions (i) bought puts (ii) written calls
(b) long positions (i) bought calls (ii) written puts
(2) To be disclosed less frequently: (a) currency composition of reserves (by groups of currencies)
—currencies in SDR basket 10,908.24 —currencies not in SDR basket 45.82 —by individual currencies (optional)
Slide 27
THANK YOU
2nd Users -Producers Workshop on Col laborat ion among Data Compi lers & Users
34
4
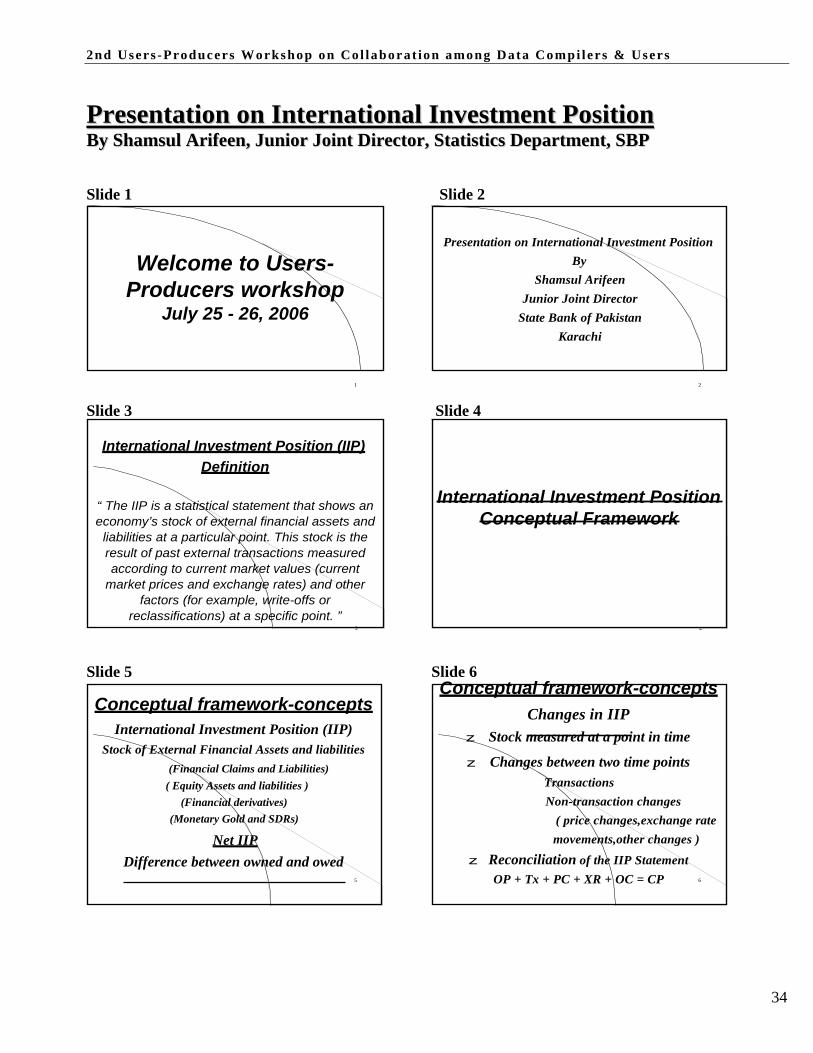
PPrreesseennttaattiioonn oonn IInntteerrnnaattiioonnaall IInnvveessttmmeenntt PPoossiittiioonn BByy SShhaammssuull AArriiffeeeenn,, JJuunniioorr JJooiinntt DDiirreeccttoorr,, SSttaattiissttiiccss DDeeppaarrttmmeenntt,, SSBBPP Slide 1 Slide 2
Welcome to Users- Producers workshop
July 25 - 26, 2006
Presentation on International Investment Position By
Shamsul Arifeen Junior Joint Director
State Bank of Pakistan Karachi
1 2
Slide 3 Slide 4
International Investment Position (IIP) Definition
“ The IIP is a statistical statement that shows an economy’s stock of external financial assets and
liabilities at a particular point. This stock is the result of past external transactions measured according to current market values (current
market prices and exchange rates) and other factors (for example, write-offs or
reclassifications) at a specific point. ”
International Investment Position
Conceptual Framework
3 Slide 5 Slide 6 Conceptual framework-concepts
International Investment Position (IIP) Stock of External Financial Assets and liabilities
(Financial Claims and Liabilities) ( Equity Assets and liabilities )
(Financial derivatives) (Monetary Gold and SDRs)
Net IIP Difference between owned and owed
Conceptual framework-concepts
Changes in IIP z Stock measured at a point in time
z Changes between two time points Transactions Non-transaction changes
( price changes,exchange rate movements,other changes )
z Reconciliation of the IIP Statement 5 OP + Tx + PC + XR + OC = CP 6
2nd Users -Producers Workshop on Col laborat ion among Data Compi lers & Users
35
Slide 7 Slide 8
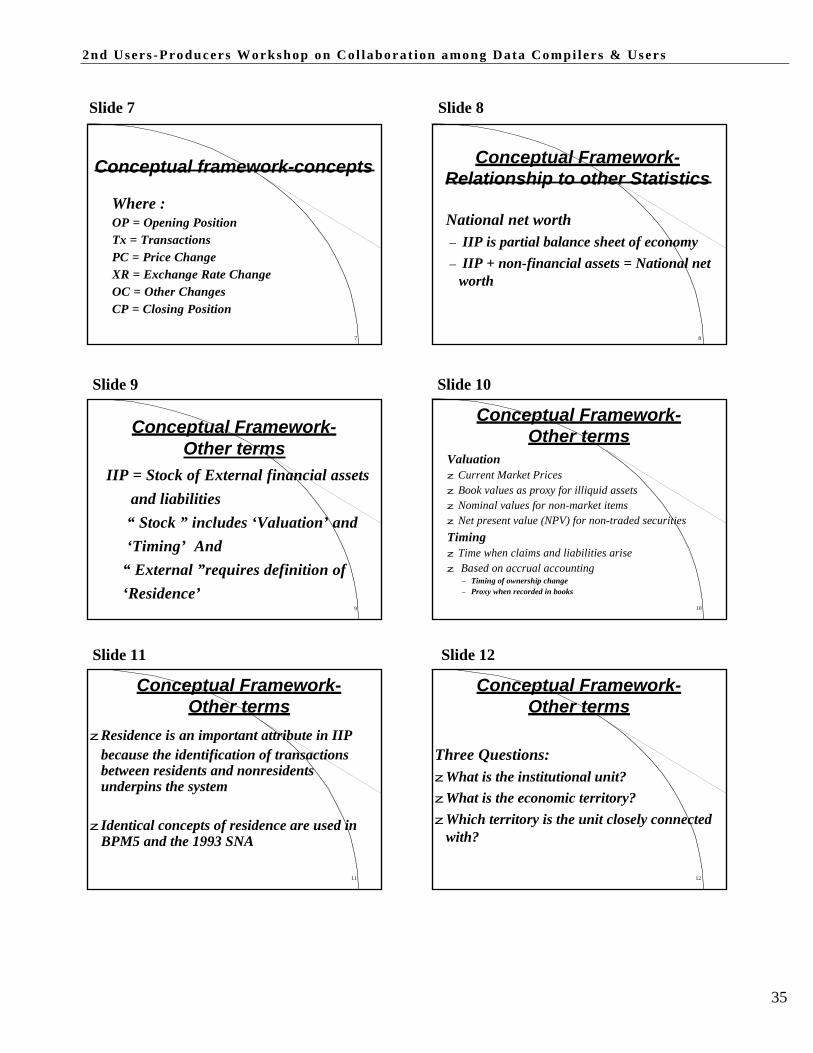
Conceptual framework-concepts
Where : OP = Opening Position Tx = Transactions PC = Price Change XR = Exchange Rate Change OC = Other Changes CP = Closing Position
Conceptual Framework- Relationship to other Statistics National net worth – IIP is partial balance sheet of economy – IIP + non-financial assets = National net
worth
7 8
Slide 9 Slide 10
Conceptual Framework- Other terms
IIP = Stock of External financial assets and liabilities
“ Stock ” includes ‘Valuation’ and ‘Timing’ And
“ External ”requires definition of ‘Residence’
9
Conceptual Framework- Other terms
Valuation z Current Market Prices z Book values as proxy for illiquid assets z Nominal values for non-market items z Net present value (NPV) for non-traded securities Timing z Time when claims and liabilities arise z Based on accrual accounting
– Timing of ownership change – Proxy when recorded in books
10
Slide 11 Slide 12
Conceptual Framework- Other terms
z Residence is an important attribute in IIP
because the identification of transactions between residents and nonresidents underpins the system
z Identical concepts of residence are used in
BPM5 and the 1993 SNA
Conceptual Framework- Other terms
Three Questions: z What is the institutional unit? z What is the economic territory? z Which territory is the unit closely connected
with?
11 12

2nd Users -Producers Workshop on Col laborat ion among Data Compi lers & Users
36
13
Slide 13 Slide 14
Conceptual Framework- Other terms
The residents of an economy comprise the following types of institutional units: 1. Households
z Includes the individuals who make up a household 2. Enterprises
z Financial and non-financial corporations z Unincorporated businesses
3. Non profit institutions serving the households 4. Government
Conceptual Framework- Other terms
The economic territory of a country is the relevant geographical area to which the concept of residence is applied. z A geographic territory administrated by a
Govt.within this,persons,goods,and capital circulate freely.
z Free trade zones z Usually a country, but not necessarily
– Economic and monetary unions – International organizations like IMF and UN 14
Slide 15 Slide 16
Conceptual Framework- Other terms
Concepts of residence: z Economic connection of a unit to an economic
territory – Not based on nationality or legal criteria – Not based on currency used
z Expressed as a economic unit’s Center of economic interest
Conceptual Framework- Other terms
Center of economic interest z Dwelling,place of production, or other
premises,within the economic territory of the country on,or from,which the unit engages,or intends to engage,in economic activities and transactions on a significant scale,for an indefinite or long period
15 16
Slide 17 Slide 18
Conceptual Framework- Other terms
z Households and Individuals – The BPM5 guidelines to be used for determining
residence: “ The presence or the intention to be present for a period
of one year or more” z Exceptions
– Diplomatic representatives – Member of the armed forces – Students – Medical patients
Conceptual Framework- Other terms
z Enterprises – An enterprise has a center of economic interest
and is a resident unit of a territory when the unit is engaged in a significant amount of production and plans to do so over an indefinite or long period of time.
– One year guideline by BPM5
– Crew members 17 18
2nd Users -Producers Workshop on Col laborat ion among Data Compi lers & Users
37
Slide 19 Slide 20
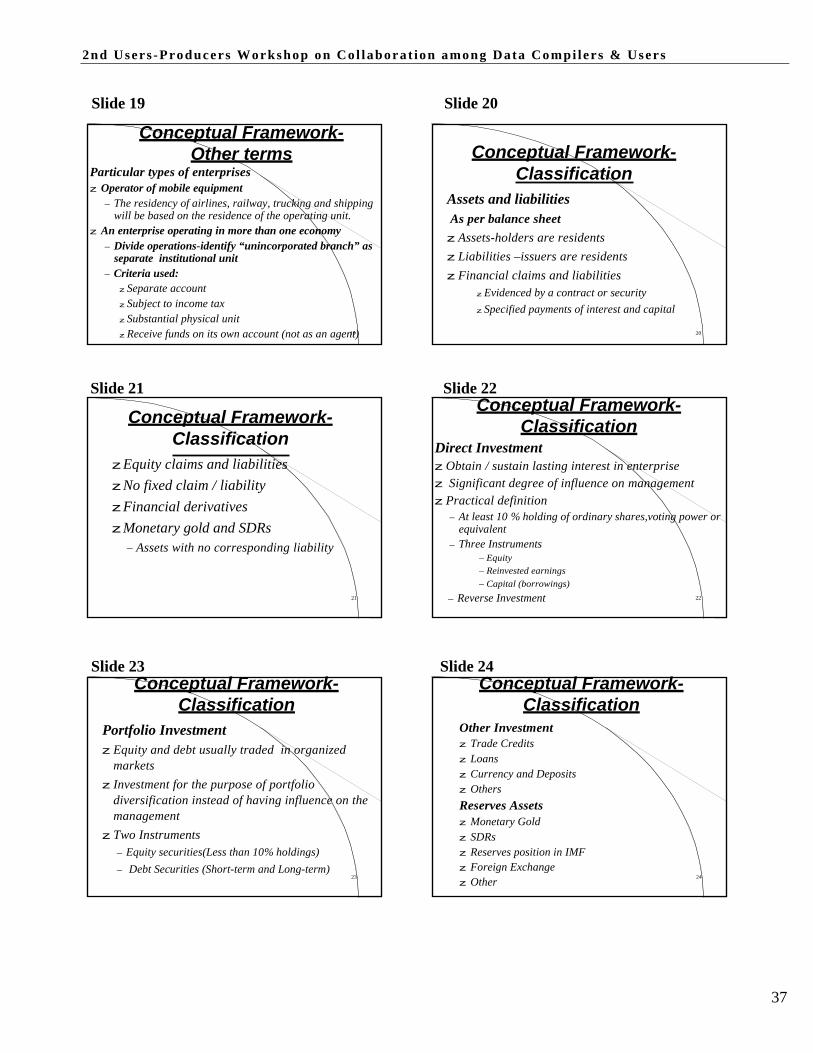
Conceptual Framework- Other terms
Particular types of enterprises z Operator of mobile equipment
– The residency of airlines, railway, trucking and shipping will be based on the residence of the operating unit.
z An enterprise operating in more than one economy – Divide operations-identify “unincorporated branch” as
separate institutional unit – Criteria used:
z Separate account z Subject to income tax z Substantial physical unit
Conceptual Framework-
Classification Assets and liabilities As per balance sheet z Assets-holders are residents z Liabilities –issuers are residents z Financial claims and liabilities
z Evidenced by a contract or security z Specified payments of interest and capital
z Receive funds on its own account (not as an agen1t9) 20
Slide 21 Slide 22
Conceptual Framework- Classification
z Equity claims and liabilities z No fixed claim / liability z Financial derivatives z Monetary gold and SDRs
– Assets with no corresponding liability
Conceptual Framework- Classification
Direct Investment z Obtain / sustain lasting interest in enterprise z Significant degree of influence on management z Practical definition
– At least 10 % holding of ordinary shares,voting power or equivalent
– Three Instruments – Equity – Reinvested earnings – Capital (borrowings)
21 – Reverse Investment 22
Slide 23 Slide 24
Conceptual Framework- Classification
Portfolio Investment z Equity and debt usually traded in organized
markets z Investment for the purpose of portfolio
diversification instead of having influence on the management
z Two Instruments – Equity securities(Less than 10% holdings) – Debt Securities (Short-term and Long-term)
23
Conceptual Framework- Classification
Other Investment z Trade Credits z Loans z Currency and Deposits z Others Reserves Assets z Monetary Gold z SDRs z Reserves position in IMF z Foreign Exchange
24 z Other

2nd Users -Producers Workshop on Col laborat ion among Data Compi lers & Users
38
Slide 25 Slide 26
Summary - International Investment Position
25
Data sources - IIP Domestic Statistical Sources: z Banks' External Assets and Liabilities z Monetary Authorities’ External Assets and
Liabilities z General Government External Debt z Other sector Domestic Non-statistical Sources z Financial Statement z Foreign Investment Approval z Financial Press
26
Slide 27
Thank You
27

2nd Users -Producers Workshop on Col laborat ion among Data Compi lers & Users
39
PPrreesseennttaattiioonn oonn FFoorreeiiggnn TTrraaddee SSttaattiissttiiccss ooff PPaakkiissttaann BByy MMrr.. KKhhaalliidd SSiiddddiiqquuii,, DDiirreeccttoorr,, FFeeddeerraall BBuurreeaauu ooff SSttaattiissttiiccss Slide 1 Slide 2
USER PRODUCERS WORKSHOP
Presentation on Foreign Trade Statistics
of
Pakistan
By
KHALID SIDDIQUI Director
Federal Bureau of Statistics Government of Pakistan
I- INTRODUCTION:
No country in today’s world can afford to remain in isolation. Countries have to import commodities from abroad which are either not produced in the country or are in short supply and also those which accrue some other benefits from their imports, commodities which are in surplus in the country are exported. Even if there are no surpluses, exports have to be made to pay off for the imports, which are essential for economic development of the country. Owing to competition, a country can obtain optimum advantage from its buying and selling in the world only through having adequate knowledge of trade data. Foreign Trade Statistics are also indispensable for planning of economic development, framing commercial policies, conducting trade negotiations, making bilateral, regional and international arrangements for promotion of trade.
Slide 3 Slide 4
II- HISTORICAL BACKGROUND: III- METHODOLOGY
Foreign Trade Statistics of Pakistan is being compiled regularly since 1947. Initially from 1947 to 1950 the ‘Department of Commercial Intelligence and Statistics’ of the Ministry of Commerce undertook the work of recording the trade statistics. The work of trade statistics compilation was taken over by Federal Bureau of Statistics (then Central Statistics Office) in September, 1950. In the beginning it continued to compile few series on trade statistics manually on the basis of weekly/monthly returns of imports and exports supplied by the land, sea and air customs. With the passage of time, improvements in the system of recording of trade statistics have been made gradually. A scheme for codification of trade information was introduced in early, 1952 and trade data were processed in the ‘Bureau of British tabulation unit’ and later strengthened on new IMB system in 1954, It further developed by installation of IBM Computer 260-30 by establishing a ‘Data Processing Centre’ in FBS in the 1969 and trade statistics was processed from July, 1970. The trade statistics is now being processed on Compaq Alpha Server DS20E System by ‘Data Processing Centre’ to meet the growing requirements of different users of trade statistics.
Pakistan is using methodology/guidelines contained in the U.N.Statistics Division (UNSD) manual for compilation of “International Trade Statistics, concepts and definitions in ESCAP region” which was finalized in January, 1983. Changes made by the UNSD have been taken into consideration from time to time and amendments are made in the compilation of Pakistan Foreign Trade Statistics, accordingly hence, FBS figures are recorded at the time of movement of goods into or from Pakistan’s Custom boundary.
Slide 5 Slide 6
IV- COVERAGE
a) Basic source of information: b) Harmonized Coding of Trade Data:
1 Bills of entry in case of imports and shipping bills in case of exports, which
have been modified/revised and named as “Goods Declaration” (GD) were the basic documents used in compilation of foreign trade statistics. The importers/exporters or their agents have to submit to the customs authorities ‘Goods Declaration’ (GD) for each consignment of imports or exports made by them along with copies of invoices for necessary clearance. One copy of each of these documents is being collected by the staff of FBS from each and every sea, air and land custom stations/points in the country except from Karachi Port, from where the FBS is getting G.Ds data from ‘CARE’ in computer readable form. G.Ds pertaining to IMPORT are controlled by cash number (Fresh Serial No. starts from 1st of each month) and in EXPORT by machine number (Fresh Serial No. starts from the day, when the National Budget is announced).
2. From July, 1989 to June, 2002, ‘Pakistan Statistical Trade
Classification Revision-3 (PSTC-R-3)’ was being used for compilation and dissemination of external trade statistics. In pursuance of the recommendation of United Nations Statistical Division (UNSD) for adoption of “Harmonized Commodity Description and Coding System” (HS) for compilation and dissemination of external trade statistics, the F.B.S started compilation of trade statistics through customs records on “Harmonized System” (HS) from July,2002.
3. The formation of ‘Harmonized Commodity Description and Coding
System’ (HS) and Pakistan Standard Trade Classification Revision-3 (PSTC R-3) are as under:

2nd Users -Producers Workshop on Col laborat ion among Data Compi lers & Users
40
Slide 7 Slide 8
a) HS CODING SYSTEM HS Code at 2-digit level i.e. 01-97 represents “Chapters”.
Example:
Chapter 08 ‘Edible fruits & Nuts; (Peels of Citrus fruits and melons)
HS Code at 4-digit level represents “Heading Numbers”.
Example:
0804 – Dates, figs, pineapples & guavas. (Mangoes & mangoes teens fresh or dried)
HS Code at 6-digit level represents “Sub-Heading Numbers”.
Example: 0804.10 - Dates
HS Code at 8-digit level represents “National Sub-Heading Numbers”.
Example:
0804.1010 – Dates fresh
0804.1020 – Dates Dried
b) PSTC-R-3 Coding System PSTC-R-3 Code at 1 digit level 0-9 represents “Sections” Example:
Section 4 – Animal & Vegetable oils, fats & waxes. i) PSTC-R-3 Code at 2 digit level represents “Division Code Example:
Division 41 – Animal oil and fats. ii) PSTC-R-3 Code at 3 digit level represents “Group Code” Example:
411 - Animal oil and fats. = Group Code iii) PSTC-R-3 Code at 4 digit level represents “Sub-Group Code” Example:
4111 – fats and oils and their fractions of fish or marine mammals, whether or not refined, but not chemically modified = Sub Group Code. PSTC-R-3 Code at 5 digit level represents “Item Code” Example:
41111 – fish liver oil and their fractions = Item Code iv)PSTC-R-3 Code at 7 digit level represents “Sub-Item Code” Example:
4111101 – Cod liver oil = Sub Item Code. Slide 9 Slide 10
c) COMPILATION CRITERIA/COVERAGE:
4. Complete coverage is of utmost importance in compilation of foreign trade
statistics. Imports Statistics, include all merchandise coming from foreign countries into Pakistan through lawful channels under private and government accounts via sea, air land routes and by parcel post released by the customs either directly or form the bonds. Goods imported and deposited into bonds are not taken into account. Supplies and bunker fuels to ships are included in exports according to the colour of the ships. Imported goods subsequently re-exported to foreign countries without further modification are excluded from export statistics, lists are tabulated separately. Goods exported and returned to Pakistan by the importing countries without any modification or change in the original form or shape are considered re-imported and excluded from imports but tabulated separately.
d) EXPORTS/IMPORTS:
5. The following transactions of exports & imports are excluded from foreign trade statistics while compilation:
i) Articles of baggage and personal effects of passengers.
ii) Afghanistan Trade in transit through Pakistan
iii) Imports into bonds.
iv) Sale of imported goods in Duty Free Shops in Pakistan.
v) Defence Stores (If commercial value is declared on GD then the value will be included)
vi) Gold and Silver coins or Bullion and Currency Notes.
vii) Relief goods of no commercial value
Slide 11 Slide 12
e). PROCESSING OF TRADE DATA
6. Getting the G.Ds from all the customs collectorates, all over Pakistan. Transcribing them on transcription sheets and Capturing the data from these sheets. Producing the error listing and after fixing the error in the data, preparing the following reports from error free data.
i) Country by commodity. ii) Commodity by country
iii) By area and region (Direction of Trade) iv) By Economic Categories. v) By commodity group.
vi) Export by land and air. vii) Major items of imports & exports in terms of Rupees, and US
Dollars.
f) BASIS OF VALUATION:
IMPORTS: Imports are compiled on the basis of cost, insurance and freight (C.I.F) and import duty not included.
EXPORTS: Exports are compiled on the basis of free on board (F.O.B) and freight & insurance not included.
g) FOREIGN TRADE INDICES:
Foreign trade indices are being computed from the very beginning. Such indices were first computed with 1954-55 base. However, changes have been taking place from time to time in the composition and direction of trade, the base year of these indices have subsequently been changed to 1960-61, 1969-70, 1975-76 and 1980-81. As per decision of National Accounts Committee that the base of all economic indicators be shifted from 1980-81 to 1990-91, because of changes that took place during intervening period, accordingly new series of trade indices of quantum and unit values of exports, imports and terms of trade 1990-91 as base, are being computed since July,1991 on quarterly/annually basis.
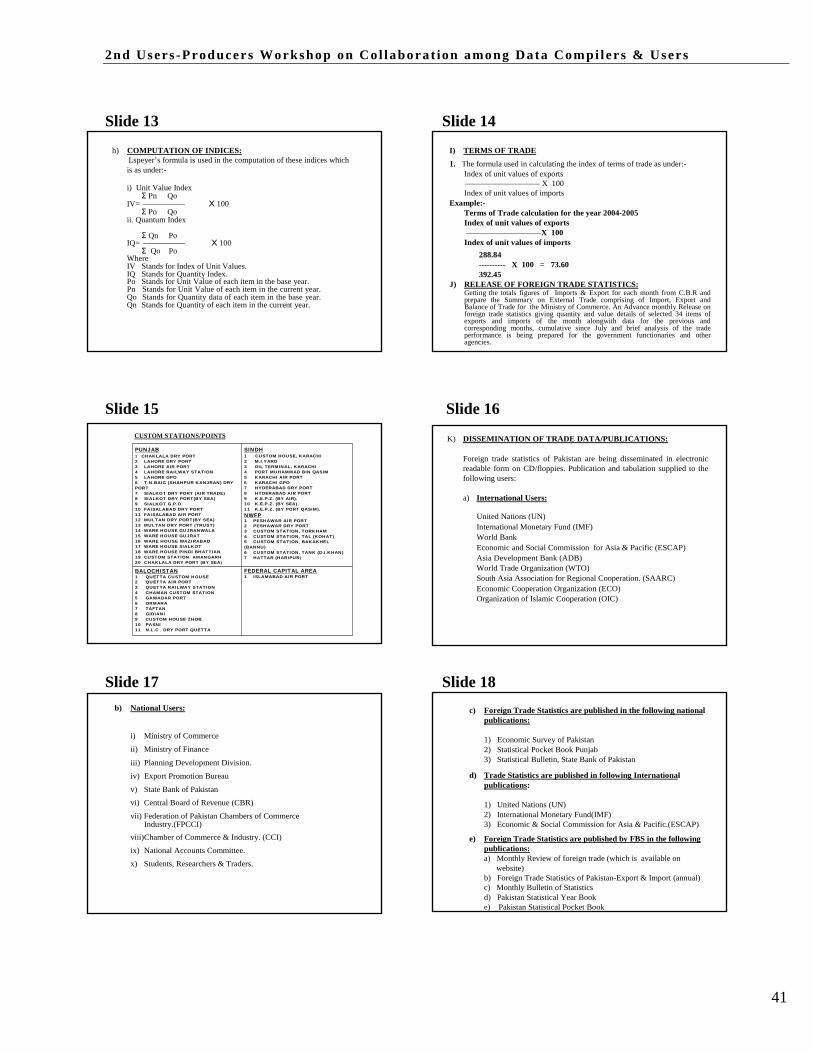
2nd Users -Producers Workshop on Col laborat ion among Data Compi lers & Users
41
Slide 13 Slide 14
h) COMPUTATION OF INDICES: Lspeyer’s formula is used in the computation of these indices which is as under:-
i) Unit Value Index
Σ Pn Qo IV= Χ 100
Σ Po Qo ii. Quantum Index
Σ Qn Po
IQ= Χ 100 Σ Qo Po
Where IV Stands for Index of Unit Values. IQ Stands for Quantity Index. Po Stands for Unit Value of each item in the base year. Pn Stands for Unit Value of each item in the current year. Qo Stands for Quantity data of each item in the base year. Qn Stands for Quantity of each item in the current year.
I) TERMS OF TRADE
1. The formula used in calculating the index of terms of trade as under:- Index of unit values of exports X 100 Index of unit values of imports
Example:- Terms of Trade calculation for the year 2004-2005 Index of unit values of exports X 100
Index of unit values of imports 288.84 ---------- X 100 = 73.60 392.45
J) RELEASE OF FOREIGN TRADE STATISTICS: Getting the totals figures of Imports & Export for each month from C.B.R and prepare the Summary on External Trade comprising of Import, Export and Balance of Trade for the Ministry of Commerce. An Advance monthly Release on foreign trade statistics giving quantity and value details of selected 34 items of exports and imports of the month alongwith data for the previous and corresponding months, cumulative since July and brief analysis of the trade performance is being prepared for the government functionaries and other agencies.
Slide 15 Slide 16
CUSTOM STATIONS/POINTS
PUNJAB 1 CHAKLALA DRY PORT 2 LAHORE DRY PORT 3 LAHORE AIR PORT 4 LAHORE RAILWAY STATION 5 LAHORE GPO 6 T.N.BAIG (SHAHPUR KANJRAN) DRY PORT 7 SIALKOT DRY PORT (AIR TRADE) 8 SIALKOT DRY PORT(BY SEA) 9 SIALKOT G.P.O. 10 FAISALABAD DRY PORT 11 FAISALABAD AIR PORT 12 MULTAN DRY PORT(BY SEA) 13 MULTAN DRY PORT (TRUST) 14 WARE HOUSE GUJRANWALA 15 WARE HOUSE GUJRAT 16 WARE HOUSE WAZIRABAD 17 WARE HOUSE SIALKOT 18 WARE HOUSE PINDI BHATTIAN 19 CUSTOM STATION AMANGARH 20 CHAKLALA DRY PORT (BY SEA)
BALOCHISTAN 1 QUETTA CUSTOM HOUSE 2 QUETTA AIR PORT 3 QUETTA RAILWAY STATION 4 CHAMAN CUSTOM STATION 5 GAWADAR PORT 6 ORMARA 7 TAFTAN 8 GIDIANI 9 CUSTOM HOUSE ZHOB 10 PASNI 11 N.L.C . DRY PORT QUETTA
SINDH 1 CUSTOM HOUSE, KARACHI 2 M.I.YARD 3 OIL TERMINAL, KARACHI 4 PORT MUHAMMAD BIN QASIM 5 KARACHI AIR PORT 6 KARACHI GPO 7 HYDERABAD DRY PORT 8 HYDERABAD AIR PORT 9 K.E.P.Z. (BY AIR). 10 K.E.P.Z. (BY SEA). 11 K.E.P.Z. (BY PORT QASIM). NWFP 1 PESHAWAR AIR PORT 2 PESHAWAR DRY PORT 3 CUSTOM STATION, TORKHAM 4 CUSTOM STATION, TAL (KOHAT) 5 CUSTOM STATION, BAKAKHEL (BANNU) 6 CUSTOM STATION, TANK (D.I.KHAN) 7 HATTAR (HARIPUR)
FEDERAL CAPITAL AREA 1 ISLAMABAD AIR PORT
K) DISSEMINATION OF TRADE DATA/PUBLICATIONS:
Foreign trade statistics of Pakistan are being disseminated in electronic readable form on CD/floppies. Publication and tabulation supplied to the following users:
a) International Users:
United Nations (UN) International Monetary Fund (IMF) World Bank Economic and Social Commission for Asia & Pacific (ESCAP) Asia Development Bank (ADB) World Trade Organization (WTO) South Asia Association for Regional Cooperation. (SAARC) Economic Cooperation Organization (ECO) Organization of Islamic Cooperation (OIC)
Slide 17 Slide 18
b) National Users:
i) Ministry of Commerce
ii) Ministry of Finance
iii) Planning Development Division.
iv) Export Promotion Bureau
v) State Bank of Pakistan
vi) Central Board of Revenue (CBR)
vii) Federation of Pakistan Chambers of Commerce Industry.(FPCCI)
viii)Chamber of Commerce & Industry. (CCI)
ix) National Accounts Committee.
x) Students, Researchers & Traders.
c) Foreign Trade Statistics are published in the following national publications:
1) Economic Survey of Pakistan 2) Statistical Pocket Book Punjab 3) Statistical Bulletin, State Bank of Pakistan
d) Trade Statistics are published in following International publications:
1) United Nations (UN) 2) International Monetary Fund(IMF) 3) Economic & Social Commission for Asia & Pacific.(ESCAP)
e) Foreign Trade Statistics are published by FBS in the following publications: a) Monthly Review of foreign trade (which is available on
website) b) Foreign Trade Statistics of Pakistan-Export & Import (annual) c) Monthly Bulletin of Statistics d) Pakistan Statistical Year Book e) Pakistan Statistical Pocket Book

2nd Users -Producers Workshop on Col laborat ion among Data Compi lers & Users
42
PPrreesseennttaattiioonn oonn EExxtteerrnnaall DDeebbtt DDaattaa CCoommppiillaattiioonn BByy MMaalliikk MMuuhhaammmmaadd AAffaaqq,, AAssssiissttaanntt CChhiieeff,, EEccoonnoommiicc AAffffaaiirrss DDiivviissiioonn Slide 1 Slide 2
EXTERNAL DEBT DATA COMPILATION
MALIK MUHAMMAD AFAQ (ASSITANT CHIEF)
ECONOMIC AFFAIRS DIVISION
EXTERNAL DEBT External debt, at any given time, is the
outstanding amount of those actual current, and not contingent, liabilities that require payment(s) of principal and/or interest by the debtor at some point(s) in the future and that are owed to nonresidents by residents of an economy.
Slide 3 Slide 4
EXTERNAL DEBT DATA DISSEMINATION AND USES
CLASSIFICATION OF
EXTERNAL DEBT ACCOUNTING NEEDS •Disbursement
•Debt servicing
STATISTICAL COMPILATIONS •Balance of Payments
•National Accounts
MACROECONOMIC POLICY
•Sustainable Levels
•Fiscal & Monetary Policy
EXTERNAL DEBT DATA
GENERAL PUBLIC INFORMATION
•Status Report
•Economic Survey
• SBP Publications
DEBT MANAGEMENT
Maturity Debtors
Creditors
Slide 5 Slide 6
MATURITY CREDITORS
Short Term Official IMF Private Credit
Medium & Long Term
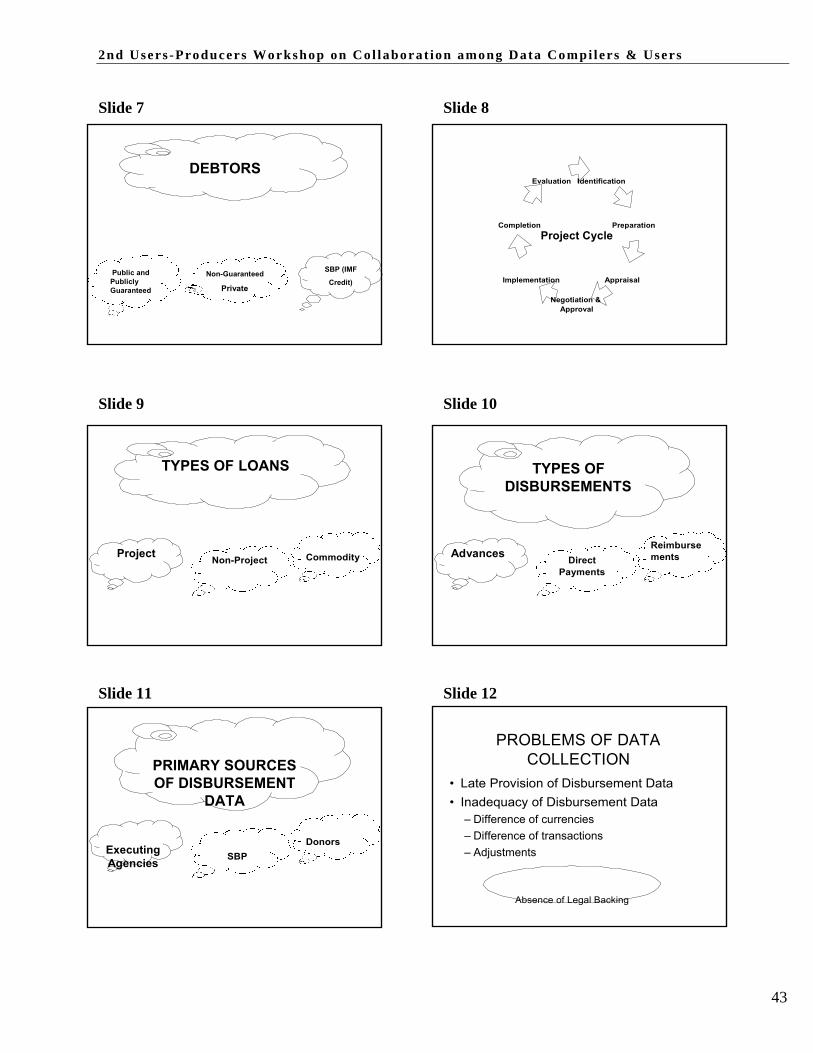
2nd Users -Producers Workshop on Col laborat ion among Data Compi lers & Users
43
Slide 7 Slide 8
DEBTORS Evaluation Identification
Completion Preparation Project Cycle
Public and Publicly Guaranteed
Non-Guaranteed
Private
SBP (IMF
Credit) Implementation
Negotiation & Approval
Appraisal
Slide 9 Slide 10
TYPES OF LOANS TYPES OF DISBURSEMENTS
Project Non-Project
Commodity Advances
Direct Payments
Reimburse ments
Slide 11 Slide 12
PRIMARY SOURCES OF DISBURSEMENT
DATA
Donors
PROBLEMS OF DATA COLLECTION
• Late Provision of Disbursement Data • Inadequacy of Disbursement Data
– Difference of currencies – Difference of transactions
Executing Agencies SBP – Adjustments
Absence of Legal Backing
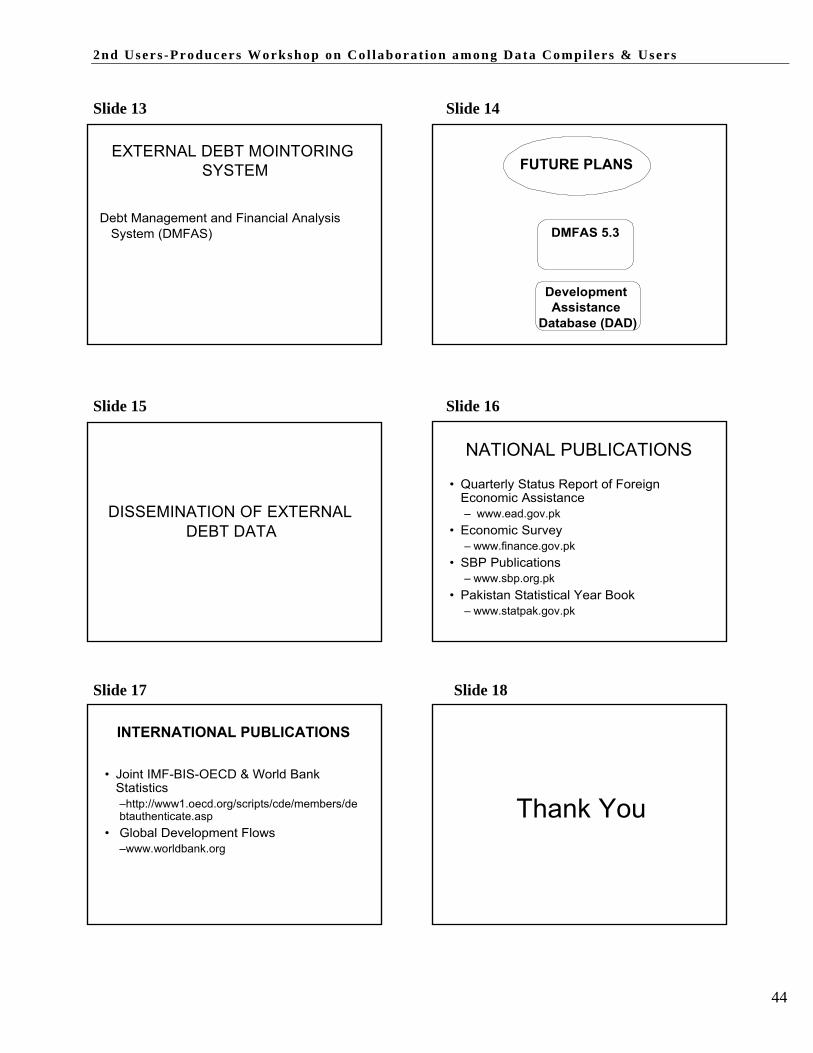
2nd Users -Producers Workshop on Col laborat ion among Data Compi lers & Users
44
Slide 13 Slide 14
EXTERNAL DEBT MOINTORING SYSTEM
Debt Management and Financial Analysis
System (DMFAS)
FUTURE PLANS
DMFAS 5.3
Development Assistance
Database (DAD) Slide 15 Slide 16
NATIONAL PUBLICATIONS
DISSEMINATION OF EXTERNAL DEBT DATA
• Quarterly Status Report of Foreign Economic Assistance – www.ead.gov.pk
• Economic Survey – www.finance.gov.pk
• SBP Publications – www.sbp.org.pk
• Pakistan Statistical Year Book – www.statpak.gov.pk
Slide 17 Slide 18
INTERNATIONAL PUBLICATIONS
• Joint IMF-BIS-OECD & World Bank Statistics –http://www1.oecd.org/scripts/cde/members/de btauthenticate.asp
• Global Development Flows –www.worldbank.org
Thank You
2nd Users -Producers Workshop on Co l laborat ion among Data Co mpi l er s & Users
45
TTeecchhnniiccaall SSeessssiioonn oonn SSoocciioo--ddeemmooggrraapphhiicc aanndd FFiinnaanncciiaall SSeeccttoorr
SSeessssiioonn SSuummmmaarryy
During the Socio-demographic Sector, Mr. Mehboob Sultan, Director, National Institute of
Population Studies (NIPS) and Mr. Ahsan-ul-Haq, Director, Pakistan Census Organisation
(PCO) made presentations on population statistics. On Financial Sector, Mr. Naseer Ahmed,
Joint Director, Statistics Department, made a presentation on Analytical Accounts of the Central
Bank and other Depository Corporation.
At the outset, Mr. Sultan, NIPS discussed the scope, coverage and periodicity of the statistics on
population compiled by National Institute of Population Studies. He discussed in detail the types
of data being collected and compiled by NIPS. Regarding collection of data, he said, all the
surveys are carried out on sample basis designed by the Federal Bureau of Statistics. Mr. Sultan
further elaborated that all questionnaires are pre-coded, carefully designed and tested. He briefed
about the characteristics of households and respondents. He also discussed the collection and
compilation procedures of population data on fertility, reproductive health, family planning,
infant, child health and mortality. He added that all the reports are discussed in the seminars
before their dissemination.
Mr. Saeed in his presentation on ‘Population Census’, discussed the scope, history and
importance of census undertaken by Pakistan Census Organisation. He pointed out that PCO, an
attached department of Statistics Division and is responsible is to organise and conduct
population and housing census in the country and disseminate its results in the form of reports,
generally at the district, provisional and national level. He further elaborated selection of topics,
census methodology, planning process, pre-census activities and enumeration activities. The data
collected through population census serves as bench mark for all types of socio-economic
development planning and evaluation. It provides basis for all administrative activities,
demographic research and various projections of population characteristics. Regarding the
census methodology, he explained two methods generally used for enumeration the canvasser
method and household method, canvasser method is being used for conducting census in
Pakistan.
2nd Users -Producers Workshop on Co l laborat ion among Data Co mpi l er s & Users
46
Mr. Naseer during his presentation on Analytical Accounts of the Central Bank and other
Depository Corporations outlined the scope, coverage, periodicity and compilation
methodologies of the analytical accounts of scheduled banks and the central bank. The analytical
accounts are the analytical presentation of monetary aggregates covering the balance sheet of the
central bank, deposit money institutions, and other deposit accepting institutions. Talking about
the compilation methodologies, he said, these are compiled according to the guideline of MFSM
2000. He described various components of assets and liabilities and their consolidation and
presentation covered in these accounts. He also discussed all the sectors/sub-sectors of the
economy. At the end of his presentation, he gave the plan for improvements in the existing
compilation methodologies.
Concluding the session, Dr. Naushin Mahmood of PIDE, Chairperson of the session, praised the
SBP for holding the useful workshop on the kind of data different organization and institutions
are compiling and producing. The workshop has provided an opportunity to uses on the basic
synergies between the two (data users and producers) and where do we stand at this point.

2nd Users -Producers Workshop on Col laborat ion among Data Compi lers & Users
47
PPrreesseennttaattiioonn oonn PPooppuullaattiioonn SSttaattiissttiiccss bbyy MMrr.. MMeehhbboooobb SSuullttaann,, NNIIPPSS
Slide 1 Slide 2
National Institute of Population Studies
Islamabad
Scope of Work Demographic and health surveys Evaluation of various components of Population Welfare Programme Population Projections Training
Slide 3 Slide 4
Coverage
Demographic and Health Surveys (National Level) Evaluation of FP Programme Components (National Level) Population Projections (National and Provincial levels) Training (Population programme personnel, Health programme & NGOs,
Periodicity
Demographic and Health Surveys – After every 3-4 years
Evaluative surveys/studies – On the request of MoPW
Population Projections – Periodic, on the request of Planning
Commission Training – Occasional but being made regular
Slide 5 Slide 6
Type of data collected
Characteristics of Households and Respondents
Household composition Age-sex composition of the household population Marital status Educational attainment Housing characteristics Possession of durable goods at HH level Exposure to mass media
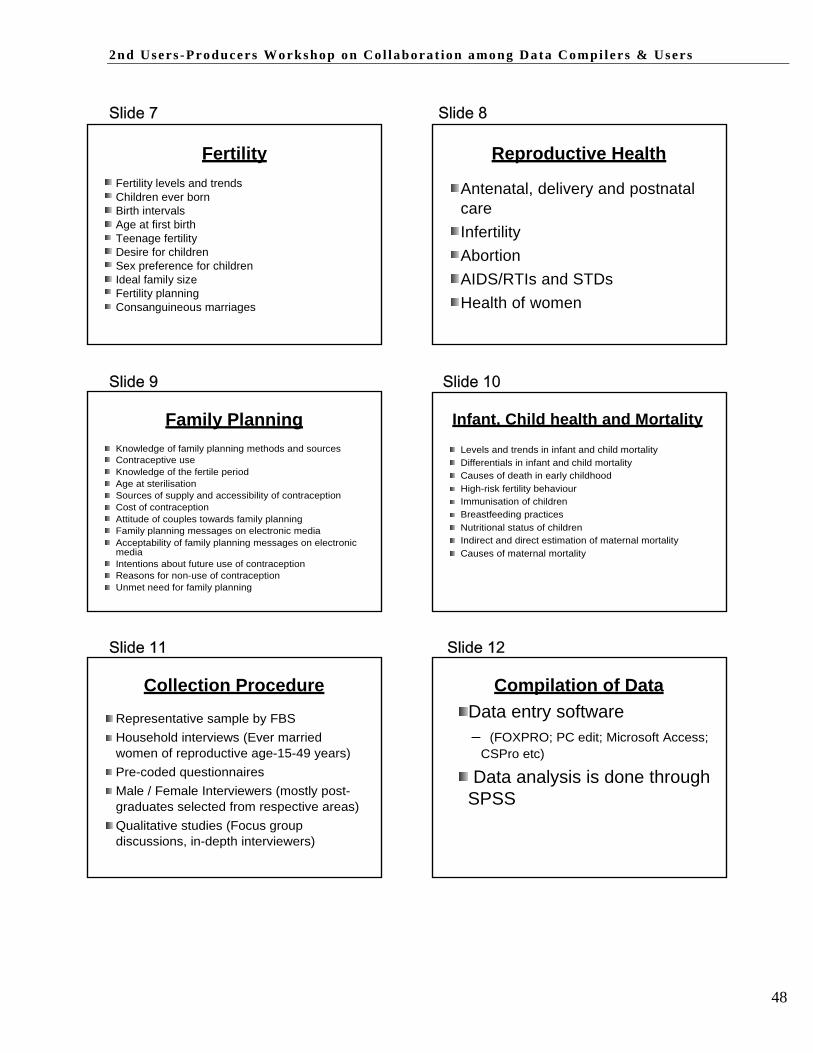
2nd Users -Producers Workshop on Col laborat ion among Data Compi lers & Users
48
Slide 7 Slide 8
Fertility
Fertility levels and trends Children ever born Birth intervals Age at first birth Teenage fertility Desire for children Sex preference for children Ideal family size Fertility planning Consanguineous marriages
Reproductive Health Antenatal, delivery and postnatal care Infertility Abortion AIDS/RTIs and STDs Health of women
Slide 9 Slide 10
Family Planning Infant, Child health and Mortality
Knowledge of family planning methods and sources Contraceptive use Knowledge of the fertile period Age at sterilisation Sources of supply and accessibility of contraception Cost of contraception Attitude of couples towards family planning Family planning messages on electronic media Acceptability of family planning messages on electronic media Intentions about future use of contraception Reasons for non-use of contraception Unmet need for family planning
Levels and trends in infant and child mortality Differentials in infant and child mortality Causes of death in early childhood High-risk fertility behaviour Immunisation of children Breastfeeding practices Nutritional status of children Indirect and direct estimation of maternal mortality Causes of maternal mortality
Slide 11 Slide 12
Collection Procedure Representative sample by FBS Household interviews (Ever married women of reproductive age-15-49 years) Pre-coded questionnaires Male / Female Interviewers (mostly post- graduates selected from respective areas) Qualitative studies (Focus group discussions, in-depth interviewers)
Compilation of Data Data entry software – (FOXPRO; PC edit; Microsoft Access;
CSPro etc)
Data analysis is done through SPSS

2nd Users -Producers Workshop on Col laborat ion among Data Compi lers & Users
49
Slide 13 Slide 14
Dissemination Process Dissemination Seminars Distribution of reports through mail Soft copies of data set on request

2nd Users -Producers Workshop on Col laborat ion among Data Compi lers & Users
50
PPrreesseennttaattiioonn oonn PPooppuullaattiioonn SSttaattiissttiiccss bbyy MMrr.. AAhhssaann--uull--HHaaqq,, PPCCOO Slide 1 Slide 2
POPULATION CENSUS
Population Census is the primary source of information on population size and its characteristics. The data collected through population census serves as bench mark for all types of socio-economic development planning and evaluation and provide basis for all administrative activities, demographic research and various projections of population characteristics.
Census taking is a universal practice and is undertaken in almost all countries of the world. Through population census a vast amount of data on all basic demographic and socio-economic variables is collected about each person living within country/territory. The main advantage of population census is the large amount of data it produces at one point of time and the availability of data at the lowest level.
z DEFINITION
Population census is total process of collecting, compiling, evaluating, analyzing and publishing / disseminating demographic, social and economic data of all persons in a country or a well defined territory, at a specified time.
Slide 3 Slide 4• CHARACTERISTICS OF CENSUS
i) Largeness to cover entire area / population I) AREA COVERED
SCOPE OF CENSUS
ii) Accuracy and reliability of information
iii) Time oriented activities
z ESSENTIAL FEATURES
i) INDIVIDUAL ENUMERATION-Implies that each individual is enumerated and his/her characteristics recorded separately
ii) UNIVERSALITY WITHIN A DEFINED TERRITORY-Census should cover the
entire country or well defined territory and include every person living therein
iii) SIMULTANEITY-Data collected should refer to the same well defined
reference period – generally the census day with specific time
iv) DEFINED PERIODICITY-Census should be taken at regular intervals so that comparable information is made available in a fixed sequence. A series of censuses makes it possible to appraise the past, describe the present and estimate the future
- Entire Area Of Pakistan including Tribal Areas (F A T A & P A T A) - AJK & Northern Areas covered on behalf of M/o Kashmir and Northern Affairs
II) POPULATION COVERED
- All persons living in above areas enumerated on de-jure and de-facto basis - Afghan refugees and special population groups living in camps / pockets
excluded - Foreign national living in Pakistan covered except diplomatic personnel
and their families - Seasonal migrants covered at place of residence on census date - Pakistanis living abroad not counted.
III) TOPICS OF INFORMATION COVERED
A) DEMOGRAPHIC & SOCIAL CHARACTERISTICS
- Age - Sex - Relationship to the head - Marital status - Religion - Mother tongue (language) - Nationality
Slide 5 Slide 6 B) EDUCATIONAL CHARACTERISTICS
- Literacy status - School attendance - Level of education completed - Field of education
C) GEOGRAPHICAL/MIGRATION CHARACTERISTICS
- Usual residence - District of birth - Duration of continues residence in district - District of previous residence - Reason of migration
D) ECONOMIC CHARACTERSTICS
- Type of activity - Occupation - Industry - Employment status - Reason of un-employment
E) FERTILITY MORTALITY - No. of children ever born alive by sex - No. of children still living by sex - No. of children born during last 12 months by sex - No. of children still living by sex F) MISELLENIOUS - Nature of disability if any - Immunization of children under 10 years of age - Holding of NI Card of persons 18 years plus

2nd Users -Producers Workshop on Col laborat ion among Data Compi lers & Users
51
Slide 7 Slide 8
CENSUS HISTORY IMPORTANCE OF CENSUS
(SOCIO-ECONOMIC
1. First regular census in the areas now comprising Pakistan was held in 1881.
2. Since then regular censuses have been conducted after every ten years in the year ending at one.
3. After independence five censuses have been undertaken in 1951, 1961, 1972, 1981 and 1998.
4. Fifth census due in 1991 could not be conducted as scheduled due to some administrative / political reasons but was undertaken in March, 1998.
¾ Provide bench mark data for all socio-economic development plans / policies and their evaluation
¾ Provide basis for all administrative activities, demographic
research and projection of population to meet future requirements.
¾ Provide population data for smallest Admn. Units / areas. ¾ Establish sampling frame for intercensal sample surveys on
various topics and others statistical programs ¾ Provide changing patterns of urban / rural concentrations and
development of urbanized areas.
Slide 9 Slide 10 IMPORTANCE OF CENSUS
(LEGAL / CONSTITUTIONAL) SELECTION OF TOPICS
¾ Census also meets legal and political requirement:
- Provides basis for political representation to the National Assembly under article 51 (3) of the constitution.
- Population base used for distribution of funds to the federating units by the National Finance Commission formed under article 160 (2) of the constitution.
- Determines quota for recruitment to all civil posts in Federal Government.
¾ Mainly depends upon needs of data users
(planners, administrators and researchers)
¾ Continuity of census information – Traditional topics
¾ Quality of data collected in previous census
¾ Availability of qualified and dedicated field staff
¾ Ability of respondents in answering complex questions
¾ Availability of resources in term of money, men and technical capabilities
¾ International practice and UN / ESCAP recommendation
Slide 11 Slide 12 CENSUS METHODOLOGY PLANNING PROCESS
Methodology refers to methods employed for collecting data, different phases involved, use of sampling, etc.
¾ Canvasser method: information for each individual and living quarter
collected and recorded by enumerator through interaction with the respondent – generally used in illiterate population.
¾ In householder methods, the responsibility for recording information
on head / person in the housing unit however, questionnaire or usually distributed, collected and checked by census officials.
¾ Dejure verses defecto count: dejure count in all previous censuses
except 1981. Next census on dejure as well as defecto basis to provide counter check of total count.
¾ Use of sampling in enumeration to collect additional information.
ƒ Initial decisions about census taking / date
ƒ Consultation with data users
ƒ Census methodology – dejure / defacto
ƒ Determine different phases of census
ƒ Type of maps required
ƒ Determination of training procedure
ƒ Work out requirement of staff, equipment and supplies
ƒ Determine budgetary requirements and logistics.
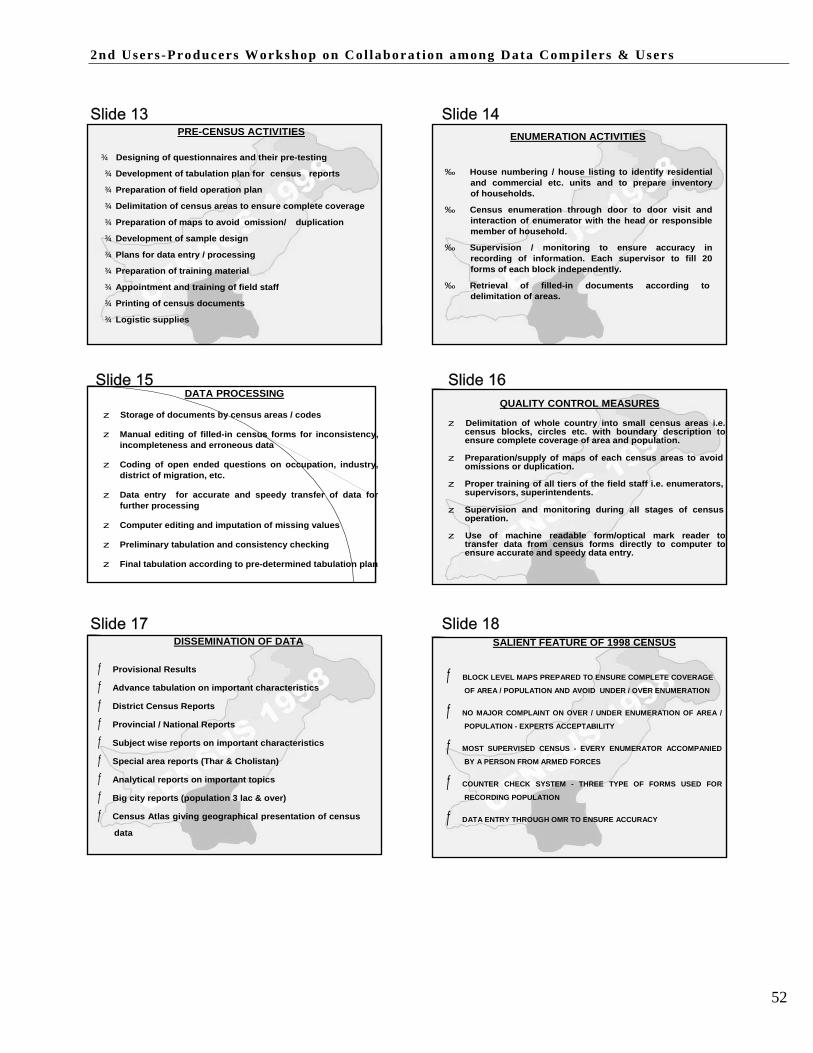
2nd Users -Producers Workshop on Col laborat ion among Data Compi lers & Users
52
Slide 13 Slide 14 PRE-CENSUS ACTIVITIES ENUMERATION ACTIVITIES
¾ Designing of questionnaires and their pre-testing
¾ Development of tabulation plan for census reports
¾ Preparation of field operation plan
¾ Delimitation of census areas to ensure complete coverage
¾ Preparation of maps to avoid omission/ duplication
¾ Development of sample design
¾ Plans for data entry / processing
¾ Preparation of training material
¾ Appointment and training of field staff
¾ Printing of census documents
¾ Logistic supplies
‰ House numbering / house listing to identify residential
and commercial etc. units and to prepare inventory of households.
‰ Census enumeration through door to door visit and interaction of enumerator with the head or responsible member of household.
‰ Supervision / monitoring to ensure accuracy in recording of information. Each supervisor to fill 20 forms of each block independently.
‰ Retrieval of filled-in documents according to delimitation of areas.
Slide 15 Slide 16
DATA PROCESSING
z Storage of documents by census areas / codes
z Manual editing of filled-in census forms for inconsistency, incompleteness and erroneous data
z Coding of open ended questions on occupation, industry,
district of migration, etc.
z Data entry for accurate and speedy transfer of data for further processing
z Computer editing and imputation of missing values
z Preliminary tabulation and consistency checking
z Final tabulation according to pre-determined tabulation plan
QUALITY CONTROL MEASURES
z Delimitation of whole country into small census areas i.e.
census blocks, circles etc. with boundary description to ensure complete coverage of area and population.
z Preparation/supply of maps of each census areas to avoid
omissions or duplication. z Proper training of all tiers of the field staff i.e. enumerators,
supervisors, superintendents. z Supervision and monitoring during all stages of census
operation. z Use of machine readable form/optical mark reader to
transfer data from census forms directly to computer to ensure accurate and speedy data entry.
Slide 17 Slide 18 DISSEMINATION OF DATA
ƒ Provisional Results
ƒ Advance tabulation on important characteristics
ƒ District Census Reports
ƒ Provincial / National Reports
ƒ Subject wise reports on important characteristics
ƒ Special area reports (Thar & Cholistan)
ƒ Analytical reports on important topics
ƒ Big city reports (population 3 lac & over)
ƒ Census Atlas giving geographical presentation of census
data
SALIENT FEATURE OF 1998 CENSUS ƒ BLOCK LEVEL MAPS PREPARED TO ENSURE COMPLETE COVERAGE
OF AREA / POPULATION AND AVOID UNDER / OVER ENUMERATION
ƒ NO MAJOR COMPLAINT ON OVER / UNDER ENUMERATION OF AREA /
POPULATION - EXPERTS ACCEPTABILITY
ƒ MOST SUPERVISED CENSUS - EVERY ENUMERATOR ACCOMPANIED
BY A PERSON FROM ARMED FORCES
ƒ COUNTER CHECK SYSTEM - THREE TYPE OF FORMS USED FOR
RECORDING POPULATION
ƒ DATA ENTRY THROUGH OMR TO ENSURE ACCURACY

2nd Users -Producers Workshop on Col laborat ion among Data Compi lers & Users
53
Slide 19 Slide 20
ƒ QUICK CENSUS RESULTS
= 2 =
- PROVISIONAL RESULTS IN ABOUT 3 MONTHS TIME ( 4 MONTHS
IN 1981 CENSUS )
- ADVANCE TABULATION IN 10 MONTHS ( 21 MONTHS IN 1981
CENSUS)
- FINAL RESULTS IN 30 MONTHS ( 45 MONTHS IN 1981 CENSUS )
ƒ GROWTH RATE JUSTIFIABLE
ƒ EXTENSIVE TABULATION
- 52 STATISTICAL TABLE AGAINST 32 IN 1981 CENSUS
- 25 ANALYTICAL TABLES AT DISTRICT LEVEL AGAINST ONLY
ONE IN 1981 CENSUS
THANKS
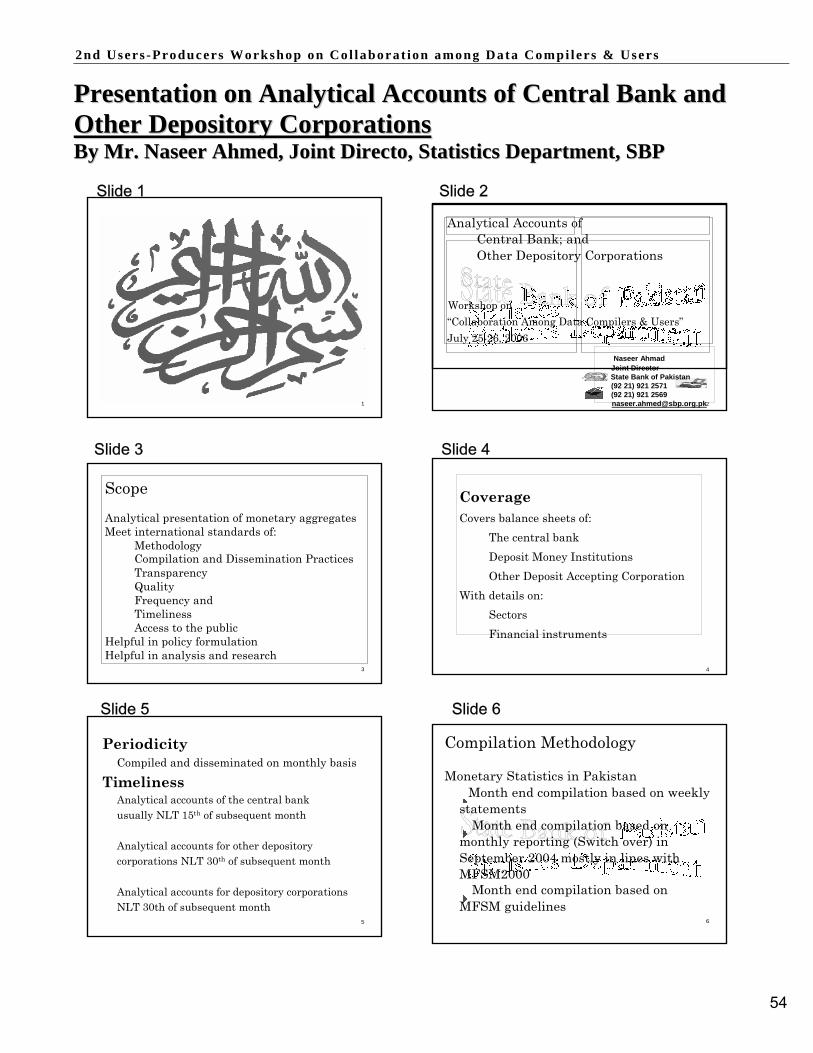
2nd Users -Producers Workshop on Col laborat ion among Data Compi lers & Users
54
2
PPrreesseennttaattiioonn oonn AAnnaallyyttiiccaall AAccccoouunnttss ooff CCeennttrraall BBaannkk aanndd OOtthheerr DDeeppoossiittoorryy CCoorrppoorraattiioonnss BByy MMrr.. NNaasseeeerr AAhhmmeedd,, JJooiinntt DDiirreeccttoo,, SSttaattiissttiiccss DDeeppaarrttmmeenntt,, SSBBPP
Slide 1 Slide 2
Analytical Accounts of Central Bank; and Other Depository Corporations
Workshop on “Collaboration Among Data Compilers & Users” July 25-26, 2006
Naseer Ahmad Joint Director State Bank of Pakistan (92 21) 921 2571 (92 21) 921 2569
Slide 3 Slide 4
Scope
Analytical presentation of monetary aggregates Meet international standards of:
Methodology Compilation and Dissemination Practices Transparency Quality Frequency and Timeliness Access to the public
Helpful in policy formulation Helpful in analysis and research
3
Coverage Covers balance sheets of:
The central bank Deposit Money Institutions Other Deposit Accepting Corporation
With details on: Sectors Financial instruments
4
Slide 5 Slide 6
Periodicity Compiled and disseminated on monthly basis
Timeliness Analytical accounts of the central bank usually NLT 15th of subsequent month
Analytical accounts for other depository corporations NLT 30th of subsequent month
Analytical accounts for depository corporations NLT 30th of subsequent month
5
Compilation Methodology Monetary Statistics in Pakistan
Month end compilation based on weekly statements
Month end compilation based on monthly reporting (Switch over) in September 2004 mostly in lines with MFSM2000
Month end compilation based on MFSM guidelines
6
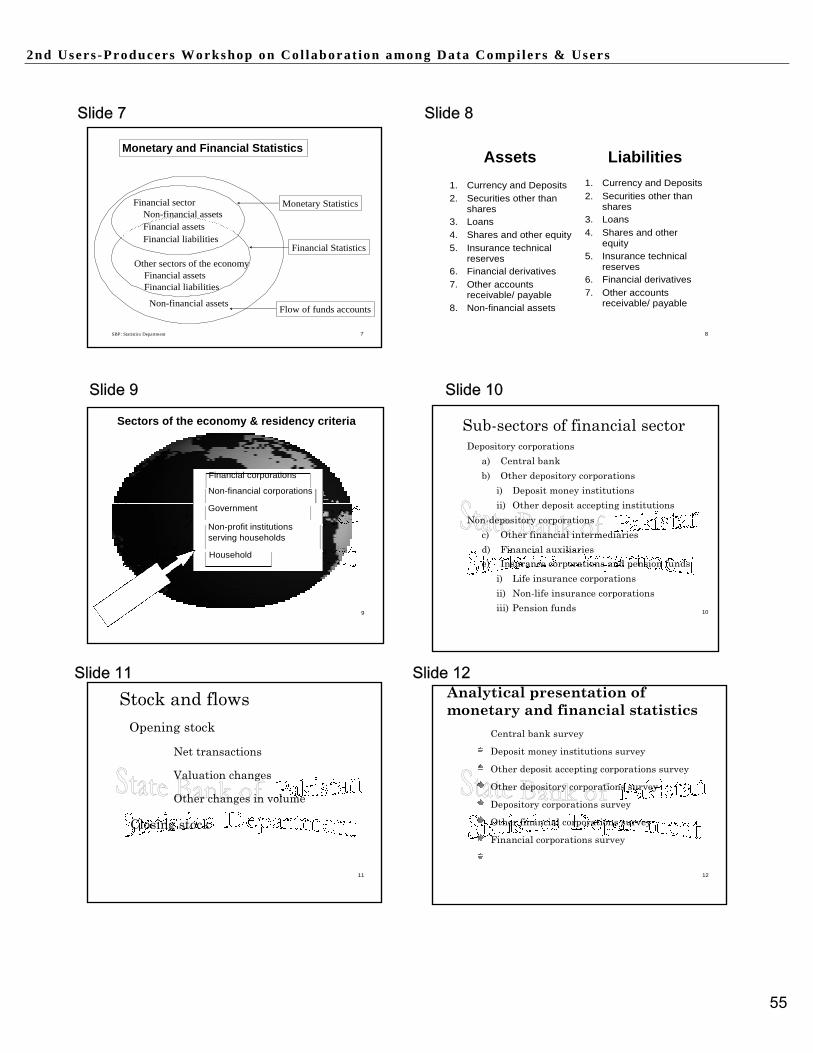
2nd Users -Producers Workshop on Col laborat ion among Data Compi lers & Users
55
Slide 7 Slide 8
Monetary and Financial Statistics Assets Liabilities
Financial sector Non-financial assets Financial assets Financial liabilities
Other sectors of the economy
Financial assets Financial liabilities
Non-financial assets
Monetary Statistics
Financial Statistics Flow of funds accounts
1. Currency and Deposits 2. Securities other than
shares 3. Loans 4. Shares and other equity 5. Insurance technical
reserves 6. Financial derivatives 7. Other accounts
receivable/ payable 8. Non-financial assets
1. Currency and Deposits 2. Securities other than
shares 3. Loans 4. Shares and other
equity 5. Insurance technical
reserves 6. Financial derivatives 7. Other accounts
receivable/ payable
SBP: Statistics Department 7 8
Slide 9 Slide 10
Sectors of the economy & residency criteria
Financial corporations
Non-financial corporations
Government
Non-profit institutions serving households
Household
9
Sub-sectors of financial sector Depository corporations
a) Central bank b) Other depository corporations
i) Deposit money institutions ii) Other deposit accepting institutions
Non-depository corporations c) Other financial intermediaries d) Financial auxiliaries e) Insurance corporations and pension funds
i) Life insurance corporations ii) Non-life insurance corporations iii) Pension funds 10
Slide 11 Slide 12 Stock and flows
Opening stock
Net transactions
Valuation changes
Other changes in volume
Closing stock
Analytical presentation of monetary and financial statistics
Central bank survey
Deposit money institutions survey
Other deposit accepting corporations survey
Other depository corporations survey
Depository corporations survey
Other financial corporations survey
Financial corporations survey
11 12
2nd Users -Producers Workshop on Col laborat ion among Data Compi lers & Users
56
Slide 13 Slide 14
Sources of Data for Analytical Accounts
Analytical Accounts Presentation
State bank of Pakistan
Deposit money institutions
Pakistan Monetary Survey Analytical Accounts of State bank of Pakistan Analytical Accounts of Scheduled Banks
Other deposit accepting corporation
http://www.sbp.org.pk/ecodata/index.asp
13 14
Slide 15 Slide 16
Improvement Plans Most Welcome!
• Full utilizations of the initiatives under
MFSM-2000 implementation projects • Enhancement of data quality through
imparting training
Questions Comments
Ideas / Suggestions
15 16
Slide 17
17
2nd Users -Producers Workshop on Co l laborat ion among Data Co mpi l er s & Users
57
TTeecchhnniiccaall SSeessssiioonn oonn RReeaall SSeeccttoorr
SSeessssiioonn SSuummmmaarryy The purpose of this session was to brief the participants on the scope, coverage, compilation
methodologies of the data on real sector for their view and suggestions for possible improvement
in statistics related to Real Sector. Presentations on National Accounts, Production index, Labour
Force Statistics and Price Statistics were given senior officials of the concerned divisions of
Federal Bureau of Statistics.
Mr. Arif Mehmood Cheema, Deputy Director General made a detailed presentation on National
Accounts compiled under system of National Accounts (SNA) by the Federal Bureau of
Statistics. The purpose and framework of Pakistan national accounts were discussed in the
presentation. FBS uses a combination of three approaches (production approach, income /cost
approach, and expenditure approach) to estimate National Accounts on annual basis. The GDP
deflator estimated under National Accounts can be used as a measure of inflation in the
economy. The estimation of Gross value added of agriculture sector, FBS is uses information on
twelve major crops and thirty seven minor crops, coverage of major crops will be enhanced in
future to cover eighteen major crops. For the Manufacturing Sector, the quantum index of
manufacturing takes about 400 industries as benchmark. Value added of other sectors were
explained in details. The presentation also distinguished the poor response from the stakeholders
for providing timely information.
Mr. Rana Ishaq, Director – Industries of FBS gave a comprehensive presentation on compilation
procedures of Industrial Statistics. After making an introduction of CMI he discussed its
objectives, scope and coverage of the statistics. The CMI is conducted through a CMI properly
designed and tested before census is conducted. Regarding Quantum Index of Large Scale
Manufacturing Industries (QIM), Mr. Rana said QIM is the indicator of real growth rate of value
added of Large Scale Manufacturing Industries. Elaborating further he pointed out estimates of
Small Scales Industries (SSI) are developed through surveys which are done after every ten
years. He also briefed about the Survey of Small Scale & Household Manufacturing Industries
(SHMI) which covers all un-registered household units & small enterprises engaged in
manufacturing activities having less than 10 employees. At the end, he described the limitations
and plans for improvement.

2nd Users -Producers Workshop on Co l laborat ion among Data Co mpi l er s & Users
58
Mr. Mazhar Hussain Hashmi, DDG of FBS made a detailed presentation on Labour Force
Survey. Giving details he said Labour Force Survey has been carried out since 1963, on annual
basis. LFS is household inquiry based on stratified two-stage sample design and sample is
equally distributed through four quarters of the survey year in order to take care of seasonality.
Mr. Hashmi said the general objective of the survey is to provide an overview of labour force
general characteristics e.g. data on age, sex, marital status etc. He discussed in detail the
concepts and definitions used.
Mr. Abdul Azeem Sahito, Director – Prices of FBS presented collection and compilation
procedures of Price Statistics. After making an introduction to Consumer Price Index (CPI),
Sensitive Price Index (SPI) and Wholesale Price Index (WPI), he discussed the objectives of the
price statistics. Elaborating further, he said CPI measures Inflation rate in the country, whereas,
SPI is computed to assess the price movement of essential commodities at short interval of time
to review the price situation in the country. However, WPI measures the General Price level in
the whole sale market. Mr. Sahito explained that before changing the base year, FBS conducts a
series of meeting among members and finalise the coverage, cities related to CPI, SPI and WPI.
At the end of his presentation, he said, base year of CPI, WPI & SPI will be change from 2000-
2001 to 2006-2007. Also rural areas will be covered in CPI where rent will be computed on
survey basis. Previously, the base year was changed after every ten years but now it will be
changed after five years. He said initially SPI was computed for poor income groups but now it
will be computed on the basis of all income groups. FBS is planning to compute separate CPI for
small cities based on the items they consumed.
The chairperson of the session on real sector, Dr. Noor Muhammad Larik, Ex-DG of FBS said in
his concluding remarks that official statistician and academician differ significantly. Official
statisticians are unaware of the developments in methodologies and academicians are unaware of
the problems in official statistics. This created a gap between official statistician and academia.
He said that cooperation among these two groups is the demand of the time. He suggested that
the variation in indices is not being worked out and that is the job of Academia. Forecasting area
is not taken care off and either in universities and nor in government agencies that lacks in the
statistical organisations. He emphasized the need of developing an institute within the
government to coordinate both academicians as well as professional statisticians to work
together and conduct some more research. At the end he concluded that the workshop is very
important and had provided opportunity to discuss about statistics and its importance.

2nd Users -Producers Workshop on Col laborat ion among Data Compi lers & Users
59
PPrreesseennttaattiioonn oonn NNaattiioonnaall AAccccoouunnttss BByy MMrr.. AArriiff MMeehhmmoooodd CChheeeemmaa,, DDDDGG,, FFBBSS
Slide 1 Slide 2
PURPOSE
¾ MONITORING STRUCTURAL CHANGES AND BUSINESS CYCLES
¾ ENABLING INTERNATIONAL
COMPARISON
¾ ADOPTING CONCEPTS AND FRAMES FOR THE ECONOMIC STATISTICS
Slide 3 Slide 4 FRAMEWORK
¾ Regular Activities:
9GDP/GNP (FC) by industrial origin 9Expenditure on GNP (MP) 9GDP implicit deflator – a measure of inflation 9Estimates of GFCF (MP) by industrial origin
for private & public and general government 9Composition of general government current
consumption expenditure
¾ Other Activities: 9Input-Output Tables
ESTIMATION OF GDP/GNP ¾GDP(FC): Gross Domestic Product (GDP) is
the market value of all final goods and services produced at factor cost (FC) in the economy during a particular period
¾GDP (MP) = GDP (FC) + Net Indirect Taxes ¾GNP (FC) = GDP (FC) + Net Factor Income
(NFI) from abroad. ¾GNP (MP) = GNP (FC) + Net Indirect Taxes
Slide 5 Slide 6
ESTIMATION APPROACHES
i. PRODUCTION APPROACH
ii. INCOME /COST APPROACH
iii. EXPENDITURE APPROACH
GROSS FIXED CAPITAL FORMATION (GFCF)
The GFCF comprises of expenditure incurred on the acquisition of fixed assets; rep l a c em e n t s, addit ion s and major improvement of fixed capital viz. land impro v e m en t , b u i l d i ng s , c i v i l an d engineering works, machinery, transport equipm ent and fur nitur e and f ixt ur e. These estimates are prepared separately for private and public sectors by economic activity as well as by capital assets.

2nd Users -Producers Workshop on Col laborat ion among Data Compi lers & Users
60
Slide 7 Slide 8
Major crops:
Minor crops:
Intermediate Consumption:
Sources:
Gross Value Added:
CROPS Rice, Wheat, Cotton, Sugarcane, Gram, Maize, etc. Pulses, Vegetables, Fruits, Oil seeds, Condiments, etc. Seeds, Fertilizer, Pesticides, Water, Transport Charges, etc. Provincial Agriculture & Irrigation Departments, IRSA, WAPDA, Federal Directorate of Fertilizer, Pesticides Association, etc. Value of output including by-products (minus) Intermediate consumption
Composition: Intermediate Consumption: Sources: Gross Value Added:
LIVESTOCK Cattle and their products Poultry and their products Roughages (green and dry), Concentrates (Grains, Oilcakes), Grass & Grazing, salt, Medicines, etc.
Livestock Division, Agriculture Census Organization, Pakistan Poultry Association etc. Value of output including by-products (minus) Intermediate consumption
Slide 9 Slide 10
Composition: •Marine •Inland
Intermediate Consumption:
Sources:
Gross Value Added:
FISHING Fish, Prawn, Shrimps, crabs, etc. from: Ocean, Coastal and Offshore water, Fish farms, Rivers, Canals, Lakes, Ponds, and inundated tracts, etc. Salt, Ice, Fuel & Lubricants, Medicines, Chemicals, etc. and Auction Charges. Marine Fisheries Department, Provincial Fisheries Departments & Federal Bureau of Statistics. Value of output (minus) Intermediate consumption
Composition: Intermediate Consumption: Sources: Gross Value Added:
FORESTRY Timber, Firewood, Ephedra, Grass & Grazing, Resin, Medicinal herbs, and other Minor Forest Products/Output. Seeds, plantation, fertilizer, etc.
Federal Inspectorate General of Forests. Provincial Forest Departments.
Value of output (minus) Intermediate consumption
Slide 11 Slide 12
MINING & QUARRYING LARGE-SCALE MANUFACTURING Composition:
Intermediate Consumption:
Sources:
Crude oil, Natural Gas, Coal including other minerals, e.g. Rock Salt, Lime Stone, Dolomite, Gypsum, Fire clay, Phosphate, Marble, and Surface Minerals. Blasting Material, Fuel and Lubricants, etc.
Ministry of Petroleum and Natural Resources, OGDC, Occidental, Pirkoh, Mari Gas, Coal and other Mineral Establishments, Provincial Mineral
Composition: Sources:
Food, Beverages, Tobacco, Textile, Leather, Wood & Wood Products, Paper & Boards, Chemicals, Pharmaceutical, Petroleum, Metal, Engineering, Electrical, Automobile and other Industrial products/ groups.
Ministry of Industries, OCAC, Central Board of Revenue, Provincial Bureaux of Statistics, Federal Bureau of Statistics.
Gross Value Added:
Departments
Value of output (minus) Intermediate consumption
For calculating growth rate of value added, Quantum Index of Manufacturing (QIM) is computed based on production data of 100 items having 75.07% weight (bench-mark 1999-2000) of Large Scale Manufacturing Sector.

2nd Users -Producers Workshop on Col laborat ion among Data Compi lers & Users
61
Slide 13 Slide 14
SMALL-SCALE MANUFACTURING Composition:
CONSTRUCTION All major construction activities including repairs, additions/alterations, Land
Composition:
Benchmark Estimates of Gross Value Added:
Annual Growth:
All un-registered small and household manufacturing establishments Based on special study and SHMI Surveys.
7.51 % based on Study on SSMI
Sources:
Improvement; Buildings; Roads, Bridges, Streets; Highways; Runways; Transport & Railway Tracts; Telephone, Power, Gas, Oil, Utility lines; Canals; Dams; Harbour & Barrages etc. Federal, Provincial & Local Bodies, Development Authorities, Major Public & Private Construction Establishments, Federal Bureau of Statistics.
1999-2000 Value added coefficients of Investment by kind of construction are multiplied to Investment made in that activity during the year. Value additions of all activities are summed up.
Slide 15 Slide 16
ELECTRICITY, GAS DISTRIBUTION & WATER SUPPLY
TRANSPORT, STORAGE & COMMUNICATION
Composition:
Intermediate Consumption:
Sources: Electricity: Gas:
Water:
Gross Value Added:
Electricity, Gas distribution and Water supply Furnace Oil, Gas, Water, etc. WAPDA, KESC, KANUPP, Pak Steel, IPPs and Captive Power units. Sui Southern and Sui Northern Gas Cos., Mari Gas etc. IRSA, Provincial Irrigation Departments. Value of Electric, Gas & Water Supply (plus) Misc. Receipts (minus) Industrial cost & Electricity/Gas purchases.
Composition: Sources: Gross Value Added:
Railway, Air, Water, Road, Pipeline Transport; Communications & Storage
Pakistan Railways, PNSC, KPT, PQA, CAA, PIA & other Airlines. NTRC, Asia Petroleum, PARCO, etc. Ports, Boats, etc. Excise Departments, PTCL, PTV, Private Radio & TV, Courier Services, NLC, Town Committees (for Non-mechanized). Value of output (plus) Misc. Receipts (minus) intermediate consumption
Slide 17 Slide 18
FINANCE & INSURANCE WHOLESALE & RETAIL TRADE
Composition:
Sources:
Gross Value Added:
State Bank of Pakistan, Scheduled Banks, DFIs, Insurance Companies, Modaraba & Leasing Companies. State Bank of Pakistan, Scheduled Banks, Development Financial Institutions, Life and General Insurance Cos, Modarabas & Leasing Companies. Value of output (plus) Misc. Receipts (minus) intermediate consumption
Composition: Sources: Value Added:
All Agricultural, Industrial Produce and Imports Provincial Governments & Federal Bureau of Statistics Total value of trade margins applied on the marketed portions of Agriculture and Industrial Output as well as Imports.

2nd Users -Producers Workshop on Col laborat ion among Data Compi lers & Users
62
Slide 19 Slide 20
OWNERSHIP OF DWELLINGS PUBLIC ADMN. & DEFENCE
Coverage: Housing Units (rented as well as self occupied) and in urban and rural areas
Composition: Federal, Provincial and District Governments and Cantonment Boards.
Sources:
Value Added:
Housing Census & Rent Surveys Gross Rentals (No. of Dwellings multiplied by average annual rent
(minus) Value of current repairs and maintenance.
Sources: Gross Value Added:
Budget documents of Federal, Provincial, District Governments and Cantonment Boards. Sum of the compensation of employees
(all Civil and Defence)
(Plus)
Depreciation on Govt. fixed assets
Slide 21 Slide 22
COMMUNITY, SOOCIAL & PRIVATE SERVICES
MAIN WEAKNESSES
Composition:
Sources:
Gross Value Added:
Education, Health, Business (Accounting, Auditing, Advertising, Photography etc.), Recreation, Social, Personal & Domestic Services, etc. Ministry of Education, PMDC, PNC, PBA, PEC, ACA, PAA, PHA, etc. Per Worker Value Added multiplied by Number of Workers
¾ Poor Response ¾ Extrapolations and Estimations ¾ SNA 1993 not yet fully adopted ¾ Scope is limited
Slide 23
Arif Mehmood Cheema Deputy Director General (N.A.)
Office contact: [email protected]

2nd Users -Producers Workshop on Col laborat ion among Data Compi lers & Users
63
PPrreesseennttaattiioonn oonn PPrriiccee SSttaattiissttiiccss BByy AAbbdduull AAzzeeeemm SSaahhiittoo DDiirreeccttoorr
Slide 1 Slide 2
بسم اهللا الرحمن الرحيم
PRESENTATION ON PRICE STATISTICS
BY ABDUL AZEEM SAHITO
DIRECTOR PRICE STATISTICS SECTION
FEDERAL BUREAU OF STATISTICS, KARACHI
Slide 3 Slide 4
PRICE STATISTICS
• PRICE STATISTICS INCLUDES
COLLECTION OF RETAIL AND WHOLE SALE PRICES AND COMPUTATION OF FOLLOWING INDICES:-
• 1. CONSUMER PRICE INDEX (C.P.I) • 2. WHOLESALE PRICE INDEX (W.P.I) • 3. SENSITIVE PRICE INDICATOR (S.P.I)
INTRODUCTION • CPI measures changes in the cost of buying a
representative fixed basket of goods and services and is generally accepted as a measure of inflation in the country”.
• SPI measures the price changes of essential items at short intervals of time (Weekly basis). It is being used to review price situation in country.
• WPI measures the change of prices in the primary wholesale market. It measures general price level and and shows direction of prices.
Slide 5 Slide 6
Objectives • CPI measures Inflation rate in the country
• SPI is computed to assess the price movement of essential commodities at short interval of time to review the price situation in the country.
• WPI measures the General Price level in the whole sale market.
Selection of Markets/Outlets and Cities
„Markets are selected through retail and wholesale trade survey.
„Outlets are selected on transaction value basis
„Cities are selected on population basis
„Stratified sampling are used for selection of cities
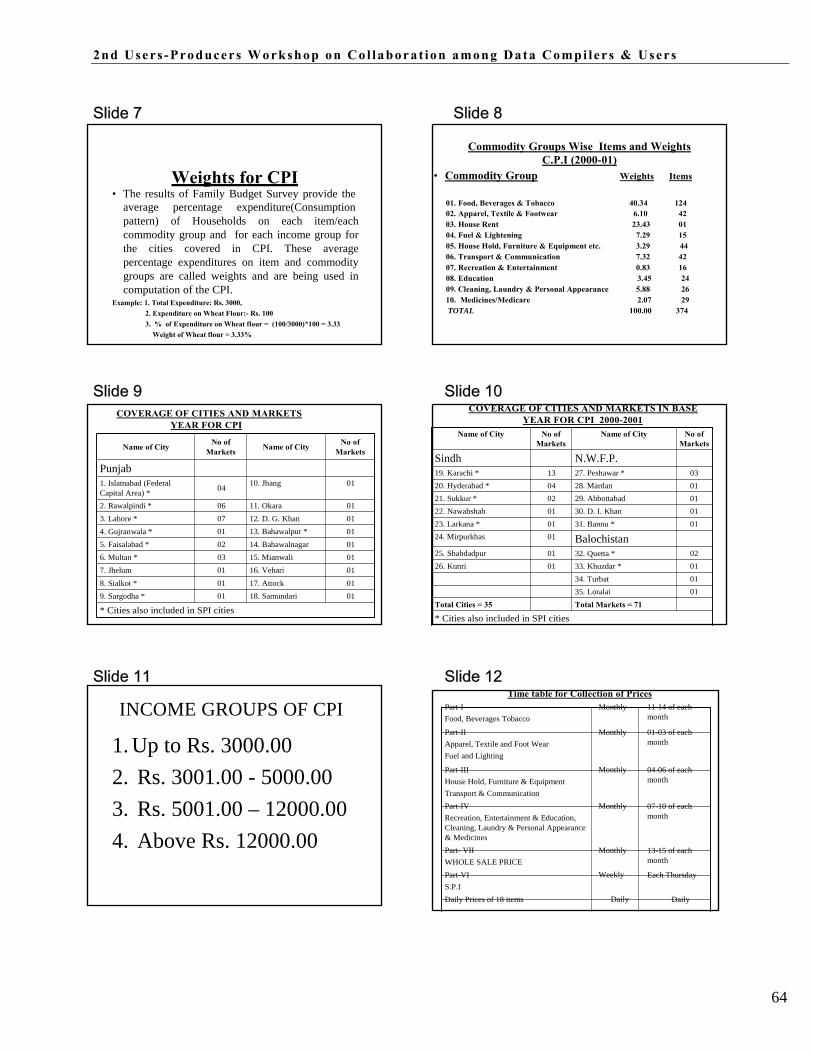
2nd Users -Producers Workshop on Col laborat ion among Data Compi lers & Users
64
Slide 7 Slide 8
Commodity Groups Wise Items and Weights C.P.I (2000-01)
Weights for CPI • Commodity Group Weights Items
• The results of Family Budget Survey provide the average percentage expenditure(Consumption pattern) of Households on each item/each commodity group and for each income group for the cities covered in CPI. These average percentage expenditures on item and commodity groups are called weights and are being used in computation of the CPI.
Example: 1. Total Expenditure: Rs. 3000, 2. Expenditure on Wheat Flour:- Rs. 100 3. % of Expenditure on Wheat flour = (100/3000)*100 = 3.33
Weight of Wheat flour = 3.33%
01. Food, Beverages & Tobacco 40.34 124 02. Apparel, Textile & Footwear 6.10 42 03. House Rent 23.43 01 04. Fuel & Lightening 7.29 15 05. House Hold, Furniture & Equipment etc. 3.29 44 06. Transport & Communication 7.32 42 07. Recreation & Entertainment 0.83 16 08. Education 3.45 24 09. Cleaning, Laundry & Personal Appearance 5.88 26 10. Medicines/Medicare 2.07 29 TOTAL 100.00 374
Slide 9 Slide 10COVERAGE OF CITIES AND MARKETS
YEAR FOR CPI
COVERAGE OF CITIES AND MARKETS IN BASE YEAR FOR CPI 2000-2001
Name of City
Punjab 1. Islamabad (Federal Capital Area) * 2. Rawalpindi * 3. Lahore * 4. Gujranwala * 5. Faisalabad * 6. Multan * 7. Jhelum 8. Sialkot * 9. Sargodha *
No of
Markets
04
06 07 01 02 03 01 01 01
Name of City
10. Jhang 11. Okara 12. D. G. Khan 13. Bahawalpur * 14. Bahawalnagar 15. Mianwali 16. Vehari 17. Attock 18. Samundari
No of
Markets
01
01 01 01 01 01 01 01 01
Name of City Sindh 19. Karachi * 20. Hyderabad * 21. Sukkur * 22. Nawabshah 23. Larkana * 24. Mirpurkhas 25. Shahdadpur 26. Kunri Total Cities = 35
No of Markets
13 04 02 01 01 01
01 01
Name of City N.W.F.P. 27. Peshawar * 28. Mardan 29. Abbottabad 30. D. I. Khan 31. Bannu *
Balochistan 32. Quetta * 33. Khuzdar * 34. Turbat 35. Loralai Total Markets = 71
No of Markets
03 01 01 01 01
02 01 01 01
* Cities also included in SPI cities * Cities also included in SPI cities
Slide 11 Slide 12 Time table for Collection of Prices
INCOME GROUPS OF CPI
1. Up to Rs. 3000.00 2. Rs. 3001.00 - 5000.00 3. Rs. 5001.00 – 12000.00 4. Above Rs. 12000.00
Part-I Food, Beverages Tobacco
Part-II Apparel, Textile and Foot Wear Fuel and Lighting
Part-III House Hold, Furniture & Equipment Transport & Communication Part-IV Recreation, Entertainment & Education, Cleaning, Laundry & Personal Appearance & Medicines Part- VII WHOLE SALE PRICE Part-VI S.P.I Daily Prices of 18 items
Monthly
Monthly Monthly Monthly Monthly
Weekly
Daily
11-14 of each month
01-03 of each month
04-06 of each month
07-10 of each month 13-15 of each month
Each Thursday
Daily

2nd Users -Producers Workshop on Col laborat ion among Data Compi lers & Users
65
Slide 13 Slide 14
FORMULA USED FOR COMPUTATION OF CPI HISTORICAL BACKGROUND FOR VARIOUS CPI BASE YEARS
ITEMS 1948-49 = 100 1955-56 = 100 1969-70 = 100 1975-76 = 100 1980-81 = 100 1990-91 = 100
Laspeyre's formula as given below is being used for
the computation of CPI. ∑ (Pn/Po) x wi
OCCUPATIONAL CATEGORY
Industrial Indus trial Indus trial Industrial Industrial Indus trial
Clerical Commercial Commercial Commercial Commercial Government Government Government Government
Self Employer & employed
In = --------------------- x 100 NUMBER OF ITEMS 202 357 464 460 NUMBER OF
∑ wi COMMODITY GROUPS
4 4 4 4 9 9
Where In = CPI for the nth period NUMBER OF CITIES 4 4 12 12 25 25 % OF TOTAL
Pn = price of an item in the in the nth period Po = price of an item in the base period wi = weight of the ith item in the base period =
URBAN POPULATION NUMBER OF MARKETS NUMBER OF
57% 57% 63% 63.13%
28 28 65 61
Po x qo / ∑ Po x Qo ∑ wi = Total weight of all items.
QUOTATIONS 22624 39984 116928 112240
INCOME GROUPS 1. Up to Rs 68-130 1. Up to Rs. 105-130 1. Up to Rs. 300 1. Up to Rs . 600 1. Up to Rs. 1000 1. Upto Rs . 1500 2. Rs . 218-332 2. Rs . 301-500 2. Rs. 601-1500 2. Rs . 1001-2500 2. Rs. 1501 - 4000
3. Rs . 501 - 1000 3. Rs. 1501 - 2500 3. Rs . 2501-4500 3. Rs. 4001 - 7000 4. Above Rs. 1000 4. Above Rs . 2500 4. Above Rs. 4500 4. Rs. 7001 - 10000
5. Above Rs . 10000
Slide 15 Slide 16
WHOLE SALE PRICE INDEX (2000-01) Whole Sale Price Index (WPI)Historical Changes
• Coverage: Commodities: 106 Items 425 Price Quotations 1550
BASE YEAR
No of Commodities
No of Price Quotations
No. Of Cities
Commodity groups
• CITIES:- 18 Major Cities 1. Lahore 2. Faisalabad 3. Rawalpindi 4. Multan 5. Gujranwala 6. Sialkot 7. Sarghoda 8. Bahawalpur 9. Sahiwal 10. Karachi 11. Hyderabad 12. Sukkur 13. Nawabshah 14. Larkana 15. Peshawar 16. Quetta. 17. Mirpurkhas 18.Mingora
• GROUPS & WEIGHTS: Commodity Group Weight No. of Items No. of Commodities No. of Price
Quotation FOOD 42.12 106 43 693 RAW MATERIALS 7.99 25 09 104 FUEL, LIGHTING 19.29 17 11 36 & LUBRICANTS MANUFACTURES 25.87 227 32 564 BUILDING
1959-60=100 64 201 22 Food Raw Materials Fuel,lighting & lubricants manufactures
1969-70=100 72 433 22 Food Raw Materials Fuel,lighting & lubricants manufactures
1975-76=100 87 625 22 Food Raw Materials Fuel,lighting & lubricants Manufactures Building Materials
1980-81=100 91 690 22 Food Raw Materials Fuel,lighting & lubricants Manufactures Building Materials
1990-91=100 96 1210 16 Food Raw Materials Fuel,lighting & lubricants Manufactures Building Materials Food MATERIALS 4.73 50 11 153
TOTAL 100.00 425 106 1550 • PERIODICITY OF PRICE COLLECTION: 11th to 14th of Each Month (Monthly)
2000-01=100 106 1550 18 Raw Materials Fuel, Lighting& Lubricants Manufactures Building Materials
Slide 17 Slide 18
Sensitive Price Indicator (SPI) Historical Changes
SENSITIVE PRICE INDICATOR (2000-01=100)
BASE YEAR NO OF
CITIES
NO OF ITEMS
NO OF MARKETS
INCOME GROUP
OCCUPATIONAL CATEGORIES
• Coverage: • Items: 53 • Markets: 53 • Price quotations: 10812 • CITIES:- 17 MAJOR CITIES
1. Lahore 2. Faisalabad 3. Rawalpindi 4. Islamabad 5. Multan 6. Gujranwala 7.Sialkot 8. Sargodha 9. Bahawalpur 10. Karachi 11. Hyderabad 12. Sukkur
13. Larkana 14. Peshawar 15. Bannu 16.Quetta 17. Khuzdar.
• INCOME GROUP:- UPTO Rs. 3000.00 (Also for other groups) • CATEGORY OF EMPLOYEES:- ALL CATEGORIES COMBINED
• PERIODICITY OF PRICE COLLECTION: - On Every Thursday (Weekly Basis)
1969-70=100 12 28 22 upto Rs.300 Industrial employees Commercial employees Government employees
1975-76=100 12 38 22 Upto Rs.600 Industrial employees
Commercial employees Government employees
1980-81=100 12 46 50 Upto Rs.1000 Industrial employees
Commercial employees Government employees
1990-91=100 12 47 48 Upto Rs.1500 Industrial employees
Commercial employees Government employees
2000-01=100 17 53 53 Upto Rs.3000 All categories combined
including self employer and employeed.

2nd Users -Producers Workshop on Col laborat ion among Data Compi lers & Users
66
Slide 19 Slide 20
SENSITIVE PRICE INDICATOR (SPI), CONSUMER PRICE INDEX (CPI) AND WHOLESALE PRICE INDEX (WPI) AT VARIOUS POINTS OF TIME
2000-2001=100 PERCENTAGE CHANGE OVER
Dissemination of Price Data • WPI Intercity Prices of 18 cities.(Monthly/Yearly) • CPI Intercity Prices of 35 cities(Monthly/Yearly)
PERIOD I N D I C E S PREVIOUS PERIOD/MONTHS • WPI indices for 5 commodity groups.
2000-2001 2001-2002 2002-2003 2003-2004 2004-2005
SPI CPI WPI SPI CPI WPI 100.00 100.00 100.00 -- -- --- 103.37 103.54 102.08 3.37 3.54 2.08 107.06 106.75 107.77 3.58 3.10 5.57 114.38 111.63 116.29 6.83 4.57 7.91 127.59 121.98 124.14 11.55 9.28 6.75
• CPI indices for 10 commodity groups. • CPI indices, 4 income groups,10 commodity groups
and 17 CPI cities. • Combined CPI indices for 10 commodity groups for 35
CPI cities. 2005-2006 136.56 131.64 136.68 7.02 7.92 10.10 • Intercity prices of construction items.
• SPI indices by income groups on monthly basis
Slide 21 Slide 22
FUTURE PLANNING
1. Change of base of CPI, WPI & SPI. Proposed to be changed after 5 years
2. Rent will be computed on rent survey basis. 3. COICOP classification will be used in CPI and
CPC in WPI. 4. Enhance scope of indices in terms of
cities/items and income groups.
THANK YOU
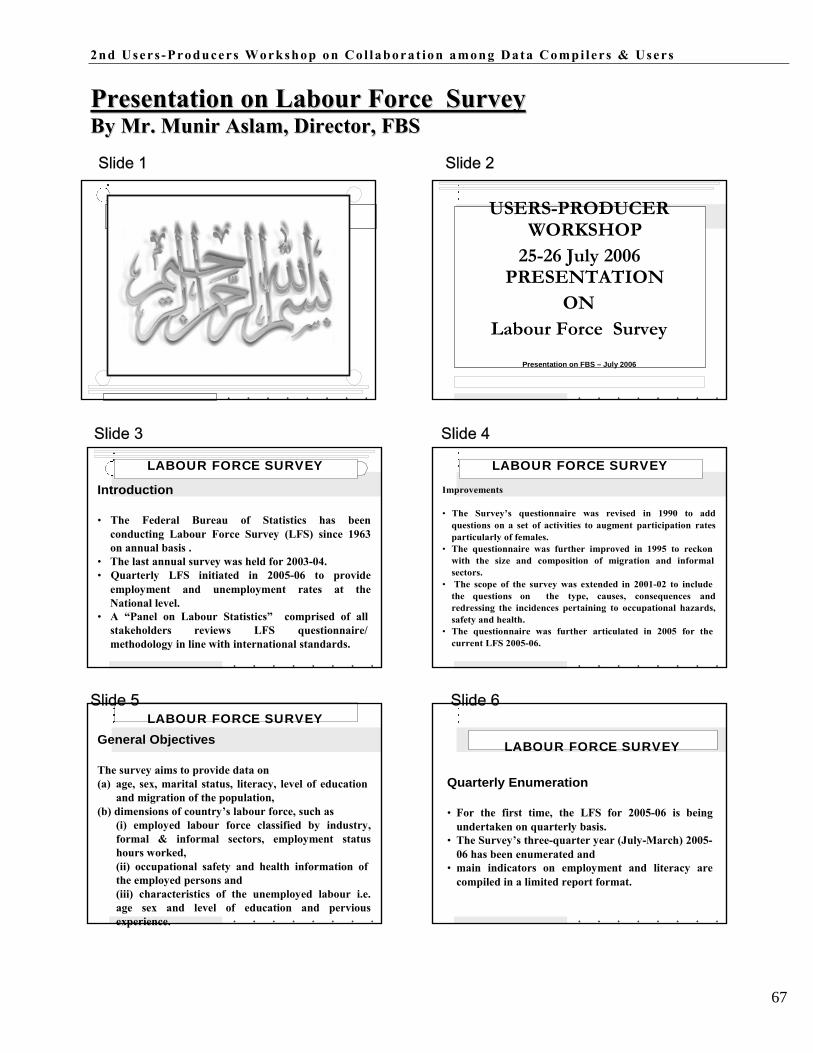
2nd Users -Producers Workshop on Col laborat ion among Data Compi lers & Users
67
PPrreesseennttaattiioonn oonn LLaabboouurr FFoorrccee SSuurrvveeyy BByy MMrr.. MMuunniirr AAssllaamm,, DDiirreeccttoorr,, FFBBSS
Slide 1 Slide 2
USERS-PRODUCER WORKSHOP
25-26 July 2006 PRESENTATION
ON Labour Force Survey
Presentation on FBS – July 2006
Slide 3 Slide 4
LABOUR FORCE SURVEY Introduction
• The Federal Bureau of Statistics has been
conducting Labour Force Survey (LFS) since 1963 on annual basis .
• The last annual survey was held for 2003-04. • Quarterly LFS initiated in 2005-06 to provide
employment and unemployment rates at the National level.
• A “Panel on Labour Statistics” comprised of all stakeholders reviews LFS questionnaire/ methodology in line with international standards.
LABOUR FORCE SURVEY Improvements • The Survey’s questionnaire was revised in 1990 to add
questions on a set of activities to augment participation rates particularly of females.
• The questionnaire was further improved in 1995 to reckon with the size and composition of migration and informal sectors.
• The scope of the survey was extended in 2001-02 to include the questions on the type, causes, consequences and redressing the incidences pertaining to occupational hazards, safety and health.
• The questionnaire was further articulated in 2005 for the current LFS 2005-06.
Slide 5 Slide 6 LABOUR FORCE SURVEY
General Objectives
The survey aims to provide data on (a) age, sex, marital status, literacy, level of education
and migration of the population, (b) dimensions of country’s labour force, such as
(i) employed labour force classified by industry, formal & informal sectors, employment status hours worked, (ii) occupational safety and health information of the employed persons and (iii) characteristics of the unemployed labour i.e. age sex and level of education and pervious experience.
LABOUR FORCE SURVEY
Quarterly Enumeration • For the first time, the LFS for 2005-06 is being
undertaken on quarterly basis. • The Survey’s three-quarter year (July-March) 2005-
06 has been enumerated and • main indicators on employment and literacy are
compiled in a limited report format.
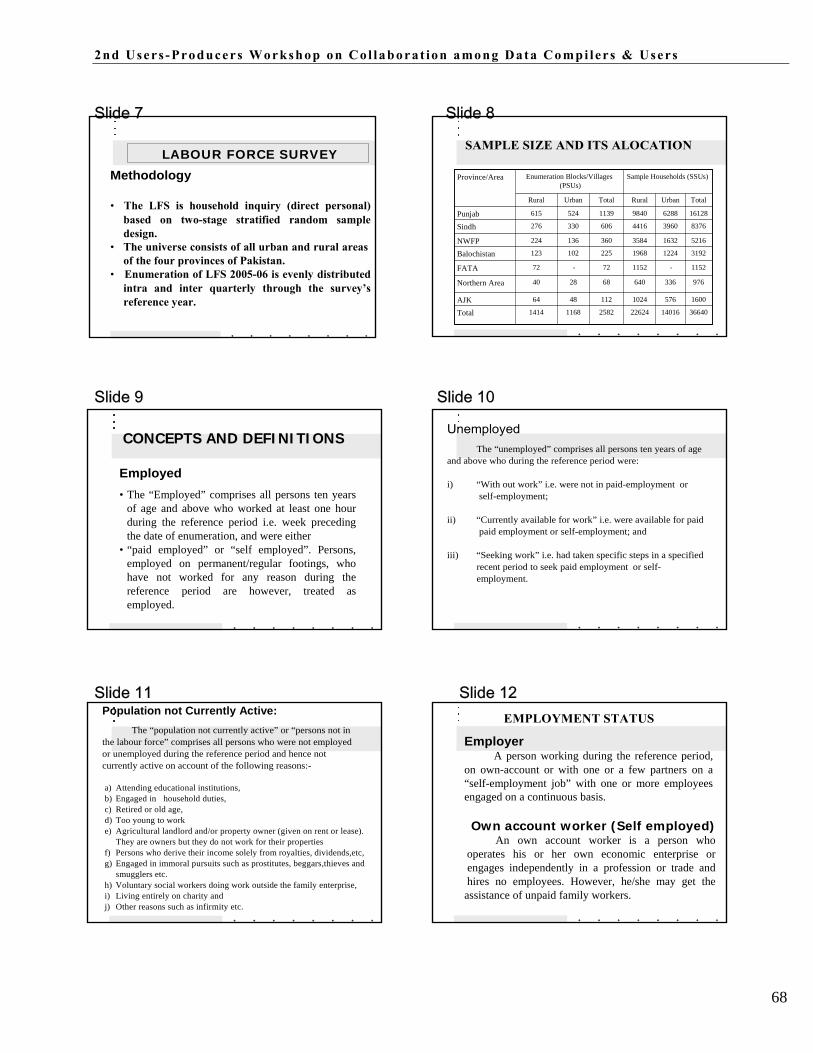
2nd Users -Producers Workshop on Col laborat ion among Data Compi lers & Users
68
Slide 7 Slide 8
LABOUR FORCE SURVEY SAMPLE SIZE AND ITS ALOCATION
Methodology Province/Area
Enumeration Blocks/Villages
(PSUs)
Sample Households (SSUs)
• The LFS is household inquiry (direct personal)
based on two-stage stratified random sample design.
• The universe consists of all urban and rural areas of the four provinces of Pakistan.
• Enumeration of LFS 2005-06 is evenly distributed intra and inter quarterly through the survey’s reference year.
Punjab Sindh
NWFP Balochistan
FATA
Northern Area AJK Total
Rural
615
276
224
123
72
40
64
1414
Urban
524
330
136
102
-
28
48
1168
Total
1139
606
360
225
72
68 112
2582
Rural
9840
4416
3584
1968
1152
640 1024
22624
Urban
6288
3960
1632
1224
-
336
576
14016
Total
16128
8376
5216
3192
1152
976 1600
36640
Slide 9 Slide 10
CONCEPTS AND DEFINITIONS
Employed
• The “Employed” comprises all persons ten years of age and above who worked at least one hour during the reference period i.e. week preceding the date of enumeration, and were either
• “paid employed” or “self employed”. Persons, employed on permanent/regular footings, who have not worked for any reason during the reference period are however, treated as employed.
Unemployed
The “unemployed” comprises all persons ten years of age and above who during the reference period were: i) “With out work” i.e. were not in paid-employment or
self-employment; ii) “Currently available for work” i.e. were available for paid
paid employment or self-employment; and iii) “Seeking work” i.e. had taken specific steps in a specified
recent period to seek paid employment or self- employment.
Slide 11 Slide 12Population not Currently Active:
The “population not currently active” or “persons not in
the labour force” comprises all persons who were not employed or unemployed during the reference period and hence not currently active on account of the following reasons:-
a) Attending educational institutions, b) Engaged in household duties, c) Retired or old age, d) Too young to work e) Agricultural landlord and/or property owner (given on rent or lease).
They are owners but they do not work for their properties f) Persons who derive their income solely from royalties, dividends,etc, g) Engaged in immoral pursuits such as prostitutes, beggars,thieves and
smugglers etc. h) Voluntary social workers doing work outside the family enterprise, i) Living entirely on charity and j) Other reasons such as infirmity etc.
EMPLOYMENT STATUS
Employer A person working during the reference period,
on own-account or with one or a few partners on a “self-employment job” with one or more employees engaged on a continuous basis. Own account worker (Self employed)
An own account worker is a person who operates his or her own economic enterprise or engages independently in a profession or trade and hires no employees. However, he/she may get the assistance of unpaid family workers.

2nd Users -Producers Workshop on Col laborat ion among Data Compi lers & Users
69
Slide 13 Slide 14
Employee A person who works for a public or
private employer and receives remuneration in wages, salary, commission, tips, piece rates or pay in kind.
Unpaid family worker
A person who works without pay in cash or in
kind on an enterprise operated by a member of his/her household or other related persons is termed as unpaid family workers.
INFORMAL SECTOR - All household enterprises owned and
operated by own-account workers (self- employed), irrespective of the size of the enterprise (informal own-account enterprises).
- Household enterprises owned and
operated by employers with less than 10 persons engaged, and
- Excluded are all household enterprises
engaged in agricultural activities or wholly engaged in non-market production.
Slide 15 Slide 16
PARTICIPATION RATES
Participation Rates (%)
Crude Participation Rates (%) 60 2003-04 2005-06 (Jul-Mar)
Year/Periodicity Crude Activity Rate Refined Activity Rates 50
Annual (Jul-Jun) 2003-04
Three Quarters Collectively (Jul-Mar) 2005-06
Total 30.4
32.3
Male 48.7
50.3
Female 11.2
13.5
Total 43.7
46.3
Male 70.6
72.2
Female 15.9
19.2
40 30 20 10
0 Both Sexes Male Female
Slide 17 Slide 18
Refined Participation Rates (%) Employment by Sector (%)
80 2003-04 2005-06 (Jul-Mar)
70
Sector/
Periodicity
Annual (Jul-Jun) 2003-04
Three Quarters
Collectively (Jul-Mar) 2005-06
60
50
40
30
20
10
0 Total Male Female
Agriculture Industry Services
Both Sexes 43.1 20.3
36.6
Male
38.1 21.4 40.5
Female
67.3
15.0
17.7
Both Sexes 44.0 20.8
35.2
Male
38.0 22.2 39.8
Female
68.9
14.8
16.3
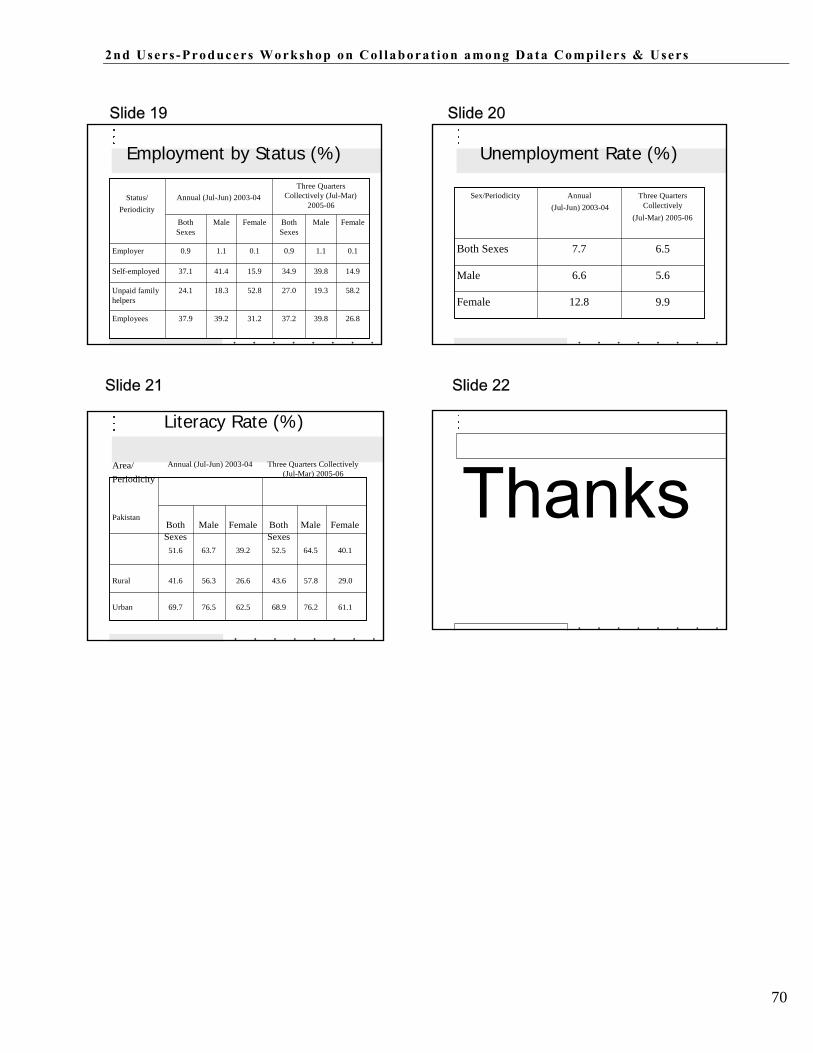
2nd Users -Producers Workshop on Col laborat ion among Data Compi lers & Users
70
Slide 19 Slide 20
Employment by Status (%) Unemployment Rate (%)
Status/ Periodicity
Annual (Jul-Jun) 2003-04
Three Quarters Collectively (Jul-Mar)
2005-06
Sex/Periodicity
Annual
(Jul-Jun) 2003-04
Three Quarters
Collectively
Employer
Self-employed
Unpaid family helpers
Employees
Both Sexes
0.9 37.1
24.1
37.9
Male
1.1
41.4 18.3
39.2
Female
0.1
15.9
52.8
31.2
Both Sexes
0.9 34.9
27.0
37.2
Male
1.1
39.8 19.3
39.8
Female
0.1
14.9
58.2
26.8
Both Sexes Male Female
7.7 6.6 12.8
(Jul-Mar) 2005-06
6.5
5.6
9.9
Slide 21 Slide 22
Literacy Rate (%)
Area/ Periodicity
Annual (Jul-Jun) 2003-04 Three Quarters Collectively (Jul-Mar) 2005-06 Thanks
Pakistan Both Sexes
51.6
Male 63.7
Female
39.2
Both Sexes
52.5
Male 64.5
Female
40.1
Rural 41.6 56.3 26.6 43.6 57.8 29.0
Urban 69.7 76.5 62.5 68.9 76.2 61.1
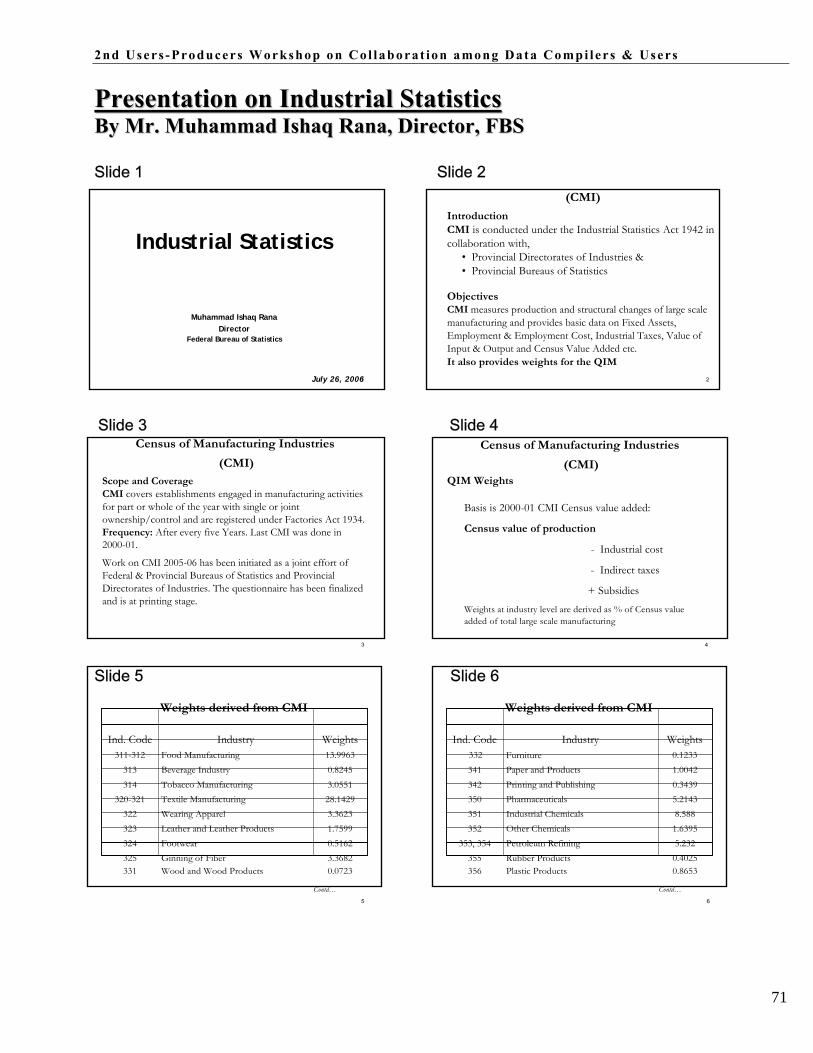
2nd Users -Producers Workshop on Col laborat ion among Data Compi lers & Users
71
PPrreesseennttaattiioonn oonn IInndduussttrriiaall SSttaattiissttiiccss BByy MMrr.. MMuuhhaammmmaadd IIsshhaaqq RRaannaa,, DDiirreeccttoorr,, FFBBSS
Slide 1 Slide 2
(CMI)
Industrial Statistics Introduction CMI is conducted under the Industrial Statistics Act 1942 in collaboration with,
• Provincial Directorates of Industries & • Provincial Bureaus of Statistics
Muhammad Ishaq Rana Director
Federal Bureau of Statistics
July 26, 20061
Objectives CMI measures production and structural changes of large scale manufacturing and provides basic data on Fixed Assets, Employment & Employment Cost, Industrial Taxes, Value of Input & Output and Census Value Added etc. It also provides weights for the QIM
2
Slide 3 Slide 4 Census of Manufacturing Industries
(CMI) Scope and Coverage CMI covers establishments engaged in manufacturing activities for part or whole of the year with single or joint ownership/control and are registered under Factories Act 1934. Frequency: After every five Years. Last CMI was done in 2000-01.
Work on CMI 2005-06 has been initiated as a joint effort of Federal & Provincial Bureaus of Statistics and Provincial Directorates of Industries. The questionnaire has been finalized and is at printing stage.
Census of Manufacturing Industries (CMI)
QIM Weights
Basis is 2000-01 CMI Census value added:
Census value of production
- Industrial cost
- Indirect taxes
+ Subsidies
Weights at industry level are derived as % of Census value added of total large scale manufacturing
3 4
Slide 5 Slide 6
Weights derived from CMI Weights derived from CMI
Ind. Code 311-312
Industry Food Manufacturing
Weights 13.9963
Ind. Code 332
Furniture
Industry Weights 0.1233
313 314
320-321 322 323 324 325 331
Beverage Industry Tobacco Manufacturing Textile Manufacturing Wearing Apparel Leather and Leather Products Footwear Ginning of Fiber Wood and Wood Products
0.8245 3.0551 28.1429 3.3623 1.7599 0.5162 3.3682 0.0723
341 342 350 351 352
353, 354 355 356
Paper and Products Printing and Publishing Pharmaceuticals Industrial Chemicals Other Chemicals Petroleum Refining Rubber Products Plastic Products
1.0042 0.3439 5.2143 8.588 1.6395 5.232 0.4025 0.8653
Contd…
5
Contd…
6

2nd Users -Producers Workshop on Col laborat ion among Data Compi lers & Users
72
Slide 7 Slide 8
Weights derived from CMI Weights derived from CMI
Ind. Code 361 362 369 371 372
380, 381 382 383 384
Industry Pottery, ceramics Glass Products Other non-metal Products Iron and Steel Non-Ferrous Metals Metal Products Machinery Electrical Machinery Transport Equipment
Weights 0.2155 0.3650 4.5821 4.8853 0.0598 1.2304 1.2808 3.1995 4.4560
Ind. Code
385 386 391 392
393, 394
3
Industry
Measuring Instruments Optical Goods Handicrafts Sports and Athletic Goods Other Manufacturing Industries
Large Scale Manufacturing
Weights
0.4581 0.0001 0.0288 0.4543 0.2736
100.00
Contd…
7 8
Slide 9 Slide 10
Quantum Index of Large Scale Manufacturing Industries (QIM)
QIM is the indicator of real growth rate of value added of Large Scale Manufacturing Industries
Present base: 1999-2000 Frequency: monthly/annual No. of items covered: 100 Weight covered: 75.08% of the total value added
� Qn �
Quantum Index of Large Scale Manufacturing Industries (QIM)
Sources of Data � Oil Companies Advisory Committee (OCAC),
� Ministry of Industries & Production and
� Provincial Bureaus of Statistics
Formula used: Laspeyer’s ∑ � � x Wi Sources No of Items Weight
Where In = � Qo � X 100
∑ Wi OCAC 11 5.2320
In = Index for the nth period,
Qn = Quantity of an item in the nth period (current period),
Wi = Weight of ith item value in base period, ∑ Wi = Total weights of 100 items
9
MO Ind.
BOS ALL
35
54
100
44.4457
25.3973
75.075
10
Slide 11 Slide 12
Scope
Survey of Small Scale & Household Manufacturing Industries (SHMI)
Survey of Small Scale & Household Manufacturing Industries (SHMI)
Frequency
SHMI covers all un-registered household units & small establishments engaged in manufacturing activities having less than 10 employees.
Objective SHMI measures production and structural changes in small scale manufacturing establishments and household manufacturing units. It provides data on employment and employment cost, input and output value, value added in the small scale manufacturing sector
Conducted every ten years Growth Rate Inter census growth rate of value added is worked out for the purpose of GDP which is applied constantly till next survey Survey conducted for rebasing in 1999-2000 estimated growth rate at 7.51 % which is being applied to work out gross value added for Small Scale Manufacturing sector since 1999-2000
11 12

2nd Users -Producers Workshop on Col laborat ion among Data Compi lers & Users
73
Slide 13 Slide 14
Limitations
ƒ CMI data is collected by Provincial Directorates of
Industries through mail enquiry resulting in poor response and longer time in retrieval of schedules
ƒ Manpower, Transport &Computing equipment constraints being
faced by Provincial Bureaus and Directorates of Industries
ƒ Frame of the manufacturing establishments, developed by Provincial Directorates of Labour, need improvement
Plan for Improvement Need to develop a business register, which should:
™ be continuously updated ™ cover all private & public economic activities ™ classify the economic activities ™ comprise some main economic quantities like No. of
Employees, Capacity, Annual Sales, etc
Crucial point will be the provision & updation of addresses and other relevant data by public & private sector establishments on regular basis
13 14
2nd Users -Producers Workshop on Co l laborat ion among Data Co mpi l er s & Users
74
TTeecchhnniiccaall SSeessssiioonn oonn MMiisscceellllaanneeoouuss SSeeccttoorr
SSeessssiioonn SSuummmmaarryy The purpose of this session was to review the scope, coverage, compilation methodologies of the
statistics produced by the Provincial Bureaus and Security Exchange Commission of Pakistan.
Mr. Ali. Rehman, Director, Security Exchange Commission of Pakistan (SECP) gave a
presentation on the statistics compiled by SECP. Mr. Shamim Rafique, Deputy Director of
Punjab Bureau of Statistics (PBS) gave a presentation on the statistics compiled by Provincial
Bureaus of Statistics.
After the introduction of SECP, Mr. Ali Rehman explained that SECP compiles data of over
48,000 companies registered with SECP. Mr. Ali explained about the characteristics and utility
of Corporate Registration and Ensures Compliance (CRCS), which is the largest database of
companies at the SECP. He said stakeholders of SECP data are mostly from government
organizations, ministries, researchers, private companies, individuals, and students.
Mr. Shamim made detailed presentation on the various statistics compiled by PBS. At the outset,
he discussed the historical background of the bureaus. He then detailed the activities currently
undertaken by the provincial bureaus. He said Provincial Bureaus of Statistics are both data users
as well as data producers. Provinces also conduct CMI on adhoc basis under the Industrial
Statistics Act 1942, census of education institutions in Punjab. The data are released by
provincial bureaus through their regular and adhoc publications. At the end, he gave details
about the publications/reports of the PBS.
Concluding the session, Dr. Faqir Muhammad, Chairman Mathematics & Statistics Department
of Allama Iqbal Open University said that the quality of data could be improved by means of
random checks and by doing pre-analysis and post-analysis. He emphasized on close
coordination between the Federal Bureau of Statistics and Provincial Bureaus of Statistics
because the functions and responsibilities taken by all the Provincial Bureaus of Statistics are
more or less the same but the compilation methodologies of the statistics of the same area may
vary significantly. At the end he suggested all the Provincial Bureaus of Statistics to work under
the umbrella / framework of FBS to avoid duplication.
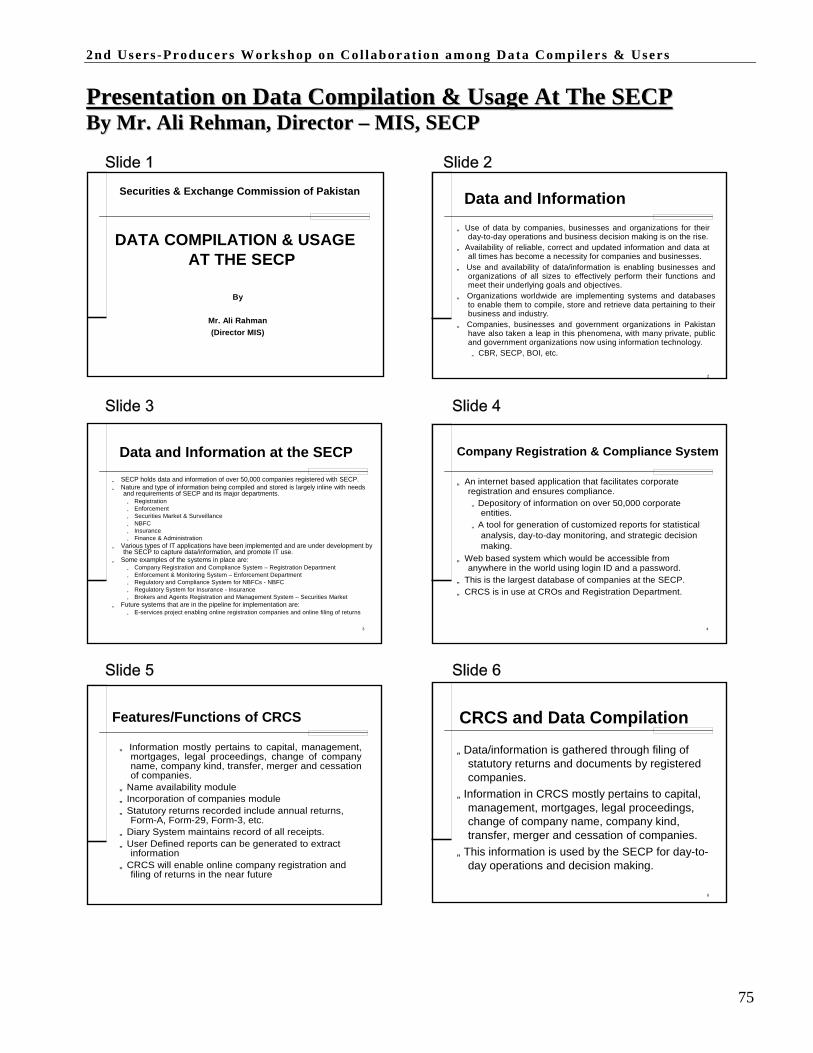
2nd Users -Producers Workshop on Col laborat ion among Data Compi lers & Users
75
PPrreesseennttaattiioonn oonn DDaattaa CCoommppiillaattiioonn && UUssaaggee AAtt TThhee SSEECCPP BByy MMrr.. AAllii RReehhmmaann,, DDiirreeccttoorr –– MMIISS,, SSEECCPP
Slide 1 Slide 2
Securities & Exchange Commission of Pakistan
DATA COMPILATION & USAGE AT THE SECP
By
Mr. Ali Rahman (Director MIS)
Data and Information „ Use of data by companies, businesses and organizations for their
day-to-day operations and business decision making is on the rise. „ Availability of reliable, correct and updated information and data at
all times has become a necessity for companies and businesses. „ Use and availability of data/information is enabling businesses and
organizations of all sizes to effectively perform their functions and meet their underlying goals and objectives.
„ Organizations worldwide are implementing systems and databases to enable them to compile, store and retrieve data pertaining to their business and industry.
„ Companies, businesses and government organizations in Pakistan have also taken a leap in this phenomena, with many private, public and government organizations now using information technology.
„ CBR, SECP, BOI, etc.
2
Slide 3 Slide 4
Data and Information at the SECP
„ SECP holds data and information of over 50,000 companies registered with SECP. „ Nature and type of information being compiled and stored is largely inline with needs
and requirements of SECP and its major departments. „ Registration „ Enforcement „ Securities Market & Surveillance „ NBFC „ Insurance „ Finance & Administration
„ Various types of IT applications have been implemented and are under development by the SECP to capture data/information, and promote IT use.
„ Some examples of the systems in place are: „ Company Registration and Compliance System – Registration Department „ Enforcement & Monitoring System – Enforcement Department „ Regulatory and Compliance System for NBFCs - NBFC „ Regulatory System for Insurance - Insurance „ Brokers and Agents Registration and Management System – Securities Market
„ Future systems that are in the pipeline for implementation are: „ E-services project enabling online registration companies and online filing of returns
Company Registration & Compliance System „ An internet based application that facilitates corporate
registration and ensures compliance. „ Depository of information on over 50,000 corporate
entities. „ A tool for generation of customized reports for statistical
analysis, day-to-day monitoring, and strategic decision making.
„ Web based system which would be accessible from anywhere in the world using login ID and a password.
„ This is the largest database of companies at the SECP. „ CRCS is in use at CROs and Registration Department.
3 4
Slide 5 Slide 6 Features/Functions of CRCS
„ Information mostly pertains to capital, management,
mortgages, legal proceedings, change of company name, company kind, transfer, merger and cessation of companies.
„ Name availability module „ Incorporation of companies module „ Statutory returns recorded include annual returns,
Form-A, Form-29, Form-3, etc. „ Diary System maintains record of all receipts. „ User Defined reports can be generated to extract
information „ CRCS will enable online company registration and
filing of returns in the near future
CRCS and Data Compilation „ Data/information is gathered through filing of
statutory returns and documents by registered companies.
„ Information in CRCS mostly pertains to capital, management, mortgages, legal proceedings, change of company name, company kind, transfer, merger and cessation of companies.
„ This information is used by the SECP for day-to- day operations and decision making.
6
2nd Users -Producers Workshop on Col laborat ion among Data Compi lers & Users
76
Slide 7 Slide 8 Users and Compilers of SECP Data
„ Users and stakeholders of SECP data range from
government organizations and ministries to individuals and private companies.
„ To better facilitate data use, SECP is providing specific data to various organizations upon their request. Our eight company registration offices are providing data to organizations like Board of Investment, State Bank of Pakistan and CBR on monthly basis. Similar data is also provided to other users upon their request.
„ However, apart from government organizations like CBR, SBP, BOI and Federal Bureau of Statistics, data is also given to private companies, individuals, and students.
Thank You
Questions & Comments
7
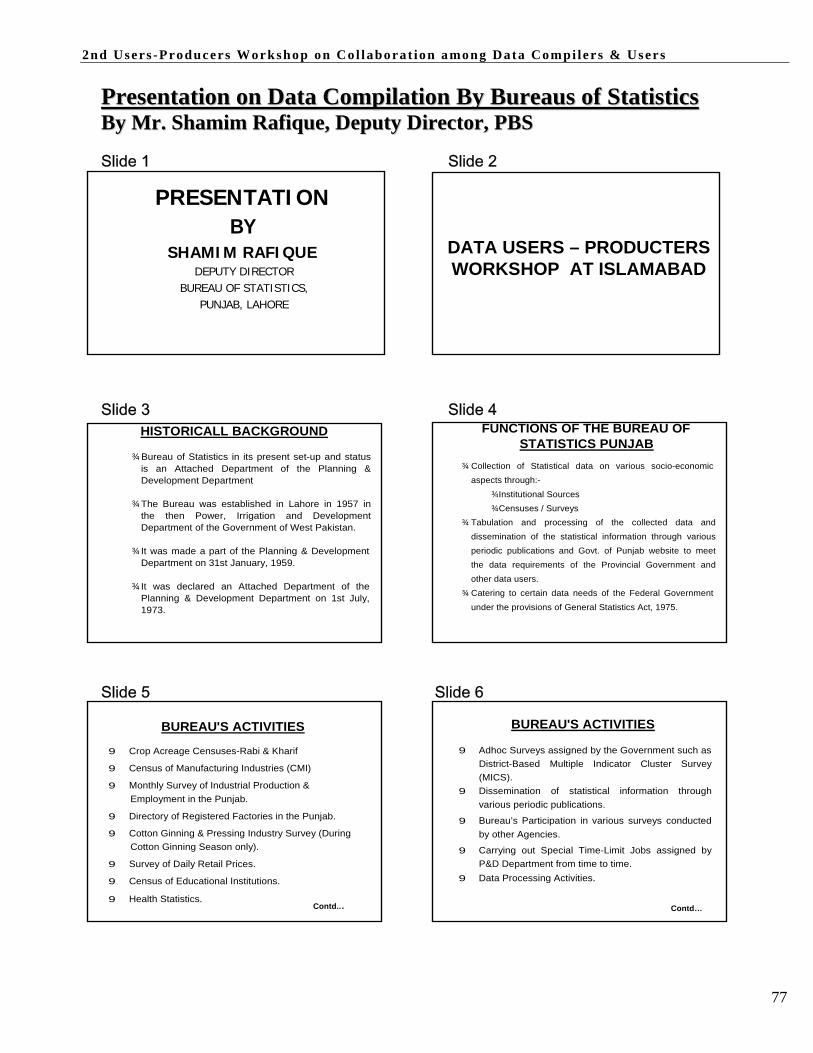
2nd Users -Producers Workshop on Col laborat ion among Data Compi lers & Users
77
PPrreesseennttaattiioonn oonn DDaattaa CCoommppiillaattiioonn BByy BBuurreeaauuss ooff SSttaattiissttiiccss BByy MMrr.. SShhaammiimm RRaaffiiqquuee,, DDeeppuuttyy DDiirreeccttoorr,, PPBBSS
Slide 1 Slide 2
PRESENTATION BY
SHAMIM RAFIQUE DEPUTY DIRECTOR
BUREAU OF STATISTICS, PUNJAB, LAHORE
DATA USERS – PRODUCTERS WORKSHOP AT ISLAMABAD
Slide 3 Slide 4
HISTORICALL BACKGROUND
¾ Bureau of Statistics in its present set-up and status is an Attached Department of the Planning & Development Department
¾ The Bureau was established in Lahore in 1957 in
the then Power, Irrigation and Development Department of the Government of West Pakistan.
¾ It was made a part of the Planning & Development
Department on 31st January, 1959.
¾ It was declared an Attached Department of the Planning & Development Department on 1st July, 1973.
FUNCTIONS OF THE BUREAU OF STATISTICS PUNJAB
¾ Collection of Statistical data on various socio-economic
aspects through:- ¾Institutional Sources ¾Censuses / Surveys
¾ Tabulation and processing of the collected data and dissemination of the statistical information through various periodic publications and Govt. of Punjab website to meet the data requirements of the Provincial Government and other data users.
¾ Catering to certain data needs of the Federal Government under the provisions of General Statistics Act, 1975.
Slide 5 Slide 6
BUREAU'S ACTIVITIES BUREAU'S ACTIVITIES
9 Crop Acreage Censuses-Rabi & Kharif
9 Census of Manufacturing Industries (CMI)
9 Monthly Survey of Industrial Production & Employment in the Punjab.
9 Directory of Registered Factories in the Punjab.
9 Cotton Ginning & Pressing Industry Survey (During Cotton Ginning Season only).
9 Survey of Daily Retail Prices.
9 Census of Educational Institutions.
9 Health Statistics.
9 Adhoc Surveys assigned by the Government such as
District-Based Multiple Indicator Cluster Survey (MICS).
9 Dissemination of statistical information through various periodic publications.
9 Bureau’s Participation in various surveys conducted by other Agencies.
9 Carrying out Special Time-Limit Jobs assigned by P&D Department from time to time.
9 Data Processing Activities.
Contd... Contd…
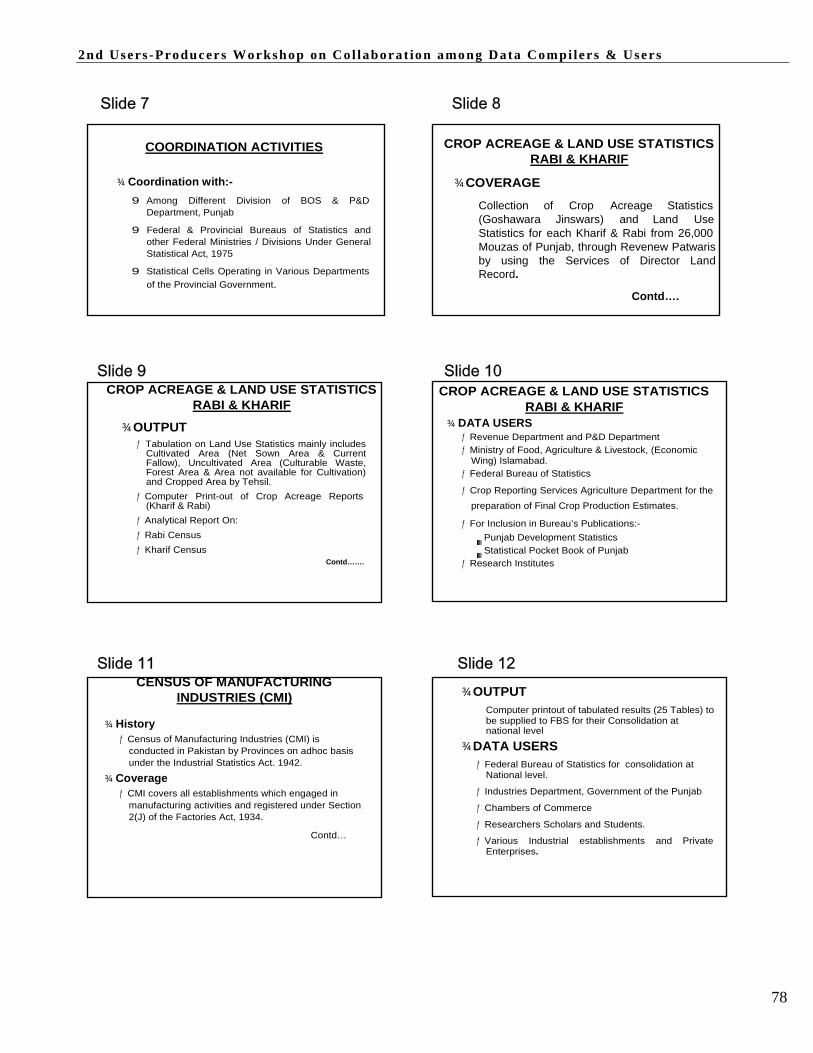
2nd Users -Producers Workshop on Col laborat ion among Data Compi lers & Users
78
Slide 7 Slide 8
COORDINATION ACTIVITIES
¾ Coordination with:-
9 Among Different Division of BOS & P&D
Department, Punjab
9 Federal & Provincial Bureaus of Statistics and other Federal Ministries / Divisions Under General Statistical Act, 1975
9 Statistical Cells Operating in Various Departments of the Provincial Government.
CROP ACREAGE & LAND USE STATISTICS RABI & KHARIF
¾ COVERAGE
Collection of Crop Acreage Statistics (Goshawara Jinswars) and Land Use Statistics for each Kharif & Rabi from 26,000 Mouzas of Punjab, through Revenew Patwaris by using the Services of Director Land Record.
Contd….
Slide 9 Slide 10 CROP ACREAGE & LAND USE STATISTICS
RABI & KHARIF
¾ OUTPUT ƒ Tabulation on Land Use Statistics mainly includes
Cultivated Area (Net Sown Area & Current Fallow), Uncultivated Area (Culturable Waste, Forest Area & Area not available for Cultivation) and Cropped Area by Tehsil.
ƒ Computer Print-out of Crop Acreage Reports (Kharif & Rabi)
ƒ Analytical Report On: ƒ Rabi Census ƒ Kharif Census
Contd…….
CROP ACREAGE & LAND USE STATISTICS RABI & KHARIF
¾ DATA USERS ƒ Revenue Department and P&D Department ƒ Ministry of Food, Agriculture & Livestock, (Economic
Wing) Islamabad. ƒ Federal Bureau of Statistics
ƒ Crop Reporting Services Agriculture Department for the preparation of Final Crop Production Estimates.
ƒ For Inclusion in Bureau’s Publications:- Punjab Development Statistics Statistical Pocket Book of Punjab
ƒ Research Institutes
Slide 11 Slide 12 CENSUS OF MANUFACTURING
INDUSTRIES (CMI)
¾ History ƒ Census of Manufacturing Industries (CMI) is
conducted in Pakistan by Provinces on adhoc basis under the Industrial Statistics Act. 1942.
¾ Coverage ƒ CMI covers all establishments which engaged in
manufacturing activities and registered under Section 2(J) of the Factories Act, 1934.
Contd…
¾ OUTPUT Computer printout of tabulated results (25 Tables) to be supplied to FBS for their Consolidation at national level
¾ DATA USERS ƒ Federal Bureau of Statistics for consolidation at
National level.
ƒ Industries Department, Government of the Punjab
ƒ Chambers of Commerce
ƒ Researchers Scholars and Students.
ƒ Various Industrial establishments and Private Enterprises.

2nd Users -Producers Workshop on Col laborat ion among Data Compi lers & Users
79
Slide 13 Slide 14CENSUS OPRATIONS
¾ FEDERAL BUREAU OF STATISTICS (FBS)
Planning, Preparation of Questionnaire, Tabulation plan , Editing & Preparation of CMI Results at National Level.
¾ Provincial Directorates of Industries Printing and Mailing out of the questionnaires to the factories. Collection of CMI Returns from the factories and their supply to the Provincial Bureau of Statistics for processing of the data.
¾ Provincial Bureau of Statistics Classification, editing and coding of CMI Returns. Computer processing of CMI Returns and supplying the results to the Federal Bureau of Statistics.
¾ Provincial Directorates of Labour Welfare • Registration of factories under the factories Act, 1934 and supply
of updated list of factories to the Provincial Directorates of Industries for conduct of CMI.
MONTHLY SURVEY OF INDUSTRIAL PRODUCTION & EMPLOYMENT
¾ HISTORY
This Mail enquiry started in 1971 to cover the time lag of Census of Manufacturing Industries (CMI).
¾ COVERAGE
Collection of current information on industrial production and employment from about 2200 factories belonging to 47 important industries and 99 items that contributes 70% of the total value added of the Large- Scale Manufacturing Sector in the Punjab.
Contd….
Slide 15 Slide 16
¾ OUTPUT Monthly Report on the Survey of Industrial production & Employment containing the detailed Performance reports on the following industries:-
¾ DATA USERS
ƒ Planning & Development Department Government of the Punjab.
ƒ Industries Department, Government of the Punjab • Cotton Textiles • Vegetable Ghee • Beverages • Cement • Footwear • Paper & Paper Board • Pharmaceuticals
• Woolen Textile • Sugar • Cigarettes • Fertilizers • Leather Tanning • Light Engineering
Contd..
ƒ Federal Bureau of Statistics for measuring the
industrial growth through Quantum Index of Manufacturing (QIM).
ƒ Researchers Scholars and Students. ƒ Various Industrial establishments and Private
Enterprises.
Slide 17 Slide 18 DIRECTORY OF REGISTERED
FACTORIES The Directorate of Labour Welfare, Punjab is responsible for registration and de-registration of the factories under the Factories Act, 1934. The Bureau prepares a Directory of Registered Factories in the Punjab and keeps it updated. The Directory contains information on factories listed district/tehsil and industry-wise, arranged alphabetically under each industry. The Directory also contains the information on fixed assets size and employment size etc. This directory supplemented with the latest information available with the Directorate of Industries is used as a Frame for the CMI. Directory of Registered Factories is released annually.
CENSUS OF EDUCATIONAL INSTITUTIONS ¾ Coverage
About one thousand Inter / Degree (Arts & Science) Colleges/Higher Secondary Schools and 319 Professional Colleges, Poly Technical Institutes, Colleges of Technology, Commercial Training Institutes, Teacher’s Training Institutes, Vocational Institutes and Universities etc.
Contd….

2nd Users -Producers Workshop on Col laborat ion among Data Compi lers & Users
80
Slide 19 Slide 20
¾ OUTPUT ƒ Publication on statistics of Intermediate and
Degree colleges in the Punjab.
• Name and address of Institution. • Teaching staff strength. • Class-wise enrolment
¾ DATA USERS ƒ P&D Department Government of the Punjab. ƒ Education Department, Government of the
Punjab. ƒ Researchers Scholars and Students.
ƒ For Inclusion in Bureau’s Publications:-
• Punjab Development Statistics • Statistical Pocket Book of Punjab
SURVEY OF DAILY RETAIL PRICES ¾ COVERAGE
Collection of Daily Retail Prices of 63 Consumable Kitchen Items as prevailing in selected localities of eight big cities i.e Lahore, Rawalpindi, Sargodha, Gujranwala, Faislabad, Multan, Bahawalpur & D.G. Khan.
¾ OUTPUT ƒ Daily & Fortnightly Price Situation Reports ƒ Monthly Prices Report ƒ Annual Prices Situation Report ƒ Special Briefs on Price Situation
Slide 21 Slide 22
¾ DATA USERS
ƒ Secretary, Punjab Prices and Supply Board
ƒ Secretary, Livestock and Dairy Development, Punjab
ƒ Director of Industries, Punjab
ƒ Planning & Development Department, Punjab
ƒ For Inclusion in Bureau’s Publications:-
• Punjab Development Statistics
• Statistical Pocket Book of Punjab
ƒ Research Institutes
HEALTH STATISTICS ¾ COVERAGE
ƒ Collection of Data from Six thousand Health Institutions viz Hospitals, Dispensaries, Rural Health Centres, Basic Health Units, Sub Health Centres, T.B. Clinic & Maternity/ Child Health Centres Administrated by the Health Department, Home Department, Auqaf Department, District Governments, Pakistan Railways, WAPDA & Punjab Employees Social Security Institutions.
ƒ Medical and Para Medical Staff from Pakistan Medical and Dental Council and Pakistan Nursing Council, Islamabad.
Contd….
Slide 23 Slide 24
¾ OUTPUT
ƒ Situation on Bed Strength, Patient Treated by Tehsils/ Districts in Punjab
ƒ Total Number of Doctors in Punjab
ƒ Total Number of Nurses and LHV’s in Punjab
ƒ Indicators Regarding Number of Doctors, Nurses per thousand population in Punjab.
Contd….
¾ DATA USERS
ƒ For Inclusion in Bureau’s Publications:-
• Punjab Development Statistics • Statistical Pocket Book of Punjab • Brochure “Punjab in Figures
ƒ Planning & Development Department ƒ Health Department, Punjab ƒ Research Institutes
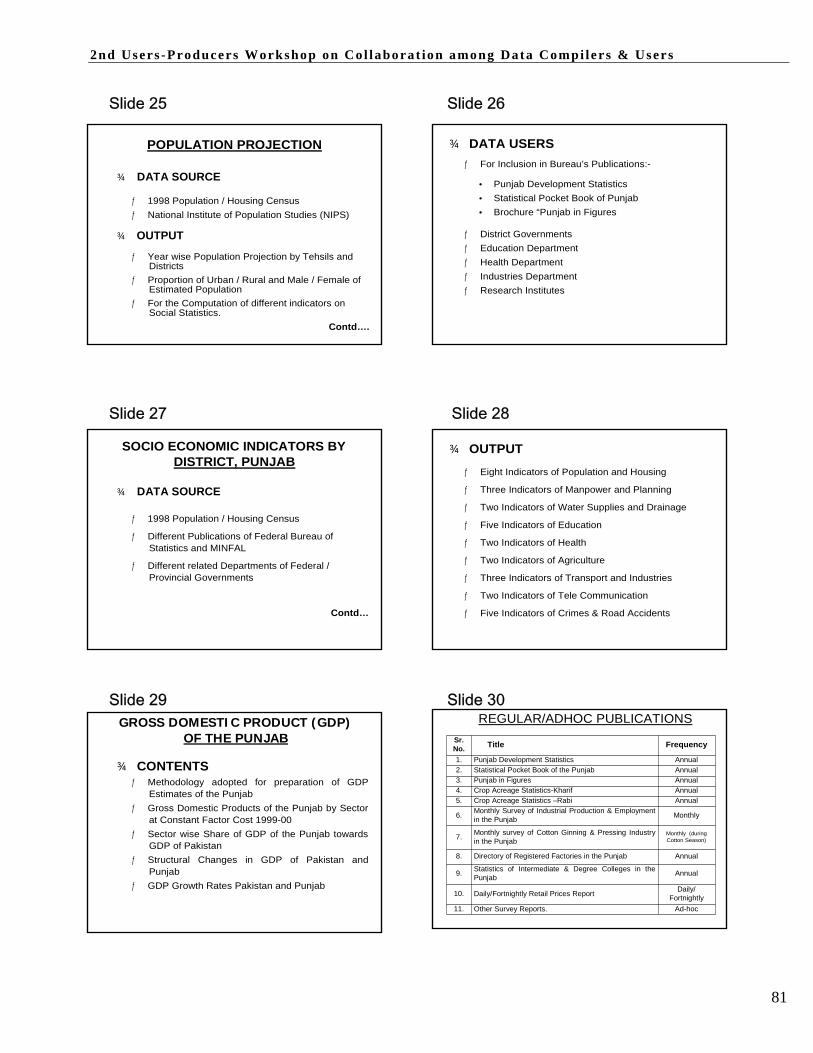
2nd Users -Producers Workshop on Col laborat ion among Data Compi lers & Users
81
Slide 25 Slide 26
POPULATION PROJECTION
¾ DATA SOURCE
ƒ 1998 Population / Housing Census ƒ National Institute of Population Studies (NIPS)
¾ OUTPUT
ƒ Year wise Population Projection by Tehsils and
Districts ƒ Proportion of Urban / Rural and Male / Female of
Estimated Population ƒ For the Computation of different indicators on
Social Statistics.
¾ DATA USERS
ƒ For Inclusion in Bureau’s Publications:-
• Punjab Development Statistics • Statistical Pocket Book of Punjab • Brochure “Punjab in Figures
ƒ District Governments ƒ Education Department ƒ Health Department ƒ Industries Department ƒ Research Institutes
Contd….
Slide 27 Slide 28
SOCIO ECONOMIC INDICATORS BY DISTRICT, PUNJAB
¾ DATA SOURCE
ƒ 1998 Population / Housing Census
ƒ Different Publications of Federal Bureau of
Statistics and MINFAL
ƒ Different related Departments of Federal / Provincial Governments
Contd…
¾ OUTPUT
ƒ Eight Indicators of Population and Housing
ƒ Three Indicators of Manpower and Planning
ƒ Two Indicators of Water Supplies and Drainage
ƒ Five Indicators of Education
ƒ Two Indicators of Health
ƒ Two Indicators of Agriculture
ƒ Three Indicators of Transport and Industries
ƒ Two Indicators of Tele Communication
ƒ Five Indicators of Crimes & Road Accidents
Slide 29 Slide 30 GROSS DOMESTIC PRODUCT (GDP) REGULAR/ADHOC PUBLICATIONS
OF THE PUNJAB
¾ CONTENTS ƒ Methodology adopted for preparation of GDP
Estimates of the Punjab ƒ Gross Domestic Products of the Punjab by Sector
at Constant Factor Cost 1999-00 ƒ Sector wise Share of GDP of the Punjab towards
GDP of Pakistan ƒ Structural Changes in GDP of Pakistan and
Punjab ƒ GDP Growth Rates Pakistan and Punjab
Sr. No. 1. 2. 3. 4. 5.
6.
7. 8.
9. 10. 11.
Title
Punjab Development Statistics Statistical Pocket Book of the Punjab Punjab in Figures Crop Acreage Statistics-Kharif Crop Acreage Statistics –Rabi Monthly Survey of Industrial Production & Employment in the Punjab
Monthly survey of Cotton Ginning & Pressing Industry in the Punjab
Directory of Registered Factories in the Punjab
Statistics of Intermediate & Degree Colleges in the Punjab Daily/Fortnightly Retail Prices Report Other Survey Reports.
Frequency
Annual Annual Annual Annual Annual
Monthly Monthly (during Cotton Season)
Annual
Annual
Daily/ Fortnightly
Ad-hoc
2nd Users -Producers Workshop on Col laborat ion among Data Compi lers & Users
82
Slide 31 Slide 32
WEBSITE FOR DATA USERS
www.punjab.gov.pk - Miscellaneous –
Punjab Statistics
THANKS
2nd Users -Producers Workshop on Co l laborat ion among Data Co mpi l er s & Users
83
PPlleennaarryy GGrroouupp RReeccoommmmeennddaattiioonnss’’
SSeessssiioonn SSuummmmaarryy During this session, all participants of the workshop were distributed in five groups according to
the areas of their interest to review the scope, coverage, compilation methodologies of the data
presented in the workshop and to prepare recommendations for further improving the quality and
scope of data and to enhance coordination among data compilers and users. Dr. Khattak
emphasized on the importance of the users’ feedback / recommendations, which will be used for
improving both the quality of statistics and interaction among the data compiling agencies, users
and data providers. These recommendations / suggestions would also help for improvement in
the overall statistical system of the country.
Mr. Bernd Struck, Advisor to FBS suggested that FBS should constitute District Price Control
Committees for collection of price data for CPI. Mr. Struck pointed out that many countries
prepare regional GDP estimates but it is not advisable for Pakistan at this stage to compile
Regional / Provincial GDP. He rather recommended to start compiling GDP on quarterly basis.
The quarterly figures should however match with the annual figures and there should be
harmonisation between these accounts. This should be reconciled using the same methods, same
concepts and so on. Mr. Struck suggested quarterly accounts after rebasing or revision of the
national accounts.
RReeccoommmmeennddaattiioonnss ffoorr EExxtteerrnnaall SSeeccttoorr 1. Export data under the head of “others”, where a large number of products are clubbed
together, to be disaggregated at the HS 10 digit level with commodity descriptions so that
a huge amount shown into the ‘other classification’ can be extended into individual
classification. Further, for making HS adjustments in Pakistan, CBR may be asked to
involve all stakeholders like FBS, SBP and EPB to extend or merge the codes because all
stakeholders using same classification developed by CBR.
2. To improve the quality of data on Workers Remittances, differentiation should be
distinguished clearly between worker’s remittances and compensation of employees.
3. The SECP shall provide information on companies having foreign participation and keep
an updated record of them to help facilitate compilation of FDI, FPI and Other
Investments.
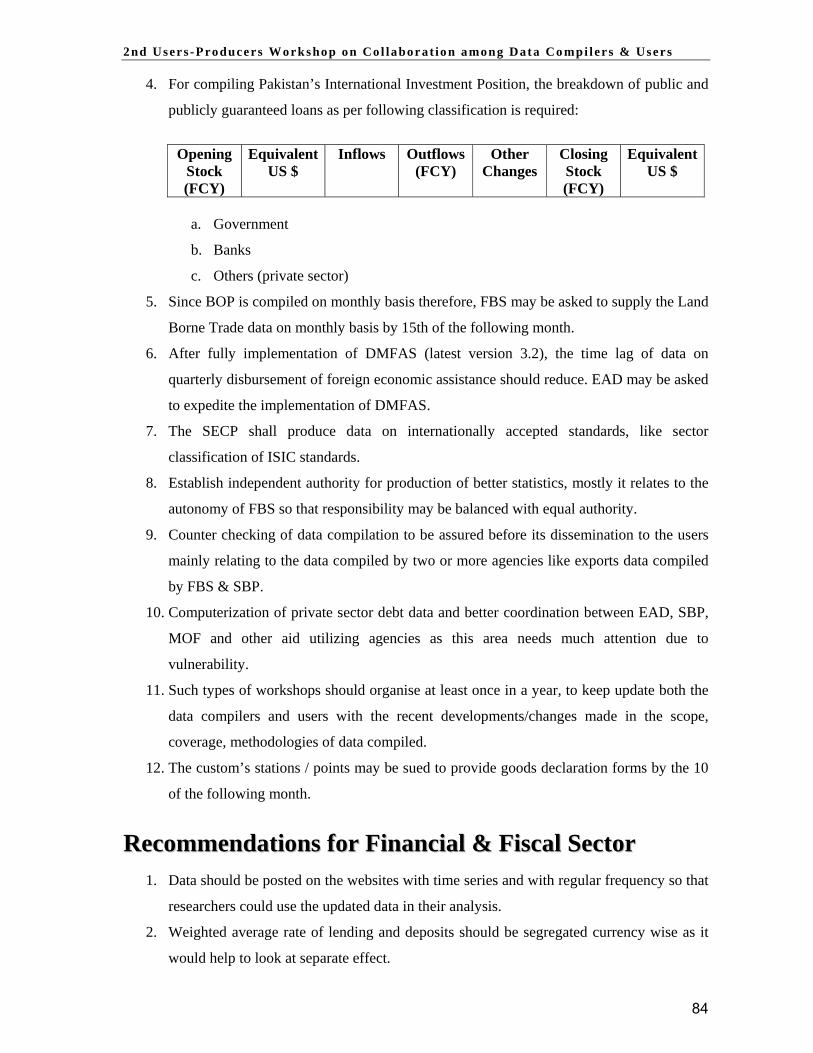
2nd Users -Producers Workshop on Co l laborat ion among Data Co mpi l er s & Users
84
4. For compiling Pakistan’s International Investment Position, the breakdown of public and
publicly guaranteed loans as per following classification is required:
Opening Stock (FCY)
Equivalent US $
Inflows Outflows(FCY)
Other Changes
Closing Stock (FCY)
EquivalentUS $
a. Government
b. Banks
c. Others (private sector)
5. Since BOP is compiled on monthly basis therefore, FBS may be asked to supply the Land
Borne Trade data on monthly basis by 15th of the following month.
6. After fully implementation of DMFAS (latest version 3.2), the time lag of data on
quarterly disbursement of foreign economic assistance should reduce. EAD may be asked
to expedite the implementation of DMFAS.
7. The SECP shall produce data on internationally accepted standards, like sector
classification of ISIC standards.
8. Establish independent authority for production of better statistics, mostly it relates to the
autonomy of FBS so that responsibility may be balanced with equal authority.
9. Counter checking of data compilation to be assured before its dissemination to the users
mainly relating to the data compiled by two or more agencies like exports data compiled
by FBS & SBP.
10. Computerization of private sector debt data and better coordination between EAD, SBP,
MOF and other aid utilizing agencies as this area needs much attention due to
vulnerability.
11. Such types of workshops should organise at least once in a year, to keep update both the
data compilers and users with the recent developments/changes made in the scope,
coverage, methodologies of data compiled.
12. The custom’s stations / points may be sued to provide goods declaration forms by the 10
of the following month.
RReeccoommmmeennddaattiioonnss ffoorr FFiinnaanncciiaall && FFiissccaall SSeeccttoorr 1. Data should be posted on the websites with time series and with regular frequency so that
researchers could use the updated data in their analysis.
2. Weighted average rate of lending and deposits should be segregated currency wise as it
would help to look at separate effect.

2nd Users -Producers Workshop on Co l laborat ion among Data Co mpi l er s & Users
85
3. Basic secondary market data such as secondary market T-bills rates, KIBOR, Forward
rates along with time series should be posted in user-friendly format on website, to make
it available for the users.
4. Explanatory notes to the Data Tables be provided to enhance the utility and
understanding of the data to the users as they are uncomfortable without notes.
5. Micro level data dealing with data on various sectors relating to financing / disbursement
against particular crops be collected and made available, since it is very helpful in
determining the macro environment for credit requirements.
6. Search engines of various organizations do not provide for the needs of the data miners
(visitors). It would facilitate the users to search related data.
7. Wholesale market prices for crops like seed cotton (phutty) and sugarcane should also be
provided so that the difference between the support price and the market (mill gate)
become significant.
8. Harmonized classification with ISIC economic activity classification should be used for
the sectors classification of the registered companies with SECP, to make useful in
integrating data compilations.
RReeccoommmmeennddaattiioonnss ffoorr SSoocciioo--ddeemmooggrraapphhiicc SSeeccttoorr The group has deliberated on the presentations made on Social and Demographic Sector. We
make the following recommendations based on our group discussion:
1. Surveys conducted by NIPS should not confine only to Mortality and Fertility but cover
issues like migration, environmental that closely relate to health and population.
2. The peculiar indicators and variables pertaining to education is another important factor
that must be considered while designing different surveys on social & demographic
issues
3. Producers should consult each other in order to avoid duplication e.g., FBS, NIPS
both collect information on fertility & mortality which confuses the researchers with
different results.
4. NADRA should just give the figures and it should not release literacy rate etc because it
is not a data producing authority and it had issued cards less than 70%. NADRA is
performing the job of registering the people, which may not cater to the needs of
researchers.
5. Panel data should be released because for researchers it could produce more meaningful
results to suggest future policies regarding these social & demographic issues.

2nd Users -Producers Workshop on Co l laborat ion among Data Co mpi l er s & Users
86
6. Keeping in view the importance of PIHS / HIES being important sources of
information, the presentations on these surveys should be given to users.
7. The definitions adopted by the Labour Force Survey (LFS) being conducted by
FBS and Population and Housing Census, respectively, are different in reference to their
concept / methodology therefore giving the different labour force participation rate i.e.,
Employment/Unemployment rates. Therefore it was observed and agreed that one
definition of labour force may be used in the labour force survey and Population &
Housing Census.
8. The definition of labour is not aligned with the international accepted standards. In
Pakistan, 15 years age is considered as labour whereas internationally accepted age for
labour is 18 years and above.
RReeccoommmmeennddaattiioonnss oonn RReeaall SSeeccttoorr 1. FBS is preparing quarterly GDP estimates. The quarterly figures should match with the
annual figures, there should be some harmonisation between national accounts and
quarterly accounts and they should be reconciled using the same methods and concepts. It
is recommended to come up with quarterly accounts not before the next rebasing or
revision of national accounts.
2. The crops estimates are received from crops reporting services and there is a need to
review its compilation methodologies. In the next workshop, Crops Reporting
Directorates of Provinces may arrange a presentation. This would enlighten in detail
about the primary data collection of crops.
3. Agriculture Credit Disbursement Data should be provided by SBP on quarterly basis and
District wise so that credit disparities should be highlighted/addressed.
4. The format of quarterly reports of the companies registered with SECP should be
designed in a way that caters the requirements of National Accounts. This would help
FBS to prepare the National Accounts data and reduce the cost and time involved.
5. Quality of data especially from the manufacturing establishment is very poor. Therefore,
the provincial / local governments should legally bind / force the establishments to
provide the data adequately and timely.
6. For adequate data of manufacturing, the provincial departments of labour should ask to
make a presentation on Census of Manufacturing Industries.
7. It is observed that the Federal / Provincial Bureaus of Statistics are not adequately
manned. Therefore, these organizations must be strengthened adequately.
2nd Users -Producers Workshop on Co l laborat ion among Data Co mpi l er s & Users
87
8. FBS should be representative of the District Price Control Committees to share the
information. Currently, there is not any District Price Control Committees in Pakistan.
RReeccoommmmeennddaattiioonnss oonn MMiisscceellllaanneeoouuss SSeeccttoorr 11)) DDaattaa CCoommppiilleerr SSiiddee
1. There is a need of standardization of terminology, tools and techniques used in the
compilation of data. There should be a strong coordination among the data compilers to
avoid duplication of data thus producing more reliable and quality data.
2. Timely dissemination of data to the potential users.
3. The design of the survey should base on modern sampling techniques.
4. There is an ample need for compilation of qualitative data to arrive at sensitive indicators.
5. Due to the rapid changes locally and internationally, the statistical act 1975 needs to be
review and updating.
22)) DDaattaa UUsseerr SSiiddee
1. Appropriate interaction between the compilers and users is required.
2. There is need of proper feedback from data users to the data compilers.
3. The data users and researchers must understand the fundamental purpose and objectives
based on which data collected.
4. Data users want consistency in data (while making time series analysis) which must be
ensured.
33)) WWoorrkksshhoopp SSiiddee
1. Some case studies should take up during workshop so that the real analytical problems in
the data could be identified.
2. Participation of all the stakeholders should be ensured.
3. The existing time-period for this kind of good initiative was not sufficient.
4. To enhance the interest of the potential participants, competitive remuneration should be
granted as it happens in other energetic organizations.
2nd Users -Producers Workshop on Co l laborat ion among Data Co mpi l er s & Users
88
CCoommmmeennttss ooff tthhee PPaarrttiicciippaannttss 1. The basis of formula used in the publications should be given with sufficient
explanations.
2. It was a good effort to organise such type of workshop as it gave us other aspects of
statistical data. The workshop should be organised on regular basis, to give an
opportunity to different organisations to interact each other. These workshops may be
organised at all provincial capital cities to give opportunities for stakeholders of these
cities.
3. Data should be collected from all segments of population including rural population.
4. The functions of Provincial Bureaus of Statistics should be formulated to work under the
umbrella of Federal Bureau of Statistics. The coordination between the Provincial
Bureaus of Statistics and Federal Bureau Statistics should be enhanced and if there are
certain functions, which are overlapping, then they should merge. Further to improve the
quality and comprehension of data, the FBS and other data providing agencies should
also discuss the methodologies used to prepare the results/estimates so that the user may
use the results in the same context. Further, it has been seen that the guides provided with
the questionnaires for collection of data by various data collecting agencies (like FBS)
are usually not clear or these are restricted to certain examples. These guidelines should
be clear so that the source may provide accurate data.
5. Data on social sector may be included. Several other variables, which are the better
indicators of development such as health, environmental and other socio-economic
conditions, should be included.
6. Data on financial sector as well as other sectors of economy should be made available at
micro level. In recent years, regulatory reforms in various sectors have developed the
interests of both policymakers and academia to analyse the impact of these measures on
the performance of the firms. For example, data on utilities sector is not available for the
analysis of these entities’ performance to subset the future measures to enhance the
performance of these individual firms on incentive basis etc.
7. The main benefits of such workshops are that the participants get chance to share their
ideas among all the participants and as well as the interaction of different departments
working on data and the data collection agencies.
8. There is a need to review the methodology of data collection and compilation. Classical
methods should be replaced by advance methods. Capacity building programs should be
arranged for data compilers.
2nd Users -Producers Workshop on Co l laborat ion among Data Co mpi l er s & Users
89
9. Socio-demographic data like population, provision of facilities to the people, provision of
drinkable water, food, cloths etc should be collected properly. Besides population census
data relating to other social sectors like health, environment, diseases, availability of
facilities to the public should also be collected and all the facilities should be provided.
10. The workshop provided a forum to collaborate data compilers & users in order to make
recommendations for achieving the prime objectives of quality statistics. It was an
excellent endeavour of SBP, which must continue.
11. IT and other new techniques should be used in collection, compilation, analysis and
dissemination of data in all sectors of the economy.
12. We should make our data compatible to that of international level (e.g. in terms of time
horizon) so that cross-country comparisons could be made.
13. Statistics on corruption, environmental activities, salaried class and real estate should be
included.
14. Data regarding all aspects are collected from cities and not from villages. Therefore, the
data collected in this way is not true and just a formality. This does not solve the purpose.
15. The participation of Data Users should increase to have maximum feedback in this
context. Private sector, government organisations and donors should also be invited at the
large scale. This type of workshop should be arranged every year.
16. Pakistan Statistical Year book 2005 covered data of 2004 – 2005. We as a researcher are
concerned with most updated data on current economic situation and this made it very
difficult to get data.
17. Frequent surveys for the services sector and more area coverage will make national
accounts more comprehensive.
18. CPI, WPI and SPI should cover most of the sectors and more income group extending
surveys to rural areas. As rural areas always are ignored for data collection etc.

2nd Users -Producers Workshop on Co l laborat ion among Data Co mpi l er s & Users
90
CClloossiinngg SSeessssiioonn
CClloossiinngg//CCoonncclluuddiinngg RReemmaarrkkss bbyy MMrr.. SSttrruucckk,, FFBBSS Mr. Bernd Struck, German Agency for Technical Cooperation (GTZ), Advisor to the Federal
Bureau of Statistics, chaired the closing session of the workshop. In his concluding remarks, he
referred to the Deputy State Bank Governor who in his introductory speech had encouraged the
participants of the workshop to get into cooperation with each other. Mr. Struck took the
conclusion that nobody disagrees that it was a good idea to hold this workshop as there is a lot of
statistics and even more data than the users expect. The various presentations may have fostered
transparency and mutual exchange of ideas.
Mr. Struck emphasized that providing statistics means to be in a production chain which does not
only involve SBP, the statistical offices and the users of statistics but the respondents, also. The
civil society of Pakistan and especially the enterprises should be aware of the fact that good
governance needs a profound data base for targeting and for decision taking and that respondents
have to provide their data for that purpose. The media should assist these efforts.
Mr. Struck also referred to Dr. Larik who earlier the day had demanded that we have to close the
gap between statistical science and statistical practice and that cooperation is the demand of time.
This would include applying harmonized classification throughout Pakistan’s set-up of official
and semi-official statistics. This would also mean that the specialist undertake all efforts to use a
language that the users understand. Official statistics have to give satisfactory meta data, viz data
about the data, and to give hints where the data can be found. The internet would be a very useful
tool for providing all this information.
Mr. Struck gave his comment to demands of regional Accounts. He urgently pleaded for
conducting regional Accounts and calculating regional GDP in a harmonized way using uniform
concepts agreed between and applied by all provinces. In ideal case there would be a working
group including the FBS to outline the concepts and to share the workload of a joint calculation
of provincial GDPs.
At the end, he thanked to those who have organised this workshop. He said many thanks to Dr.
Khattak & his team from Sate Bank for organising the seminar. He thanked to those who made
the presentations.

2nd Users -Producers Workshop on Co l laborat ion among Data Co mpi l er s & Users
91
NNoottee ooff TThhaannkkss bbyy DDiirreeccttoorr SSttaattiissttiiccss Mr. Kazi Abdul Muktadir, MD – INBAF, Distinguished guests, ladies and gentlemen.
First of all I would like to congratulate State Bank of Pakistan for successfully conducting this
workshop and providing this wonderful opportunity for the policy makers, planners,
professionals, researchers and generalists to benefit from the results and methodologies of data
compiling agencies. This workshop in particular has provided a forum where views were
exchanged and valuable feedback was provided to SBP/data compiling agencies to further
improve the quality and usefulness of the data.
This workshop has also provided better understanding regarding the activities and availability of
data by the data compiling agencies to the users and I hope that in future they will have a better
understanding of the data for their benefit. Data compilers should also reorient strategies and
expand the scope & coverage of their statistics in a way to make it more useful for the users.
The presentations were made on Balance of Payments, International Reserves and Foreign
Currency Liquidity, International Investment Position, Foreign Trade, External Debt, Population
Statistics, Analytical Accounts of the Banking Sector, Analytical Accounts of the Central Bank,
National Accounts, Production Index, Labour Market Employment, Labour Market
Wages/Earnings, Labour Market Unemployment, Price Index Consumer Prices, Price Index
Producer Prices, and by SECP, Bureaus of Statistics. Due to active participation of the
participants, the SBP has obtained very useful feedback. So this workshop has achieved its
objectives as per expectations.
The recommendations for further improvements in the statistics of each sector made during this
workshop by the Plenary Sessions have been very well taken and will be used by the SBP/data
compiling agencies for its future plan. I also hope that SBP will continue to conduct this type of
workshops to disseminate about their activities and provide an opportunity to the users/data
compiling agencies of their data to benefit from it and this ultimately provide feedback to SBP as
regular activity.
With this I would like to thank all the distinguished guests, presenters, learned Chairpersons and
participants, who are here with us for the whole day and have contributed to this workshop. I
thank you again.
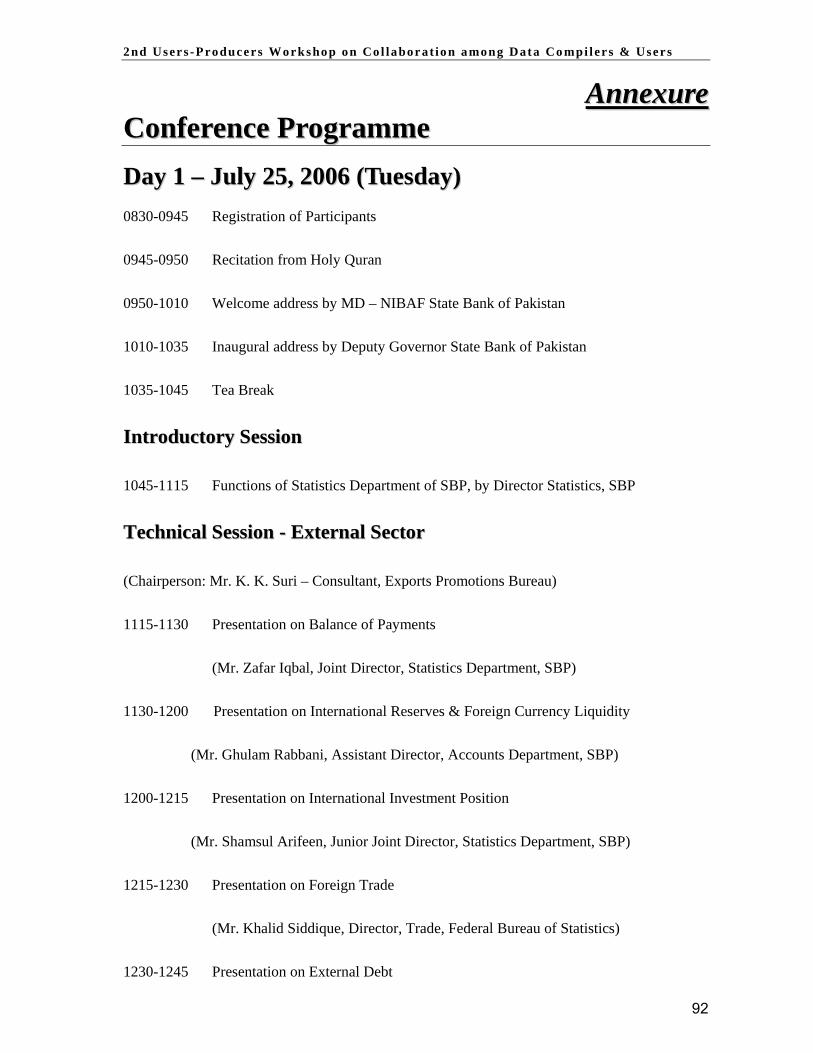
2nd Users -Producers Workshop on Co l laborat ion among Data Co mpi l er s & Users
92
AAnnnneexxuurree CCoonnffeerreennccee PPrrooggrraammmmee DDaayy 11 –– JJuullyy 2255,, 22000066 ((TTuueessddaayy)) 0830-0945 Registration of Participants
0945-0950 Recitation from Holy Quran
0950-1010 Welcome address by MD – NIBAF State Bank of Pakistan
1010-1035 Inaugural address by Deputy Governor State Bank of Pakistan
1035-1045 Tea Break
IInnttrroodduuccttoorryy SSeessssiioonn
1045-1115 Functions of Statistics Department of SBP, by Director Statistics, SBP
TTeecchhnniiccaall SSeessssiioonn -- EExxtteerrnnaall SSeeccttoorr
(Chairperson: Mr. K. K. Suri – Consultant, Exports Promotions Bureau)
1115-1130 Presentation on Balance of Payments
(Mr. Zafar Iqbal, Joint Director, Statistics Department, SBP)
1130-1200 Presentation on International Reserves & Foreign Currency Liquidity
(Mr. Ghulam Rabbani, Assistant Director, Accounts Department, SBP)
1200-1215 Presentation on International Investment Position
(Mr. Shamsul Arifeen, Junior Joint Director, Statistics Department, SBP)
1215-1230 Presentation on Foreign Trade
(Mr. Khalid Siddique, Director, Trade, Federal Bureau of Statistics)
1230-1245 Presentation on External Debt
2nd Users -Producers Workshop on Co l laborat ion among Data Co mpi l er s & Users
93
(Mr. Muhammad Afaq, Assistant Chief, Economic Affair Division)
1245-1300 Q.A
1300-1315 Concluding remarks by Chairperson
1315-1400 Lunch/Prayers Break
TTeecchhnniiccaall SSeessssiioonn:: SSoocciioo--ddeemmooggrraapphhiicc DDaattaa && FFiinnaanncciiaall SSeeccttoorr
(Chairperson: Dr. Naushin Mahmood – Joint Director, PIDE, Islamabad)
1430-1445 Presentation on Population Statistics
(Mr. Mehboob Sultan, National Institute of Population Studies)
1445-1500 Presentation on Population Statistics
(Mr. Ahsan-ul-Haq, Population Census Organization)
1500-1515 Q.A
1515-1530 Concluding remarks by Chairperson
1530-1600 Tea Break
1600-1630 Analytical Accounts of Central Bank & Other Depository Corporations
(Mr. Naseer Ahmed, Joint Director, Statistics Department, SBP)
1630-1645 Q.A
1645-1700 Concluding remarks by Chairperson
DDaayy 22 –– JJuullyy 2266,, 22000066 ((WWeeddnneessddaayy))
TTeecchhnniiccaall SSeessssiioonn:: RReeaall SSeeccttoorr
(Chairperson: Dr. N. M. Larik – EX–Director General, FBS, Pakistan)
0930-0945 Presentation on National Accounts

2nd Users -Producers Workshop on Co l laborat ion among Data Co mpi l er s & Users
94
(Mr. Arif Mehmood Cheema, Deputy Director General, FBS)
0945-1000 Presentation on Production Index
(Mr. Rana Ishaq, Director – Industries, FBS)
1000-1015 Presentation on Labour Force Survey
(Mr. Mazhar Hussain Hashmi, Deputy Director General, FBS)
1015-1030 Presentation on Price Index Consumer Prices, Price Index Producer Prices
(Mr. Abdul Azeem Sahito, Director – Prices, FBS)
1030-1045 Q.A
1045-1100 Concluding remarks by the Chairperson
1100- 1115 Tea Break
TTeecchhnniiccaall SSeessssiioonn:: MMiisscceellllaanneeoouuss SSeeccttoorr
(Chairperson: Dr. Faqir Muhammad, Chairman, Mathematics & Statistics Department, AIOU)
1115-1130 Presentation on Statistics compiled by SECP
(Mr. Ali Rehman, Director – MIS, SECP)
1130-1145 Statistics compiled by Provincial Bureaus of Statistics
(Mr. Shamim Rafique, Deputy Director, PBS)
1145-1200 Q.A
1200-1215 Concluding remarks by the Chairperson
1215-1300 Plenary Sessions
1300-1400 Lunch/Prayers Break
1400-1500 Plenary Sessions

2nd Users -Producers Workshop on Co l laborat ion among Data Co mpi l er s & Users
95
1500-1600 Groups Presentations
CClloossiinngg SSeessssiioonn
1600-1630 Concluding remarks by Mr. Bernd Struck
1630-1645 Note of thanks
(Dr. Azizullah Khattak, Director Statistics, Statistics Department, SBP)
1645- 1700 Tea
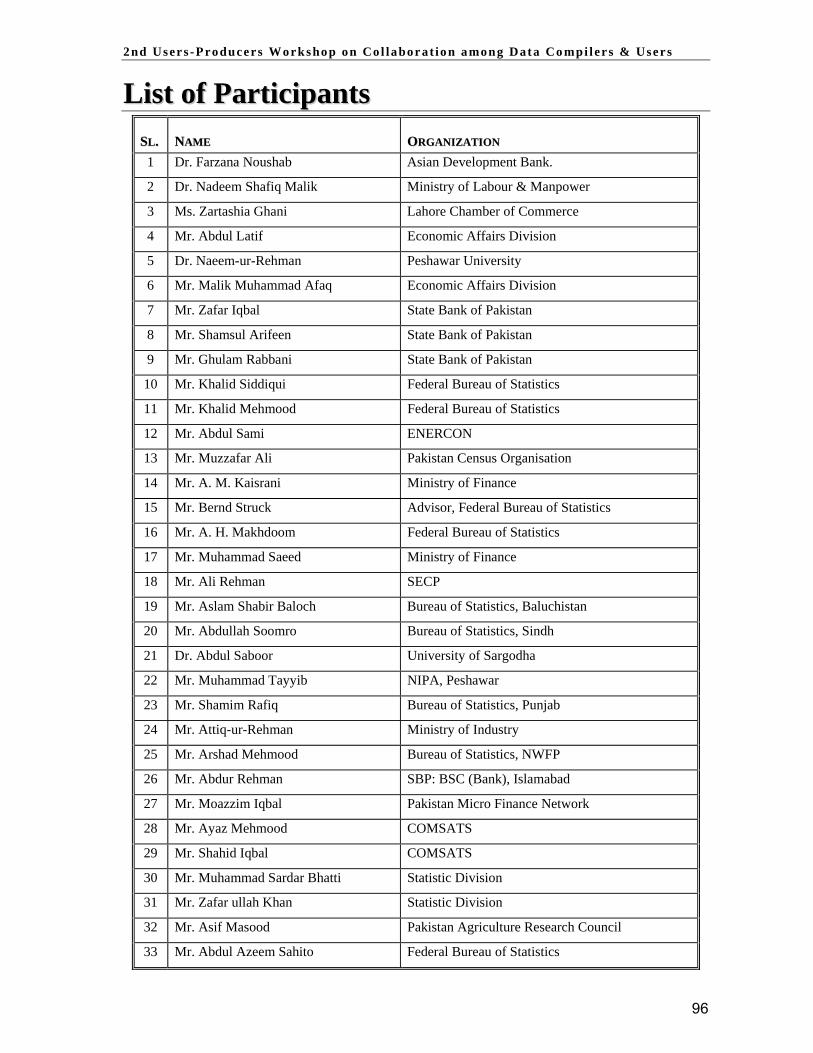
2nd Users -Producers Workshop on Co l laborat ion among Data Co mpi l er s & Users
96
LLiisstt ooff PPaarrttiicciippaannttss SSLL.. NNAAMMEE OORRGGAANNIIZZAATTIIOONN 1 Dr. Farzana Noushab Asian Development Bank.
2 Dr. Nadeem Shafiq Malik Ministry of Labour & Manpower
3 Ms. Zartashia Ghani Lahore Chamber of Commerce
4 Mr. Abdul Latif Economic Affairs Division
5 Dr. Naeem-ur-Rehman Peshawar University
6 Mr. Malik Muhammad Afaq Economic Affairs Division
7 Mr. Zafar Iqbal State Bank of Pakistan
8 Mr. Shamsul Arifeen State Bank of Pakistan
9 Mr. Ghulam Rabbani State Bank of Pakistan
10 Mr. Khalid Siddiqui Federal Bureau of Statistics
11 Mr. Khalid Mehmood Federal Bureau of Statistics
12 Mr. Abdul Sami ENERCON
13 Mr. Muzzafar Ali Pakistan Census Organisation
14 Mr. A. M. Kaisrani Ministry of Finance
15 Mr. Bernd Struck Advisor, Federal Bureau of Statistics
16 Mr. A. H. Makhdoom Federal Bureau of Statistics
17 Mr. Muhammad Saeed Ministry of Finance
18 Mr. Ali Rehman SECP
19 Mr. Aslam Shabir Baloch Bureau of Statistics, Baluchistan
20 Mr. Abdullah Soomro Bureau of Statistics, Sindh
21 Dr. Abdul Saboor University of Sargodha
22 Mr. Muhammad Tayyib NIPA, Peshawar
23 Mr. Shamim Rafiq Bureau of Statistics, Punjab
24 Mr. Attiq-ur-Rehman Ministry of Industry
25 Mr. Arshad Mehmood Bureau of Statistics, NWFP
26 Mr. Abdur Rehman SBP: BSC (Bank), Islamabad
27 Mr. Moazzim Iqbal Pakistan Micro Finance Network
28 Mr. Ayaz Mehmood COMSATS
29 Mr. Shahid Iqbal COMSATS
30 Mr. Muhammad Sardar Bhatti Statistic Division
31 Mr. Zafar ullah Khan Statistic Division
32 Mr. Asif Masood Pakistan Agriculture Research Council
33 Mr. Abdul Azeem Sahito Federal Bureau of Statistics

2nd Users -Producers Workshop on Co l laborat ion among Data Co mpi l er s & Users
97
SSLL.. NNAAMMEE OORRGGAANNIIZZAATTIIOONN 34 Mr. Arif Mehmood Cheema Federal Bureau of Statistics
35 Mr. Raees-ul-Hasan Federal Bureau of Statistics
36 Mr. Rana Ishaq Federal Bureau of Statistics
37 Mr. Munir Ahmed Aslam Federal Bureau of Statistics
38 Dr. N. M. Larik Federal Bureau of Statistics
39 Mr. Shoaib Bashir Ministry of Food & Agriculture
40 Mr. M. Abdullah Soomro Economic Affairs Division
41 Ms. Farhat-ul-Ain Qureshi SBP: BSC (Bank), Islamabad
42 Malik Muhammad Suleman Punjab Provincial Cooperative Bank
43 Mr. Najeeb Qadir Central Board of Revenue
44 Dr. Muhammad Aslam Quaid-e-Azam University
45 Ms. Shaheen Malik World Ban
46 Ms. Arooj Fayyaz LCCI
47 Mr. Aamir Iqbal Al Baraka Bank
48 Dr. Muhammad Riaz Zarai Tarqiati Bank Ltd.
49 Mr. Tassaduq Hussain Punjab Provincial Cooperative Bank.
50 Mr. Tahir Iqbal Butt Punjab Provincial Cooperative Bank.
51 Mr. Zaheer Sabir SBP BSC (Bank), Rawalpindi
52 Mr. Amir Nazir Bhatti SBP BSC (Bank), Rawalpindi
53 Mr. Muhammad Tufail MINFAL
54 Mr. Amir Hameed Prime Bank Ltd.
55 Mr. Shahid Aman SME Bank Ltd.
56 Brig. Shahzad Karim Directorate Budget, GHQ, Rawalpindi.
57 Mr. Sibt-ul-Hasnain Kazmi International Monetary Fund
58 Mr. Mehboob Sultan NIPS
59 Mr. Ahsan-ul-Haq Pakistan Census Organisation
60 Mrs. Farida Agha Pakistan Medical Research Council
61 Mr. Maqsood Sadiq CPRID
62 Mr. Jamil Ahmad READ Foundation.
63 Mr. Asif Ali Federal Urdu University
64 Mr. Muhammad Asim Pakistan Medical Research Council
65 Mr. Shabbir Ahmad International Islamic University
66 Dr. Abdul Qayum PIDE
67 Mr. Saghir Pervaiz Ghauri PIDE
68 Mr. Ihsan-ul-Haq Population Census Department

2nd Users -Producers Workshop on Co l laborat ion among Data Co mpi l er s & Users
98
SSLL.. NNAAMMEE OORRGGAANNIIZZAATTIIOONN 69 Mr. Sohail Mehboob NIBAF – Islamabad
70 Mr. Muhammad Latif Planning & Development Division
71 Mr. Shakir H. Shamim Board of Investment
72 Dr. Faqir Muhammad Allama Iqbal Open University
73 Mr. K. K. Suri Exports Promotion Bureau
74 Dr. Naushin Mahmood PIDE
75 Ms. Sarah Hornell Advisor, OFID
76 Dr. Arshad Ahmed Allama Iqbal Open University
77 Mr. Muhammad Zakaria Allama Iqbal Open University
78 Dr. Ahmed Nawaz Quaid-e-Azam University
79 Mr. Abdul Sattar Quaid-e-Azam University
80 Dr. Amanullah Agriculture University, Peshawar
81 Dr. Hamidullah Agriculture University, Peshawar
82 Mr. Riaz-ul-Haq Board of Investment
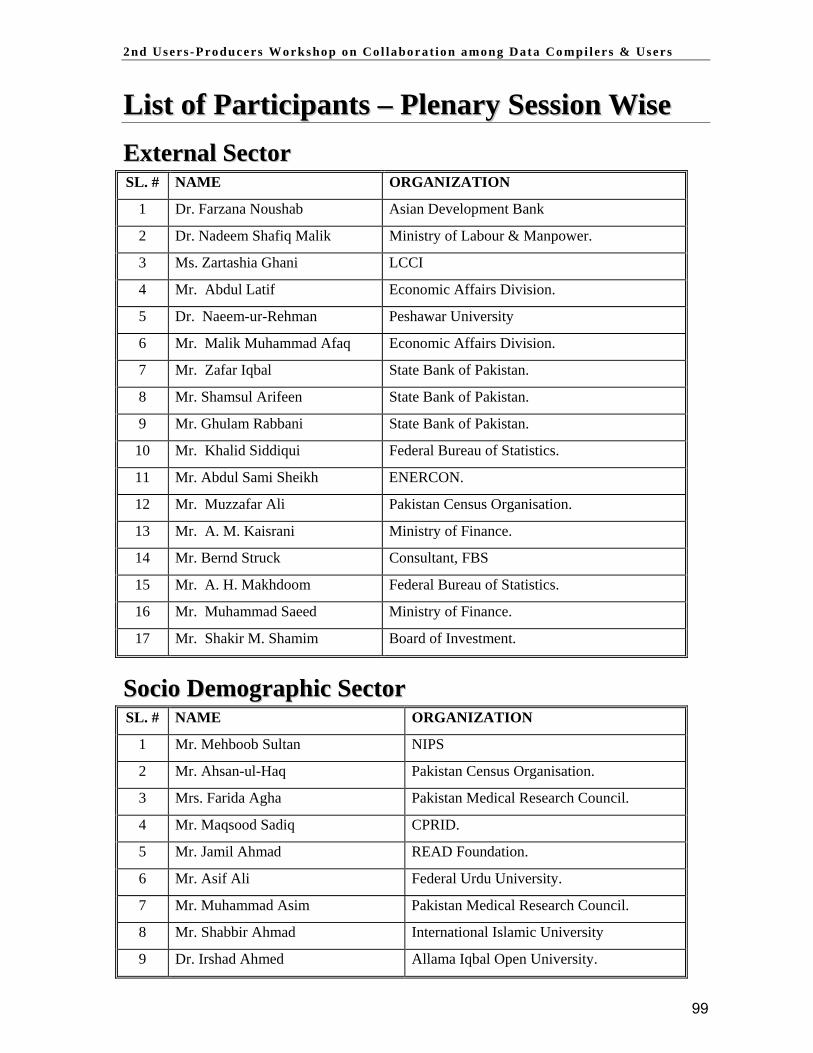
2nd Users -Producers Workshop on Co l laborat ion among Data Co mpi l er s & Users
99
LLiisstt ooff PPaarrttiicciippaannttss –– PPlleennaarryy SSeessssiioonn WWiissee EExxtteerrnnaall SSeeccttoorr SL. # NAME ORGANIZATION
1 Dr. Farzana Noushab Asian Development Bank
2 Dr. Nadeem Shafiq Malik Ministry of Labour & Manpower.
3 Ms. Zartashia Ghani LCCI
4 Mr. Abdul Latif Economic Affairs Division.
5 Dr. Naeem-ur-Rehman Peshawar University
6 Mr. Malik Muhammad Afaq Economic Affairs Division.
7 Mr. Zafar Iqbal State Bank of Pakistan.
8 Mr. Shamsul Arifeen State Bank of Pakistan.
9 Mr. Ghulam Rabbani State Bank of Pakistan.
10 Mr. Khalid Siddiqui Federal Bureau of Statistics.
11 Mr. Abdul Sami Sheikh ENERCON.
12 Mr. Muzzafar Ali Pakistan Census Organisation.
13 Mr. A. M. Kaisrani Ministry of Finance.
14 Mr. Bernd Struck Consultant, FBS
15 Mr. A. H. Makhdoom Federal Bureau of Statistics.
16 Mr. Muhammad Saeed Ministry of Finance.
17 Mr. Shakir M. Shamim Board of Investment.
SSoocciioo DDeemmooggrraapphhiicc SSeeccttoorr SL. # NAME ORGANIZATION
1 Mr. Mehboob Sultan NIPS
2 Mr. Ahsan-ul-Haq Pakistan Census Organisation.
3 Mrs. Farida Agha Pakistan Medical Research Council.
4 Mr. Maqsood Sadiq CPRID.
5 Mr. Jamil Ahmad READ Foundation.
6 Mr. Asif Ali Federal Urdu University.
7 Mr. Muhammad Asim Pakistan Medical Research Council.
8 Mr. Shabbir Ahmad International Islamic University
9 Dr. Irshad Ahmed Allama Iqbal Open University.

2nd Users -Producers Workshop on Co l laborat ion among Data Co mpi l er s & Users
100
SL. # NAME ORGANIZATION
10 Mr. M. Zakaria Allama Iqbal Open University.
FFiinnaanncciiaall && FFiissccaall SSeeccttoorr SL. # NAME ORGANIZATION
1 Mr. Naseer Ahmad State Bank of Pakistan.
2 Ms. Arooj Fayyaz LCCI
3 Mr. Aamir Iqbal Al Baraka Bank Ltd.
4 Dr. Muhammad Riaz Zarai Tarqiati Bank Ltd.
5 Mr. Tassaduq Hussain Punjab Provincial Cooperative Bank.
6 Mr. Tahir Iqbal Butt Punjab Provincial Cooperative Bank.
7 Mr. Zaheer Sabir SBP BSC (Bank), Rawalpindi.
8 Mr. Amir Nazir Bhatti SBP BSC (Bank), Rawalpindi.
9 Mr. Mohamed Tufail MINFAL.
10 Mr. Amir Hameed Prime Bank Ltd.
11 Mr. Shahid Aman SME Bank Ltd.
12 Brig. Shahzad Karim Directorate Budget GHQ RWP
13 Mr. Sibt-ul-Hasnain Kazmi International Monetary Fund.
14 Mr. Shafiq-ur-Rehman SECP
15 Mr. Habib Qadir SECP
16 Mr. Amir Ahmed Prime Commercial Bank Ltd
RReeaall SSeeccttoorr SL. # NAME ORGANIZATION
1 Mr. Muhammad Sardar Bhatti Statistic Division.
2 Mr. Zafar ullah Khan Statistic Division.
3 Mr. Asif Masood PARC
4 Mr. Abdul Azeem Sahito Federal Bureau of Statistics.
5 Mr. Arif Mehmood Cheema Federal Bureau of Statistics.
6 Mr. Raees-ul-Hasan Federal Bureau of Statistics.
7 Mr. Rana Ishaq Federal Bureau of Statistics.
8 Mr. Munir Aslam Federal Bureau of Statistics.
9 Dr. N. M. Larik Federal Bureau of Statistics.
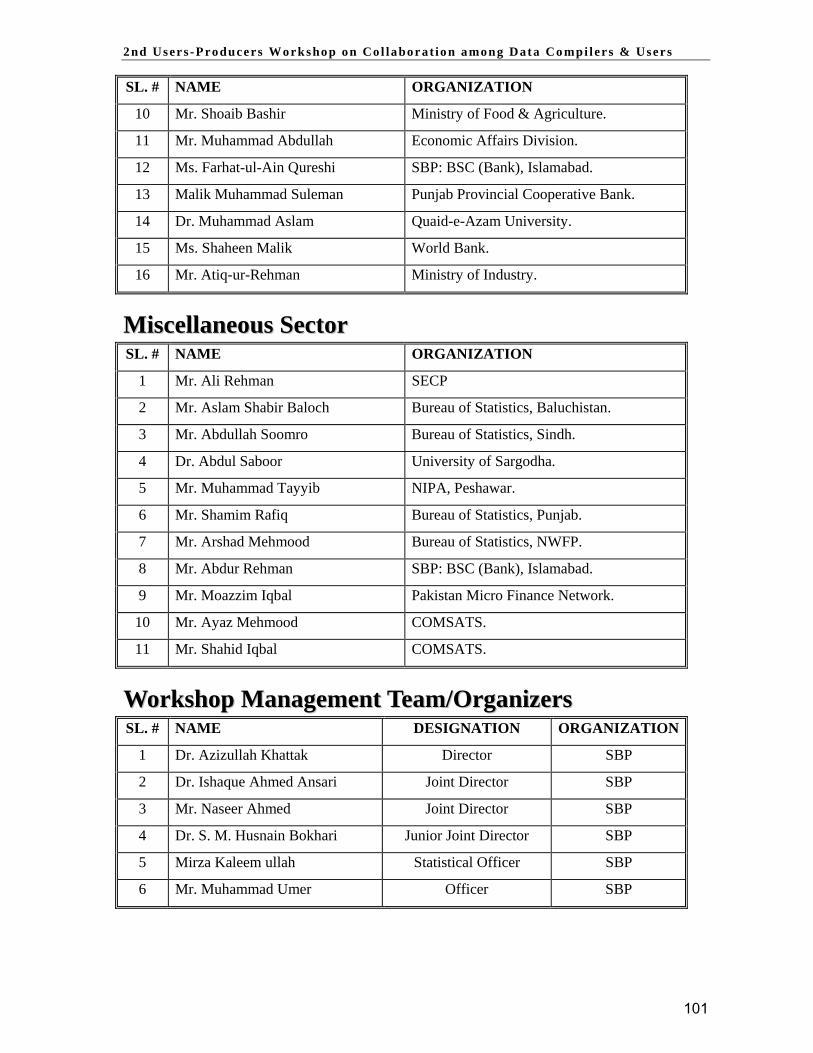
2nd Users -Producers Workshop on Co l laborat ion among Data Co mpi l er s & Users
101
SL. # NAME ORGANIZATION
10 Mr. Shoaib Bashir Ministry of Food & Agriculture.
11 Mr. Muhammad Abdullah Economic Affairs Division.
12 Ms. Farhat-ul-Ain Qureshi SBP: BSC (Bank), Islamabad.
13 Malik Muhammad Suleman Punjab Provincial Cooperative Bank.
14 Dr. Muhammad Aslam Quaid-e-Azam University.
15 Ms. Shaheen Malik World Bank.
16 Mr. Atiq-ur-Rehman Ministry of Industry.
MMiisscceellllaanneeoouuss SSeeccttoorr SL. # NAME ORGANIZATION
1 Mr. Ali Rehman SECP
2 Mr. Aslam Shabir Baloch Bureau of Statistics, Baluchistan.
3 Mr. Abdullah Soomro Bureau of Statistics, Sindh.
4 Dr. Abdul Saboor University of Sargodha.
5 Mr. Muhammad Tayyib NIPA, Peshawar.
6 Mr. Shamim Rafiq Bureau of Statistics, Punjab.
7 Mr. Arshad Mehmood Bureau of Statistics, NWFP.
8 Mr. Abdur Rehman SBP: BSC (Bank), Islamabad.
9 Mr. Moazzim Iqbal Pakistan Micro Finance Network.
10 Mr. Ayaz Mehmood COMSATS.
11 Mr. Shahid Iqbal COMSATS.
WWoorrkksshhoopp MMaannaaggeemmeenntt TTeeaamm//OOrrggaanniizzeerrss SL. # NAME DESIGNATION ORGANIZATION
1 Dr. Azizullah Khattak Director SBP
2 Dr. Ishaque Ahmed Ansari Joint Director SBP
3 Mr. Naseer Ahmed Joint Director SBP
4 Dr. S. M. Husnain Bokhari Junior Joint Director SBP
5 Mirza Kaleem ullah Statistical Officer SBP
6 Mr. Muhammad Umer Officer SBP
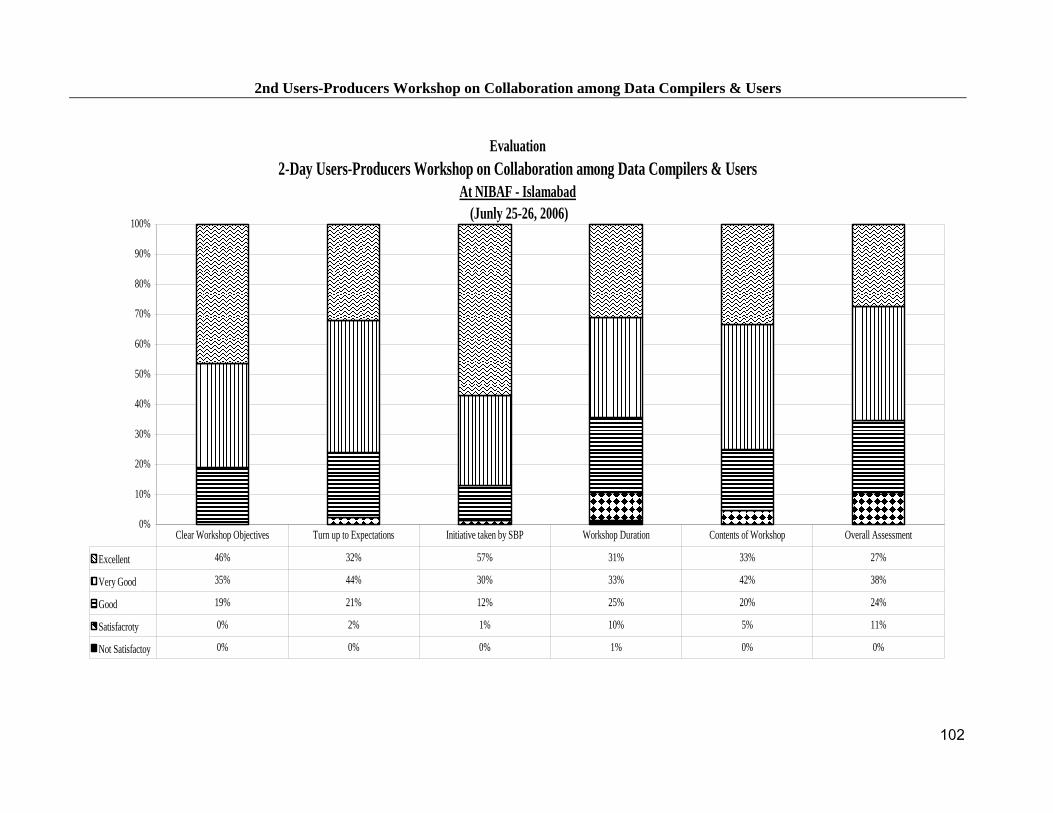
2nd Users-Producers Workshop on Collaboration among Data Compilers & Users
102
Evaluation 2-Day Users-Producers Workshop on Collaboration among Data Compilers & Users
At NIBAF - Islamabad (Junly 25-26, 2006)
0%
10%
20%
30%
40%
50%
60%
70%
80%
90%
100%
Excellent 46% 32% 57% 31% 33% 27%
Very Good 35% 44% 30% 33% 42% 38%
Good 19% 21% 12% 25% 20% 24%
Satisfacroty 0% 2% 1% 10% 5% 11%
Not Satisfactoy 0% 0% 0% 1% 0% 0%
Clear Workshop Objectives Turn up to Expectations Initiative taken by SBP Workshop Duration Contents of Workshop Overall Assessment

2nd Users -Producers Workshop on Co l laborat ion among Data Co mpi l er s & Users
103
AAccrroonnyymmss
AKU – The Agha Khan University
BBS – Balochistan Bureau of Statistics
BOP – Balance of Payments
BPM5 – Balance of Payments Manual 5th Edition
CBM – College of Business Management
CBR – Central Board of Revenue
CC– Census Commissioner
CERS – Currency Exchange Rate System
CMI – Census of Manufacturing Industries
CPI – Consumer Price Index
CRCS – Company Registration & Compliance System
CSO – Chief Statistical Officer
CCI – Chamber of Commerce & Industry
DCS – Depository Corporations Survey
DDG – Deputy Director General
DG – Director General
DMFAS – Debt Management & Financial Analysis System
DMIS – Deposit Money Institutions Survey
DR – Discount Rates
EAD – Economic Affairs Division
EPB – Export Promotion Bureau
FBS – Federal Bureau of Statistics
FC – Factor Cost
FDI – Foreign Direct Investment
FFAs – Flow of Funds Accounts
FIBR – Floating Interbank Exchange Rate
FMA – Financial Market Association
FSOE – Financial Statistics of the Economy
GDP – Gross Domestic Product
GDs – Goods Declaration
GFCF – Gross Fixed Capital Formation
GNP – Gross Net Product
GOB – Government of Balochistan

2nd Users -Producers Workshop on Co l laborat ion among Data Co mpi l er s & Users
104
GONWFP – Government of NWFP
GOP – Government of Punjab
GOS – Government of Sindh
HS – Harmonised System
IBA – Institute of Business Administration
IBP – Institute of Bankers Pakistan
IIP – International Investment Position
KIBOR - Karachi Interbank Offered Rate
KSE – The Karachi Stock Exchange
KU – Karachi University
LFS – Labour Force Survey
LIBOR – London Interbank Offered Rate
LSM – Large Scale Manufacturing
LSS – Labour & Social Statistics
MFSM – Monetary & Financial Statistics Manual
MINFAL – Ministry of Food Agriculture and Live Stock
MIS – Management Information System
MOF – Ministry of Finance
MOFEA – Ministry of Finance & Economic Affairs
MTB – Market Treasury Bills
NA – National Accounts
NBFIs – Non-Bank Financial Institutions
NGOs – Non-Government Organisations
NIPS – National Institute of Population Studies
NWFPBS – NWFP Bureau of Statistics
NYSE – New York Stock Exchange
ODCS – Other Depository Corporations Survey
OFCS – Other Financial Corporations Survey
OMO – Open Market Operations
PuBS – Punjab Bureau of Statistics
PBS – Provincial Bureaus of Statistics
PCO – Population Census Organization
PDD – Planning & Development Division
PDI – Provincial Directorate of Industries
PIB – Pakistan Investment Bonds
PIDE – Pakistan Institute of Development Economics

2nd Users -Producers Workshop on Co l laborat ion among Data Co mpi l er s & Users
105
PILER – Pakistan Institute of Labour Education & Research
PPI – Producers Price Index
PS – Price Statistics
QAU – Quaid-e-Azam University
SBP – State Bank of Pakistan
SBS – Sindh Bureau of Statistics
SCS – Financial Corporations Survey
SU – Sindh University
SECP – Security Exchange Commission of Pakistan
SEMIS – Sindh Education Management Information System
SHMI – Survey of Small Scale & Household Manufacturing Industries
SPI – Sensitive Price Index
SPDC – Social Policy and Development Centre
SSMI – Small Scale Manufacturing Industries
SZABIST – Shaheed Zulfiqar Ali Bhutto Institute of Science & Technology
TC – Technical Committee
WPI – Whole Price Index