state and local transportation revenue sources - · pdf filessti survey of state and local...
TRANSCRIPT
SSTI Survey OF
State and Local Transportation revenue Sources

Acknowledgements:
State Smart Transportation Initiative (SSTI)
Transportation is a basic social and economic need. Providing affordable choices to meet transportation needs is an acknowledged responsibility of government. However, mobility solutions conceived a generation ago might not be economically or environmentally sustainable today.
The mission SSTI is to promote “smart transportation” practices that foster equitable economic development and environmental sustainability, while maintaining high standards of governmental efficiency and transparency.
SSTI operates in three ways:
1. As a community of practice, where participating agencies can learn together and share experiences as they implement innovative smart transportation policies.
2. As a source of direct technical assistance to these agencies on transformative and replicable smart transportation reform efforts.
3. As a resource to the wider transportation community, including local, state, and federal agencies, in its effort to reorient practice to changing social and financial demands.
SSTI is funded by the Rockefeller Foundation. For more information, visit www.ssti.us.
Mary Ebeling, Transportation Policy Analyst with State Smart Transportation Initiative, authored this report with help from Research Assistant Greg Halstead. Eric Sundquist, Managing Director at SSTI, also contributed to this report
This report was developed in cooperation with the North Carolina Department of Transportation (NCDOT), which provided information and guidance on potential revenue strategies included in this report. The following individuals form NCDOT reviewed drafts and contributed to the content of the report:
Gene Conti, Secretary
Paul Morris, Deputy Secretary
Mark Foster, Chief Financial Officer
Julie Hunkins, PE, Manager, Quality Enhancement Unit
Calvin Leggett, PE, Manager, Program Development Branch
Burt Tasaico, PE, State Program Analysis Engineer
In addition, Kara A. Millonzi, Assistant Professor of Public Law and Government, School of Government, University of North Carolina at Chapel Hill, provided information on North Carolina laws and practices.
Copyright © 2013, State Smart Transportation Initiative

SSTI Survey of State and Local Transportation Revenue Sources
Acknowledgements:
Arizona Department of Transportation
John Halikowski, Director
Kristine Ward, Chief Financial Officer
Lisa Danka, Deputy Chief Financial Officer
John McGee (retired), former Chief Financial Officer
Holly Hunnicutt, Government Relations Manager
Brad Steen, Chief Economist
Anne Ellis, PhD, Research Director
Illinois Department of Transportation
Ann Schneider, Acting Secretary
Jim Ofcarcik, Manager, Fiscal Analysis
Tony Small, Deputy Director, Office of Finance and Administration
Pennsylvania Department of Transportation
Barry Schoch, Secretary
Jim Ritzman, P.E., Deputy Secretary for Planning
Tennessee Department of Transportation
John Schroer, Commissioner
Joseph Galbato III, Deputy Commissioner/Chief Financial Officer
Matt Barnes, Legislative Services Manager
Neal Ham, Director of Finance
Washington Department of Transportation
Paula Hammond, Secretary
Amy Arnis, Assistant Secretary/Chief Financial Officer: Strategic Planning and Finance Ops
Lizbeth Martin-Mahar, Assistant Director for the Economic Analysis, Budget and Financial Analysis Division, WSDOT
Rich Struna, Assistant Director for the Financial Planning, Budget and Financial Analysis Division, WSDOT
Jeff Doyle, Director of the Public/Private Partnerships at the WSDOT
SSTI Survey of
State and Local Transportation Revenue Sources
Introduction 2
Report format 5
State and local revenue 6 options
User fees 6
Bike license fees and trail passes 6
Carbon tax 7
Farebox collection 9
Fine-based funding 10
Heavy vehicle fees 12
Severance fees 13
Vehicle miles traveled fee 14
Vehicle title, registration, and 18 vanity plate fees
Fuel taxes 21
Alternative fuel tax 21
Indexing the fuel tax 22
Oil company franchise tax 26
Tolling and road pricing 27
Flat rate tolling 27
Congestion pricing 28
High occupancy toll lanes 28
Priced road networks 29
Priced zones
Variable pricing
Non-user fees 32
Mobility tax 32
Local income taxes 33
Property tax 34
Local sales tax 35
State general purpose revenue 36
Secondary business 39 opportunities
Advertising 39
Concessions 40
Naming rights 41
Value capture 42
Air rights 42
Development impact fees and 43 negotiated exaction
Joint development 44
Land value tax 45
Special assessment districts 46
Tax increment financing 47
Transportation utility fee 50
Private investment 51
Bonding 51
Certificates of participation 51
Grant anticipation notes 52
Grant anticipation revenue vehicles 53
Private activity bonds 54
Public-Private Partnerships 55
Railroad Rehabilitation and 57 Improvement Financing Program
Section 129 loans 58
Special Experimental Project Number 15 59
State infrastructure banks 60
Transportation Infrastructure Finance and Innovation Act 63
Table 1: Summary Data of State 66 Transportation Revenue Tools
Notes 70

2
U.S. transportation systems have grown and prospered, then entered periods of crisis and decline or retrenchment. This has occurred with canals, railroads, and urban transit. Now the major transportation system of the late 20th century – highways – faces serious challenges.
Partly these crises have stemmed from advancing technology. For example, the canal systems of the late 18th and early 19th centuries were made mostly obsolete by faster and more flexible railroads. Transit suffered as personal travelers adopted automotive technology.
Yet technology is only part of the story. Waterborne freight, rail freight, and personal travel via transit and automobile all still play important roles in our lives and economy; technology changed them but did not render them obsolete. Crises for these systems have been caused as much by unsustainable business models as by competition from alternative modes. For example, many urban rail transit systems were initially built and operated by land developers seeking to provide access to new homes and businesses. But after the developers built and sold their real estate, they had no interest in maintaining the systems. Without new infusions of capital to maintain and rebuild, the quality of rail-transit service declined and eventually disappeared in most places – in many cases to be replaced at great cost decades later. Many of the strategies in this document relate to efforts to re-fund transit in a sustainable way.
Today’s dominant mode, highways, faces both technological and business model challenges. Americans, on average, are driving less than they used to. The causes and durability of this trend are still in question, but clearly the growth of information technology has lessened the need for some trips, and improvements in transit, pedestrian, and bicycle facilities may be eroding highway travel demand as well. And the auto, well-suited to low-density built environments, fares less well as the popularity of higher-density living arrangements increases.
SSTI Survey of State and Local Transportation Revenue Sources
IntroductionWe have been here before.
SSTI Survey of State and Local Transportation Revenue Sources

3
Funding for highways has traditionally revolved around fuel taxes. But a combination of factors has created a crisis:
• For decades in America, travel per person increased steadily, bringing in more fuel tax revenue. But the last decade has seen a decline in per-capita highway travel. Even with population increases, aggregate driving has flattened or even declined in some years.
• Political leaders at the state and national level have been less willing in recent decades to increase fuel taxes with inflation, or to index them for automatic increases. However, the costs for construction and maintenance of roadways have continued to increase.
• Vehicle fuel efficiency is beginning to improve, spurred by higher gasoline and diesel costs, tighter federal regulations, and new technologies. Such improvements have yet to make a major impact on fuel-tax revenues, because the vehicle fleet takes years to turn over. But it is a serious prospective threat.
• The major highway building era in the United States occurred about 50 years ago. The facilities constructed then are now reaching the end of their useful lives. As occurred with transit a generation earlier, there is no obvious source of funds for the increasing maintenance and reconstruction that will be required.
Fuel taxes and other user fees, such as registration charges, once funded the lion’s share of roadway costs. As user fees have eroded, costs have shifted to general revenues and borrowing, which both make the system less of a user-pays, market-driven entity and also puts it in direct competition with a myriad of other government activities and services for support. A comparison to transit’s mid–20th century crisis is fitting.
This report provides a broad account of funding methods that have been implemented, in some places, or have been proposed but not yet adopted. It includes a discussion of tried-and-true methods, such as fuels taxes and license fees, as well as more novel options. This research will assist decision-makers in identifying policies and practices that could augment the current fuel-tax-revenue system, and also in identifying state laws and practices that permit a more sustainable funding model. For example, in response to rising vehicle fuel economy, many states are moving toward tolls and/or vehicle-miles-traveled (VMT) charges to maintain roads. In addition, state and local providers are considering durable types of transit
Introduction

4
operating support, such as value-capturing business improvement or special assessment districts.
Linking revenue types to particular modes of transportation can be arbitrary. It is possible to dedicate all revenues to a mode-neutral transportation fund, as Maryland does, or even to direct all revenues through the general fund, as Massachusetts does. Here we provide conventional connections between revenues and ground-transportation modes (plus ferries), but these links should not be seen as absolute.
Many of the revenue types identified in this report do not by themselves generate a significant or sustainable revenue stream. Revenue potential truly depends on the sum total of all revenues collected, present and future, and should not be just considered in a silo.
To fully finance specific projects, it may be necessary or desirable to create a funding package from the sources catalogued in this report. The Charlotte Red Line Regional Rail project discussed in this report provides an excellent example of one of these financing packages. The project includes a variety of funding strategies, including bonding and cost sharing by the state, the Charlotte Area Transit System, and the communities benefitting from the project.
While this report focuses on revenues, it should be noted that some revenue options have a beneficial effect on costs, while others create unsustainable demand. In general, revenue options tied to use of the transportation system are desirable, as they produce market efficiencies for travel; the more you use, the more you pay. In contrast, general-revenue based funding can have an “all you can eat” effect, inducing more consumption and more costs to providers. As the gas tax has waned in its buying power, transportation infrastructure has increasingly relied on general revenues, creating excess demand. It is unlikely that transportation will ever be fully funded through user fees, and some general revenue support is desirable, e.g., in the case of sidewalks, where charging for use is impractical and the widespread economic/social benefits are substantial. Transit, which has been undercut for many years by subsidies to competing modes, may also deserve general support. The distinction between user- and non-user-based revenues is a useful one for policymakers to consider when perusing the long list of options below.
SSTI Survey of State and Local Transportation Revenue Sources

5
Report format
Revenue options below are presented in alphabetical order within categories, following this format:
Description. Self-explanatory.
Revenue potential. This is a judgment about the value of the revenue stream if the option were fully implemented. The evaluations are based on either historical practice or the likely upside potential of more novel options. It is possible that new forms of some policies could increase their importance; this section gives a general sense of their limitations. “Very high” indicates a revenue option, such as fuel taxes, that could provide core funding for a program. “High” indicates an option, such as vehicle license fees, that could provide important support but probably not as the main pillar of a program. Less important options are described as “moderate” or “marginal.”
Modal applicability. This section describes the most likely applicability of the revenue option. For example, it is likely that road user fees would be devoted to roads, even though there are many exceptions to this rule in practice. In some cases, the user-pays principle suggests the appropriate mode. However, in reality, almost any revenue stream could be devoted to any mode.
Use. This section describes real-world experience with the revenue option, where possible.
Discussion. This section highlights issues for policymakers to consider.
Table summarizing state use of identified revenue options and the results of a revenue scan among selected states are presented in Appendix A.
Introduction

6
SSTI Survey of State and Local Transportation Revenue Sources
State and Local Revenue options
User fees
Bike license fees and trail passes
Description: States and municipalities across the country have begun to look into charging bike registration fees in an effort to introduce another revenue stream and recoup some of the expenses associated with bike infrastructure. Governments enforce such a policy by requiring that all bicycles operating within a certain state or municipality be properly registered within the municipality.1
Revenue potential: Marginal. In 2009, Madison, Wisconsin, restructured its bike registration fees to increase revenues allocated to the city’s Bicycle Committee. Madison hoped to increase program revenues to $30, 000 annually through this restructuring.2 It is important to note that in Madison this fee is revenue neutral, essentially paying for program staff and administration.
Modal applicability: Bike facilities.
Use: Bike registration fees are most commonly used at the municipal level. Madison charges a municipal fee of $10 every four years for residents to legally register their bikes.
In 2009, Oregon proposed legislation requiring that all bikes in the state pay a $54 registration fee every two years, with associated fines and penalties for noncompliance. All revenue from the fees and fines would be dedicated to the development and maintenance of bike facilities throughout the state
In 2010, New Jersey introduced a bill that would require all bikes using state public roads to be subject to a $10 annual registration fee, with a fine of $100 for those riders who fail to register.3 The bill was formally withdrawn in 2011 after garnering little support in the state legislature.4
In early 2012, Georgia’s Department of Natural Resources announced new bike trail fees and passes in state parks—a daily fee of $2-$3 for use of certain state park bike trails, or an annual fee of $25 for use on all state park bike trails.5
7
user fees
Discussion: Revenue limitations stem from the relatively low number of bike riders compared to car drivers and the difficulty of enforcing registration. Changes to registration fees and renewal periods will likely have little impact on revenues unless rates of compliance increase. Madison offers several recommendations on how a municipality (or state) can increase compliance rates, and thus revenue, from bicycle registration fees:
• Increase the number of renewal notices sent to owners of registered bikes. Currently, governments are losing out on potential revenue because bike riders are unaware of their registration expiration or unwilling to re-register their bikes when their registration expires.
• Create an advertising campaign that includes: (1) a description of the benefits of registering a bike (theft deterrence, increased bike recovery rates, and bicycle identification); (2) a high-ranking policymaker describing how additional revenues can improve bike infrastructure; and (3) a discussion of the specific projects funded by registration revenues.
• Increase transparency of enforcement by defining what constitutes a registration violation and what penalties will be incurred.
• Work together with major local institutions (universities, for example) to educate the public and achieve higher rates of compliance from residents.6
Carbon tax
Description: A carbon tax is a charge for carbon-based energy production—in this discussion, by motor vehicles. While a carbon tax can raise revenue to support infrastructure, the motivation for such a tax is tied more to incentivizing reduced travel, causing a direct improvement in emissions, and also reducing congestion, road costs, parking costs, land consumption, and vehicle-related crashes.7 Proposals for carbon taxes come with a wide variety of end uses, of which transportation infrastructure is only one. In the highway sector, levying carbon taxes could be similar to charging taxes on motor fuels, with some allowance being made for the varying carbon content of different fuels.
Revenue potential: High to moderate, depending on implementation. Carbon taxes for automobiles would be implemented as a fuel tax, taxing the carbon production per gallon of fuel, with proceeds going to transportation expenses. In some versions, however, carbon taxes are returned to taxpayers (making them “revenue-neutral”) or devoted to various clean energy projects, reducing the funding that might be available for transportation infrastructure and services. The carbon tax in British Columbia is perhaps the best known example of a tax revenue-neutral program.8

8
SSTI Survey of State and Local Transportation Revenue Sources
Modal applicability: Highway. Assessed on carbon content of motor fuels (diesel and gasoline).
Use: The use of the carbon tax has, to date, focused on reducing emissions from electricity generation. Finland and Sweden implemented carbon taxes during the 1990s. Quebec and British Columbia introduced the first carbon tax in North America in 2007 and 2008, respectively. Both provinces include taxation on gasoline for motor vehicles in their systems. The City of Boulder, Colorado, applied a carbon tax to electricity generation beginning in 2007.9
In British Columbia, the carbon tax acts as a consumption tax, similar to the fuel tax and sales tax, and all businesses, individuals, and visitors to the province are subject to the fees.10 Currently, the rate is set at 6.67 cents (Canadian) per liter of gasoline.11 As of March 2011, the tax had raised C$848 million, with all proceeds being returned to citizens through cuts to corporate and individual tax rates. British Columbia’s decision to make the tax revenue-neutral reflects the province’s goal of incentivizing energy efficiency, not raising revenue.12
Several U.S. states have discussed levying a carbon tax, but to date, none have. In 1997, California produced the “Global Climate Change Report: Greenhouse Gas Emissions Reductions Strategies for California.” Among other things, the report recommends the state impose a tax on vehicle carbon emissions. In 2000, Maryland established an Energy Task Force charged with creating ways to reduce energy consumption in the state; a carbon tax was one of the recommendations. Vermont recommended imposing a carbon tax in 1998.13
A cousin of carbon taxation, known as cap-and-trade, has been implemented in Europe and parts of the United States. The Regional Greenhouse Gas Initiative, commonly known as RGGI, is a cap-and-trade agreement between nine states in the Northeast that limits the emissions of carbon dioxide from power plants.14 States that enter into the agreement are required to spend 25 percent of cap-and-trade auction revenues on energy efficiency initiatives. In its first two years, the program raised $729 million for the participating states, while helping to stabilize emissions.15
The RGGI cap-and-trade system does not apply to gasoline used for motor vehicles, so only a small fraction of the proceeds are directed to transportation. However, states in the region are collaborating in the Transportation and Climate Initiative, which may consider pricing and revenue strategies.16
A national carbon cap-and-trade program was proposed in 2009. The American Clean Energy and Security Act, also known as the Waxman–Markey Bill, set a cap on the allowable amount of carbon emissions in the United States. Companies could buy or sell carbon credits, with the

9
user fees
government taking revenues from the auction; ten percent of those revenues would have been used for transportation projects. The bill was defeated in the Senate in 2010.
Discussion: Because these taxes are intended to encourage energy conservation, there is no particular requirement as to how the revenues are to be used.17 A carbon tax, if large enough to affect behavior, can have residual benefits on the transportation system by increasing its overall efficiency. Specific benefits include reducing traffic congestion, generating road and parking facility cost savings, increasing support for mobility options, and reducing pollution.18 Revenues generated from a carbon tax could also be used to benefit transit.
A carbon tax, like any flat tax, is regressive—by itself. Keeping the tax revenue-neutral in a way that protects the less affluent helps address this issue. Additionally, targeted tax reductions, cash rebates, and improved services are progressive in nature, potentially offsetting some of the regressive qualities of the carbon tax.19
Farebox collection
Description: Transit fares are a traditional source of revenue for transit systems, typically covering about one-third of the system’s operating costs. With transit aids from other sources either in short supply (decreasing local, state, and federal allocations) or useable in urban areas only for capital expenses (New Starts and the federal Urbanized Area Formula Programs), agencies across the country are forced to either raise fares or cut expenses, or both.
Revenue potential: High. Nationally, the farebox recovery ratio—the percentage of operating costs covered by farebox revenue—is 33 percent.20
Modal applicability: Public transit.
Use: Almost all transit operators impose fares on riders,21 and many have raised them in recent years as dedicated funds from federal, state, and local sources have dried up. Some recent examples include:
• Atlanta: Metropolitan Atlanta Rapid Transit Authority (MARTA), the transit agency serving the Atlanta area, recommended fare hikes of 50 cents for single rides in its fiscal year (FY) 2012 budget in order to maintain service levels and stabilize the agency’s financial condition.22
• Charlotte: The Charlotte Area Transit System has imposed five fare increases since 2006. Fares are expected to be raised to $2 in 2012. The most recent fare increase of 25 cents is expected to generate an additional $2.5 million annually to cover budget shortfalls.23
10
SSTI Survey of State and Local Transportation Revenue Sources
• Chicago: In 2009, the Chicago Transportation Authority increased single ride fares from $2 to $2.25 and monthly passes from $75 to $86, in response to decreased tax revenue at the state and local levels.
• New York City: The Metropolitan Transportation Authority (MTA), faced with a budget deficit upward of $10 billion for the years 2012–14, increased the cost of its unlimited monthly pass 17 percent, from $89 to $104, in 2010. Additional 7.5 percent increases are planned for 2013 and 2015.24 This biannual fare increase has become a regular part of the authority’s business plan, due to expected decreases in funds from state and federal sources.
Discussion: Raising fares poses equity issues, because it most adversely affects the poor, the people who depend on transit the most. In response, some systems have adopted lower fares for older or low-income riders. Also, increased fares could lower ridership levels enough to effectively lower operating revenues. However, in 2011, even as 80 percent of agencies across the country either were considering raising fares or cutting service (or both)25 or already had, ridership on public transportation has increased.26
Fine-based funding
Description: Increasing traffic fines or dedicating their proceeds to transportation projects and maintenance is one way a state or municipality can increase transportation funding without increasing other taxes. This strategy also has the side benefit of reducing dangerous driving behavior.
Revenue potential: Marginal. In Oregon, increased traffic fines in school zones generated over $1.2 million in the first two years of policy implementation. “The biggest problem with fine based revenue is having funding for enforcing the fines; without it the amount of money generated from fines is minimal” Washington DOT
Modal applicability: All modes. Fines generated in school zones should be used to enhance road, bike, and pedestrian safety, particularly around schools.
Use: Florida authorizes local government use of red-light cameras at intersections to enforce traffic laws. The maximum fine for a violation is $155. The local government issuing the citation retains $75, $55 is remitted to the state’s General Revenue fund, and the remainder is allocated to trauma care centers and hospitals.27
In 2007, Virginia enacted legislation to increase fines for traffic violations on state roads, with some moving violations collecting fines of up to $3,000. The purpose of these additional fines, called “civil remedial fees,” was to

11
user fees
generate additional revenues from the most dangerous of drivers. Proceeds were dedicated to cover the administrative costs of the program, with the balance going to the highway maintenance and operating fund.28 In 2008, the law was repealed and all fees collected were refunded.29
In 1996, the Washington State legislature enacted the School Zone Safety Improvement Project, which effectively doubled the fine for speeding through playground zones and school crosswalks. The law requires that half the doubled fine—or $66—be dedicated directly to school safety enhancement programs. In 2000, during the pilot phase of the project, no school children were injured or killed in a traffic-related accident.30
Arizona legislation doubled vehicular traffic fines in school zones. Fines are now a minimum of $200, depending on the jurisdiction.31
Portland, Oregon, passed a law increasing traffic fines for certain violations, including running red lights and stop signs. A portion of the increased fine revenues are dedicated to a pilot study for Safe Routes to School (SRTS) programs at 25 elementary schools in the area. In the first two years, $1.2 million was raised for the program.32
Discussion: Traffic fines for violations in school zones, in addition to local, state, and federal aid, are a potential source of funds for SRTS programs. Drivers who speed through designated school zones, especially when children are present, endanger the most vulnerable of pedestrians. It is therefore logical that all or a portion of the revenues from these fines be used to fund programs that better enhance the safety measures of the transportation systems around schools. SRTS programs calm traffic and reduce the number of vehicles driven by parents in school zones and other areas where children walk and bike to school. Additional revenue can be generated by increasing the fines associated with speeding, running red lights or stop signs, and illegal parking within a designated school zone. The extra revenue can be used as supplemental funds to SRTS or similar traffic safety programs and for a number of other enhancements, including increased policing near school and sponsoring community events.33 For the mechanism to be effective, the potential costs associated with increased enforcement must not outweigh the increased revenues.
The SRTS National Partnership recommends that any policy that attempts to increase enforcement of traffic violations should connect the revenue from the fine to the population the violators put most at risk. By doing this, “the solution is proportional to the problem; funds generated from dangerous behaviors directly benefit those at risk.” With this in mind, increased traffic fines within a school zone would optimally be used to help fund beneficial school safety programs such as SRTS. 34

12
SSTI Survey of State and Local Transportation Revenue Sources
Heavy vehicle fees
Description: Heavy vehicle fees are commercial registration fees for designated vehicles. Fees are set based on the vehicle’s weight, in an effort to recoup expenses that result from the extra wear and tear heavy commercial vehicles imposes on the road system. The federal government administers the Heavy Vehicle Use Tax (HVUT), an annual fee for commercial vehicles over 55,000 pounds. The maximum fee imposed on an individual vehicle through the federal HVUT is $550.35 In addition, individual states can impose their own heavy vehicle fees. Oregon, for example, imposes a Heavy Vehicle Title fee, set at $90 for vehicles or trucks with a gross vehicle weight rating of over 26,000 pounds and trailers with a loaded weight of over 8,000 pounds. It also imposes a weight-mile tax for these heavy vehicles—a per-mile charge that increases with the weight of the vehicle, beginning at 26,000 pounds. Both these fees help cover the highway wear and tear caused by heavy vehicles.36
Revenue potential: Moderate. Nationally, in 2008, the federal revenues from the HVUT totaled $1 billion. That compares with total Highway Trust Fund revenues of $38.7 billion in the same year.37
Modal applicability: Highway.
Use: In Tennessee, the state issues overweight vehicle permits to shippers. The charge is a fixed rate for up to one million pounds. Vehicles over this amount are charged for the “calculated/anticipated” cost of abuse to the road/bridge surface. There are no segregated fees for heavy vehicles below one million pounds.
Florida issues permits for heavy vehicles with fees based on vehicle weight and dimension. Permits may be purchase using a web-based system.38
South Carolina issues permits for heavy vehicles where:
• The power unit has two axles and a gross vehicle weight or registered gross vehicle weight exceeding 26,000 pounds.
• The power unit has three or more axles and weight does not matter.
• If used in combination, the weight of the combination exceeds 26,000 pounds.39
In Oregon, revenue from the state’s weight-mile tax, which replaces the fuel tax for heavy vehicles to make up for the greater maintenance costs they cause, is used exclusively for the construction and maintenance of roads. The state forecasted HVUT revenues at $487 million in the 2009–11 biennium.40 The tax is imposed on heavy vehicles, with the rate varying based on a combination of the number of axles and/or total weight and the number of miles the vehicle has traveled on public roads in Oregon.41

13
user fees
Montana imposes an annual fee on commercial buses, heavy trucks, and tractors based on the vehicle’s weight and age. Fees increase for heavier vehicles, but decrease as a vehicle ages, reflecting the decrease in the vehicle’s value.42 The tax is a major contributor to the Licensing and Permitting Bureau (LPB), which includes other programs such as personal vehicle registration. The LPB generates roughly $29 million a year, with proceeds going directly into the Highway Special Revenue Account.43
Discussion: Imposing heavy vehicle fees on commercial vehicles, which cause the most damage to roads, is an efficient way to allocate the costs of maintenance among road users. The U.S. Department of Transportation (DOT) estimates that a light commercial vehicle weighing less than 25,000 pounds pays about 150 percent of its share of road damage through user fees, while the heaviest commercial vehicles, weighing more than 100,000 pounds, pay only about 50 percent of the costs they impose on the transportation system.44 By more accurately reflecting the extra costs these vehicles impose on the transportation road network, heavy vehicle fees help to level the playing field among personal autos and heavy commercial vehicles, while at the same time acting as a sustainable source of transportation funds for state governments.
Severance fees
Description: Severance fees are charges levied on operators in the natural resource extraction industries such as coal, timber, or stone. These heavy industrial companies are usually located in remote areas of natural resource-abundant states, where the heavy vehicles they use cause the vast majority of the damage to roads. The fees can therefore be used to fund road improvements in rural areas where heavy trucks contribute most to the system’s disrepair.
Revenue potential: Moderate. Nationally, resource extraction fees generated almost $11 billion in 2007. In theory some of this revenue could be directed towards transportation needs. However, no state allows severance taxes to be dedicated directly to transportation system costs.
Modal applicability: All modes.
In all, 35 states charge a severance tax for resource extraction. Most states dedicate this funding to specific purposes such as county and local governments, conservation and remediation efforts, and schools. No state, however, allows for funding to be dedicated directly to transportation.45
Colorado introduced a bill in 2008 that would have redirected current severance tax revenues away from the Department of Local Affairs, which

14
SSTI Survey of State and Local Transportation Revenue Sources
distributes money to municipalities, and dedicated the revenue specifically to transportation funding.46 The bill was easily defeated.
Discussion: The Colorado bill was rejected because the current recipients of severance fee revenues—water, clean energy, and species conservation projects—would have lost significant amounts of funding if the reallocation to the transportation system occurred.
Vehicle miles traveled (VMT) fee
Description: A VMT fee (also known as a mileage-based user fee) is a distance-based tax whose revenues can be used to fund transportation system costs. Vehicle operators—both personal and commercial—are charged a per-mile fee instead of, or in addition to, the gas tax. With more fuel-efficient cars and lower rates of driving resulting in a decline in motor fuel tax revenues, VMT fees have been proposed as a replacement for the gas tax. It can be argued that VMT fees do a better job than fuel taxes at matching users’ road consumption to the tax they pay for road maintenance and construction. In other words, because the mileage driven better reflects the damage a car puts on a transportation system, charging by the mile more efficiently allocates the costs to road users.
Minnesota’s-Mileage-Based User Fee (MBUF) Policy Task Force identifies two primary objectives for the policy: (1) using MBUF to promote equity by ensuring that drivers pay for the damage they cause to the roadway, regardless of energy use; and (2) generating transportation funds through MBUF instead of through the normal fuel tax. Additionally, the group identifies two supplementary long-term objectives: (1) protecting the environment by reducing vehicle emissions and fuel consumption; and (2) improving transportation system performance by efficiently managing travel demand.47
Revenue potential: Very high. A VMT fee has the potential to replace the fuel tax as the primary source of funds for transportation systems, particularly as individuals transition to alternative fuel vehicles. It is estimated that implementing a one-cent-per-mile fee nationally would raise $32.4 billion per year.
Modal applicability: All modes. As with the fuel tax, there is the potential to use revenues generated for all modes, but some states would likely restrict VMT fee revenue to roads.
Use: In 2006 and 2007, Oregon conducted a pilot program to test the feasibility of using electronically collected data from volunteer vehicles to implement a mileage-based fee system. In all, 285 vehicles were outfitted with an electronic device that monitored the number of miles driven in predefined zones. In addition, some participants were charged higher
A VMT fee has the potential to replace the fuel tax as the primary source of funds for transportation systems, particularly as individuals transition to alternative fuel vehicles.

15
user fees
fees in specific congestion pricing zones and during peak travel times. The device generated an electronic receipt using global positioning signals (GPS) that were sent to specially-equipped gas pumps when the vehicles were refueled. At the pump, the standard fuel tax was deducted from the amount owed by the driver, and the total calculated VMT fees owed were added back. In the end, the test demonstrated that mileage fees had the ability to raise substantial revenue (without erosion for fuel efficiency) and were relatively easy to pay, collect, and administer.48
A study by the Mineta Transportation Institute analyzing the results from Oregon’s pilot program further assessed the impact implementing the policy had on travel behavior. Four primary impacts were observed:
• Participants who were charged a higher fee during peak commute times did, in fact, reduce their peak-time travel more than participants who were charged a flat fee at all times. Also, participants who were charged more for driving in designated congestion zones reduced their miles driven in these areas more than participants who were charged a flat mileage fee for all areas.
• Surprisingly, there were no spillover effects from participants who were charged higher rates during peak travel times or in designated congestion areas. That is, there was little or no increase in the level of VMT during off-peak hours or in areas outside congestion zones as a result of the lower fee rates. The study noted, however, that this may be a result of Portland’s Urban Growth Boundary, which limits the destinations outside the designated congestion zone.
• Households that paid higher rates during peak hours and lived in more dense, mixed-use neighborhoods reduced their peak hour VMT levels more than similar households in less dense neighborhoods.49
Washington State’s pilot program in 2005 and 2006 had similar findings as Oregon’s. Conducted by the Puget Sound Regional Council (PSRC), the study put GPS meters in 275 volunteer vehicles and electronically deducted mileage fees from a prepaid driver account based on time traveled, distance traveled, and roads used. Like the subsequent Oregon study, the PSRC program raised transportation funds without revenue erosion from fuel efficiency. In addition, administrative and infrastructure costs were minimized by utilizing GPS technology.50
In 2011, Minnesota began a pilot program with the intent of “identifying and evaluating issues for potential implementation of [mileage-based user fees]” in the state. According to the Minnesota DOT, the MBUF Policy Study, similar to other pilot studies, was spurred by the desire to bridge the transportation funding gap caused by decreasing fuel tax revenues. In 2007, the state legislature approved $5 million to be allocated to the pilot program from the Trunk Highway Fund.51 Unlike Oregon and Washington, which used in-

16
SSTI Survey of State and Local Transportation Revenue Sources
vehicle GPS devices to monitor travel behavior, the Minnesota study had volunteers using GPS capabilities in smart phones to provide travel behavior for particular trips.52 The volunteers either opted into smart phone-based mileage tracking or opted out of the smart phone tracking and used their odometer instead. The use of smart phone technology was incentivized with a reduced per-mile charge. Using existing infrastructure and available cell phone technologies, the program offered users of the cell phone option the ability to log on to a web-based application to self-verify the accuracy of their mileage and to ask questions of program support staff. Preliminary findings suggest that the program achieved a high rate of user acceptance.53 A final report for the study is expected to be available in 2012.
Internationally,distance-based fees already exist for trucks in Austria, the Czech Republic, Germany, and Switzerland. A program in the Netherlands to assess mileage-based fees for passenger vehicles was initially approved by Parliament, but was shelved after a political shift in the 2010 election.54 The Dutch plan crumbled for the same reasons others have—concerns over privacy and a political aversion to implementing a new tax.55
Discussion: According to Minnesota’s MBUF Study Task Force, there are a number of benefits and concerns associated with the implementation of mileage-based fees. Potential benefits of implementing such a policy include:
• Equity: A mileage-based fee could help to ensure that all drivers pay their share of the costs they impose on the roadway transportation system. An MBUF, if applied like the gas tax, impacts low-income disproportionately.
• Flexibility: The policy offers a flexible approach that can be effective regardless of the fuel source used by a driver.
• Sustainability: As fuel tax revenues diminish due to increased fuel efficiencies, a mileage-based fee can act as a more sustainable revenue source for transportation funding.
• Variety of potential applications: The policy not only generates sufficient transportation revenue, it can also be focused on congestion mitigation and pollution control.
• System management: Depending on how the policy is implemented, accurate real-time travel data can be available to motorists during peak travel hours.
The Task Force also provided a list of concerns associated with implementing a policy of mileage-based fees:
• Cost: Implementing the new policy has the potential to be administratively expensive compared to implementing the fuel tax. One report estimates that the administrative costs of collecting VMT fees

17
user fees
would total up to six percent of total revenues, an increase from the cost of collecting the fuel tax, which is less than one percent of all revenues.56 However, the VMT pilot completed in Minnesota suggests that costs might be lower than originally estimated, particularly if the system uses readily available technologies and infrastructure.57
• Privacy: Many citizens feel that using technology to monitor their travel behavior is an invasion of their privacy.
• Jurisdictional issues: There are technological limitations associated with implementing a mileage-based fee policy, such as the difficulties that arise with charging out-of-state drivers using an in-state roadway. In the absence of a federal mileage-based fee, it may be overly complex to have varying state-by-state fees, which is how the fuel tax is currently structured. It is therefore recommended that, when exploring mileage-based fees or conducting pilot studies, states work in partnership with contiguous states to work out potential jurisdictional problems. Coordination among states may also lower the administrative costs of implementing such an MBUF strategy.
• Technological feasibility: Aspects of new or existing technologies might limit or delay the implementation of the policy.
• Acceptance: Many policy decision-makers and most citizens know little about VMT fees. Addressing their stated concerns would be necessary before receiving more widespread acceptance of a mileage-based fee.
• Use of revenues: State legislation currently specifies how revenues from fuel taxes must be distributed, but no state has determined how to use proceeds from a mileage-based fee. This issue will need to be addressed prior to any policy implementation.58
A study by the University of Iowa Public Policy Center, which conducted a four-year national evaluation of mileage-based road user charges, came to several conclusions that address some of the concerns stated above. The study showed that support for the policy increased considerably as drivers became more familiar with the program. Initially, 42 percent of participants held a favorable view of the policy; ten months later, 70 percent held a positive view.59 Because perceptions are positively affected by exposure to ideas, policymakers should stress public awareness and education before attempting to promote legislation to gain the most public support for a VMT fee.
The Mineta Transportation Institute’s study reached several more conclusions about the policy’s effect in changing travel behavior:
• Charging higher fees for peak travel and for travel in designated congested areas could effectively reduce congestion where reduction is needed most.
Because perceptions are positively affected by exposure to ideas, policymakers should stress public awareness and education before attempting to advance legislation to gain the most public support for a VMT fee.
18
SSTI Survey of State and Local Transportation Revenue Sources
• The VMT reduction during peak-hour travel and in more congested zones will be greatest for drivers who live in more dense, mixed-use neighborhoods.
• Compared to the current motor fuel tax system, a system based on mileage traveled will strengthen the effects urban form has on travel behavior. Switching to a VMT tax would therefore strengthen the ability of planners to use land use planning to moderate single occupancy vehicle (SOV) travel demand, mainly by shifting solo driving trips to carpooling or more sustainable modes such as transit, bike, or pedestrian.
• A VMT fee policy’s impact on travel behavior depends on how it is implemented. If fees are paid relatively rarely compared to the current fuel tax, the effect on travel behavior would be weaker because the charges are less apparent. On the other hand, if fees are paid regularly—for instance, every time the driver refuels—the effect would be stronger.60
Vehicle title, registration, and vanity plate fees
Description: All states levy a motor vehicle registration fee for passenger vehicles. These fees are usually paid on an annual or biannual basis, depending on the state. In some states, local or county governments can also levy their own fees to help fund their transportation systems. For the average vehicle, fees range from a low of $8 in Arizona to a high of $167 in the City and County of Honolulu, Hawaii. Selling personalized license plates can also add to the revenue stream. Today, 9.3 million vehicles in the United States have personalized license plates, and 46 states charge fees for them, generating revenues of $177 million in 2007. Now, with budget problems across the country, states are increasingly looking to raising the fees on personalized license plates as a way to increase transportation revenues.61 Titling fees are less important, as titling happens less frequently than registration, but this fee, too, is a potential source of new revenue.
Revenue potential: High. Data from 2009 record 254 million vehicles registered in the U.S. In some states, annual registration and related fees generate upward of one-quarter of the dedicated transportation fund.62 The structure of the fee varies widely, from a flat per-vehicle fee to a rate based on vehicle type, weight, age, horsepower, or value.
Modal applicability: Highway. Mechanisms vary widely from state to state, as does where the proceeds from this fee are directed. Transportation infrastructure improvements, law enforcement, and transportation safety projects are often recipients of funds. In Washington State, for example, statutes require that “vehicle license fees and renewal vehicle license fees…be used for the sole use of the Washington state patrol for highway activities of the Washington state patrol.”63 In Wisconsin, revenues from

19
user fees
vehicle registration fees and personalized license plates are put in the segregated transportation fund, which pays for all transportation programs, including road, transit, and active modes.64
Use: Every state collects vehicle registration fees from drivers. The following states have recently passed legislation raising their fees:
• Colorado raised vehicle registration from $32 in 2009 to $41 in 2011 and each year thereafter.65 The Colorado legislature also made a legal declaration that funding transit with vehicle registration fees constituted maintenance of state highways because transit would, in effect, decrease demand and thus lower wear and tear and increase the useful life of the roads.66
• Hawaii raised registration fees from $25 to $45, $40 of which goes to the state highway fund. The measure is expected to increase revenues to the fund by $56 million per year.67
• Kansas increased motor vehicle registration fees by $4 to $30. Revenues from the fee increase were used to update a computerized vehicle information processing system for the Department of Vehicles.68
• South Dakota raised registration fees from $42 to $51 in 2011 and to $60 in 2013, raising an estimated $31 million annually.69
• New York imposes an annual supplemental registration fee of $25 on all personal vehicles in the Metropolitan Commuter Transportation District, a 12-county region that includes New York City and the surrounding suburban counties.70 Revenue from the fee is deposited in the MTA aid trust account, to be used for transit capital and operations and maintenance expenses in the region.71
• South Carolina assesses vehicle registration fees by vehicle weight, with fees ranging from $24 for a passenger car to $100 for a truck weighing between 9,001 and 10,000 pounds.72 The DOT retains 80 percent of the revenue generated through this program.
• Oregon title fees increased from $55 to $77, and the cost of a two-year registration will increase from $54 to $86.73 The new fees are part of a transportation funding package that is expected to support a consistent $300 million per year for road repairs, a series of 37 state highway construction projects, and alternative transportation modes such as Amtrak station improvements, transit support, and bicycle and pedestrian projects.74
• Utah increased motor vehicle registration fees by $20 to $41,75 which is expected to generate $53 million per year.76 It is expected that the additional funding, which has received bipartisan backing, will be used for bonding to help finish the Interstate 15 expansion, a major project in the state.77

20
SSTI Survey of State and Local Transportation Revenue Sources
• Vermont increased vehicle registration fees from $60 to $65, generating $1.7 million annually.78 The following are states that have increased their annual personalized license plate or conservation license plate fees in recent years:
• New Hampshire increased the annual fees on personalized license plates and conservation license plates from $25 to $50 in 2009. The increase in fees led to only a five percent decrease in sales, and state revenues from personalized and conservation plates increased 52 percent to $6.65 million in FY 2010.79
• In 2009, Nebraska raised the fees for personalized license plate issuance by $10, with proceeds directed to the state’s highway trust fund.80
• In 2011, Texas hired a private company to auction off personalized license plates. The state hopes to raise $25 million in auction revenues over the next five years. In the program’s first auction, the state raised $139,400 by auctioning just 33 plates.81
• Maryland increased its personalized license registration fee from $25 to $50 per registration year in 2011.82 The state also increased titling fees on new vehicle purchases from $50 to $100. Together, the changes are expected to raise about $50 million every year for transportation finance.83
Discussion: The revenue from vehicle fees provides a great opportunity to capture additional funds. To take full advantage of this revenue stream, the fees should be indexed to account for inflation. Without indexing, this revenue source will decline, as the money collected fails to keep pace with increasing costs. Care should be taken to craft policy language that limits or eliminates the possibility of this money being siphoned off for other, non-transportation, purposes.
While vehicle-related fees are considered a user fee, they do not have the same market-creating power that fuel- or mileage-based fees do, because the fees are the same regardless of the vehicle’s use. Raising fees for an optional service, such as personalized license plates, may be better accepted than an across-the-board increase, but the latter would bring in more revenue.
fuel Taxes

21
fuel Taxes
Fuel taxes
Alternative fuel tax
Description: Demand for gasoline has trended downward in recent years as consumers transitioned to alternative fuel and more fuel-efficient vehicles, or reduced their vehicle miles traveled. These changes have negatively impacted the revenues states have traditionally received from their primary transportation revenue source, the motor fuel tax. This drop in motor fuel tax revenue has led some states to explore other user-fee revenue options that would capture some of the lost motor fuel tax revenue.
Revenue potential: Marginal, but with high growth potential as more alternative-fuel vehicles come into use.
Modal applicability: Highway modes primarily, but revenues could be used to support multiple modes.
Use: Many states, including Tennessee, charge a tax on ethanol fuels (E85 and B20) just like regular fuel. Virginia levies a tax at the rate of $0.175 per gallon on liquid alternative fuel and other alternative fuels used to operate a highway vehicle. Revenues generated are dedicated to transportation uses.84
The New Mexico DOT imposes an alternative fuel tax of $0.12 per gallon on alternative fuels distributed in the state. Distributors of alternative fuel, defined as liquefied petroleum gas (LPG), compressed natural gas (CNG), liquefied natural gas (LNG), or a water-phased hydrocarbon fuel emulsion, are assessed the per-gallon fee, and tax revenues go to the state road fund.85
Washington State also has a similar taxation system. Owners of compressed natural gas- and propane-powered vehicles are required to pay an annual license fee, based on gross vehicle weight rating (GVWR), instead of motor fuel taxes. The fee is calculated as follows:86
GVWR Fee
10,000 lbs. or less $45
10,001–18,000 lbs. $80
18,001–28,000 lbs. $110
28,001–36,000 lbs. $150
More than 36,000 lbs. $250
To address the concern over declining gas tax revenues caused by the adoption of electric vehicles, Washington State passed a law in February 2012 assessing a $100 annual fee on owners of hybrid-electric vehicles to help recover lost gas tax revenues.87 Although Washington is the first state to pass such a law, others, including Texas, are discussing the possibility.88
To address the concern over declining gas tax revenues caused by the adoption of electric vehicles, Washington State passed a law in February 2012 assessing a $100 annual fee on owners of hybrid-electric vehicles.
fuel Taxes

22
SSTI Survey of State and Local Transportation Revenue Sources
Discussion: States vary in how they dedicate revenues from this tax, but typically divide the funds between the state and local governments for use on road projects. A state could dedicate a portion of the revenues from this tax to alternative modes such as transit and non-motorized modes.
Assessing owners of hybrid-electric vehicles a fee and levying a tax on CNG-, LNG-, water-phased hydrocarbon fuel emulsion-, and LPG-powered vehicles could help make up for some lost gas tax revenues. These fees also promote a more consistent, equitable way to levy user fees to help pay for public roadways and support a multimodal transit system.
These fees begin to address the issue of cost sharing by road users to account for the wear and tear for which each road user is responsible. Because each vehicle on the road places a maintenance burden on the roadway regardless of the type of fuel used in the vehicle, it is appropriate to consider alternative ways to recover the costs of maintaining these transportation facilities. A VMT fee might be administratively less burdensome to state and local agencies, while still addressing the need to assess fees to help maintain the roadway system.
Indexing the fuel tax
Description: Motor fuel taxes are one of the primary sources of transportation funding in the United States. Eighty-two percent of federal transportation funding comes from the federal motor fuel tax, and 30 percent of non-federal support for state highways comes from state motor fuel taxes.89 In recent years, though, motor fuel tax revenues have eroded dramatically compared to the rate of inflation and the cost of maintaining the transportation system. In fact, after adjusting for growth in construction costs, the average state’s effective motor fuel tax rate has actually fallen 20 percent since the last time it raised rates.90
Indexing the motor fuel tax to either the consumer price index (CPI) or the construction cost index (CCI) would help maintain fuel tax revenues states receive. Indexing to the CPI or the CCI differs in that fuel taxes indexed to CPI would decrease when the cost of living or the price of fuel decreases, thus leading to a drop in revenue available to fund transportation. The CCI index, on the other hand, would better match revenues to DOT actual costs. For example, from January 2011 to January 2012, the CCI increased 4.3 percent, while the CPI increased only 2.9 percent.91, 92
Another option, which is the most common form of a variable fuel tax for states, is using an ad valorem fuel tax. This essentially acts as a sales tax on the price of gasoline; instead of the revenues going to the general fund, like the general sales tax on the sale of retail goods, the proceeds from a fuel sales tax could be dedicated exclusively to transportation.
23
Currently, states that charge a fixed-rate fuel tax experience decreased revenues every year because the tax does not account for increases in inflation. This decline in fixed-rate fuel tax revenues, combined with declining gas consumption, increasing fuel efficiency, and a downward trend in vehicle miles traveled, has severely impacted available transportation revenues in most states. According to the Institute on Taxation and Economic Policy, state governments are foregoing more than $10 billion of revenue every year by not indexing their fuel taxes.93 By adjusting motor fuel tax rates automatically, states can potentially avoid the difficulty associated with implementing increases in the motor fuel tax, while at the same time stabilizing an important user-based source of revenue.94
Revenue potential: Very high. The fuel tax is currently the largest single source of transportation funding in the United States. Raising the tax at the local or state level can be a good way to help reverse the erosion of motor fuel tax revenues caused by increases in the cost of construction and other agency operations and decreases in fuel consumption. It should be noted that reductions in VMT, increased fuel efficiency, and the increased use of alternative fuel vehicles will likely impact the reliability of this revenue source over time.
Modal applicability: All motorized modes, although some states currently reserve motor fuel taxes for highways. Of the 18.4-cent federal gas tax, 2.44 cents must be put in the mass transit account and 15.44 cents must go toward the highway account of the Highway Trust Fund.95 For state gas taxes, policies vary from state to state. In Oregon, for example, all the proceeds from the motor fuel tax must be used to fund state roads.96 Because of this, some states have implemented what has become known as a “lawnmower tax,” which is a fee on gasoline that is not used in automobiles. The revenues from such programs are put in a segregated fund and can be used for alternative modes. In other states like Wisconsin, all proceeds from the gas tax go to the segregated transportation fund, which supports all transportation programs, including transit and alternative modes.97 Such an approach allows agencies to optimize their use of available funds.
Use: Forty-nine states levy a fixed-rate tax on the sale of gasoline. Rates range from eight cents per gallon in Alaska to 37.5 cents per gallon in Washington State. Thirty-six states rely exclusively on this tax for motor fuel tax revenues. Other states levy a variable fuel tax rate on top of the fixed-rate tax. The most common variable rate tax is based on the price of gasoline. Thirteen states charge a tax based on the price of fuel, including the following:98
• California charges 2.25 percent sales tax on the sale of gas on top of the flat rate of 35.3 cents per gallon sold.
fuel Taxes

24
SSTI Survey of State and Local Transportation Revenue Sources
• Connecticut charges a flat rate of 25 cents per gallon, and charges an additional seven percent sales tax. Assuming a $3.75 price per gallon, this adds about 26 cents per gallon.
• Georgia charges a four percent sales tax on gasoline, based on stated average prices updated every six months. In early 2011, the stated average price was $3.217, for a variable fee of 12.8 cents per gallon.
• Hawaii charges a variable sales tax, based on the price of gasoline, on top of the flat rate of 17 cents per gallon. This is an extension of the general sales tax in the state.
• Illinois charges a sales tax of 6.25 percent of the price of gasoline less federal and state flat rate fuel taxes, an extension of the general sales tax in the state.
• Indiana has a sales tax rate of seven percent on the price of gas less state and federal flat fees per gallon, an extension of the general sales tax in the state.
• Michigan levies a sales tax of six percent on the price of gasoline, an extension of the general sales tax in the state.
• North Carolina: On top of the 35.2 cent flat fee per gallon, North Carolina charges a sales tax of seven percent of the average six-month price of gas.
• New York State charges a four percent sales tax on the price of gas.99
• Vermont charges a “motor fuel transportation infrastructure” fee of two percent of the average price of gas in the prior quarter, less taxes.100
Four out of the 13 states that levy a tax based on the price of gasoline—Hawaii, Illinois, Indiana, and Michigan—only apply the state’s general sales tax to fuel sales. The revenue from the sales tax on gasoline in these states, like the revenue from the tax on general retail consumption, is deposited in the general fund to be used for government operation. The other nine states, which charge a tax rate separate from the general sales tax, are able to apply the proceeds from the variable rate gas tax to the transportation system.101
Two other states allow for a variable fee on gas based on the cost of living and the amount of transportation spending approved by the legislature (closely tied to the CCI). In Florida, the majority of the gas tax is tied to changes in the CPI—measured as the rate of inflation in the price of a “bundle of goods” in the state. Nebraska levies a variable fee based on the budgeted amount of transportation spending in addition to its flat rate, and automatically adjusts the fee to raise just enough revenue to pay for the transportation spending approved by the legislature. However, because decision-makers have been hesitant to increase spending levels in a way that may trigger a fee increase, the policy in Nebraska has had little effect.102
25
fuel Taxes
Discussion: The Institute on Taxation and Economic Policy’s study analyzing national gas tax policies notes that the average state has not increased its gas tax rate in more than a decade, and 14 states have gone more than 20 years without a rate increase. The study goes on to note that today’s gas taxes make up a smaller portion of a family’s budget than at any time since the 1920s, when gas taxes were first used. Simply put, increases in the gas tax have lagged well behind increases in income. A ten-cent increase in a state’s gas tax would cost the average family only $4.31 per month, but would enormously benefit a state’s transportation system.103
The study offers three specific policy recommendations:
• Increase the gas tax to reverse long-term erosion. Rather than reallocate general funds away from other public programs to pay for underfunded transportation systems, states should increase the motor fuel tax. The appropriate increase in each state can be determined by policymakers and the public, based on expected transportation needs. States can calculate the increase necessary to return revenues from the motor fuel tax to their previous purchasing power the last time the rate was raised. For example, Alabama, a state that charges only a flat rate gas tax and has not increased the rate in 19 years, would need to raise the flat rate by 10.7 cents in order to return to its previous level. The increased rate would produce an additional $280 million in transportation revenue for the state every year.
• Restructure the gas tax so it rises automatically with the inevitable increases in the cost of maintaining the transportation system. Although an increase in the tax rate could ensure sufficient short-term revenue, the tax needs to be structured so that the revenues do not once again fall behind transportation funding needs. As described above, there are three ways to do this: linking the tax rate to changes in construction costs, linking the rate to changes in the CPI, or linking the rate to the price of gasoline.
The best option recommended by the study for indexing the motor fuel tax is to link the rates to changes in construction costs, which best reflect the changes in transportation spending. This policy is not currently used in any state, although Michigan and Ohio previously levied their gas taxes in this way, and the Arkansas Committee on Highway Finance recommended this reform to the state.
Linking the rate to CPI, which is currently the policy in Florida, is an improvement over a flat rate-only policy, but when construction costs rise faster than the rate of inflation—which happened through much of the 2000s—revenues will likely be inadequate.
Linking the tax rate to the price of gasoline is the most common policy among states, but transportation costs tend to rise more over time than the
26
SSTI Survey of State and Local Transportation Revenue Sources
price of gas, leading again to shortfalls. Gas prices can change as much as 20 percent from one year to the next, and linking transportation revenues to such a volatile base can pose challenges to a state’s transportation system.
• Reduce the regressive nature of gas tax increases by creating low-income relief. Low-income families spend a larger share of their income on gas taxes than do high-income families. States can reduce the tax’s regressive nature by creating a refundable tax credit or strengthening an existing credit program. These credits can provide a dollar-for-dollar decrease in the gas tax liability for families below a certain income, ensuring that any gas tax reform does not adversely affect those least able to pay.
Oil company franchise tax
Description: Imposing a franchise tax on oil companies doing business in a state is a fairly common practice; court cases brought by oil companies can be found dating to the 1950s.104 Currently some states that have capped the rate of their franchise tax are debating lifting those caps to help raise revenue.
Revenue potential: Very high, especially for states that either have capped or do not use this tax. Uncapping the tax and adjusting it to inflation would raise significant additional revenue.
Modal applicability: Modes relying on liquid fuels.
Use: Many states collect an oil company franchise tax. In 1981, Pennsylvania began assessing a mill rate on fuel distributors based on the wholesale price of gasoline and diesel. In 2011, the state charged 19.2 cents per gallon of gasoline and 26.1 cents per gallon of diesel.105 New York State levies a tax on all companies engaged in the business of importing and distributing gasoline and diesel fuel.106
Discussion: Capping oil company franchise taxes depresses revenue that could be generated from this source. As costs continue to rise, states that have capped this tax will not be able to take full advantage of the revenues that could be generated through the franchise tax. Removing these caps, if they exist, and indexing the rate to inflation would generate significant new revenue. For example, Pennsylvania’s oil company franchise tax is paid by fuel distributors and only applies to the first $1.25 of the per-gallon wholesale price of gas. Raising this ceiling to $1.63 (closer to the actual wholesale price), for example, could potentially yield the state an additional $420 million annually, and indexing the rate would help revenues remain consistent from year to year.107

27
Tolling and Road Pricing
Tolling and road pricingOverview: Historically, tolling and road pricing were often seen as a way to generate capital or repay debt for highway construction; after construction was completed, the DOT would remove the tolls. Today, with growing needs for system preservation, tolls and road pricing are an option to support ongoing operations and maintenance. Tolling and road pricing are closely related strategies that generally attempt to recover the actual costs of providing transportation facilities.108 Tolling involves the imposition of a per-use fee on motorists using a highway that typically varies by vehicle type and distance traveled. The main purpose of tolls is to generate revenue.
State DOTs vary in the legislative enabling authority that governs how they may use toll revenues. However, there are four common ways, other than for debt retirement, that toll revenue is used: (1) operations and maintenance of roadway transportation and transit systems, (2) system expansion, (3) general support for state transportation projects, and (4) investment in economic development projects. Some states use toll revenue for maintenance of the specific tolled roadway. Others, such as Oklahoma or Delaware, pool toll revenues in a general transportation fund for use on a variety of transportation needs or to support transit.109
Road pricing is distinguished from tolling in that, although it generates revenue, it also serves as a tool for managing demand, reducing congestion, and forestalling expensive new capacity projects. Pricing strategies attempt to manage demand by determining the value of a trip on a particular facility at a particular time, thus imposing fees that vary by time of day, location, type of vehicle, number of occupants, or other factors.110 Pricing is commonly applied to roadways, but some communities, such as San Francisco, are experimenting with the pricing of parking as well.111
Flat rate tolling
Description: Flat rate tolling is a direct user fee charged to motorists. Tolls charged per vehicle may vary by distance and the number of axles and distance driven, but not by time of day.
Revenue potential: Very high. Some flat-rate toll roads have been completely funded by toll revenues.
Modal applicability: Highways, ferries, and bridges.
Use: States throughout the country have implemented tolls on newly constructed highways to help fund their construction, and flat rate fees are one of the most common types of tolling used. Some states have removed tolls after recovering construction costs, while others have maintained the fees to support the operation and maintenance of roads and/or transportation-related facilities. For example, California has used
28
SSTI Survey of State and Local Transportation Revenue Sources
toll revenue from the San Francisco-Oakland Bay Bridge, the San Mateo-Hayward Bridge, and the Dumbarton Bridge to fund construction of the Bay Area Rapid Transit system.
Several states use flat rate tolls for ferry and bridge systems. For example, North Carolina charges a crossing toll to use many of the ferries in its system.112
Discussion: Toll revenues may be used in a variety of ways to maintain or enhance a state or local transportation network. Funds generated from tolls help fund transportation capital and operations and maintenance activities. Directing these funds toward transit and other multimodal projects benefits the entire system and reduces congestion and wear on the tolled roadway. Toll revenue is commonly used to back a bond issue that attracts private investment for a public-private partnership (P3) project.
Since revenue from tolls might be used to issue bonds, the cost of the debt service associated with the bond issue should be considered. Toll roads also raise the issue of social equity and are often viewed as regressive, squeezing those in lower income brackets to a much greater extent than the wealthy.113 Investing in transit and nonmotorized (bicycle/pedestrian) modes addresses some of these equity concerns.
Congestion pricing
Description: Congestion pricing charges motorists more for using certain roads and bridges during periods of heavy use. Congestion pricing has multiple benefits: it has enormous potential to generate revenue through fees charged to motorized traffic, and it effectively manages demand for a congested road, thereby reducing congestion and freeing up street capacity for all users. Many states and countries have found that varying pricing according to traffic conditions capitalizes on market forces to manage a system defined by finite roadway capacity.114 There are several variants available. The major congestion pricing options are discussed below.
High occupancy toll lanes
Description: High occupancy toll (HOT) lanes are priced lanes that allow for single-occupancy vehicles to travel in high occupancy vehicle (HOV) lanes if they pay a toll. High occupancy tolling has two effects: (1) by offering more vehicles the option of traveling in the express lane, congestion in the normal (non-express) lanes may be lowered, increasing traveling speeds for all users; and (2) revenues from the HOT lanes can help fund the operations and maintenance of the highway.115
Revenue potential: High.

29
Modal applicability: Highways and related facilities in the corridor.
Use: Below are examples of three states that have implemented HOT lanes to ease congestion and raise revenues.
• I–394 in Minneapolis, Minnesota. Minnesota Statute 160.93 (2011) states that the revenues from the HOT lanes shall first repay the trunk highway fund for money spent to install, equip, or modify the HOT lane corridor. Half the remaining funds shall be spent on capital improvements to the roadway corridor and half shall be transferred to the Metropolitan Council for expansion and improvement to bus transit service within the corridor.
• I–25 in Denver, Colorado, created by HB 02–1310 (2002) with the High Performance Transportation Enterprise, which was formed for the sole purpose of financing surface transportation projects that will improve safety, capacity, and accessibility to the transportation system. In FY 2009–10, revenues totaled $2.5 million.
• SR–91 in Orange County and I–15 in San Diego, California. AB 1467 allows for the Regional Transit Authority, in cooperation with CalTrans, to establish and operate HOT lanes. The number of projects is limited to four in the state: two in Southern California, two in Northern California. The I–15 express lanes have “dynamic” tolling that varies with the level of demand. Tolls are adjusted in real time, with the goal of pricing the HOT lane so as to maintain a free flow of traffic.116
Priced road networks
Description:Priced road networks price some or all lanes of a roadway network in an area or region, and apply variable pricing on a network scale, rather than just a single transportation facility.117
Revenue potential: Very high.
Modal applicability: Highways, urban roadways.
Use: Singapore introduced peak-period pricing during the morning rush hours in 1975 and updated to a fully automated electronic charging system in 1998. In-vehicle electronic devices allow payment by smart card, and cameras and license plate-reading equipment are used for enforcement. Variable electronic charges are used on the expressway system, with charges set by time of day to ensure the free flow of traffic. The system is the first of its kind in the world, and has reduced traffic by 13 percent while increasing average vehicle speed by 22 percent. Revenue generated totals about $70 million annually, and operating costs amount to about seven percent of annual revenue. In addition to this network, Singapore levies an area pricing fee for vehicles entering the central business district during weekdays.
Tolling and Road Pricing

30
SSTI Survey of State and Local Transportation Revenue Sources
In 2005, Germany implemented a new system to toll trucks on the autobahns. Trucks with a gross weight of 12 or more tons are charged electronically using GPS. Tolls are based on distance traveled, number of axles, and the vehicle’s emissions class. Net toll revenues go toward funding for transportation infrastructure.118
Priced zones
Description: This variant of congestion pricing is a cordon-based tolling system, ideally implemented in the central business district of a major city. This type of pricing offers a disincentive to commute to the central business district of a city in a single-occupancy vehicle, thereby helping to relieve congestion and raising revenues that can be used to improve the transportation system.
Revenue potential: Very high.
Modal applicability: Highway/automobile. Priced zones work well in major cities with a dense and congested central business district.
Use: London is the best example. Since 2003, London has assessed a daily charge for vehicles traveling within a specified zone bound by an inner ring road. Drivers are tracked via cameras that record their license plates. Fees can be paid in advance electronically. New York City is currently preparing a congestion pricing plan to present to the legislature.119
Variable pricing
Description: Variable pricing is a tolling scheme that requires drivers to pay variable prices to use a transportation facility – most commonly express lanes, bridges, and parking spaces. Prices for access to the lane, bridge, or parking space vary as demand for travel changes, based on the time of day, the day of the week, and the direction the vehicle is traveling. Prices typically peak during morning inbound commutes and evening outbound commutes, when demand is the highest. Express lanes are similar to HOT lanes, but differ in that these lanes are not normally HOV lanes. The variable price tolling has two primary benefits: (1) by offering restricted vehicles the option of traveling in the express lane, congestion in the normal (non-express) lanes is lowered, increasing traveling speeds for all users; and (2) revenues from the priced lanes can help fund the operations and maintenance of the highway.
Revenue potential: High.
Modal applicability: Highways and related corridor facilities.
Use: Several examples of how variable pricing is currently being used illustrate the revenue-generating potential of variable pricing policies:

31
Tolling and Road Pricing
• The I–15 express lanes in California have “dynamic” tolling that varies with the level of demand. Tolls are adjusted in real time, with the goal of pricing the lane so as to maintain a free flow of traffic. The express lanes on I–15 run in the middle of the highway. Buses, carpools, vanpools, and motorcycles travel at no cost. Single-occupancy vehicles gain access to this lane for a fee.120
• Lee County, Florida, began using variable pricing on the Midpoint and Cape Coral toll bridges in 1998. Bridge travelers are offered a 50 percent discount on their toll if they travel during specific discount periods and pay their tolls electronically. The discount periods are 6:30 to 7 a.m., 9 to 11 a.m., 2 to 4 p.m., and 6:30 to 7 p.m. This toll structure was developed to encourage drivers to shift from peak periods to off-peak/discount periods.121
• The San Francisco Municipal Transportation Agency is piloting SFpark to manage parking in the city through a dynamic pricing program. SFpark works by collecting and distributing real-time information about where parking is available and adjusts the price of the available spaces based on availability. Demand-responsive pricing encourages drivers to park in underused areas and garages, reducing demand in overused areas. It provides a reliable revenue stream and helps manage traffic downtown, since more than 15 percent of traffic in a metro area can be people searching for parking spaces. Reducing the time spent searching for parking benefits everyone, and managing parking availability makes streets safer and less congested and reduces emissions. Federal funding through the DOT’s Urban Partnership Program pays for 80 percent of the SFpark project.122
Discussion: Congestion pricing is a powerful tool to help raise revenue for transportation facilities. Pricing facilities dynamically by time of day and according to levels of congestion encourages some users to shift modes or change times of travel, thereby reducing congestion on a priced facility. The main pricing models include HOT and express toll lanes, priced highways, zoned pricing, such as the central London congestion pricing, and priced road networks, such as Singapore’s peak period pricing.
Revenues raised through congestion pricing have the potential to accomplish several important goals. Congestion pricing can play a key part in managing congestion on heavily traveled roadways, thereby reducing demand for capacity expansion, and can significantly increase the mode share of transit, thereby increasing system sustainability.
Revenues from congestion pricing are best used to help fund modes that aid in transportation demand management. Directing funds towards enhancing the service of public transit or completing additional bicycle and pedestrian facilities will help build a more sustainable transportation system, while simultaneously helping to decrease the demand for driving alone.

32
SSTI Survey of State and Local Transportation Revenue Sources
Non-user fees
Mobility tax
Description: A mobility tax is a tax levied in a specific geographic area served by a mass transit system. Revenue from the tax, which is commonly a payroll tax, is distributed to the region’s transit agency to help cover both operating and capital costs.
Revenue potential: Very high. In the first two years of its existence, New York’s Metropolitan Commuter Transportation Mobility Tax (MCTMT)123 generated over $2 billion in revenue, which largely has been used to cover anticipated operating budget shortfalls and mitigate the fare hikes, service cuts, and layoffs that resulted from the recession.
In FY 2011, Oregon’s two mass transit districts generated over $248 million in payroll tax revenue for transit, covering more than 40 percent of the operating expenses of the two transit systems funded by the districts.124, 125
Modal applicability: Transit (capital and operating expenses).
Use: In 2009, New York created the MCTMT, a payroll tax enacted and imposed in the counties served by the MTA, the nation’s largest transit agency. The tax proceeds go to the MTA to help cover budgetary shortfalls that resulted from the recession.
As an early adopter of transportation financing reforms (including being the first state to institute a user tax on gasoline126), Oregon enacted a mobility tax in 1969 of up to 0.6 percent on employer payrolls within a mass transit district,127 and in 1981, the legislature amended the law to include self-employed earnings.128 The state increased the maximum rate of its mobility tax to 0.7 percent in 2003129 and 0.8 percent in 2009.130
Discussion: The tax has been levied in regions where the mass transit system serves citizens’ basic mobility and economic needs, and when a new source of dedicated funds is needed for the transit agency to continue operating reliably and at a reasonable price.
A mobility tax creates a sustainable revenue source for transit agencies, funded by all those who benefit from the transit system, including not only riders but also motorists and businesses, whose benefits are indirect. This dedicated source of funding can also help improve and expand transit service in a region, often to areas that are currently underserved.131
As with any tax not directed at specific users, the mobility tax may raise equity issues, with certain communities contributing more money in taxes than they receive in benefits.

33
Non-user fees
The mobility tax is sometimes confused with another form of tax, the commuter tax. The latter is a payroll tax on employees who work in a jurisdiction but live elsewhere, typically in a suburb. It is intended to cover services such as transportation that the employees and their employers use in the city.
Local Income taxes
Description: Fifteen states authorize local governments to levy a local income tax to help fund public expenditures. The local option income tax can take two forms: a payroll tax or a general income tax (see the Mobility Tax section above for more information about the payroll tax).132 Most states allow revenue from the income tax to be allocated only to the general fund, which often, in turn, is a source of transportation funding, but four states specifically allow a portion of the proceeds from the tax to be dedicated to transportation.
Revenue potential: Marginal, and varies by state.133 Local option income taxes in the United States accounted for roughly 1.5 percent of local government revenue and only about four percent of local tax revenue in 2005.134 In Indiana, for example, the local option income tax law allows for counties to levy an income tax instead of increasing property taxes when faced with budget shortfalls. The rate must be incremental, though, and cannot exceed one percent.135 Only three states—Maryland, Ohio, and Pennsylvania—use the local income tax on a large scale, creating revenues of $3.4 billion, $3.6 billion, and $3.1 billion, respectively, in 2005.136
Modal applicability: All modes. Four states have statutory provisions allowing for a portion of local income taxes to be used exclusively for transportation-related projects, but only Ohio has an example of a municipality using the revenue to fund transit.137
Use: Only 15 states authorize local governments to levy a local income tax, and only three of these states—Maryland, Ohio, and Pennsylvania—use the tax on a large scale.138 As of 2003, only four states made a statutory connection between income taxes and transportation expenditures: Kentucky, Indiana, Oregon, and Virginia.139
In Indiana, counties were given the authority to increase their local option property tax with the passing of Act 1478 (2007), which provides relief to property taxpayers by creating a new funding source for necessary increases in local spending. Counties are allowed to levy a one percent income tax on residents, instead of increasing property tax rates, when faced with budget shortfalls.140 A county that chooses to implement an income tax must therefore freeze property tax rates at their current levels. Funds from the income tax are allocated only to communication, economic development, and transportation projects.141
34
SSTI Survey of State and Local Transportation Revenue Sources
Discussion: Most local income tax policies are considered horizontally equitable because they tax people of equal income the same amount, but within a specific geographic region, people with similar incomes may be taxed differently. For example, residents of a major municipality that levies an income tax may pay more than residents in surrounding suburbs without an income tax.142 This may lead households to relocate within a region in search of lower taxes.
Property tax
Description: Property tax is the most basic source of funding for public expenditures at the local level. The tax is nearly always computed as the fair market value of a property (with an assessment ratio factored in) times the property tax rate. The revenues from the local property tax go into a municipality’s general fund, which is used to finance basic public services. Some of the revenue can be used to fund transportation investment, but few states allow a certain percentage of the property tax to be designated for transportation purposes.
Revenue potential: Moderate to marginal. Even though the property tax is the primary funding source for local governments, transportation expenditures must compete with other public expenditures for limited tax revenues.
Modal applicability: All modes. Local governments are allowed to use general purpose revenue for transportation projects, including road, transit, and active modes.
Use: The California Assembly approved a temporary increase in the proportion of state sales and use tax allocated to transportation in the general fund from five percent to six percent. Aside from this example, almost every municipality uses some portion of the property tax revenue in its general fund to pay for transportation projects.
Discussion: The decreased tax base from the recession illustrates the fact that depending on the property tax for transportation revenues can be particularly risky and unstable. Similar to general purpose revenue (GPR) use, property taxes are a less-efficient source of funding for transportation systems because they rely on non-user fees. Also, raising property taxes is currently a particularly unpopular option, so problems may arise if a municipality depends on property taxes to help pay for an underfunded transportation system.

35
Non-user fees
Local sales tax
Description: Most states authorize local governments to levy a sales tax to help fill budget gaps and expected revenue shortfalls. The use of the tax often requires a voter referendum, and spending authority varies from state to state. Some states only allow earmarking revenues for allocation to the municipality’s general fund. Others require that there be a specific—but broadly defined—purpose attached to the tax levy, such as road improvements. The most restrictive requirements involve a legally binding expenditure plan that earmarks local option sales tax revenues for use in specifically defined projects. The American Association of State Highway and Transportation Officials (AASHTO) describes the use of local option sales taxes for use in transportation funding as a “significant and popular” revenue source, which has been particularly effective in the funding of rail transportation projects across the country.143
Revenue potential: Very high to high. California estimated that, of the $9.4 billion in local transportation revenue generated in 2005–06, about one-third came from the local option sales tax.
Modal applicability: All modes.
Use: Thirty-three states have authorized local option sales taxes for use in transportation funding. The most liberal approach, which allows for a local government to determine whether the revenues from the sales tax will be earmarked or allocated to the general fund, has been adopted by New York, Ohio, and Tennessee. Authorizations for local sales tax levies that require earmarks, but offer some leeway about applicable projects, have been approved in Florida, Iowa, Louisiana, New Mexico, Oklahoma, and Texas. The most restrictive authorizations, which require earmarks and project-specific, legally binding expenditure plans, have been approved in Arizona, California, South Carolina, and Wyoming.144
Local option sales taxes have been particularly successful in funding various rail transit projects across the country. Voters approved the local option sales tax to fund projects in Atlanta, Charlotte, Dallas, Denver, Houston, Los Angeles, Phoenix, Sacramento, Salt Lake City, Seattle, San Diego, San Francisco, San Jose, and St. Louis.145 Other cities, including Austin, Kansas City, Miami, San Antonio, and suburbs of Portland and San Francisco, have been unsuccessful at getting voter approval for sales tax-financed rail transit projects.
Discussion: Research from Transportation Quarterly offers an analysis of the use of local option sales taxes to fund transportation:
• The tax’s broad base allows for significant revenue to be generated at a very low marginal rate. In a metropolitan county, a sales tax rate of one percent could generate $50 to $75 per person, an amount sufficient to fund transportation infrastructure investment.
36
SSTI Survey of State and Local Transportation Revenue Sources
• Using sales tax as a transportation funding mechanism can produce large amounts of revenue, but because they are tied to economic cycles, the revenue can fluctuate from year to year.
• Using a local option sales tax to fund a transportation project is perceived favorably by the public because there is horizontal equity: individuals with similar incomes pay the same amount of tax, even though the tax is regressive.
• It can be considered more fair from a modal perspective, since transit, bike, and pedestrian projects can be funded by users who will actually use the infrastructure, as opposed to utilizing the motor fuel tax, which charges car drivers.
• A sales tax is also an effective way to exact revenue from nonresidents who use a local transportation system.146
State general purpose revenue
Description: General Purpose Revenue (GPR) is the largest fund states use when preparing an annual budget. It is also the most flexible funding source for the various public goods and services provided by a state, including transportation. GPR comes almost exclusively from tax revenues, with the largest sources being the state income tax, which makes up the largest portion of the fund, and the state sales tax.
State sales tax revenue on new and used vehicle sales is typically not designated for transportation funding, because it usually goes directly into the general purpose revenue fund of a state.147 Most states also charge an excise tax on the sale of vehicles, and these taxes typically aren’t considered transportation-specific revenues because proceeds go directly to the general fund. However, in some states (mentioned below), the tax can be dedicated to transportation financing. In other states, the tax revenue from automobile sales is separate from the general sales tax, and is therefore eligible to be designated for transportation purposes.
Revenue potential: Moderate to marginal. Like the property tax, transportation must compete with other public services for GPR. If a portion of GPR is statutorily dedicated to transportation, the reliability of the GPR revenue potential increases. Minnesota, which will begin dedicating 100 percent of vehicle sales tax funds to transportation in 2012, expects to raise about $250 million in transportation revenue annually.148 Texas collected $2.6 billion in vehicle sales tax in 2011, but proceeds went to the general fund.149 Utah is expected to raise $60 million annually by dedicating a portion of the state’s general sales tax to transportation.150

37
Non-user fees
Modal applicability: All modes.
Use: In Minnesota, a constitutional amendment in 2006 resulted in the migration of the Motor Vehicle Sales Tax (MVST) away from the general fund and toward transportation funding. Currently, 100 percent of the revenue is used for transportation purposes in the state. The state levies a 6.5 percent tax on the sale of all new and used vehicles instead of applying the general sales tax. The amendment goes so far as to specify how the tax will be allocated among the components of the transportation system as well. A maximum of 60 percent of the funding can be allocated to highway costs, and a minimum of 40 percent must be allocated to public transit assistance. For FY 2012, the state estimates proceeds from MVST will fund $152 million in highway expenses and just under $100 million in transit expenses.151
Utah and California allow for a specified portion of the proceeds from the sales tax and the general fund to be used exclusively for transportation:
• Utah SB 229 (2011) allows for 30 percent of the previous year’s general sales and use tax to be allocated directly to transportation funding.152 The shift is expected to generate about $60 million annually for transportation.
• The California assembly approved a temporary increase from five percent to six percent in the allocation of the general fund to transportation.
Discussion: Using GPR, a non-user fee, to fund transportation is less efficient than mechanisms such as motor fuel taxes or VMT fees and, by depending on GPR, state transportation systems must compete with other state programs, including police and education. Because of this, GPR is not necessarily a sustainable source of funds for the costs associated with transportation capital or operations and maintenance. There is greater potential for states to allocate revenues from sales taxes, specifically the motor vehicle sales tax, to transportation purposes.
The Texas Transportation Institute lists several benefits and drawbacks associated with policies aimed at either dedicating 100 percent of vehicle sales tax to the transportation system or increasing the tax rate on vehicle sales. Some ways in which this policy may help states include:
• Providing additional transportation funds, which can help reduce congestion and improve state roads and bridges.
• Helping funds keep up with increasing construction costs: since the early 1990s, transportation construction costs have nearly doubled.
• Creating a new revenue stream that can help offset the eroding gas tax revenue.

38
SSTI Survey of State and Local Transportation Revenue Sources
• Reducing the need for borrowing: states are increasingly turning to financing mechanisms such as bonds to fund transportation expenses. A new revenue stream can help slow this trend.
In the same report, the institute identifies a few potential drawbacks of increasing vehicle sales taxes or dedicating 100 percent of the generated revenue to transportation funding, including:
• Opposition to fee increases: the public and policymakers are becoming increasingly opposed to any form of tax increase.
• The economically-driven nature of revenues: revenues from vehicle sales taxes are not stable because they depend on sales activity in the market and are therefore vulnerable to economic cycles.
• Loss of general revenue: shifting all the proceeds from the motor vehicle sales tax does not create new revenue; it only reallocates it away from other public expenditures. The gain in transportation revenue would result in a loss for the general fund.153

39
Secondary Business opportunities
Secondary business opportunities
Advertising
Description: Advertising can be an attractive source of revenue for transit agencies, which can sell space on the interior or exterior of buses and trains as well as in transit stations and toll areas, and even on state DOT vehicles. For what can be considered a minimal investment in personnel and time, agencies are usually assured of at least a minimum annual revenue flow over a contractually-agreed-upon time.154 Some states also sell advertising along state roads, with revenues potentially going toward state transportation projects. As Washington State law states, the purpose of highway advertising is to “protect public investment in the interstate system and other state highway systems,” in addition to promoting the convenience and enjoyment of travel.155
Revenue potential: Moderate for transit, marginal for highways. Critics claim revenues sometimes do not cover administrative costs.
Modal applicability: Highways and transit.
Use: Advertising on public transit buses and trains has become a popular way to enhance revenue streams for large and small transit agencies in times of decreasing funds from local, state, and federal sources. Some agencies go beyond traditional bus signage to include video screens in stations or vehicles. According to a 2003 study, advertising covered up to three percent of transit operating expenses for some operators.156
Georgia statute declares that outdoor advertising along the state’s highways provide vital services to motorists, and therefore allows the state DOT to sell advertising rights. Fees are set to cover at least the administrative costs of running the outdoor advertising program.157
New Hampshire enacted a law in 2007 that allowed commercial advertising on toll booths within the state. Revenue from the program is dedicated to the state’s general fund, and is estimated to total $300,000 annually.158
Tennessee HB 0222 (2011) authorizes the state DOT to allot space for advertising on the sides of HELP trucks, which are DOT-operated incidence response vehicles that work to relieve congestion and assist motorists in the largest metropolitan areas of the state. To date, TNDOT has not used this authority, reasoning that the good will the department earns from the HELP truck program might be diluted if the public thinks the trucks were operated by the advertiser.159 The Tennessee State Legislature estimated that, if the program were activated, revenue generated from the program could reach $324,000 annually and would be dedicated exclusively to the highway fund.160
The Tennessee State Legislature estimated that, if the program were activated, revenue generated from the program could reach $324,000 annually and would be dedicated exclusively to the highway fund.

40
SSTI Survey of State and Local Transportation Revenue Sources
CalTrans depends on outdoor advertising on state roads and highways as a source of revenue. The department allocates all revenues from its advertising program—less 20 percent, which is dedicated to the specific county where the advertising is located—to the State Highway Account in the State Transportation Fund.161
Discussion: Similar to naming rights, revenue from advertising can be stable and predictable, depending on the duration of the contract, and is therefore well suited to operations and maintenance expenditures. Some critics of outdoor advertising on state roads and highways claim that revenues do not cover the costs of administering and regulating the billboards. Indeed, Connecticut estimates that the costs associated with its outdoor advertising program are approximately $400,000 annually, and fee revenues in the state fall far short of this amount. For this reason, in 2012, CTDOT decided to increase advertising fees.162
Concessions
Description: Transit systems and highways can capitalize on attractive retail locations by licensing space at busy locations to concessionaires and using revenues to support general operating costs of the system. Transit stations in central business districts or transfer points should be seen as candidates for potential concessionaires, due to their high volume of foot traffic. Similarly, fueling plazas and rest stops along major state-operated highways can be targeted by DOTs.
Revenue potential: Moderate. Compared to transportation budgets, concessions have the potential to raise only limited funds. Concession revenue often supports a transit system’s general operating costs or finances specific services such as operations and maintenance expenses. In many cases, transit systems may use concession revenue as a local match for federal grants. Revenue from concessions may also be used to pay debt service.163
Modal applicability: Highway and public transportation facilities.
Use: Rest stops and fueling plazas adjacent to state highways. States with major transit agencies whose stations generate sufficient foot traffic to support concessions can also charge for concessions.
Many states have concessions contracts with food service businesses and gas stations that operate at the rest stops. Virginia, for example, awarded a contract to a Pennsylvania-based catering company to sell food, drinks, and merchandise at Virginia highway rest areas along the interstate. 164 This contract will net VA DOT approximately $2 million a year for vending and advertising rights at the state’s 42 rest areas and welcome centers.
41
Secondary Business opportunities
In New York, the MTA has generated revenues from concession pricing for decades.165 In 2010, the Washington Metropolitan Area Transit Authority (WMATA) projected that its new retail concessions agreement would generate an estimated $928,000 over the eight-year license term.166
Discussion: Although concessions are a stable revenue source, the revenue potential is relatively small. Like other secondary business opportunities, an agency or state cannot depend on the revenue from concessions to make up a major part of its revenue sources.
Naming rights
Description: Naming rights is the selling of the right to name public facilities such as toll roads, highway corridors, and concession areas. It has the potential to be a reliable and predictable source of revenue for a state transportation agency. The idea is similar to sports stadiums selling their naming rights for a contractually agreed-upon price for a specific amount of time. With budget shortfalls prevalent across all states and all transportation agencies, more entities are turning to the selling of naming rights as a source of funds. Because naming rights are contractually agreed upon and therefore stable and predictable, the revenues are best suited for use toward debt service.
Revenue potential: Moderate. For example, the Southeastern Pennsylvania Transportation Authority (SEPTA) recently entered into a naming rights contract with AT&T to change the name of the Pattison stop, at the end of the heavily travelled Broad Street Line, to AT&T Station. The contract is worth $5 million over five years.167
Modal applicability: Highway, transit, or any mode with facilities where naming rights may be sold.
Use: Other states are also exploring naming rights as a revenue source. In January 2012, the governor of Virginia announced plans to award naming rights for the state transportation infrastructure—including highway, interchanges, and bridges—for an annual fee.168 Florida has proposed similar legislation, with revenues from selling naming rights to facilities directly funding the DOT.169 Very recently, New Hampshire also proposed legislation for naming rights contracts for state-owned bridges.170
Discussion: As noted above, the revenue potential from naming rights is moderate, so capital investments should not depend on revenues from naming rights as a primary funding source. However, the revenue is contractual, so it is predictable and consistent, and proceeds are well-suited for debt service and operations and maintenance costs.

42
SSTI Survey of State and Local Transportation Revenue Sources
Value capture
Overview: Large public transportation investments often increase the value of adjacent land, as accessibility to transportation improvements plays an important role in location choices made by employers, employees, and, more generally, the traveling public. Capturing the value of this benefit through value capture policies is not a new concept, but it is gaining increasing attention.
A variety of strategies for capturing this value exist. The primary available revenue options used in value capture include air rights, development impact fees and negotiated exaction, joint development, land value tax, special assessment districts, tax increment financing, and transportation utility fees.171 These options are discussed below.
Air rights
Description: Capturing the value created by the improvement by selling the rights to develop and occupy the space above a transportation facility provides a means to fund a portion or all of the cost of construction.172 The sale or leasing of air rights is often associated with transit-oriented development (TOD) or transit joint development.
Revenue potential: Moderate. Leasing air rights can provide a steady stream of reliable revenue, but should not be thought of as a primary source of funds. For example, while lease payments such as the $1.6 million paid annually to WMTA for air rights over the Bethesda Metro Station appear large, this amount will provide only a small portion of the capital budget for a system the size of WMTA. Annual revenue from the Bethesda Metro Station lease would only cover the cost of approximately three hybrid-electric buses.
Modal applicability: Public transit and highway.
Use: Leasing of air rights is commonly used with transit and highway modes. Many large cities such as Seattle, New York, Columbus, and Duluth have sold land on the right of way of sunken urban highways. Similar, transit agencies in Washington D.C., Atlanta, Los Angeles, and Boston have sold air rights above stations in their subway systems.173
Discussion: Mass transit systems have reaped great benefits from the sale of air rights over their facilities. The Bethesda Metro Center, an office-retail-hotel project located on top of the Bethesda Metro Station in Maryland, illustrates the potential for significant financial return using air rights. This project, a transit joint development project, generates $1.6 million annually in air rights rent for WMATA. This sum will likely be eclipsed by the lease payments generated by the planned 32-acre office-retail residential project at the White Flint Station in Montgomery County, Maryland.174 The City of Denver Regional Transportation District leases the air rights over part of the

43
Secondary Business opportunities
Civic Center bus transfer facility on the 16th Street Mall for a multi-story office building. The lease began in 1997, with an annual lease payment to the district of $216,901. The lease extends to 2074, with payments increasing by one percent per year during the term of the agreement.175
The selling of air rights is likely to be an efficient transaction, as the amount paid by the developer (reflecting the willingness of the developer to pay) should reflect the benefits received from the existence of a transportation improvement.176
Development impact fees and negotiated exaction
Description: Both development impact fees and negotiated exactions are charged to developers to help recoup the costs associated with the extension of public services to new private developments. Development impact fees are one-time charges collected from developers for financing new infrastructure construction and operations. They help fund growth-related public service costs, including off-site services such as roads and other necessary transportation improvements. Negotiated exactions are similar in that they are also charges to new developers for necessary growth-related public services, but they differ from development impact fees in that they cannot help fund off-site improvements. Negotiated exactions are negotiated between a local government and a developer, while development impact fees are determined through formal calculations of improvement costs.177
Revenue potential: Marginal. Development impact fees are not a primary source of transportation funding, although, in growing communities, they can represent a large share. There is good potential for growth; the rates can be readjusted on fairly short notice to help meet the increased demand for transportation infrastructure improvements.178
Modal applicability: Highway in general, but transit and alternative mode infrastructure in theory could be funded by impact fees.
Use: Used in most municipalities nationally. By the 1980s, 90 percent of municipalities were applying some sort of impact fees to new development, although not all fees were used for transportation improvements.179
The town of Cary, North Carolina, charges a transportation development fee on all newly constructed residential and commercial properties. Rates vary based on the property’s location within the municipality. Residential properties in the central zone, for example, are charged $439 to $715,
Bethesda Metro Station. High density development around rail stations is part of WMATA’s Joint Development program. Source: Brett VA, www.flickr.com/photos/smart_growth/2513075831

44
SSTI Survey of State and Local Transportation Revenue Sources
based on the type of property. Outside the central zone, rates are higher—$762 to $1,243, based on property type.180
Tucson has developed an impact fee policy for roads that uses the location and size of a development to assess impact fees. The city, through transportation impact studies, assumes that a residential development in the central core of the city will generate only 87 percent of the number of personal vehicle trips that a similar development in the rest of the city would produce. The impact fees for developments in the center of the city are therefore smaller. Smaller residential dwellings are also assessed a smaller impact fee.181
The city of Kelowna, British Columbia, levies development impact fees based on a site’s density. As the number of housing units per hectare increases from 15 (the least dense) to 85 (the most dense), the impact fees per unit decrease significantly.182
Atlanta offers decreased impact fees to developments that locate in close proximity to existing transit infrastructure. Units within 1,000 feet of a rail transit station are given an automatic 50 percent reduction in impact charges.183
Discussion: The use of impact fees is highly cyclical and can be more adversely affected by economic downturns than other sources of transportation funds. They are strongly tied to the demand for new housing and commercial space. As demand falls, so, too, does revenue from impact fees. They have the advantage of being, in a loose way, user fees, as they require residents and businesses generating a need for new infrastructure to pay for that infrastructure. Critically, they should be tailored as much as possible to charge for actual impact; e.g., houses in low-density, single-use settings will have a greater impact than those in higher-density, mixed-use settings. Instead of charging a flat fee, a development should be assessed a fee that better reflects the impact it will have on the transportation system. Factoring in land use type, size, density, and location can better match the fees paid by a developer to the costs of associated transportation improvements.184
Joint development
Description: In a joint development (JD), a private-sector partner either provides a transportation facility or makes a financial contribution to offset the public cost of the infrastructure. JDs are primarily used when the development of a transportation facility is adjacent to the development of private real estate, or when the real estate development and the transportation improvement occur at the same time, but not necessarily at the same location.185
45
Secondary Business opportunities
Revenue potential: Marginal. JD applies only to a small fraction of the real estate market in a municipality. Revenues grow at about the same rate as income or prices, and, like impact fees, the revenues from JD fees are closely linked to the housing and commercial real estate markets.186
Modal applicability: Highway and transit.
Use: American examples are more limited than international uses, as JD is especially common in large east Asian cities. In the United States, joint development has been used by transit agencies in Washington, D.C., New York City, and Portland, Oregon.187 WMATA has been involved with JDs since the early 1970s, with a program that converts real estate owned or operated by the agency into privately-owned TODs. Revenue from the transactions is used to fund the agency’s public transportation projects.188 In Portland, TriMet has made wide use of JD to create a number of TODs around the city, increasing ridership and revenue for the system.189
Discussion: JD fees are effective in tying costs of a new development to the benefits it receives due to its location adjacent to a transportation improvement. JD also ensures equity among participants, because it is a voluntary transaction between the infrastructure provider and the real estate developer. On the other hand, revenues are highly volatile and closely tied to the real estate market. If there is no housing or commercial demand, revenue from JD fees, which could be used for transportation improvements, will fall.190
Land value tax
Description: Land value taxation, also known as split-rate taxation, is based on the idea that taxing a parcel of land at a higher rate than its improvement creates an incentive to develop on that land, while providing a disincentive for land speculation on the outskirts of an urban area.191 By taxing land at a higher rate, underdeveloped land will face a larger tax bill, thus creating an incentive for the property owner to develop and create an adequate revenue stream.
With land value taxation, the greatest imperative to develop occurs adjacent to existing infrastructure or new infrastructure improvements, where land value is the highest. Land value taxation, therefore, can potentially spur TODs around new transportation infrastructure. A split-rate tax system can also help limit sprawl by disincentivizing development far from existing infrastructure.192
Revenue potential: High.
Modal applicability: All modes. Any improvements that can increase land values on adjacent properties.

46
SSTI Survey of State and Local Transportation Revenue Sources
Use: For decades, Pennsylvania has been one of the few states that allowed municipalities to introduce a split-rate property tax. In 1980, Harrisburg was cited by the U.S. Department of Housing and Urban Development as one of the most troubled cities in America, having lost local businesses and over one-third of its population over the previous two decades. The city decided to combat the slide by reducing the tax on buildings to one-half the tax on land. By 2010, most of the more than 5,000 businesses and homes that were boarded up were back in use, and the property tax base for the city increased from $212 million to more than $1.6 billion. Seeing these benefits, the city further reduced the effective tax rate on improvements to one-sixth the rate placed on land.193
Discussion: When applied at the local level, a split-rate tax scheme has the potential to replace the property tax, the largest source of funds for GPR. As a property-based revenue source, it is also relatively stable and resistant to economic downturns.194 This mechanism is best used as an incentive for development around already completed transportation improvements. Land value tax can be an effective tool when planning TODs.
Unlike special assessment districts (SADs), described below, split-rate taxation effectively charges a fee to all properties that benefit from a capital improvement, not just those within a designated zone. However, determining the value of a transportation improvement and its impact on properties within a municipality may prove difficult.
Special assessment districts
Description: Special assessment districts (SADs) are another form of value capture financing commonly used by municipalities to fund transportation infrastructure improvements. SADs are self-imposed special tax districts that are created to fund a public improvement. A local improvement district (LID) is one example of an SAD. An LID is comprised of a group of property owners adjacent to or near transit infrastructure who share all or part of the cost, assuming that, if property values for the owners increase due to the investment in the infrastructure, it is in the best interest of the owners to fund the improvements. LIDs are commonly used to fund relatively small-scale transportation improvements such street paving, curbs, sidewalks, and street lighting, as well as, in some cases, the planning and construction of major transit improvements such as light rail.
Implementation of an SAD involves determining how different properties benefit from transportation improvement. Several different methods have been used to assess properties within a district:
• Increased property value: allocation of the costs of improvement based on the expected increases in the value of the individual properties.

47
Secondary Business opportunities
• Zones: allocation of improvement costs based on location within a zone and distance from the actual improvement.
• Frontage: allocation of costs based on amount of frontage a property has adjacent to a transportation facility.
• Acreage: allocation of costs based on a property’s acreage within a district.
• Distance: allocation based on the property’s distance from the facility.195
Revenue potential: Very high for specific projects in municipalities. This revenue source works best at the local level.
Modal applicability: Transportation improvements across the modes. Most often used for transit projects.
Use: Legal in all 50 states.196
Unincorporated San Diego County allows residents interested in improving their roads to join together to form a “zone of benefit” SAD to implement improvement projects.
Washington, D.C., negotiated an SAD to help finance a metro station near the intersection of New York and Florida Avenues. The SAD included property owners who directly benefited from the new metro station and applied to all non-residential taxable properties within the SAD’s boundaries, which were defined as commercially-zoned parcels within 2,500 feet of the transit station entrances. The SAD issued $25 million in bonds to be paid for with the proceeds from the special assessment. The proceeds of the bond issue would be used to build the new metro station.197
Discussion: One major limitation of SADs is that they can generally be used to finance only projects that provide highly localized benefits, not community-wide benefits.198 As an open system, transportation infrastructure can be particularly difficult to fund through SADs because it is hard to establish a district that includes all those who benefit from the development. SADs are typically implemented at the local municipal government level; local governments have seen the most success in using SADs for transit improvements, particularly transit station improvements or construction.199
Tax increment financing
Description: Tax increment financing (TIF) districts fund transportation improvements with taxes levied on the incremental increase in property values that results from the improvement itself. Capturing this incremental increase in values is usually accomplished through the repayment of bonds taken out at the beginning of the improvement project. The district can be
48
SSTI Survey of State and Local Transportation Revenue Sources
expanded beyond the site of the improvement to include an area within a specified distance from the facility that is expected to reap benefits from the improvement.200
Rules for TIF vary across the states. In general, for TIF to be implemented, a district must be deemed “blighted” or “underdeveloped” by a local government. The proposed project usually must also pass the “but for” test, which stipulates that a municipality must prove that, but for the use of TIF, the development would not be financially feasible. Opponents of TIF have argued that both requirements—the “blight” designation and the “but for” clause—are merely pro forma exercises, and that local developers and consultants can too easily find evidence to adhere to both requirements.201 TIF districts, authorized and governed by state statute, are now legal in 49 states for all types of public improvements, including transportation improvements.202 Specific TIF districts are established and run at the local municipal level.
Revenue potential: Very high to high for locally planned and implemented projects. As a project-specific mechanism, it is possible that TIF could well replace traditional sources of project funds, such as general purpose revenue from local governments. There are also limitations on the usage of proceeds from TIF: some states allow revenues to be used only for project capital costs, not operations and maintenance.
Modal applicability: All modes.
Use: Legal in 49 states.
Oregon makes wide use of tax increment financing to fund local improvements. Originally adopted in 1960, Oregon TIF law specifies that a municipality with a population of more than 50,000 people must limit the total assessed value of the TIF district to 15 percent of the total municipal tax base, and communities of less than 50,000 people may not establish a district valued at greater than 25 percent of the total tax base.
TIF districts and an LID were used for the development and construction of the Portland Streetcar, which was constructed in three phases between 2001 and 2007 and had a capital budget of more than $103 million. Two different TIF districts along the streetcar route generated more than $21 million toward the improvement. The LID, which encompassed properties around the line in all three phases, provided $19.4 million in capital funds. Together, the two value capture programs funded almost 40 percent of the total capital costs associated with the streetcar’s construction. Currently, an expansion of the Portland Streetcar is being planned, and $15 million is expected to be funded through the establishment of another LID in the improvement area.203

49
Secondary Business opportunities
Maryland uses TIF to fund TOD. Five urban TOD redevelopments have been completed or are under construction in Maryland using TIF revenues: National Harbor, East Baltimore Development Inc., Annapolis Town Center, Park Place Annapolis, and Clipper Mill.204
North Carolina voters approved the use of TIF in 2004,205 but the complexity of, and lack of familiarity with, the TIF process, the absence of large projects at the municipal level, and negative views of TIF have hindered widespread use of this tool in the state.206 That said, North Carolina is currently developing a financing plan to aid in the construction of the Red Line Regional Rail project in Charlotte. The Charlotte Area Transportation System, the Department of Transportation, and the communities along the new line are working in partnership to move this project forward. The Red Line will run 25 miles between Charlotte and Mt. Mourne in Iredell County. Ten stations are currently planned for the line, and project planners anticipate increases in property values, particularly near stations, associated with the development. A TIF district is one of the innovative financing options the project team has proposed for this project.
Discussion: TIF can assist in financing large capital transportation projects by capturing the increases in property values of properties benefitting from the capital improvement. When implemented after a detailed market analysis and with meaningful public involvement, as is being done for the Red Line project, TIF projects can create meaningful, long-term benefits. Critics of TIF argue that it takes revenues from other entities, especially school districts. However, others argue that, at the end of the life of the TIF, all levels of government are better off due to the increased tax base the use of TIF created.
Red Line Regional Rail Benefits District.

50
SSTI Survey of State and Local Transportation Revenue Sources
Transportation utility fee
Description: Similar to a utility’s rates, transportation utility fees (TUFs) are based on the premise that transportation improvements should be financed primarily through user fees. TUFs more directly tie the costs of a project to the users of the facilities than general property taxes do. The fees are assessed on properties based on the estimated amount of trips that the property generates, providing a direct connection between the costs of transportation facilities and their demand. Unlike a property tax, which is only loosely related to the costs a particular property imposes on the transportation system through congestion and pavement damage, TUFs are assessed based on characteristics of the property that are closely related to transportation demand. They therefore have the potential to better spread the costs associated with transportation improvements and operations and maintenance among the users of the system.
Revenue potential: Moderate. The fees are a relatively stable source of funds for transportation. Fees should be set at a rate related to the estimated costs of providing the transportation services over a certain budget cycle, and revenues would be best used for operations and maintenance expenses instead of major capital expenses.
Modal applicability: All modes.
Use: In June 1992, Port Orange, Florida, became the tenth U.S. city (and the first east of the Mississippi River) to adopt a TUF. Initially, Port Orange established the TUF fund to replace a subsidy from the city’s general fund and to eliminate a shortfall in the city’s road maintenance budget. Over time, funds have been used to pave dirt roads, construct bike paths, and reconstruct and widen deficient city streets.207 The City of Hillsboro, Oregon, uses TUFs for street maintenance and reconstruction; in this case, the TUF is a monthly user fee based on the use of the road system by residents, businesses, government agencies, schools, and nonprofits. The money collected through this fee allows the city to catch up on its backlog of street maintenance projects, with the goal of having the streets in good repair by 2018. The fee went into effect in March 2009, and appears on the city’s utility bill along with the water, sanitary sewer, and storm water fees.208
Discussion: TUFs are a more efficient source of tax revenue for transportation projects than general property taxes. There is strong potential to shift the cost burden away from residential properties and toward industrial and commercial properties, which typically consume more transportation facility services. In theory, TUFs would also adhere more closely to the benefit principle than normal property taxes, because they would charge more to properties that use more of the transportation system. However, in order for the fees to adhere well to the benefit principle, the link between a property’s characteristics and its demand for transportation must be established. To date, this has only been done through published trip generation rates, which are recognized as being inaccurate.

51
Private Investment
Private investment
Bonding
There are a significant number of bonding options for surface transportation projects. For example, bonds are often part of a P3 funding package for large surface transportation projects, both highway and transit.
While bonds are important generators of funding for capital projects and many states take advantage of their availability, not every state issues bonds. The Tennessee DOT, for example, has chosen to use its bonding authorization to take advantage of the timing of project expenditures. Bonds are authorized by the state legislature but never issued. Instead, the DOT obligates projects based on bond authorization but finances the projects from the DOT’s existing cash balances. The Tennessee DOT has been able to finance its road program for the past 19 years without selling bonds.
Bonds themselves do not in themselves constitute a revenue stream, but are a form of debt. Investors purchase bonds based on the obligation of the issuer to repay the investor with interest. A project paid for with a bond issue will need to be secured by an identified revenue stream (such as tolls, transit fares, or parking fees) that is expected to be adequate to pay the debt service on the bonds.
What follows is a discussion of the major bonding programs available to states, with particular attention paid to bonding programs that are used for financing P3s.
Certificates of participation
Overview: Certificates of participation (COPs) are a form of tax-exempt debt issued by state or municipal entities, usually secured by revenue from an equipment or facility lease, 209 with maturities that match the lease term of the assets that are purchased by the state entity with the proceeds of the COPs. In the case of transit assets, the issuer may then lease the equipment to one or more transit agencies. The underlying lease or installation sale agreement furnishes the revenue stream necessary to secure the debt. The resulting lease payments, most often made with a combination of formula grant funds and local matching shares, are then “passed through” to the investors by the issuer.
Revenue potential: Very high. COPs have provided crucial financing for projects in California, New York, and the City of Denver, among other locations, and have been used to replace transit revenue vehicles on a large scale.
52
SSTI Survey of State and Local Transportation Revenue Sources
Modal applicability: COPs have been used primarily for transit investments made as part of the Section 5307 (urban area formula) and Section 5309 (transit capital) programs.210 Transit operations rely on capital equipment, such as buses or depots, which is suited to lease agreements. Less often, COPS are used for road projects. That said, COPs may offer creative financing options for some highway investments, such as automated toll collection or intelligent transportation system equipment.
Use: Transit systems have benefited the most from COPs. The California Transit Finance Corporation (CTFC) has used COPs to fund bus purchases for several California grantees, including the Sunline Transit Commission. Using COPs, Sunline replaced its entire fleet of diesel fuel buses with buses that operate on compressed natural gas. The CTFC issued COPs secured by a lease on the purchased buses. Because the transaction involved 40 buses, the local gas utility provided a high-speed fueling facility with a favorable capital lease arrangement. Transit agencies in Los Angeles, New York, and Denver have also issued locally-funded equipment trust certificates, beneficial interest certificates, and COPS to finance buses. These securities are very similar in type, differing mostly in the specifics of their implementation and documentation.
Discussion: COPs enable governmental entities to finance capital projects without technically issuing long-term debt. This is appealing, since the issuance of long-term debt is often subject to voter approval and other state constitutional and statutory requirements.
Despite the variety of assets that may be leased, the typical Federal Transit Administration (FTA) COP has involved bus purchases. The use of a COP rather than a pay-as-you-go policy allows transit agencies, either individually or in a pooled purchase contract, to make larger purchases of bus assets in an expedited manner, thereby saving money, lowering operating costs by retiring an older bus fleet, improving compliance with environmental standards, and improving revenue-generating service.211
While COPs may be issued based on a history of past grant awards, there is no guarantee that sufficient funds will be available in the future to pay the full 80 percent match of lease payments. Thus, rating agencies and capital market participants do not treat Section 5307 funds as a guarantee. An agency considering issuing COPs should include this possibility in its evaluation of whether or not to issue COPs.
Grant anticipation notes212
Overview: Grant anticipation notes (GANs) are a form of debt used by transit agencies to fund capital projects. GANs allow transit agencies to borrow against future federal aid funding, but differ from COPs in that they do not involve lease agreements. GANs are issued by a transit agency and

53
Private Investment
secured with a pledge of federal aid assistance, thus amassing up-front capital. GANs are paid over a period of time as federal funds are received. Transit GANs may be used to back projects funded either through Section 5307 (urban area formula) and Section 5309 (transit capital) programs.
Revenue potential: High. Transit GANS may be backed by anticipated fare revenue and federal Section 5307 and 5309 funds. Transit agencies typically use federal reimbursements anticipated through this program as part of the revenue stream backing these notes.
Modal applicability: Transit.
Use: New Jersey Transit issued GANS backed by passenger fares to fund the Hudson-Bergen Light Rails (HBLR) project. The project includes 23 stations and runs 20 miles adjacent to the Hudson River. GANS formed part of the overall financing package, which included state transportation fund money and funding from an FTA New Starts Full Funding Agreement grant. The project provides a crucial alternative to driving alone, which helps manage congestion from single occupancy vehicles, reduces greenhouse gases, and spurs economic development along the rail corridor. The HBLR is well used, and is described as a “preferred alternative” for transportation in the region.213
Discussion: GANs allow an agency to issue debt secured by a pledge of federal aid assistance, thus amassing up-front capital. The agency can then pay down the notes over a period of time as federal funds are received. Congress distributes transit funds using discretionary and formula funding. Funds distributed using a formula are typically more predictable than discretionary funds and therefore carry less risk. The credit risks for a transit GAN backed by a discretionary full funding grant agreement may be higher than for a transit GAN backed by formula funding at an equivalent coverage level. However, as the New Jersey Transit example shows, these funds work well for large capital projects that might otherwise be delayed for lack of funding availability.
Grant anticipation revenue vehicles
Overview: A grant anticipation revenue vehicle (GARVEE) is a debt-financing tool that generates up-front capital for major highway projects. Future federal funds are used to repay the debt and related financing costs under the provisions of Section 122 of Title 23 U.S.C. GARVEEs can be issued by a state, a political subdivision of a state, or a public authority. As of December 2008, more than $9 billion in highway GARVEE bonds had been issued by half of the states in the U.S.
Revenue potential: Very high.
Modal applicability: Highways.

54
SSTI Survey of State and Local Transportation Revenue Sources
Use: DOTs. State DOTs that use GARVEEs include North Carolina and Georgia. North Carolina uses GARVEE bonds in a manner similar to a revolving loan; as GARVEEs are paid back, they are re-issued for new projects. The state issued $145.5 million in GARVEEs as interim financing for the construction of the 19.7-mile Monroe Connector Bypass, the state’s second toll road. Georgia used GARVEEs to help accelerate a $15.6 billion major capital program. Initially projected to take 18 years to complete, the state was able to compress the project timeline to six years.214
Discussion: GARVEE bonds are becoming a popular way to access future federal funding, as more immediate access to these funds improves the speed of project delivery. GARVEEs may appear politically expedient—they often do not require voter approval. However, states should consider the debt service costs associated with these bonds, which will need to be covered from the state’s own coffers. For this reason, these bonds could create additional funding headaches down the road through increased debt service costs.215
Private activity bonds
Description: Private activity bonds (PABs) are designed to encourage private investment in transportation projects.216 These bonds provide private developers and operators with access to tax-exempt interest rate bonds, effectively lowering the cost of capital and enhancing investment prospects.
Qualified highway or surface freight transfer facilities projects include:
• Any surface transportation project that receives federal assistance under Title 23 U.S.C. (as in effect on August 10, 2005, the date of the enactment of Section 142(m)).
• Any project for an international bridge or tunnel for which an international entity authorized under federal or state law is responsible and which receives federal assistance under Title 23, U.S.C. (as so in effect).
• Any facility for the transfer of freight from truck to rail or rail to truck (including any temporary storage facilities directly related to such transfers) which receives federal assistance under Title 23 or Title 49 U.SC.
Examples of facilities for the transfer of freight from truck to rail or rail to truck include cranes, loading docks, and computer-controlled equipment that are integral to such freight transfers. Examples of facilities that are not freight transfer facilities include lodging, retail, industrial, or manufacturing facilities.
The law limits the total amount of such bonds to $15 billion and directs the Secretary of Transportation to allocate this amount among qualified

55
Private Investment
facilities. The $15 billion in exempt facility bonds is not subject to state volume caps.
Revenue potential: High. As of October 2011, the U.S. DOT had approved $8.1 billion dollars for 13 projects, leaving just under $7 billion available for new projects.
Modal applicability: Applicable to highways, freight transfer facilities, and transit projects receiving federal assistance under Title 23 or Title 49 U.S.C..
Use: State DOTs and their private sector partners. The U.S. DOT accepts applications requesting authority to use a portion of the $15 billion for specified projects. There is no formal application, but a suggested application format may be viewed on the program’s website.217
Discussion: PABs are no-interest bonds, which reduces the cost of the debt associated with the loans. However, as mentioned above, the program is capped at $15 billion, and more than half of this bonding authority has already been used. In addition, 95 percent of the proceeds from the bond issue must be expended for qualifying projects within a five-year period. Failing to meet this deadline will require the bond issuer to use unspent proceeds from the bond to redeem the bonds within 90 days. There is a possibility of an extension if the bond proceeds were not used due to circumstances beyond the control of the issuer. Given this restriction, it is in the interest of an agency issuing bonds under this program to be sure that the project to be funded is ready to go.
Public-Private Partnerships
Overview: Public-Private Partnerships (P3s) are contractual agreements between a public agency and a private entity that facilitate participation by the private entity in the operations and maintenance of infrastructure projects or facilities. For transportation projects, P3s typically involve one or more aspects of bonding, financing, program management, planning, design, construction, toll collection, or operation and maintenance of the facility. P3 projects might be developed to complete a new facility, or to improve the operations of an existing facility.
Revenue potential: Moderate to high, depending on how it is structured. P3s are best thought of as a means to assemble a package of public and private funding options, not as a revenue source per se . Revenues backing a P3 project might include tolls, parking fees, or leases, for example, and are often the security backing a bond issue that is used to help finance the P3 facility.218
Modal applicability: All modes, although each state enacts enabling legislation specifying the modes that may use P3s.

56
SSTI Survey of State and Local Transportation Revenue Sources
Use: As of October 2010, 29 states had enacting laws authorizing P3s for highways and bridge projects, 20 states allow for P3s on transit projects, and 38 states authorize P3s for design-build projects.
The Hiawatha Light Rail in Minneapolis/St. Paul provides an example of a P3 for a new facility.219 The line links downtown Minneapolis with Minneapolis-St. Paul International Airport and the Mall of America. The corridor is 12 miles long, with 19 stations and 24 light rail vehicles. Since the line’s completion, adjacent land has experienced significant residential and commercial development.
The project combined federal, state, and local grants. Private partners became involved in two separate design-build contracts: one for light rail vehicles, and one to place rail, signal, and communication equipment along the alignment.
Two well-known examples of P3s that include the long-term lease of an existing facility include the lease of the Indiana Toll Road and the Chicago Skyway. In both instances, an international conglomerate entered into a long-term agreement to operate and maintain a public roadway, and in both instances, the partnerships have proved challenging for both the public and private partners. Questions of whether the award of the contract reflected the actual value of the facilities linger, and the private partners have not realized the return on their investments that they had hoped to achieve.220
Discussion: In this era of constrained budgets, P3s are becoming increasingly attractive to governments seeking to balance their budgets. P3s can help states increase the efficiency of their transportation investments and leverage federal resources by attracting non-federal public and private investment. Many states are finding these partnerships appealing for their ability to accelerate project delivery through private financing, create lifecycle efficiencies, improve project quality, and spread project risk.
There are, however, important questions to ask and considerations to address prior to a state entering into a P3. Some of the key questions decision-makers should take into account when considering a transportation project funded through the P3 model include inclusion of non-compete contract clauses and specification of contract length, potential monopoly power, and the determination of a revenue source.221
Concerns related to P3 projects include the potential loss of public control of taxpayer-funded facilities, the negative impacts of selling or entering into long-term leases for publicly-owned infrastructure assets, the potential loss of revenues over the long term, concerns over violating existing public-sector labor agreements, concerns over non-compete contract clauses limiting a public entity’s ability to address system concerns outside the P3 contract, and the length of a long-term lease contract.222

57
Private Investment
Railroad Rehabilitation and Improvement Financing Program
Description: The Railroad Rehabilitation and Improvement Financing Program (RRIF) helps finance railroad infrastructure by providing direct federal loans and loan guarantees.223 The RRIF program was first established in 1976 and then modified in 1998 by the Transportation Equity Act for the 21st Century (TEA–21).224 Congress made additional changes to the program in SAFETEA-LU. Through this program, the Federal Railroad Administration is authorized to provide direct loans and loan guarantees of up to $35 billion. Up to $7 billion is reserved for projects benefiting freight railroads other than Class I carriers.
The RRIF program provides direct loans that can fund up to 100 percent of a railroad project. The repayment period for the loans can be as long as 35 years, with interest rates equal to the cost of borrowing from the government. RIFF funding may be used to:
• Acquire, improve, or rehabilitate intermodal or rail equipment or facilities, including track, components of track, rolling stock, bridges, yards, buildings, and shops.
• Refinance outstanding debt incurred for the purposes listed above.
• Develop or establish new intermodal or railroad facilities.
Program funds are awarded competitively. Eligible borrowers include railroads, state and local governments, government-sponsored authorities and corporations, joint ventures that include at least one railroad, and limited option freight shippers that intend to construct a new rail connection.225
Revenue potential: Very high. The program is able to fund up to $35 billion. A wealth of untapped financing is available; to date, just $1.6 billion has been committed to projects.
Modal applicability: Freight and passenger rail.
Use: Thirty-two loan agreements have been executed since 2002, for a total of $1.6 billion. To date, eligible applicants other than railroads have not utilized this program.
The Denver Union Station Project Authority received a $1.55 million RRIF loan for the station in 2010. Amtrak utilized a $562.9 million RRIF loan to replace aging rail cars and improve track. The largest RRIF loan to date, the dollars will be used to finance the purchase of 70 high-performance electric locomotives and upgrade existing maintenance facilities.226
Discussion: While RRIFF financing does not generate new money, it allows railroads and state and local governments to enter into low-interest loan agreements. The ability to fund a project with 100 percent federal funds with a loan repayment period of up to 35 years is very attractive.

58
SSTI Survey of State and Local Transportation Revenue Sources
The dollars remaining in the RIFF program suggest that eligible applicants—primarily state and local governments—that have rail projects should explore using RIFF financing to move these projects forward. RIFF financing may also be used in joint ventures that include at least one railroad.
The primary challenge associated with this type of funding is delays in securing the loans, which, thus far, has limited the use of the mechanism. The Wheeling & Lake Erie Railway Company’s two loan applications took 18 months and ten months, respectively, to secure, rather than the 90 days the application review is supposed to take. The length of these delays created additional costs to the rail company related to its need to secure additional outside loans and its damaged relationships with material suppliers.227
Section 129 loans
Description: Section 129 loans allow states to use regular federal-aid highway apportionments to fund loans to projects that have dedicated revenue streams (both toll and non-toll). Because payments on the loan can be delayed until five years after project completion, this mechanism provides flexibility during the ramp-up period of a new toll facility.
Similar to State Infrastructure Banks (SIBs), Section 129 loans allow states to leverage additional transportation resources and recycle assistance to other eligible projects. States have the flexibility to negotiate interest rates and other terms of Section 129 loans. When a loan is repaid, the state is required to use the funds for a Title 23-eligible project or for credit enhancement activities, such as the purchase of insurance or the funding of a capital reserve, to improve credit market access or lower interest rate costs. One important distinction between SIBs and Section 129 loans is that projects that receive assistance from repaid Section 129 loans are not required to meet the same federal requirements as those using SIB loans.
Section 129 of Title 23 was originally amended by ISTEA to allow federal participation in a state loan to a toll project. In response to what was experienced under TE–045, the 1995 NHS Act further expanded federal-aid eligibility to include state loans to non-toll projects with a dedicated revenue stream.
Revenue potential: Marginal. The revenue-generating potential from this program is indirect, and there are specific eligibility requirements that limit participation. Section 129 loans are not an independent revenue stream. The loans do, however, assist in constructing a financing package for a capital construction project. The federal participation on these loans may not exceed 80 percent.
Modal applicability: Transportation projects receiving federal assistance under Title 23 U.S.C.
59
Private Investment
Use: The use of Section 129 loans has been limited, perhaps due to the specific eligibility requirements. The President George Bush Turnpike Project in Texas was advanced with a $135 million Section 129 loan, which facilitated the financing by expanding the project’s bonding capacity and enhancing the creditworthiness of the project’s revenue bonds. Michigan DOT used a Section 129 loan to help finance construction of the second span of the Blue Water Bridge from Port Huron to Canada. Forty-five million dollars of the total $63 million cost of the bridge was financed with a Section 129 loan. The reminder of the project cost was financed through revenue bonds.228
Discussion: Section 129 loans can provide important flexibility for financing qualifying projects. States may take up to five years to repay these loans, and the loan terms are flexible, allowing negotiated interest rates. These specifics make the loan program appealing as part of a funding package for major capital projects. However, there are other restrictions that have limited the use of this program. Section 129 loans are only available for projects that have a dedicated revenue stream up front, such as tolls, excise taxes, sales taxes, real property taxes, motor vehicle taxes, incremental property taxes, or other types of fees. Loan repayments generated must be used for future projects eligible under Title 23 U.S.C.
Special Experimental Project Number 15
Description: Special Experimental Project Number 15 (SEP–15) is a new process the Federal Highway Administration (FHWA) is experimenting with to evaluate new P3 strategies for project delivery. Through this process, FHWA is seeking to develop an approach for efficient transportation project delivery that fosters P3s while still meeting its responsibilities to taxpayers and to environmental stewardship. SEP–15 includes, but is not limited to, the following major elements of project delivery:
• Contracting
• Compliance with environmental regulations
• Right of way
• Project finance
The goals of SEP–15 are to increase flexibility, encourage innovation, improve timely project construction, and promote P3s. SEP–15 is structured to help FHWA identify the current FHWA laws, regulations, and practices that inhibit greater use of P3s and private investment in transportation improvements. The program is also structured to help FHWA develop new policies, procedures, and approaches that address these impediments.
60
SSTI Survey of State and Local Transportation Revenue Sources
Revenue potential: Marginal. This program’s revenue-generating potential is indirect. Revenue would be generated primarily from cost savings realized through innovative project delivery and program management related to the streamlining efforts for the four major project elements delineated above. If an approved SEP–15 project is successful in improving project delivery and reducing delays in approvals, then money will be saved through the efficiencies gained.
Modal applicability: SEP–15 is applicable to projects eligible for funding under Title 23 U.S.C., including multimodal projects.
Use: SEP–15 funds are awarded as part of a competitive application process. To be eligible, projects must test an innovative delivery technique that is prohibited by a current provision of Title 23 U.S.C., FHWA regulations, or FHWA policy, thus incentivizing new strategies. SEP–15 projects cannot be used to test new or modify existing project delivery processes outside of Title 23 U.S.C. A state must demonstrate that the experimental feature is one that will advance the goals of the SEP–15 program. States are encouraged to discuss potential applications with the appropriate staff from FHWA’s division headquarters prior to submitting an application or concept paper.229
Discussion: SEP–15 funds offer the potential to realize cost savings through improved project delivery, the increased ability to enter into a P3, and the creation of new revenue streams identified as part of the SEP–15 experiment. However, SEP–15 is an experimental program that requires an involved application process; it may not be feasible to develop an SEP–15 funding program if the sponsoring agency does not have the staff time to devote to developing a program, particularly if it’s an agency struggling with reduced staffing levels.
State infrastructure banks
Description: State infrastructure banks (SIBs) are essentially revolving loan funds established to capitalize on existing funding sources,230 which may be federal, state, or local. There are two types of SIBs: federally-funded and state-funded. Both types of SIBs create revolving infrastructure funds that states can choose to establish. A national infrastructure bank is currently under discussion by Congress.
Congress established the federal SIB program for all states in SAFETEA-LU. This program authorizes states to develop cooperative agreements with the Secretary of Transportation to establish revolving infrastructure funds that are capitalized with federal transportation funds authorized in FY 2005–09. Projects eligible for funding through the SIBs include those eligible under Title 23 and Title 49, as well as any other projects related to surface transportation that the Secretary determines to be appropriate. SIBs

61
Private Investment
capitalized with federal transportation funds are subject to the requirements of Title 23 and Title 49, as applicable.
A state must match the federal funds used to capitalize the SIB on an 80/20 federal/non-federal basis. States also have the opportunity to contribute additional state or local funds beyond the required nonfederal match.
State-funded SIBs are capitalized using state funds, without federal funding assistance. These SIBs do not fall under the regulations of Title 23 and Title 49.
Four states have established SIBs that receive no federal assistance:
• Kansas established an SIB known as the Transportation Revolving Fund in 1999.
• Ohio’s SIB funds projects through its Federal, State Motor Fuel, Title 23, and General Revenue Fund (GRF) Accounts. Federal/state highway and transit projects are funded using at least one of these accounts. Other projects, including rail, airports, and local roads, are funded solely through the state GRF Account.
• Florida has two accounts within its SIB, a federally-funded account and a state-funded account capitalized solely with bond proceeds and state funds.
• Georgia passed legislation in 2008 establishing a State Transportation Infrastructure Bank, which it capitalized with $34 million in state funds in FY 2009. The statute allows for future federal capitalization.
Revenue potential: High. For large projects, SIBs can provide a critical portion of the capital investment needed. Participating states may capitalize their SIBs with federal surface transportation funds for each fiscal year from 2005 through 2009, using the traditional 80/20 federal/local match as follows
• Highway account: up to ten percent of the funds apportioned to the state for the National Highway System Program, the Surface Transportation Program, the Highway Bridge Program, and the Equity Bonus.
• Transit account: up to ten percent of funds made available for capital projects under Urbanized Area Formula Grants, Capital Investment Grants, and Formula Grants for Other Than Urbanized Areas.
• Rail account: funds made available for capital projects under subtitle V (Rail Programs) of Title 49.231
SIBs may also provide assistance in the form of loans, credit enhancements, and access to bonding programs. As loans or other forms of credit assistance are repaid, an SIB’s initial capital is replenished and can be used to support a new cycle of projects.

62
SSTI Survey of State and Local Transportation Revenue Sources
Modal applicability: All modes.
Use: SIBs offer the opportunity for states and local governments to work on high priority projects that might otherwise be delayed due to lack of funding. As of December 2008, the latest year for which complete data are available, 32 states and one territory had entered into 609 SIB loan agreements with a total dollar value of $6.2 billion.232 Four states have established SIBs capitalized solely with state funds.233
Money deposited in an SIB may be used for surface transportation projects across the different modes. Two recent examples of SIBs illustrate the potential of infrastructure banks at the state and local levels. Massachusetts established an SIB with a $1.5 billion bond bill. This SIB allocates $200 million to local road and bridge projects and directs $311 million to the state’s rail and transit systems.234 An impressive recent example comes from Chicago, where a proposed infrastructure bank will fund transformative, forward-thinking projects such as a new Bus Rapid Transit line with a zoned fare structure. The fares collected as part of these projects provide the revenue source to fuel the public/private partnerships behind the bank.235
Discussion: Through SIB financing, states can leverage money for transportation projects, accelerate construction timelines, and recycle assistance for future transportation needs. SIBs assist in leveraging private capital with public-sector grants and bonds, often as part of a P3 effort.
The ability to access significant sums of money for a project makes an SIB loan attractive to agencies financing a large infrastructure project. SIB loan repayment schedules can be structured to match the availability of project revenue streams. Projects receiving assistance through an SIB area are awarded competitively. The competitive nature of the program gives it the potential to direct assistance to projects with high merit.236
While SIBs offer a range of opportunities for project funding, they require a significant investment of staff time and expertise on the part of the agency to establish and manage an infrastructure bank. In this era of shrinking staff and budgets, administering an SIB could pose a challenge. It is critical that states complete a detailed analysis of the proposed SIB prior to implementation. The SIB’s mission, vision, goals, administrative structure, and project evaluation methods should be finalized prior to launch. Some states have formed an SIB and dedicated funding for projects, only to see the majority of these funds sit idle and collect interest.237 Other states, such as Tennessee, have federal authorization for an SIB, but choose not to use this authority due to a lack of appetite for entering into debt of any kind.
SIBs have, to date, been used primarily for highway projects, and there are states that feel their infrastructure banks are underutilized. Although this
63
Private Investment
might be listed as a disadvantage, it also presents a significant opportunity. Transit and other multimodal projects, for instance, are underrepresented in most SIB-funded projects.238 In order to take full advantage of financing through a SIB, states should work to incorporate additional multimodal projects into their infrastructure bank programs.239
Transportation Infrastructure Finance and Innovation Act
Description: The goal of the Transportation Infrastructure Finance and Innovation Act (TIFIA) program is to leverage federal resources and encourage private capital investment in infrastructure.240 TIFIA provides credit assistance in the form of direct loans, loan guarantees, and standby lines of credit to finance surface transportation projects. Key objectives of the program include facilitating projects with significant public benefits, encouraging new revenue streams and private participation, addressing capital market gaps, limiting federal exposure to risk, and creating a flexible process to address investor concerns.241
TIFIA credit assistance can provide improved access to capital markets, flexible repayment terms, and more favorable interest rates than can be found in the private market. TIFIA, like SIBs, can help advance expensive projects that otherwise might be delayed or deferred because of size, complexity, or uncertainty over the timing of revenues.
Revenue potential: Marginal. Through SAFETEA-LU, Congress authorized $122 million for each federal fiscal year from 2005 through 2009. TIFIA has received an equivalent amount of budget authority in each extension of SAFETEA-LU. TIFIA funds pay the subsidy cost of providing credit assistance, and are available until expended or reprogrammed by Congress. This funding amount can support more than $1 billion in average annual credit assistance
Modal applicability: Highway, transit, rail, and port projects.
Use: Eligible applicants include state and local governments, transit agencies, railroad companies, special authorities, special districts, and private entities. TIFIA assistance is competitively awarded. As of early 2012, 13 states and Puerto Rico had received TIFIA loans totaling $9.1 billion.242
North Carolina was awarded a TIFIA loan of $387 million in 2009 to assist with the construction of the Triangle Expressway, a $1.2 billion project.243
Virginia received a direct TIFIA loan in 2012 totaling $422 million for assistance with the completion of the downtown tunnel project in Norfolk and Portsmouth. The project’s total estimated cost is $2.1 billion.244 In 2007, the state received $150 million in TIFIA loans to help with the completion of the Richmond Airport Connector, a $597 million project.245
64
SSTI Survey of State and Local Transportation Revenue Sources
Discussion: The TIFIA program presents a significant opportunity to leverage federal loans in order to increase private sector participation in large transportation infrastructure projects. For this reason, TIFIA loans are often part of P3 projects. This program has provided assistance across the major transportation modes, with highway, transit/rail, air, and maritime transit projects benefiting from TIFIA loans.
On the other hand, TIFIA loans can only provide a portion of a project’s funding. TIFIA contributions are limited to 33 percent of a project’s budget, and dedicated revenues for repayment are required for funding the award.
65
Appendix
Appendix A: Scan of State Use of Identified Revenue Strategies
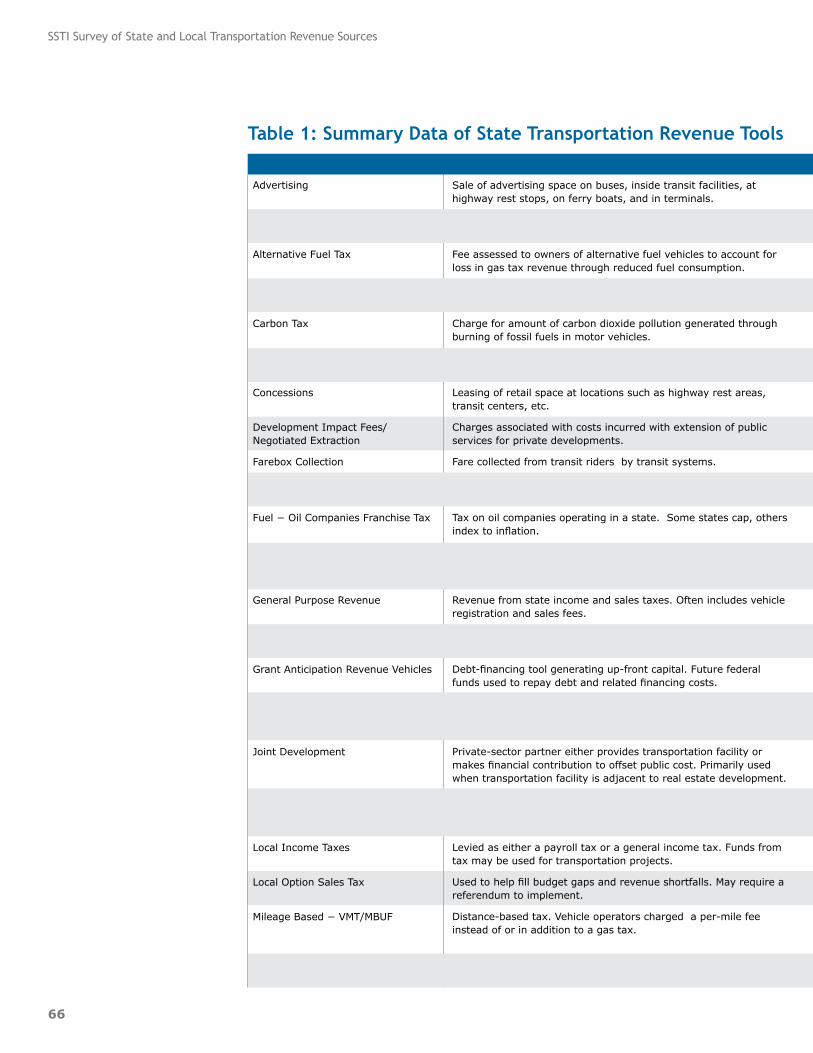
66
SSTI Survey of State and Local Transportation Revenue Sources
Mechanism
Advertising
Air Rights
Alternative Fuel Tax
Bike License Fees and Trail Passes
Carbon Tax
Certificates of Participation
Concessions
Development Impact Fees/Negotiated Extraction
Farebox Collection
Fine-based
Fuel − Oil Companies Franchise Tax
Fuel − Indexing/Increasing Fuel Tax
General Purpose Revenue
Grant Anticipation Notes
Grant Anticipation Revenue Vehicles
Heavy Vehicle/Weight-Mile Fees
Joint Development
Land Value Tax
Local Income Taxes
Local Option Sales Tax
Mileage Based − VMT/MBUF
Mobility Tax
Description
Sale of advertising space on buses, inside transit facilities, at highway rest stops, on ferry boats, and in terminals.
Sale of development rights for land adjacent to or above a transportation facility.
Fee assessed to owners of alternative fuel vehicles to account for loss in gas tax revenue through reduced fuel consumption.
Fees for trail use and bike registration to support maintenance and development of bicycle infrastructure.
Charge for amount of carbon dioxide pollution generated through burning of fossil fuels in motor vehicles.
Tax-exempt bonds issued by state entities. Usually secured with revenue from equipment or facility lease.
Leasing of retail space at locations such as highway rest areas, transit centers, etc.
Charges associated with costs incurred with extension of public services for private developments.
Fare collected from transit riders by transit systems.
Dedicated proceeds from traffic fines to support transportation systems.
Tax on oil companies operating in a state. Some states cap, others index to inflation.
Indexing fuel (gas) tax to either the consumer price index or construction cost index. States that do not index the fuel tax see effective reductions in revenues caused by inflation.
Revenue from state income and sales taxes. Often includes vehicle registration and sales fees.
Debt-financing tool generating up-front capital. Future federal funds used to repay debt and related financing costs.
Debt-financing tool generating up-front capital. Future federal funds used to repay debt and related financing costs.
Commercial registration fees for designated vehicles based on vehicle weight. Both flat fees for vehicles exceeding specified weight and per-mile fee for same vehicles.
Private-sector partner either provides transportation facility or makes financial contribution to offset public cost. Primarily used when transportation facility is adjacent to real estate development.
Best used as incentive for development around completed transportation improvements. LVT can be an effective tool when planning transit-oriented development.
Levied as either a payroll tax or a general income tax. Funds from tax may be used for transportation projects.
Used to help fill budget gaps and revenue shortfalls. May require a referendum to implement.
Distance-based tax. Vehicle operators charged a per-mile fee instead of or in addition to a gas tax.
Tax levied in specific geographic area served by a mass transit system. Covers operating and capital costs.
Table 1: Summary Data of State Transportation Revenue Tools

67
Appendix
Level of Government*
State
State and local
State
State and local
Federal, state, regional, local
State
State and local
Local
Local
State and local
State
Federal and state
State and local
Federal
Federal
Federal and state
Local
State and local
Local
Local
State
State and local
Revenue Potential
Marginal to Moderate
Moderate to high, depending on lease agreements
Marginal, but with high growth potential as more alternative-fuel vehicles come into use
Marginal
High to moderate, depending on implementation
Very high
Moderate
Marginal to moderate, depending on project
High
Moderate
Very high, especially for states that either do not use or have capped this tax
Very high
Very high
Very high
Very high
Moderate
Marginal
High
Marginal, not used on a large scale, varies by state
High to very high
Very high − VMT has the potential to replace the fuel tax as the primary source of funds for transportation systems.
Very high
Modal Applicability**
Highway and transit
Highway and transit
Highway
Bike facilities
Highway and transit
Transit
Highway and transit
Highway and transit
Transit
All modes
Highway
All motorized modes
All modes
Transit
Highway
Highway
Highway and transit
All modes
All modes
All modes
Highway
Transit
Chart continued on next page
*Indicates the most common level at which the mechanism is instituted. Some mechanisms may be instituted at one level for the benefit of agencies of another level, e.g., local governments may use financing from a state source.
**These are the most common applications. With flexible budgeting, as used in some states, revenues need not be tied to particular modes.
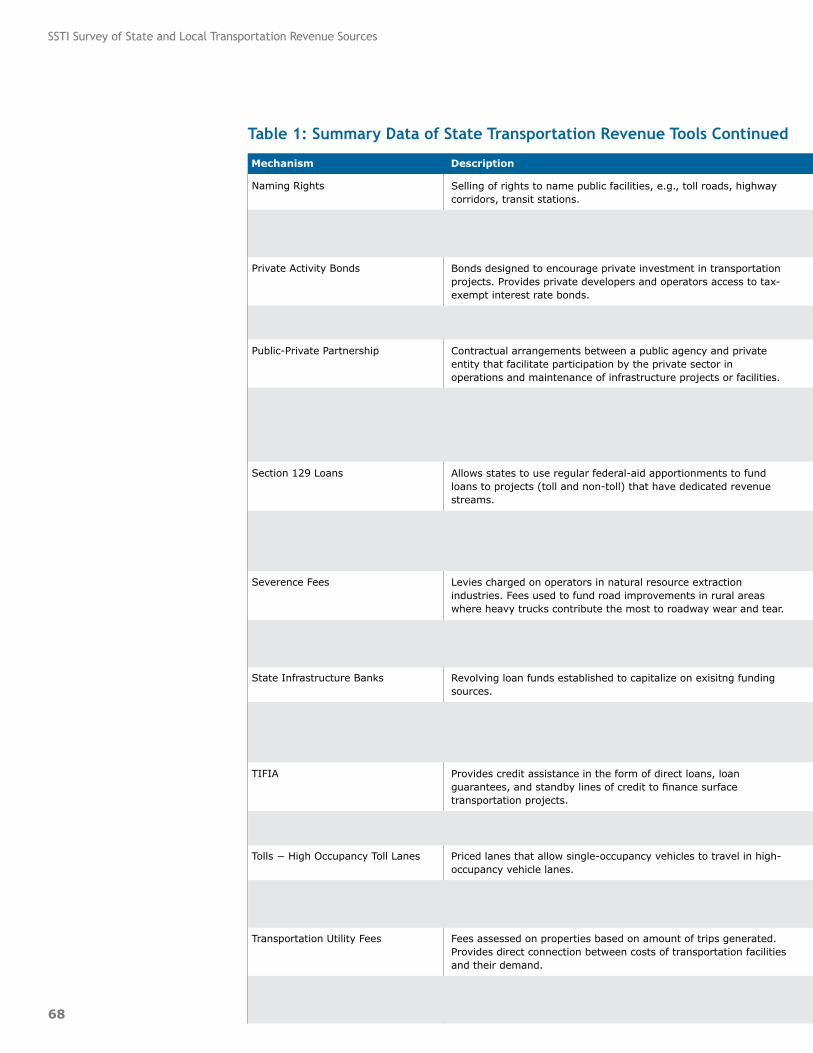
68
SSTI Survey of State and Local Transportation Revenue Sources
Selling of rights to name public facilities, e.g., toll roads, highway corridors, transit stations.
Tolling strategy requiring drivers to pay variable prices for using express lanes or bridges. Prices change dynamically as travel demands shift.
Bonds designed to encourage private investment in transportation projects. Provides private developers and operators access to tax-exempt interest rate bonds.
Basic funding source for public expenditure at the local level. Revenues may be used for transportation projects.
Contractual arrangements between a public agency and private entity that facilitate participation by the private sector in operations and maintenance of infrastructure projects or facilities.
Provides direct federal loans for up to 100% of a rail project. Repayment period for the loans can be as long as 35 years and offers interest rates equal to the cost of borrowing to the government. May be used for capital improvements, establishing new service, or debt servicing.
Allows states to use regular federal-aid apportionments to fund loans to projects (toll and non-toll) that have dedicated revenue streams.
Projects awarded as part of a competitive application process. Eligible projects test innovative project delivery techniques that are currently prohibited under Title 23 and encourage private-sector participation.
Levies charged on operators in natural resource extraction industries. Fees used to fund road improvements in rural areas where heavy trucks contribute the most to roadway wear and tear.
Self-imposed special tax districts created to finance a public improvement. Captures increased property values near transportation improvements.
Revolving loan funds established to capitalize on exisitng funding sources.
Use taxes levied on the incremental increase in property values that result from a transportation improvement. The taxes are used to fund the improvements, usually through the repayment of bonds.
Provides credit assistance in the form of direct loans, loan guarantees, and standby lines of credit to finance surface transportation projects.
Flat-rate tolls assess a direct user fee to motorists. Often distance based, but not by time or congestion.
Priced lanes that allow single-occupancy vehicles to travel in high-occupancy vehicle lanes.
Pricing for some or all lanes of a roadway network in an area or region. Applies variable pricing on a network scale, rather than on a single transportation facility.
Fees assessed on properties based on amount of trips generated. Provides direct connection between costs of transportation facilities and their demand.
Fees to register passenger and commercial vehicles.
Naming Rights
Tolls/Pricing − Variable
Private Activity Bonds
Property Tax
Public-Private Partnership
Railroad Rehabilitation and Improvement Financing Program (RRIF)
Section 129 Loans
SEP-15
Severence Fees
Special Assessment Districts
State Infrastructure Banks
Tax Increment Financing
TIFIA
Tolls − Flat Rate
Tolls − High Occupancy Toll Lanes
Tolls − Priced Networks
Transportation Utility Fees
Vehicle Title/Registration/Licensing, etc.
Table 1: Summary Data of State Transportation Revenue Tools Continued
Mechanism Description Level of Government* Revenue Potential Modal Applicability**

69
Appendix
State and local
State
Federal
Local
State
Federal
Federal
Federal
State
State, regional, local
Federal, state, local
State and local
Federal
State
State
State and local
State and local
State and local
Moderate
High
Moderate
Moderate to marginal
Moderate to high, depending on how implemented
Very high − The program is able to fund up to $35 billion, and a wealth of untapped financing is available; to date, just $1.6 billion has been committed to projects.
Marginal
Marginal
Moderate
Very high for specific projects in municipalities
High
Very high to high for locally planned and implemented projects
Marginal
Very high − Some flat-rate toll roads have been completely funded by toll revenues.
High
Very high
Moderate
High − In some states, annual registration and related fees generates upward of one-quarter of the dedicated transportation fund.
Highway and transit
Highway
Freight, highway, and transit
All modes
All modes
Rail
Highway and bridge
Highway
Highway
Transit
All modes
All modes
All modes
Highway, bridge, ferry
Highways
Highways
All modes
Highway
Mechanism Description Level of Government* Revenue Potential Modal Applicability**
70
SSTI Survey of State and Local Transportation Revenue Sources
Notes1. Report from the Bicycle Registration Subcommittee to the
Pedestrian Bicycle Motor Vehicle Commission, 2009, http://legistar.cityofmadison.com/attachments/75a733b1–1544-4619-a5a0–0f759adcf830.pdf (2009).
2. Report from the Bicycle Registration Subcommittee to the Pedestrian Bicycle Motor Vehicle Commission, 2009.
3. “A3657,” ASSEMBLY, No. 3657 STATE OF NEW JERSEY 214th LEGISLATURE, January 6, 2011, www.njleg.state.nj.us/2010/Bills/A4000/3657_I1.HTM,(2010).
4. Matt Friedman, “N.J. Assemblywoman Slams Brakes on Bicycle License Plate Proposal,” January 14, 2011.
5. Georgia Department of Natural Resources, “Public Meetings Set to Discuss New Bike Trail Fees in State Parks Georgia State Parks”, December 20, 2011, www.gastateparks.org/item/193122.
6. Report from the Bicycle Registration Subcommittee to the Pedestrian Bicycle Motor Vehicle Commission, 2009.
7. Todd Litman, “Evaluating Carbon Taxes As An Energy Conservation And Emission Reduction Strategy,’” Transportation Research Record 2139 (2009): 125 – 132.
8. “Greenery in Canada: We Have a Winner,” June 21, 2011, www.economist.com/node/18989175.
9. “Carbon Tax Center: Where Carbon Is Taxed”, July 25, 2011, www.carbontax.org/progress/where-carbon-is-taxed/.
10. British Columbia Ministry of Small Business and Revenue. “British_Columbia_Carbon_Tax.pdf”, n.d., www.bcenergyblog.com/uploads/file/British_Columbia_Carbon_Tax.pdf. (February, 2008).
11. British Columbia Ministry of Finance. “Carbon_tax_rates_by_fuel_type_from_Jan_2010.pdf”, n.d., www.fin.gov.bc.ca/tbs/tp/Carbon_tax_rates_by_fuel_type_from_Jan_2010.pdf.
12. Christa Marshall, “British Columbia Survives 3 Years and $848 Million Worth of Carbon Taxes - NYTimes.com,” The New York Times, March 22, 2011, www.nytimes.com/cwire/2011/03/22/22climatewire-british-columbia-survives–3-years-and–848-mi–40489.html?pagewanted=all.
13. “Carbon Taxing State Activity Page,” State Environmental Resource Center, n.d., www.serconline.org/carbontaxing/stateactivity.html.
14. “Frequently Asked Questions: Regional Greenhouse Gas Initiative (RGGI) MassDEP,” Massachusetts Department of Environmental Protection, September 2009, www.mass.gov/dep/air/climate/rggifaq.htm.
15. “RGGI_Fact_Sheet.pdf”, n.d., www.rggi.org/docs/RGGI_Fact_Sheet.pdf.
71
Appendix
16. “Transportation and Climate Initiative Georgetown Climate Center,” Georgetown Climate Center, n.d., www.georgetownclimate.org/state-action/transportation-and-climate-initiative.
17. Litman, “Evaluating Carbon Taxes As An Energy Conservation And Emission Reduction Strategy,”
18. Ibid.
19. “Carbon Tax Center: Where Carbon Is Taxed.”www.carbontax.org/introduction/#softening
20. “APTA_2011_Fact_Book.pdf”, n.d., www.apta.com/resources/statistics/Documents/FactBook/APTA_2011_Fact_Book.pdf.
21. Some transit agencies, such as Chapel Hill Transit in North Carolina, do not charge fares. These agencies are fully subsidized by the local government and its operating partners—commonly universities. As budgets are tightened, this fare policy may become increasingly rare.
22. “MARTA - Metropolitan Atlanta Rapid Transit Authority”, n.d., http://itsmarta.com/marta-FY2012.aspx.
23. Steve Harrison, “Bus, Rail Fare Hike Sought CharlotteObserver.com,” CharlotteObserver.com, January 28, 2012, www.charlotteobserver.com/2012/01/28/2965822/bus-rail-fare-hike-sought.html.
24. “MTA 2011 Final Proposed Budget, November Financial Plan 2011.pdf”, n.d., www.mta.info/mta/budget/nov2010/MTA%202011%20Final%20Proposed%20Budget,%20November%20Financial%20Plan%202011.pdf.
25. “Nearly 80 Percent of Public Transit Systems Forced to Implement Fare Increases or Service Cuts Due to Flat or Decreased Local and State Funding,” APTA Media Center, August 17, 2011, www.apta.com/mediacenter/pressreleases/2011/Pages/110817_ServiceCut_Survey.aspx.
26. “Ridership Increases in Third Quarter”, December, 2011, www.apta.com/resources/statistics/Documents/Ridership/2011-q3-ridership-APTA.pdf.
27. Florida League of Cities, Inc., “Cameras at Red Lights”, n.d., www.floridaleagueofcities.com/Advocacy.aspx?CNID=2373.
28. “Virginia Acts of Assembly — 2007 Reconvened Session, H.B. 46.2–206.1” 2007, http://leg1.state.va.us/cgi-bin/legp504.exe?071+ful+CHAP0896+pdf.
29. “Abusive Driver Fees Refunds - Virginia Department of Accounts,” Virginia Department of Accounts, 2008, www.doa.virginia.gov/General_DOA/Driver_Refunds.cfm.
30. “School Zone Safety Improvement Project,” National Highway Safety Administration, 1997, www.nhtsa.gov/people/outreach/safedige/fall1997/n5–25.html.
31. “Fine-Based Mechanisms Safe Routes to School National Partnership,” Safe Routes to School National Partnership, n.d., www.saferoutespartnership.org/state/bestpractices/finebasedfunding.

72
SSTI Survey of State and Local Transportation Revenue Sources
32. Ibid.
33. Ibid.
34. Ibid.
35. “The Heavy Vehicle Use Tax”, 2008, www.fhwa.dot.gov/policy/091116/pdfs/fhwa8-page.pdf.
36. “Chapter4. Weight Mile Tax”, n.d., www.oregon.gov/DOR/STATS/docs/ExpR09–11/Chapter4.pdf?ga=t.
37. “The Heavy Vehicle Use Tax.”
38. “Overweight and Over-Dimensional Vehicle Permit Program”, June 18, 2012, Florida Department of Transportation.
39. South Carolina Department of Public Safety, “South Carolina State Transport Police”, 2012, www.scdps.gov/scstp/.
40. “Chapter 4. Weight Mile Tax.”
41. Ibid.
42. “Vehicle Title and Registration – Montana Department of Justice”, n.d., https://doj.mt.gov/driving/vehicle-title-and-registration/.
43. Montana Department of Transportation, “Motor Carrier Services Division”, n.d., www.mdt.mt.gov/mdt/organization/mcs.shtml.
44. Federal Highway Administration, “Highway Cost Allocation Study - Office of Transportation Policy Studies - FHWA”, 2012, www.fhwa.dot.gov/policy/otps/costallocation.htm.
45. “State Energy Revenues Update,” National Conference of State Legislatures, 2012, www.ncsl.org/issues-research/budget/state-energy-revenues-update.aspx.
46. “Severance Tax – Oil and Gas,” www.colorado.gov/cs/Satellite?blobcol=urldata&blobheader=application%2Fpdf&blobkey=id&blobtable=MungoBlobs&blobwhere=1251599351890&ssbinary=true.
47. “Report of Minnesota’s Mileage-Based User Fee Policy Task Force,” December 2011 www.dot.state.mn.us/mileagebaseduserfee/pdf/mbufpolicytaskforcereport.pdf.
48. John Chalker, Gail Achterman, Dan O’Neal, “Letter to Senator Maria Cantwell,” January 16, 2009, www.tollroadsnews.com/sites/default/files/WestOnVMT.pdf.
49. Zhan Guo et al., “The Intersection of Urban Form and Mileage Fees: Findings from the Oregon Road User Fee Pilot Program” (March 2011), http://trid.trb.org/view.aspx?id=1100303.
50. “Letter to Senator Maria Cantwell,” January 16, 2009, www.tollroadsnews.com/sites/default/files/WestOnVMT.pdf.
51. “Report of Minnesota Mileage Based User Fee Task Force.”
52. “AASHTO Journal - Mn/DOT to Test Technology for Potential VMT Fee”, April 22, 2011, www.aashtojournal.org/Pages/042211minnesota.aspx.

73
Appendix
53. “Preliminary Results from the MnDOT Mileage-Based User Fee Demonstration”, April 20, 2012, Presented by Ben Pierce, Battelle, www.ssti.us/wp/wp-content/uploads/2012/05/Pierce_SSTI-Community-of-Practice-MRFT-Presentation–4_23_2012.pdf.
54. Elisabeth Rosenthal, “In Auto Test in Europe, Meter Ticks Off Miles, and Fee to Driver,” New York Times, August 10, 2011, www.nytimes.com/2011/08/11/science/earth/11meter.html?_r=1.
55. “Vehicle Miles Traveled (VMT) Tax: An Alternative to the Gas Tax for Generating Highway Revenue”, n.d., http://vtrc.virginiadot.org/rsb/RSB19.pdf.
56. “Working Document Excerpt - Section 6 Cost Drivers and Preliminary Cost Estimates.pdf”, n.d., http://i95coalition.org/i95/Portals/0/Public_Files/pm/reports/Working%20Document%20Excerpt%20-%20Section%206%20Cost%20Drivers%20and%20Preliminary%20Cost%20Estimates.pdf.
57. “Preliminary Results from the MnDOT Mileage-Based User Fee Demonstration.”
58. Report of Minnesota Mileage-Based User Fee Task Force.”
59. Ibid.
60. Guo et al., “The Intersection of Urban Form and Mileage Fees.”
61. Nancy Keates, “What Drives People to Take Vanity License Plates? - WSJ.com,” Wall Street Journal, June 23, 2011, http://online.wsj.com/article/SB10001424052702303745304576359910386002034.html?mod=.
62. “Transportation Funding & Financing—Proposed Funding Sources,” AASHTO Center for Excellence in Project Finance, 2012, www.transportation-finance.org/funding_financing/funding/proposed_funding_sources/annual_highway_user_vehicle_fee.aspx.
63. “Disposition of Vehicle Registration and License Fees,” Washington State Legislature, n.d., http://apps.leg.wa.gov/rcw/default.aspx?cite=46.68.030.
64. “Transportation Development Association of Wisconsin”, 2012, www.tdawisconsin.org/transportation.iml.
65. “Colorado’s Motor Vehicle Registration Fees Increase Beginning July 1, 2009,” Boulder County, Colorado, June 18, 2009, www.bouldercounty.org/apps/newsroom/templates/bc12.aspx?articleid=1714&zoneid=1.
66. “TRACOverview.pdf”, January, 2011 www.coloradodot.info/about/committees/trac/Minutes%20and%20Agendas/TRACOverview.pdf.
67. Mark Niesse, “Lawmakers Consider Big Increase in Vehicle Weight Taxes and Fees - Hawaii News - Honolulu Star-Advertiser”, February 2, 2011, www.staradvertiser.com/news/breaking/115149769.html.
68. “2007 House Bill 2542: Increase Car Fees for Computer Upgrade -

74
SSTI Survey of State and Local Transportation Revenue Sources
Kansas Votes,” Kansas Votes: Kansas Policy Institute, 2007, www.kansasvotes.org/2007-HB–2542.
69. “South Dakota Legislature Approves Raising Registration Fees,” AASHTO Journal, March 4, 2011, www.aashtojournal.org/Pages/030411sd.aspx.
70. “Vehicle Registration - Registration Fees, Vehicle Use Taxes and Supplemental Fees Passenger Vehicles,” New York State Department of Motor Vehicles, 2012, www.dmv.ny.gov/regfee.htm.
71. N.Y. VAT. LAW ß 499-d: NY Code - Section 499-D: Deposit and Disposition of Revenue from Supplemental Fee, n.d., http://codes.lp.findlaw.com/nycode/VAT/IV/17-C/499-d.
72. “Title and Registration,” SC Department of Motor Vehicles, 2007, www.scdmvonline.com/DMVNew/default.aspx?n=titleandreg.
73. “Cost of Owning a Vehicle in Oregon to Soar Oregon Business Report,” Oregon Business Report, September 17, 2009, http://oregonbusinessreport.com/2009/09/cost-of-owning-a-vehicle-in-oregon-to-soar/.
74. “Oregon DMV,” Oregon DMV, n.d., www.oregon.gov/ODOT/DMV/pages/fees/index.aspx.
75. “Motor Vehicles: Motor Vehicle Act,” Utah State Legislature, n.d., http://le.utah.gov/code/TITLE41/htm/41_01a120600.htm.
76. Nicholas Johnson, Andrew Nicholas, and Steven Pennington, “Tax Measures Help Balance State Budgets “Center on Budget and Policy Priorities, July 9, 2009, www.cbpp.org/cms/index.cfm?fa=view&id=2815.
77. Joe Pyrah, “House Approves $20 Increase in Vehicle Registration Fees,” Daily Herald, March 1, 2009, www.heraldextra.com/news/state-and-regional/govt-and-politics/article_587757a1–7b89–5638-8586-a8c5ba304c45.html.
78. Johnson, Nicholas, and Pennington, “Tax Measures Help Balance State Budgets.”
79. Grant Bosse, “Higher Vanity Plate Fees Bring Small Drop in Sales,” The Josiah Bartlett Center for Public Policy, December 9, 2010, www.jbartlett.org/higher-vanity-plate-fees-bring-small-drop-in-sales–3.
80. “Legislative Bill 110”, 2009, http://nebraskalegislature.gov/FloorDocs/101/PDF/Slip/LB110.pdf.
81. Keates, “What Drives People to Take Vanity Licence Plates? - WSJ.com.”
82. “MVA Fees & Legislative Changes,” Maryland Department of Transportation: Motor Vehicle Administration, n.d., www.mva.maryland.gov/2011-legislation.htm.
83. “Md. House Appropriations Committee to Consider Fee Increases,”

75
Appendix
Maryland Daily Record, March 18, 2011, http://thedailyrecord.com/2011/03/18/md-house-panel-continues-work-on-budget-cuts/.
84. Simon Workman and Jamie Rall, “Taxation of Alternative Fuels,” National Council of State Legislatures, August 2012, www.ncsl.org/issues-research/transport/taxation-of-alternative-fuels.aspx.
85. NM Statutes and Court Rules (unannotated), n.d., www.nmonesource.com/nmnxtadmin/NMPublic.aspx.; Sections 7–16B–1 through 7–16B–10.
86. “Revised Code of Washington (RCW),” Washington State Legislature, August 13, 2012, http://apps.leg.wa.gov/rcw/. Sections 82.36.025 and 82.38.075.
87. Brit Liggett, “Washington State Legislators Pass $100 Electric Vehicle Tax,” Inhabitat - Sustainable Design Innovation, Eco Architecture, Green Building, February 19, 2012, http://inhabitat.com/washington-state-legislators-pass–100-electric-vehicle-tax/.
88. Kate Galbraith, “Texas Mulls Altenatives to the Gas Tax,” The Texas Tribune, December 21, 2010, www.texastribune.org/texas-transportation/transportation/texas-mulls-alternatives-gas-tax/.
89. “Highway Statistics 2009,” US Department of Transportation: Federal Highway Administration: Policy Information, February 2011, www.fhwa.dot.gov/policyinformation/statistics/2009/sf1.cfm.
90. “Building a Better Gas Tax”, December 2011, Institute on Taxation and Economic Policy www.itepnet.org/bettergastax/bettergastax.pdf.
91. Bureau of Labor Statistics. “CPI Detailed Report: Data for February 2012”, February, 2012 www.bls.gov/cpi/cpid1202.pdf.
92. “Bureau of Reclamation Construction Cost Trends”, n.d., www.usbr.gov/pmts/estimate/cct12–15.pdf.
93. “Building a Better Gas Tax.”
94. “Blue Ribbon Readers Companion”, February, 2011, www.metroplan.org/files/53/BlueRibbonReadersCompanion.pdf.
95. Jonathan Williams, “Paying at the Pump: Gasoline Taxes in America Tax Foundation,” October 16, 2007, http://taxfoundation.org/article/paying-pump-gasoline-taxes-america.
96. “Oregon’s Fuel Tax Increase”, December. 2010, www.oregon.gov/ODOT/JTA/FuelTax_FactSheet.pdf?ga=t.
97. “Transportation Development Association of Wisconsin.”
98. “Building a Better Gas Tax.”
99. Ken Belson, “In New York, Debating a Flat Tax on Gasoline,” The New York Times, May 17, 2008, sec. New York Region, www.nytimes.com/2008/05/17/nyregion/17gastax.html.
100. “Gasoline Tax Information - Vermont Gas Prices,” VermontGasPrices.

76
SSTI Survey of State and Local Transportation Revenue Sources
com, n.d., www.vermontgasprices.com/tax_info.aspx.
101. “Building a Better Gas Tax.”
102. Ibid.
103. Ibid.
104. Honolulu Oil Corp. V. Franchise Tax Bd. - 60 Cal.2d 417 - Tue, 10/29/1963 California Supreme Court Resources (1963).
105. Pennsylvania State Transportation Advisory Committee. “Transportation Funding Study - Final Report.pdf”, May 2010, ftp://ftp.dot.state.pa.us/public/pdf/TFAC/Transportation%20Funding%20Study%20-%20Final%20Report.pdf.
106. N.Y. TAX. LAW ß 182: NY Code - Section 182: Additional Franchise Tax on Certain Oil Companies, Additional Franchise Tax on Certain Oil Companies, 1983, http://codes.lp.findlaw.com/nycode/TAX/9/182.
107. “Transportation Funding Study - Final Report.pdf.”
108. “Pricing,” Gomez-Ibanez, Jose, p. 101. In Essays in Transportation Economics and Policy: a Handbook in Honor of John R. Meyer (Washington, D.C: Brookings Institution Press, 1998).
109. Cissy Szeto and Norman Wuestefeld, “Historical and Contemporary Toll Revenue Uses,” Transportation Research Record: Journal of the Transportation Research Board 1558, no. –1 (January 1, 1996): 16–23, http://dx.doi.org/10.3141/1558–03.
110. “FHWA Office of Innovative Program Delivery: Revenue: Road Pricing”, n.d., www.fhwa.dot.gov/ipd/revenue/road_pricing/index.htm.
111. “FHWA Office of Innovative Program Delivery: Revenue: Parking Pricing”, n.d., www.fhwa.dot.gov/ipd/revenue/road_pricing/study_reports/parking_pricing.htm.
112. “North Carolina 2012 Ferry System Schedule”, n.d., www.ncdot.gov/download/transit/ferry/ferryschedule.pdf.
113. “AASHTO Center for Excellence in Project Finance—Transportation Funding & Financing—State Funding,” Toll Funding, 2012, www.transportation-finance.org/funding_financing/funding/state_funding/tolls.aspx.
114. “Road Pricing Defined”, n.d., www.fhwa.dot.gov/ipd/revenue/road_pricing/defined/demand_mgmt_tool.htm.
115. “Virginia HOT Lanes”,2012, http://virginiahotlanes.com/beltway/how-hot-lanes-work/about.php.
116. “Road Pricing Defined.”
117. Ibid.
118. Ferrol O Robinson, Hubert H. Humphrey Institute of Public Affairs, and SRF Consulting Group, Heavy vehicle tolling in Germany: performance, outcomes and lessons learned for future pricing efforts in Minnesota and the U.S. (Minneapolis, Minn.: Hubert Humphrey

77
Appendix
Institute for Public Affairs, University of Minnesota, 2008).
119. “Pols Tiptoe Around Plan To Revolutionize NYC’s Toll System,” Transportation Nation, n.d., http://transportationnation.org/2012/03/28/pols-tiptoe-around-plan-to-revolutionize-nycs-toll-system/.
120. “Interstate 15: Express Lanes Middle Segment”, n.d., www.dot.ca.gov/dist11/facts/CW_TI15BrochMS_Feb09_Broch1_2_20_09FINAL.pdf.
121. “Road Pricing Defined.”
122. San Francisco Metropolitan Transit Agency, “About – SFpark”, 2012, http://sfpark.org/about-the-project/.
123. “Self-employed Individuals - Metropolitan Commuter Transportation Mobility Tax (MCTMT)”, April 5, 2012, www.tax.ny.gov/bus/mctmt/ind.htm.
124. “TRIMET 2011 Audited Financial Statements”, n.d., http://trimet.org/pdfs/publications/2011-audited-financial-statements.pdf.
125. “Lane Transit District”, n.d., www.ltd.org/pdf/boardmeetings/CAFR%202010-2011.pdf.
126. “Chapter 3. Gas, Use, and Jet Fuel Taxes”, n.d., www.oregon.gov/DOR/STATS/docs/ExpR09–11/Chapter3.pdf?ga=t.
127. “Chapter 267 — Mass Transit Districts; Transportation Districts,” 2011, www.leg.state.or.us/ors/267.html. Chapter 267 contains the revised Chapter 643.
128. “Chapter 267 – Mass Transit Districts; Transportation Districts,” Chapter 267 contains the revised Chapter 907
129. “Chapter 739 Oregon Laws 2003,” 2003, www.leg.state.or.us/03orlaws/sess0700.dir/0739ses.htm.
130. “Chapter 253 Oregon Laws 2009,” 2009, www.leg.state.or.us/09orlaws/sess0200.dir/0253.htm.
131. Benjamin Kabak, “Proposing a Sensible Transit Platform: Second Ave. Sagas,” Second Avenue Sagas, October 21, 2012, http://secondavenuesagas.com/2010/10/21/proposing-a-sensible-transit-platform/.
132. David Brunori, Local Tax Policy: A Federalist Perspective, 2nd ed. (Urban Institute Press, 2007).
133. Todd Goldman and Martin Wachs, “A quiet revolution in transportation finance: the rise of local option transportation taxes,” Transportation quarterly. 57, no. 1 (2003): 19–32.
134. Brunori, Local Tax Policy .
135. “Local_Option_Income_Tax_Fact_Sheet.pdf”, October, 2007, www.in.gov/dlgf/files/Local_Option_Income_Tax_Fact_Sheet.pdf.
136. Brunori, Local Tax Policy .
137. Goldman and Wachs, “A quiet revolution in transportation finance.”
78
SSTI Survey of State and Local Transportation Revenue Sources
138. Brunori, Local Tax Policy .
139. Goldman and Wachs, “A quiet revolution in transportation finance.”
140. “Local_Option_Income_Tax_Fact_Sheet.pdf.”
141. “Local Option Income Taxes in Indiana”, March 8, 2012, http://cms.bsu.edu/Academics/CentersandInstitutes/BBR//media/DepartmentalContent/MillerCollegeofBusiness/BBR/Publications/LOIT0318.ashx..
142. Goldman and Wachs, “A quiet revolution in transportation finance.”
143. www.transportation-finance.org/funding_financing/funding/local_funding/option_sales_taxes.aspx
144. Goldman and Wachs, “A quiet revolution in transportation finance.”
145. Ibid.
146. Ibid.
147. “AASHTO Center for Excellence in Project Finance—Transportation Funding & Financing—State Funding.”
148. Matt Burress, “House Research - Short Subjects. Motor Vehicle Sales Tax”, January 2011, www.house.leg.state.mn.us/hrd/pubs/ss/ssmvst.pdf.
149. “2011 Texas Highway Funding Primer 0311.pdf”, 2011. http://ebookbrowse.com/funds-primer-doc-d178391362.
150. J. Stuart Adams, Transportation Funding Revisions, 2011 General Session, State of Utah, 2011, http://le.utah.gov/2011/bills/sbillenr/sb0229.pdf.
151. Burress, “House Research - Short Subjects. Motor Vehicle Sales Tax.”
152. Adams, Transportation Funding Revisions, 2011 General Session, State of Utah .
153. “2011 Texas Highway Funding Primer 0311.pdf.”
154. Beverly R Silverberg et al., Transit advertising revenue: traditional and new sources and structures (Washington, D.C.: National Academy Press, 1998).
155. Public Highways and Transportation, n.d., http://apps.leg.wa.gov/RCW/default.aspx?cite=47.42.010.
156. Tina Geiselbrecht et al., A guide to transportation funding options: phase 2 (College Station, TX: University Transportation Center for Mobility, Texas Transportation Institute, Texas A & M University System, 2009).
157. Don Balfour, State Highway System; Permits for Legally Erected Signs; Change Provisions, 2011, www.legis.ga.gov/legislation/en-US/display/32437.
158. HB512 (2007) New Hampshire Liberty Alliance, 2007, www.nhliberty.org/bills/view/2007/HB512.
159. Personal communication with Joe Galbato, TNDOT, 4/27/12.
160. Dean, Faison, Hawk, Swann, Keisling, White, Gotto, Miller D, Brooks

79
Appendix
K, Johnson P, Eldridge, Casada, Alexander, Sparks, Fitzhugh, Turner M, McDonald, Stewart, Hardaway, Todd, McCormick, HB 0222 - Bill Summary, n.d.,http://wapp.capitol.tn.gov/apps/billinfo/BillSummaryArchive.aspx?BillNumber=HB0222&ga=107.
161. CALTRANS, Outdoor Advertising Act and Regulations; 2011 Edition, 2011, California ß 5481— www.dot.ca.gov/oda/download/ODA_Act_&_Regulations.pdf.
162. Connecticut DOT, “Testimony - HB 5165, An Act Concerning Applications to Erect Outdoor Advertising Structures and the Fees for the Erection and Maintenance of Such Structures”, February 22, 2012, www.cga.ct.gov/2012/TRAdata/Tmy/2012HB–05165-R000222-Commissioner%20James%20P.%20Redeker,%20DOT-TMY.PDF.
163. “AASHTO Center for Excellence in Project Finance—Transportation Funding & Financing—Other Funding Sources”, 2012, www.transportation-finance.org/funding_financing/funding/other_funding_sources/concessions.aspx.
164. Bob Lewis, “Pa.-based Firm Gets Concession to Va. Rest Areas - WTOP.com”, August 30, 2011, www.wtop.com/?nid=41&sid=2520622.
165. Metropolitan Transportation Authority, New York City, New York, “Station Concessions”, 1996, www.transportation-finance.org/pdf/funding_financing/funding/other_funding_sources/tcrp_31_nyc_mta.pdf.
166. Washington Metropolitan Transit Authority, Award License Agreements for Operation of Retail Concessions in the Metrorail System, June 24, 2010, www.wmata.com/about_metro/board_of_directors/board_docs/062410_3CRetailConcessionsinMetrorailSystem.pdf.
167. “SEPTA Board Approves Station Naming Rights Agreement”, June 24, 2010, www.septa.org/media/releases/2010/06–24.html.
168. Michael Neibauer, “McDonnell Proposes Selling Bridge, Highway Naming Rights - Washington Business Journal,” Washington Business Journal, n.d., www.bizjournals.com/washington/blog/2012/01/mcdonnell-proposes-selling-bridge.html?page=all.
169. Kathleen McGrory, “Bill Would Allow Florida to Sell Naming Rights to State-owned Facilities — Commercial Alert,” Public Citizen’s Commercial Alert, January 23, 2012, www.commercialalert.org/news/archive/2012/01/bill-would-allow-florida-to-sell-naming-rights-to-state-owned-facilities.
170. “Signs of the Times: Naming Rights for Bridges,” Union Leader, January 29, 2012, www.unionleader.com/article/20120130/OPINION01/701309997.
171. Rick Rybeck, “Using Value Capture to Finance Infrastructure and Encourage Compact Development,” Public Works Management & Policy 8, no. 4 (2004): 249–260.
172. Michael Iacono et al., Value capture for transportation finance:

80
SSTI Survey of State and Local Transportation Revenue Sources
report to the Minnesota Legislature (Minneapolis, MN: Center for Transportation Studies, University of Minnesota, 2009).
173. Ibid.
174. Robert Cervero et al., Transit-oriented development and joint development in the United States: a literature review ([Washington, D.C.]: Transportation Research Board, National Research Council, 2002). pg. 3
175. National Center for Transit Research (U.S.) and University of South Florida. Center for Urban Transportation Research, Lessons learned in transit efficiencies, revenue generation and cost reductions (Tampa, Fla.; Springfield, Va.: National Center for Transit Research, Center for Urban Transportation Research, University of South Florida; Available through the National Technical Information Service, 2003).
176. Iacono et al., Value capture for transportation finance .
177. Ibid.
178. Ibid.
179. Ibid.
180. Town of Cary, “Fees Estimation Guide for Residential and Commercial Construction Projects”, July 2012, www.townofcary.org/Assets/Inspections+$!26+Permits+Department/Inspections+and+Permits+Department+PDFs/Fee+Estimation+Guide+7–12.pdf.
181. Galardi Consulting, Promoting Vibrant Communities with System Development Charges, July 2007, http://library.oregonmetro.gov/files/sdc_report.pdf.
182. Ibid.
183. Ibid.
184. Ibid.
185. Iacono et al., Value capture for transportation finance .
186. Ibid.
187. Ibid.
188. Washington Metropolitan Transit Authority, “Joint Development Guidelines”, January 10, 2008, www.wmata.com/about_metro/board_of_directors/board_docs/011008_JointDevGuidelines.pdf
189. Livable Portland; Land Use and Transportation Initiatives (TRIMET, November 2010), http://trimet.org/pdfs/publications/Livable-Portland.pdf.
190. Iacono et al., Value capture for transportation finance .
191. In the taxation system most commonly used in the United States, improvements to a parcel are taxed at a higher rate than the land itself, providing a disincentive for owners to develop parcels because their property taxes will increase.

81
Appendix
192. Rybeck, “Using Value Capture to Finance Infrastructure and Encourage Compact Development.”
193. Walter Rybeck, “Retooling Property Taxes,” PUBLIC MANAGEMENT -LAWRENCE THEN WASHINGTON- 92, no. 2 (2010): 6–9.
194. Iacono et al., Value capture for transportation finance .
195. Ibid.
196. “AASHTO Center for Excellence in Project Finance—Transportation Funding & Financing—Local Funding”, n.d., www.transportation-finance.org/funding_financing/funding/local_funding/value_capture/special_assessment_districts.aspx.
197. “Permanent Road Division”, n.d., http://sdcdpw.org/specialdistricts/permroad.html.
198. “AASHTO Center for Excellence in Project Finance—Transportation Funding & Financing—Local Funding.”
199. University of Washington Urban Form Lab, Financing Options for an Expanded Seattle Streetcar System and Network, April 2007, http://depts.washington.edu/trac/bulkdisk/pdf/Streetcar.pdf.
200. Iacono et al., Value capture for transportation finance .
201. R. F Dye and D. F Merriman, “Tax Increment Financing: A Tool for Local Economic Development,” JOURNAL OF HOUSING AND COMMUNITY DEVELOPMENT 63, no. 3 (2006): 22–29.
202. “Bill Calderon et al., Tax increment finance best practices reference guide (New York?; [Cleveland, Ohio?]: The Centers; The Agencies, 2007).
203. Portland Streetcar, Inc. Office of Transportation, Portland Streetcar: Development Oriented Transit, April 2008, www.portlandstreetcar.org/pdf/development_200804_report.pdf.
204. Redevelopment Economics, Tax Increment Financing and Smart Growth: Policy Options for Maryland, March 2011, http://redevelopmenteconomics.com/yahoo_site_admin/assets/docs/TIF-smart_growth_policy_options_5–11_final.29674027.pdf.
205. “Tax Increment Financing in North Carolina,” UNC School of Government, n.d., www.sog.unc.edu/node/197.
206. D. Shawn Purvis, “Tax Increment Financing in North Carolina: Great Expectations, Limited Use” (University North Carolina - Chapel Hill, 2008).
207. “MDT - Financing Tools - Financing Districts - Transportation Utility Fees,” Montana Department of Transportation, n.d., www.mdt.mt.gov/research/toolkit/m1/ftools/fd/tuf.shtml. Although this site is from Montana, it contains good information on the use of TUFs in other states.
208. “Transportation Utility Fee,” Hillsboro, Oregon, n.d., www.ci.hillsboro.or.us/TUF/Default.aspx.

82
SSTI Survey of State and Local Transportation Revenue Sources
209. “AASHTO Center for Excellence in Project Finance—Transportation Funding & Financing—Bonding and Debt Instruments”, n.d., www.transportation-finance.org/funding_financing/financing/bonding_debt_instruments/certificates_of_participation.aspx.
210. “COPS and Lease-backed Bonds,” Federal Transit Administration - FY2013 Funding Recommendations - Chapter 1, 2012, www.fta.dot.gov/12868_3535.html.
211. Ibid.
212. “AASHTO Center for Excellence in Project Finance—Transportation Funding & Financing—Bonding and Debt Instruments.” www.transportation-finance.org/funding_financing/financing/bonding_debt_instruments/municipal_public_bond_issues/gans.aspx
213. New Jersey Transit, “Construction Begins on New Hudson-Bergen Light Rail 8th Street Station in Bayonne”, October 15, 2008, www.njtransit.com/tm/tm_servlet.srv?hdnPageAction=PressReleaseTo&PRESS_RELEASE_ID=2452.
214. “Tools & Programs: Federal Debt Financing Tools: Grant Anticipation Revenue Vehicles,” Innovative Program Delivery, n.d., www.fhwa.dot.gov/ipd/finance/tools_programs/federal_debt_financing/garvees/archived_highlights.htm.
215. David Warren and Robert Puentes, “Today’s Roads with Tomorrow’s Dollars: Using GARVEE Bonds to Finance Transportation Projects,” The Brookings Institution, March 2005, www.brookings.edu/research/reports/2005/03/transportation-puentes.
216. “FHWA Office of Innovative Program Delivery: Innovative Finance: Private Activity Bonds”, n.d., www.fhwa.dot.gov/ipd/finance/tools_programs/federal_debt_financing/private_activity_bonds/index.htm.
217. Ibid.
218. “FHWA Office of Innovative Program Delivery: Public Private Partnerships”, n.d., www.fhwa.dot.gov/ipd/p3/faqs/index.htm#5.
219. “FHWA Office of Innovative Program Delivery: Project Profiles”, n.d., www.fhwa.dot.gov/ipd/project_profiles/mn_hiawatha.htm.
220. Carol Wolf, “The Public-Private Indiana Toll Road Is in Trouble,” BusinessWeek: Magazine, July 7, 2011, www.businessweek.com/magazine/the-publicprivate-indiana-toll-road-is-in-trouble–07072011.html;Gary Washburn, “Daley’s Way, Not Skyway,” Chicagotribune.com, October 25, 2007, www.chicagotribune.com/services/newspaper/eedition/chi-skyway25oct25,0,6683929.story.
221. David Czerwinski et al., Policy issues in U.S. transportation public-private partnerships: lessons from Australia (San Jose, CA: Mineta Transportation Institute, College of Business, San Jose State University, 2010).
222. Pew Center on the States, Driven by dollars: what states should know when considering public-private partnerships to fund transportation.

83
Appendix
(Washington, DC: Pew Center on the States, 2009);Jaime Rall et al., Public-private partnerships for transportation a toolkit for legislators (Washington, D.C.: National Conference of State Legislatures, 2010), www.ncsl.org/documents/transportation/PPPTOOLKIT.pdf.
223. “Railroad Rehabilitation & Improvement Financing (RRIF) Program,” Federal Railroad Administration, 2012, www.fra.dot.gov/Page/P0128.
224. Tanya Snyder, “In Age of Budget Cuts, Why Are Billions of Federal Rail Dollars Going Unused? Streetsblog Capitol Hill,” DC Streetsblog, February 18, 2011, http://dc.streetsblog.org/2011/02/18/in-age-of-s%C2%ADpending-cuts-why-are-billions-of-federal-rail-dollars-going-unused/.
225. Application information may be downloaded using the following link: www.fra.dot.gov/Page/P0128
226. “Railroad Rehabilitation & Improvement Financing (RRIF) Program.”
227. Snyder, “In Age of Budget Cuts, Why Are Billions of Federal Rail Dollars Going Unused?”
228. “FHWA Office of Innovative Program Delivery: Innovative Finance: Section 129 Loans”, n.d., www.fhwa.dot.gov/ipd/finance/tools_programs/federal_credit_assistance/section_129/activity_to_date.htm.
229. “FHWA Office of Innovative Program Delivery: Public Private Partnerships.”
230. “AASHTO Center for Excellence in Project Finance—Transportation Funding & Financing—Federal Credit Assistance. State Infrastructure Banks”, n.d., www.transportation-finance.org/funding_financing/financing/credit_assistance/state_infrastructure_banks.aspx.
231. Ibid.
232. Council of State Governments, Capital Research: Transportation State Infrastructure Banks, June 2011, http://knowledgecenter.csg.org/drupal/system/files/State_Infrastructure_Banks.pdf.
233. “AASHTO Center for Excellence in Project Finance—Transportation Funding & Financing—Federal Credit Assistance. State Infrastructure Banks.”
234. Michael Norton and Matt Murphy, “Gov. Patrick Proposes Infrastructure Bank in $1.5B Bond Bill,” March 7, 2012, www.wickedlocal.com/hopkinton/news/x570354400/Gov-Patrick-proposes-infrastructure-bank-in–1–5B-bond-bill.
235. “Mayor Emanuel Unveils Chicago Economic Development Plan,” Crain’s Chicago Business, n.d., http://chicagobusiness.com/20120229/BLOGS02/120229779/mayor-emanuel-unveils-chicago-economic-development-plan/.
236. Penelope Lemov, “A Bank for Infrastructure Funding,” Governing, March 1, 2012, www.governing.com/columns/public-finance/col-bank-infrastructure-funding.html.

84
SSTI Survey of State and Local Transportation Revenue Sources
237. Ariel Hart, “State Infrastructure Bank Has $30 Million Sitting Idle,” Atlanta Journal Constitution, March 24, 2011, sec. Local Govt & Politics, www.ajc.com/news/news/local-govt-politics/state-infrastructure-bank-has–30-million-sitting-i/nQrwf/.
238. Reports from Oregon and Pennsylvania Departments of Transportation illustrate this trend. Oregon Department of Transportation, Oregon Transportation Infrastructure Bank, December 31, 2010, www.oregon.gov/ODOT/CS/FS/docs/other/OTIB2010AnnualReport.pdf?ga=t.; State Infrastructure Bank: Annual Report: Annual Report to the United States Department of Transportation, September 30, 2010, ftp://ftp.dot.state.pa.us/public/Bureaus/Cpdm/PIB/2010AnnualReport.pdf.
239. Yonah Freemark, “How to Pay for America’s Infrastructure,” Atlantic Cities, January 2, 2012, www.theatlanticcities.com/politics/2012/01/solution-americas-infrastructure-woes/845/.
240. “FHWA Office of Innovative Program Delivery: Fact Sheets; An Introduction”, n.d., www.fhwa.dot.gov/ipd/fact_sheets/finance_introduction.htm.
241. “TIFIA Credit Program Overview,” February 2012, www.fhwa.dot.gov/ipd/pdfs/tifia/bkgrnd_slides_feb_2012.pdf.
242. “FHWA Office of Innovative Program Delivery: TIFIA”, n.d., www.fhwa.dot.gov/ipd/tifia/projects_project_profiles/.
243. “FHWA Office of Innovative Program Delivery: Project Profiles: Triangle Expressway”, n.d., www.fhwa.dot.gov/ipd/project_profiles/nc_triangle_expressway.htm.
244. “FHWA Office of Innovative Program Delivery: Project Profiles: Downtown Tunnel/MIdtown Tunnel/MLK Extension”, n.d., www.fhwa.dot.gov/ipd/project_profiles/va_midtown_tunnel.htm.
245. “FHWA Office of Innovative Program Delivery: Project Profiles Pocahontas Parkway/Richmond Airport Connector”, n.d., www.fhwa.dot.gov/ipd/project_profiles/va_pocahontas.htm.
