stat 406 -- statistical methods for spatial datapcaragea/s40608/notes/intro_examples_08.pdf · stat...
TRANSCRIPT

Stat 406 – Statistical Methods for Spatial Data
Spring 2008
Topics overview
Stat 4066 (Spring 2008) Spatial Statistics Topics overview 1 / 24

Part I: Geostatistics
Precision agriculture
(data and images courtesy of M. Perez-Bidegain and P.Barbagelata)
Stat 4066 (Spring 2008) Spatial Statistics Topics overview 2 / 24

Precision agriculture: Analysis of soil fertility
0 100 200 300 400
010
020
030
0
X coordinate(m)
Y c
oord
inat
e(m
)
South Field−−−sampled locations
●
●
●
●
●
●
●●
●
●
●
●
●●●
●●
●●
●
●●
●
●
●
●
●
●
●
●
●
●
●
●
●
●
●●
●
●
●
●
●●
●
●
●
●
●
●
●●
●
●●●
●
●
●●
Multiple measurements for eachsample:
SOM (soil organic matter)
soil Ph, P (Phosphorus)
K (Potassium)
CEC (Cation exchange capacity)
Mg (Magnesium)
Stat 4066 (Spring 2008) Spatial Statistics Topics overview 3 / 24
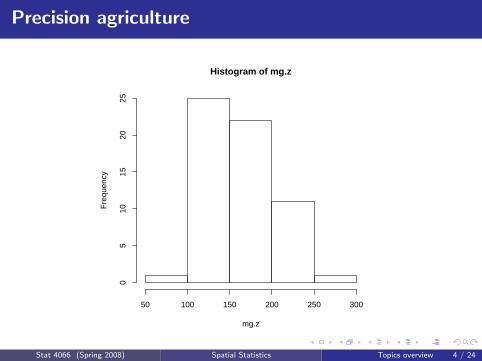
Precision agriculture
Histogram of mg.z
mg.z
Fre
quen
cy
50 100 150 200 250 300
05
1015
2025
Stat 4066 (Spring 2008) Spatial Statistics Topics overview 4 / 24

Precision agriculture
0 100 200 300 400
100
200
X coordinate(m)
MG
0 50 100 150 200 250
100
200
Y coordinate(m)
MG
Stat 4066 (Spring 2008) Spatial Statistics Topics overview 5 / 24

Precision agriculture
0 100 200 300 400
−10
00
100
200
300
X Coord
Y C
oord
●
●
●
●●
●●
●
●●
●
●●●●
●●
●●
●
●●●
●●
●●● ● ●●●
●●●
●●●●
●
●●
●
●●
●●
●●
●
●
● ●●
●
●●
● ●● ●●
●●
●
● ●●
● ●●● ●●
●
100 150 200 250
−10
00
100
200
300
data
Coo
rd Y
●
●
●
●
●
●
●●
●
●
●●
●
●
●●
●
●●
●
●
●●
●
●
●
●
●
●
●
●
●
●
●
●
●
●
●●
●●
●
●
●
●
●
●
●●
●
●
●
●
●
●
●●
●●
●
0 100 200 300 400
100
150
200
250
Coord X
data
data
Fre
quen
cy
50 100 150 200 250 300
05
1015
2025
Stat 4066 (Spring 2008) Spatial Statistics Topics overview 6 / 24

Precision agriculture
0 100 200 300 400
−10
00
100
200
300
X Coord
Y C
oord
●●
●
●
●
●●●
●
●
●●
●●●●●●
●
●
●●●●
●
●
●
●
●
●
●
●
●●
●
●
●●●
●
●
●●●
●●
●
●●
●
●●
●
●●●
●●
●●
South field−−−Magnitude of MG
Stat 4066 (Spring 2008) Spatial Statistics Topics overview 7 / 24

Precision agriculture
0 100 200 300 400
010
020
030
0
●
●
●
●
●
●
●●
●
●
●
●
●●
●●●
●
●
●
●
●●
●
●
●
●
●
●
●
●
●
●
●
●
●
●●
●
●
●
●
●
●
●
●
●
●
●
●
●
●
●
●●
●
●
●
●
●
X coordinate(m)
Y c
oord
inat
e(m
)
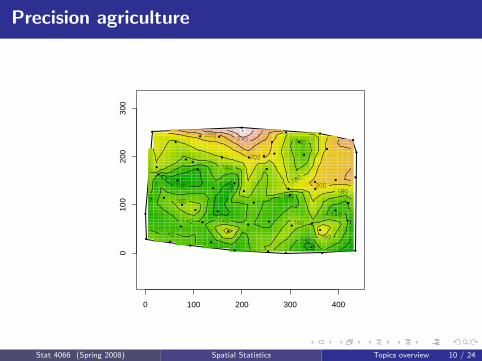
South field: Contour Plot of MG
Stat 4066 (Spring 2008) Spatial Statistics Topics overview 8 / 24

Precision agriculture
0 100 200 300 400
010
020
030
0
●
●
●
●
●
●
●●
●
●
●
●
●●
●●●
●
●
●
●
●●
●
●
●
●
●
●
●
●
●
●
●
●
●
●●
●
●
●
●
●
●
●
●
●
●
●
●
●
●
●
●●
●
●
●
●
●
Stat 4066 (Spring 2008) Spatial Statistics Topics overview 9 / 24
Precision agriculture
0 100 200 300 400
010
020
030
0
●
●
●
●
●
●
●●
●
●
●
●
●●
●●●
●
●
●
●
●●
●
●
●
●
●
●
●
●
●
●
●
●
●
●●
●
●
●
●
●
●
●
●
●
●
●
●
●
●
●
●●
●
●
●
●
●
Stat 4066 (Spring 2008) Spatial Statistics Topics overview 10 / 24
Precision agriculture
X coordinate(m)
Y c
oord
inat
e(m
)
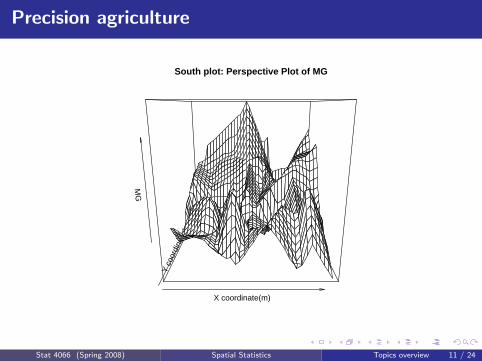
MG
South plot: Perspective Plot of MG
Stat 4066 (Spring 2008) Spatial Statistics Topics overview 11 / 24

Meteorology and Climatology
Data sets that encompass hundreds of location sites are common. (e.g.Historical Climate Network (HCN) developed and maintained by NOAA)now has several hundreds location sites:
The Precipitation Network: 5873 sites
••
•
•
••
•
•
•
•
•
••
•
•
•
•
•
••
•
•
•
•
•
•
•
• •
•
•
•
•
•
•
•
•••
•
•
•
•• •
••
•
•
•••
••
• •••
•
••
•••
•
•
••
••
•
•
• •••
•
•
•
•
•••
••
••
••
•
•
•••
•
•
•
•
• ••
••
•
•
•••
•
•
•
•
••
••
•••
•
•
•
•
•
•
••
••
•
•
••
•
• ••
•••
•••
•
•
•
• •
•
•
•
•
•
•
• •
•
•
••
••
•
• •
••
•••
•
•
•
•
•
•
•
• •
•
•
••
••••
••
••
••
•
•
•
•
••
••••••
•
•••
••
•
••
••
•
•
•
••••
••
••••
•••
••••
•
••
••
•
•
•
•
•
•
•
•
•
• ••
•
•
•
••
••
••
•• •
• •
•••
•
• •
•
••
•
•• •
•
••
•••
••
•
•
••
•
•
••
•
•• •
•
•
•
•
••
•
•
•
••
•
• ••
•
••
•
••• •
••
•
••
•
••
••
•
•
••
•••
•
•
•
••
•
•
•
•
•
•
•
••
•
•
••
•
•
•
•
•
••
•
••
•
•
•••
•
••
•
•
•
•
•
••
•
•
••
••
•
•
•
•
•
•
•
•
•
••
•
•
•
••
•
••
•
•
•••
•
•
•
•
•
••
••
•
•
•
•
•
•
•
•
•
•
•
•••
••
•
• •
•••
•
•
••
•
•
•
••
•
•
•
•
••
•
•
•
•
•
•
•
•
•
•
•
•
•
•
•
•
•
•
•
•
•
•
•
••
••
•
•
•
•
•
•
•
•
•
•
•
•
••••
•
•••
• •
•
•
••
••
••
••
•••
•••
• •
•
•
•
•
•
•
•
•
•
•
•
•
•
•
•
• •
••
••
•
••
•
•
•
•
•
•
•
•
•
•
•
•
•
•
•
•
•
•
•
•
••
•
•
••
•
•
••
•
•••
•
••
••
•
•••
•
•
••
•
•
•
•
•
•
•
•
•
•
••
•••
•
••
••
•
•
•
••
•
•
•••
•••
•••
•
•
•••
•
••
••
•
•
• •
••
•
• ••
•
•
••
•• ••
•
••
•
•
•
••
••
•
•
•
•
••
•
•
••
•
••
•• ••
•
•
•
•
•
•
•
••
•
•
•
• •
• ••
••
•
•
•
••
••
•
••
•
••
••
•
•
••
•
••
••
•
••• •
•
•
•
•
•••
••
•
••
•• •
••
•
•
••
••
••••
•••
•
•
••
•
•
•
• •
•
•
•
•
••
•
•••
••
••
•• •
•
•
••
•••
•••
•••
• •
•••
•
•
•••
•••
•
•
•
•
•
•
• •
•
•
•
••
••• •
••
•
•
•
•
•
••
•
••
•
•
••••••••
••••••
••
•••••••••
••• ••
•••••••••
•
••••
••
••
•
•
•
•
•••
•
•
•••
•
•
•
••
••
•
•••
•
•
•
•
•••
•
•
•
•
••
•
•
••
•
•••
• •
•
••
•
•
•
••
••
•
••
••
•
•
•
•
•
••
•
••
•••
•
•
•
••• •
•
•
•
•
•
•
•• •
•• •
•
•
•
••
•
•
•
• •
•
••••• ••
•
•
•
•
•
•••
•
•••
••
•
••
•
•
•••
••••
•
•
••
•
•
•
•
•
•••
•
•
•
•
•
••
••
••••
•••
•
•••• ••
•
•
••
•
••
•••
•••
•
•••
•
••
•••
•
•••
•
•
••
••
••
•
••
•
•
•
•••
•
•••
•
••••
•
••
•
•
••
•
•••
•
•
••
•
••
•
•
••
•
•
•
••
•
•
• •
•
•
•
•
••••••
•
•
•
•
•
•
•
•
•
••
••
••
•
•
•
•
•
••
•
•
••
•
•
•
••
•
• •
•
•
•
•
•• ••
•
•
•
•
•
•
•
•
•
••
•
•
•
•
•
•
•
••
•
•
••
••
•
•
•
•
••••• •••
•
•• •
•
•
•
•
•••
•••
•••
•
•
•••
••
•
•
•
•
•
•
••
•• •••
•••
•
•
•
••
•
•
•••
•
••
•
••
•
•
•
•
••
•
•• •
••
••
•••
•
•
••••
•
•
•
••
•
•
•
•
•
••
••
•
••
•
•
•
••
• ••
•
•
•
•• ••
•
••
••
••
•
••
•
•••
•
• ••
•
•
••
•
••
••
•
•••
•
•
•
••
•
••
•
•
•
•
•
•
•
•••
•
•
•
• •
•••••
•
•
•
••
•
•
•
•• •
•
•••
•
•
•
•
•
• ••
• ••••
••
••
• •
•
•
•
• •• ••
••
••
•
•
•••• •
•
•
•
•• •
•
•
••••
•••
•
••
•
•• •
••
•
••
•
•• ••
• •
••••
••
•
••
•
•
•
•
•
••
• ••
•••
•
• ••
•
•
•
•
••
•
• •••
•
•••
•
•
••••
•
•
••
•••
••••
•
•
•••
••
•••
•••
••
••
• ••
•
••
•••
•
••
• •••
•
•••
•
•
••
•
•
•
••
•
•
•
•
•
••
•••
•
•
•
•
•
••••
•
••
•
•
•
••
•
••
• • ••
•
•
•
•
•
••
•
•
•
•
•••
••
•
•••
•• •
•
•••••• •
•
•
••
•
• •
•
••
•
• •
•
•• ••
•
••
•
•• •
•••
••
•
••
•
••
••
•
•
•
•
•
•• •
••
•
••
•
• •
•• •
••
••
•••
•
••••
•
••
••• •
• •
•
••
•
••
•
••
•
•
••
••
••
•
•••
••••
•••
•
•
•
••
•
•
••
•
••
•
•
••
••
•
••
•
••
•
••
•
••
•
•
•
•
•
•
•
•• •
•
•
•
•
•
• • •• ••••
•• •••
• ••
••
•
•••••
••
•••
••
•
•
••
••
••• ••
• •
• ••••••
••
•
•••
•• • •
•
•••
•• •
•••
••• •• •
•
•••
•••
••
••
•
•
•
••
••
• ••
•
••
•
••••
••••
••
••
•
••
•••
•
••
•
••
•
•• •
•
•
•
•
• •
•
•
• •••••••• ••
•
•
•
••
••
•
•
•••
• •• •
•••
••
•
••
•
• •••
•
•
•
••
••
••••
••
••
•
••
•
•
•
•
••
•
••••••••••
• •••••
••
••
• ••
••
••
•
••••
•
•
••••
•
••••••••••••••••
••••
•
•••••
••
•••••
•••• •••
•• •
•• •••• •• •
•
•
•••
••
•
••
•
•
•
•
•
•
•
••
•
•
•
••
•
••
•
•
••
•
•
•
•
••
•
•
•
•
••
•
• •
•
•
•
•••
•••
•
•
••
•
••
••
•• •
••
•
•
•
•
• ••
•••
•
•
••
••
•
•
••
••
•
•
•
•
••
• •
••
•••
•
••
•
•
•
•
••
•
••
•
••
•
• •
•
••
•
•
•
•
•
•
•
•
•
•
•
•
•
•
•
•
•
•
•
••
•
•
•
••
•
••
••
•
• •••
•
•
•••
•
•
•
•
•
•
•
• •
•
••
••
•
•
•
•
•
•
••
••
•
••
•••
•
•••
•
•
•
••
• •• ••
••
•••
•
•
•
•
• •
•
•
•
• •
••••
•
•
•
•
•
••
•
•
••
• ••
••
•
•
•• •
••
•
••
•
•
•
• •
•
••
•
•
•
••
••
•
• •••
•
•
• •
•
•
••
•
•
•
•
••
•
•• •
••
•
•
•
••
••
•••
•
•
•• •
•
••
•••
••
•••
•••
••
•
•
•
•
•
•
•
••
•
•
•
•
••••
•
•
•
•••
•
•
•••
•
•••
••
•
•
••
••
•
•
•
•
•
•
••
•
• •
••
•
•
•
•
•
•
•
••
•
•
•
•
•
•
•••
•
•
• ••
••
••
• •
•
•••
•
••
•
•
••
•
•
•
•
•
••
••
••
•
••
••
•
•
•
••
••
•
•
•
•• •
•
• •
•
•
•
• ••
•• •
••
••
•
•• ••
•
• •
•
•••
•••
•
•
•
•
•
••
•
•
•
••
•
•
•
•
••
••
••
•
• •
•
•
•
•
•
••
•
•
•
•
•
•
••
•
•
•
•
• •
• •
•
•
•
•
• ••
•
•
•
••
•
••
•• •
••
• •
• •••
•
••• •
•
• ••
••
••• •••
• ••
•
•
••
••
•
••
•
•
•
•
•
•••
•
•
•
••
••
•
•
•
•••
•
•
••
••
•
•
•
• ••
•
•
•
•
••
••
•
•
•
•
•
•
•
•
•
•
•••
•
•
•
•
•••
•
•
•
•
•••
••
••
•
•• •
••
••
•
•
•
•
•••
••
••
••
•
••
•••
•
•
•
•
•
•
•
•
••
••
•
•
•
••
••
•
••
•
••• •
•
•
•
• •
•
•••
•
•••
•
•••
•
••
•••
•
•
••
•• •
•
•
•
•
••
•
•
•
••••
• •
••
•••••
•
• ••
•
•
•
•
••
••
•
•
••
•• •
•
•
•
••
•
•
•
•
••
••
•••
• •
•
•••••
••
•
•
•
•
•
••
••
•
••
•
•
•
•• •
••
••
•
•••
•
• •
••
••
•
•
•••
•
•• •
• ••
•
•• ••
•
•
••
• ••
••
•
•
•
••
•
•
••
••
•
•
•• •••
•••
•
•• ••
•
•
•••
•
• •
•
•
••••
•• •
•• •
•
• ••
•••
••
•
•••
•••
•
•
•
• ••
••
•
•
•
•
•
••
•
•••
•
•
•
•••
•
••
•
•
•
••
•
•
•
•
•
•
•
••
•
•
•
••
•
•
•
•
•
••
••
••
•••
•
•
•
••
•
•
•••
••
•
•
•
••
••
••••
••
•••••••
•
••••
••
•••
••••
••••
•
•••
•
•
•••
••••
••
•
•
••
••••••
•••••
•
•••
••
••••
•
•
••
•
•
•
•
••
•
•
•
•
•
•
••
•• •
•
•
•
•••
•
••
•• •
•
••
•
•
•
••
•
••
•
••
••
•
•
•
•
•
••
••
•
•
••
••
••
•
•
•
••• •
•
•
••
•
•
•
•
•
•
•
•
•
•
•
•
•
•
•
•
•
•
•
•
•
•
••
• •
•
•
•••••
•
••
•
• •
•
•
•• •
•
•
•
••
•
•
•
•
•
•
•
•
•
• •
••••
•
••
••••••
•••
•
•••
•••
•
•
•
••
•
••••
•••
•
•
••
•
••••
••
•
•••
•
••
•
•
•
••
•• •
••• •
•••
•••
•
• •
••
•••
•••
•
• •
•
• •
••
••
•••
•••
••
•
•
•
•••
•
•
•
••
•
••
•••••
•
••
•
•
•
•
•
•
•
•
•
•
•
•
•
••
•
•
••••
•••
••
•• ••
•
•
•
• •
•• •
•
••
•
••
•
•
• •
••
•••
•
•
•
•
••
•
••
••••
••••
•
••
•
••• ••••
•• •
•••
•••
•
•• ••
•
• ••
••• •• •
•
••• •
•• •
•
••
•
•• •
•
•
•••
• •••
•
•
•• •• •
••
••
•••••
••
•••
•••••
•
•• ••
•
•••
•
•• •
•
••••
••
•••
••••
•
•
•
•
••
•• ••
•
••
•
••
••
•••
••
• •
••
•
•
• ••••
••
••
••
•
•
•
• ••
• ••
•
••
••••
••
• •
•
•
••••
••
•
•
••
• ••
•
•
• •• •
•
•••
••
•
•
•• •••
•
••
•
•
•
••••
••
•
•
•
••
•• •
• •••
•
•
•
• •
•
•
•
•
••••
•
•
•
•
•••
•
•
•
•••• •
•
•
••
••
•
•
•• •
••
•
•
••
•
•
••••••••
•
••
•
••
•
•
•
•
•
••
•
••
•
•
••••
•
•
••
•
•
••
••
•••
••
• ••
•••
•
• ••
••
• ••
•
••• ••
•
••
••
••
•
•••
••
•
••
•
••
•
•• •••
•
•
••
•
•
••
•
•• •
••
•
•
•
•
•• ••
•
•
•
•
••••
••
•
•
••
•
• ••
•
•
•
•
••
• •
•
•
•
•
•
•
•
•
•
•
••
•
••
•
•
••
••
•
• ••
•
•
••
•
•••
•
•
•
•
••••
•••
••
• ••
••
•
•
•
•
••
•••
•
•
•
•
•
••
•
••
••
••
•
•••
•
••
••
•
••
•• ••
•
•••••
•
•
•
•
•
•
••• •
••
•• ••
•
•••
•
•
• •••
•
••
•
••
•
•
•
•
•
•
• ••••
•
•
••
•••
•
•
•
••
••
•• •
•
•
••
••
•
•
•
•
• ••••••
•
•
••
••
• •
•
•
•••
••
•
•
•
••
••
•
• • •••
•
•
•
•
••
•
••
•
•
• ••
•
•
••
•••
•
•
•
•
•
••
•
••
•••
•
•
•
• •••
•
••
•
•
••
••••
•• •
•
•
•
•
••
•
•
••
••
••
•
•
••
•••
•
•
•
•
•
•
••
•
•
•• •••
•
•••
••
•
•
•
• ••
••• •••••
••••
••
• ••••
•••
••
• •
•• • •
• •
••• •
••
••
••
•••
••
••
•
••
•
••
••
•
•
•••
•
•
•• ••
•• ••
•••
••
•••
•
••
• ••
•
•••
•
••
•
•
••• •
•
••
•
••
••
•
• •• •
•
••
• ••
••
••
•
•••• •
•••
••
•
•
•
•
••
••
••
• •••
•••••
•
•••
••
•
•
•••
• ••
•
••
••
•
••
•• •••
• ••••••
••
•••
••
••
•
••••••
••
•
••••
•
•• ••
•
••
•
•
• ••
•••
••••
•
• •• •••
•
•
• ••
•
•
••
•
••
•
••
•
•
••
•
••
• •
••
••• •
••••
•• •
•••
•
••
•
•
•
••
••
••
••
•
•
••
•
• •
•
•
••
•••
••
•• •
••
•
• •• •
•
••
• •
•
•
•
•
•
•
••••
••
•
•
•
• •
••
•
•
•
•
•
••••
•••••
•
•••
•
•
•
•
••
•
• ••
•
••
•
•
••
•••
••••
•• •
••••
• ••• •
•
•
•••
•••••••
••
•
•
•••••
••••
•• ••••
•
•• •
••
•••
••
•••
• ••
•
•
•• • •
•
•
•
•
•
• •
•
•
••
•••
•
•
•
•
•
••
•
•
•
•
•
•
•
•
•
•
•
••
•
•
•
•
•
• ••
•
•
•
••
•
•
••
•
• •
•
•
•
• ••
•
•
•
•
•
•
•
•
•
•
•
•• •
•
•
•
•
•
•
•
•
•
•••
•
•
•
•
•
•
•
••
•
•
•
•
•
•
•
•
• •
••
••
•
•
•
•
•
•
•
•
••
•
•
•
•
•
•
•
•
•
• ••
•
•
•
•
•• •
••
•
•
•
•
• •
•
•
•
••
•
•
•
•
•
••
•
•
•
•
•
•
•
••
•
•
••
•
•
••
•
•
•
• •
•
•
•• •
•
•
• •
•
•
•
••
•
•
•
•
••
•
•
•
•
•••••••••• •
•
•
•
•
•
•
• •
•
•
•
•
•
•
•
•
•
•
•
•
• ••
•
•
••
••
••
••
•
•••
••••
•
•
•••
•
•
•
•
••
•
••
•
•
•
•
••
•
•
•
•
•••
•
•
•
••
•
•
•
••
•
•
•
•
•
••
•
•
•
•
•
•
••
•••
•
•
•
•
•
•
•
•
•
•
•
•
•
•
• •
••
•
•••
•
•
•
•
•
•
•
••
••
•
••
•
••
•
•
•
•
•
•
•
•
•
•
•
•
•
•
•
•
•
•
•
• ••
•
•
•
•
•
••
•
•
•
•
•
•
••
•
•
•
•
•
• •
•
•
••
•
•
•
••
•
•
•
••
•••
•
•
•
•
••
•
•
•
•
•
•• ••
•
••
•
•
••
••
••••
•
•
•
•
•
•
•
•
•
••
••
•
•
•• •
• •
•
•••
•• •••
•
••
•
• ••
•••
•
••
••
•••
•
••
•
•
••
••
•
••
•
•
•
•
•
•
••
•
•
•
•
•
•
• ••
•
••
•
•
•
•
•••
•
•
•••
• ••
•
•
••
•
••
•
•
••
•
•
•
•
•
•
•
•
•
••
•
•
•
•••••••
•
•
•
•
•
••
•
•• ••
•
•
••••
•
•••
•
••••
••••••
••
•••
•
•
••
•
••
••
• •••
••
••
•••
•• ••
• •
•
•••••
••••
••
• •••
•
••
••
•••
• ••
•
•• •
•• ••
•
•
••
•• ••
••
•
•••••
• •
•
•••
•••
•
• •
•
••
•
•
•
•
•
••
••
••
•
•
•
••
••
•
•
•
•
•
•
•
••
•
••
••••
•
•• •
•••
•••
••
•
••
•
•
••
••
•••
••
••
•
•
••
•
••
••
••
••
•
• •
•
•
•
••
•
••
••
••
•
• •••
•
•
••
••
••
••
•••
•
•• •
•
•
• ••
•
•
•
•• •••••
•
•
•
•••
•
•••
••
•
••
•
•
••
•
••
•
•••
•
••••
•••
•••••
•
••
•
•
•
•••• •••
•
•
•
•
••••
• ••
•
• ••
•
•
•• •••
••
•••
• ••••
•
••
•
•
•
••••
•
• •
•
•
•
•
•
•
•
•
•
•
•
•
•
•
•
••
•
•••
•
•
•
•
•
•••
•
•
•
•
•
•
• •• ••
•
•
••
•
••
••
•
•
••
•
•
•
•
•
•
•
••
•
•••
••
•
•
•
•
••
•
••
•
•
• •
••
•
•
•
••
••
•
•
•
•
•
•
•
• •
•
•
•• •• •
•
•
•
•
•••
• •
•
•
•
• ••
•
•
••
•
••
••
•
• •
••
•
• •
••
•
••
••
•
•••
•
•
••
•••
•
•
•
•
•
• ••
•
•
•
•• •
•
•
•
••
•
•••••
••
• ••
•
••
• •
•
•
•••
•
•
••
•
•
•
•
•
• •
•
• •
•
•
•
•
•
•
•
•••
•
•
••
•
•
•
•
•••
• ••
••
•
••
•
••••
•
•••
•
•
••
••
•
•
Stat 4066 (Spring 2008) Spatial Statistics Topics overview 12 / 24

Meteorology and Climatology
Stat 4066 (Spring 2008) Spatial Statistics Topics overview 13 / 24

Agriculture: Pollen Disspersal
–data collected by S. A. Goggi (ISU, Department of Agronomy) and herteam, in 2003 and 2004
Stat 4066 (Spring 2008) Spatial Statistics Topics overview 14 / 24

Agriculture: Pollen Disspersal
Stat 4066 (Spring 2008) Spatial Statistics Topics overview 15 / 24
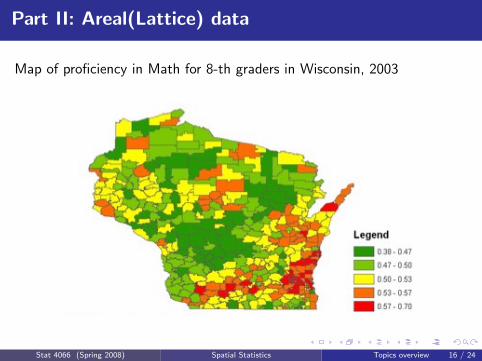
Part II: Areal(Lattice) data
Map of proficiency in Math for 8-th graders in Wisconsin, 2003
Stat 4066 (Spring 2008) Spatial Statistics Topics overview 16 / 24

Spatial distribution of herbivorous mites
Consider a situation in which the attribute variable of interest correspondsto small counts on a spatial grid. Such a situation is represented by astudy of the spatial distribution of herbivorous mites (Hairston, N.G., Hill,R.W. and Ritte, U. (1971). The interpretation of aggregation patterns, InPatil, G., Pielou, E.C. and Waters, W.E., eds., Statistical Ecology Volume1: Spatial Patterns and Statistical Distributions, the Pennsylvania StateUniversity Press, University Park, Pennsylvania.).
Data were collected from an 8× 8× 1 inch piece of old field habitat, fromwhich mites were extracted and recorded as from one of 64 quadratsdefined by a two-dimensional 1× 1 inch grid place over the exposedsurface of the sampled habitat.
Stat 4066 (Spring 2008) Spatial Statistics Topics overview 17 / 24
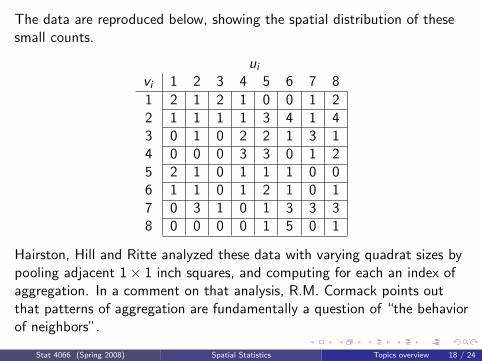
The data are reproduced below, showing the spatial distribution of thesesmall counts.
ui
vi 1 2 3 4 5 6 7 8
1 2 1 2 1 0 0 1 22 1 1 1 1 3 4 1 43 0 1 0 2 2 1 3 14 0 0 0 3 3 0 1 25 2 1 0 1 1 1 0 06 1 1 0 1 2 1 0 17 0 3 1 0 1 3 3 38 0 0 0 0 1 5 0 1
Hairston, Hill and Ritte analyzed these data with varying quadrat sizes bypooling adjacent 1× 1 inch squares, and computing for each an index ofaggregation. In a comment on that analysis, R.M. Cormack points outthat patterns of aggregation are fundamentally a question of “the behaviorof neighbors”.
Stat 4066 (Spring 2008) Spatial Statistics Topics overview 18 / 24

Part III: Point Patterns
Plant Pathology–Infection in Papaya:(data and images courtesy of Paul Esker)
–due to phytoplasmas (phytoplasma are microorganisms that are notculturable (i.e., they cannot be grown on agar media), however, they cancause devastating effects in crops).
Stat 4066 (Spring 2008) Spatial Statistics Topics overview 19 / 24

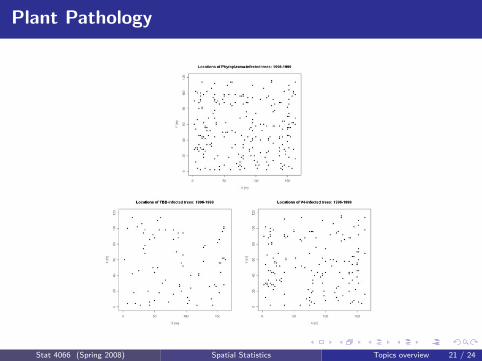
Plant Pathology
This data was collected by Anna Padovan and Karen Gibb from CharlesDarwin University (Darwin, Northern Territories, Australia), in conjunctionwith Forrest W. Nutter, Jr., Department of Plant Pathology (Iowa StateUniversity) in the the Northern Territories of Australia. Plants wereexamined monthly and those suspected of being infected had samplestaken for further testing to verify if the plant was infected. The use ofmolecular tools was used and results indicated that two dominantphytoplasma types were found: TBB (tomato big bud) and SPLL-V4(sweet potato little leaf V4). These two pathogens are genetically similarto the yellow crinkle disease and based on the genetic makeup are in thefaba bean phyllody. At the end of the 3-year study period, there were atotal of 230 infected papaya (this includes both TBB and SPLL-V4). Ofthat, 76 were TBB while 154 were V4. This is approximately 6.2% of thetotal plants in the plantation. From these 3 plots, it appears that theremay be something interesting spatially, especially when examining allinfected trees or the V4-infected trees.
Stat 4066 (Spring 2008) Spatial Statistics Topics overview 20 / 24
Plant Pathology
Stat 4066 (Spring 2008) Spatial Statistics Topics overview 21 / 24
Ecology
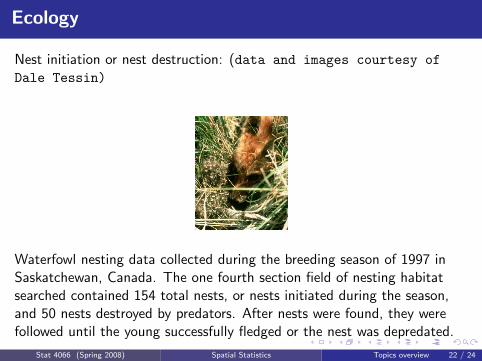
Nest initiation or nest destruction: (data and images courtesy ofDale Tessin)
Waterfowl nesting data collected during the breeding season of 1997 inSaskatchewan, Canada. The one fourth section field of nesting habitatsearched contained 154 total nests, or nests initiated during the season,and 50 nests destroyed by predators. After nests were found, they werefollowed until the young successfully fledged or the nest was depredated.
Stat 4066 (Spring 2008) Spatial Statistics Topics overview 22 / 24

Ecology
This is a habitat map for the field, where greens represent grasslandnesting habitat and blues represent open water. Both the black and yellowdots represent nest locations (black: initiation, yellow: depredated).
Stat 4066 (Spring 2008) Spatial Statistics Topics overview 23 / 24

Ecology
Stat 4066 (Spring 2008) Spatial Statistics Topics overview 24 / 24