staple food self-sufficiency and the...
TRANSCRIPT

RICHARD H. GOLDMAN\)
STAPLE FOOD SELF-SUFFICIENCY
AND THE DISTRIBUTIVE
IMPACT OF MALAYSIAN RICE POLICYf
Few nations of the world rely as exclusively as Malaysia upon a single staple food to satisfy caloric requirements.1 Even among rice consuming nations, Malaysia's position is unusual. According to estimates for the period 1956--61, 86 percent of Malaysia's starchy staple food calories were derived from rice (73, p. 75). Perhaps more striking is the degree to which Malaysia has depended upon the world market to provide this food. In 1956, for instance, on the eve of Malaysia's independence from Great Britain, the country imported 45 percent of its rice.
A basic strength of the Malaysian economy is its advantage in producing primary products such as rubber, tin, and palm oil compared to rice, which, historically, has been imported from less afHuent neighboring countries. However, specialization in the production of commodities for export and the consequent heavy dependence upon imported rice have engendered anxiety among Malaysian policy makers, even early in the colonial period. In the past century, during some periods of shortage in the world rice market, Malaysia found it difficult to obtain adequate rice supplies, despite abundant foreign exchange reserves. More frequently, government officials have either endured the public outcry resulting from high rice prices or agonized over the large and unforeseen costs to the treasury of subsidizing domestic consumers.
The Colonial Era witnessed a continual debate among officials concerning the need to channel public funds into drainage and irrigation of paddy land. In fact, relatively little investment took place, and in its stead were cultivation restrictions
.. The author is Institute Associate, Harvard Institute for International Development, and Lecturer in the Department of Economics. He was formerly Lecturer in the School of Comparative Social Science, Universiti Sains Malaysia.
t The author wishes to thank Walter Falcon, P. Haridas, William o. Jones, Cik Khatija Ahmad, Basil Moore, Scott Pearson, and Donald Snodgrass for very useful discussions about Malaysian rice policy and for helpful comments on an earlier draft.
1 Malaysia, as used in this essay, refers to West or Peninsular Malaysia and does not include discussion of the Borneo states of Sarawak and Sabah which joined the Federation in 1963. The Borneo states, whose population comprises about 15 percent of the Malaysian total, are relatively minor rice producers; the grain, however, is an important element in the diet of consumers. Singapore, which is not now a member of Malaysia, but which was associated during the British period, is omitted from the post-World War II discussion, in order to insure comparability of data.
252 RICHARD H. GOLDMAN
and a good deal of rhetoric. In the late 1950s, however, the character of Malaysia's rice policy changed considerably. Immediately following independence in 1957, the country embarked on an ambitious drive to achieve self-sufficiency in rice production.
By 1971 only 13 percent of domestic requirements came from foreign sources. Local rice production in the 1971-72 crop year was slightly in excess of one million tons, 60 percent above the production level ten years previously. The off-season crop, which in 1962 accounted for only 5 percent of local output, increased its share to 40 percent by the 1971-72 crop year and Malaysia was second only to the Philippines in the proportion of its paddy area planted with high-yielding varieties.
This "Green Revolution" has required heavy investment. During the period of the first three development plans, 1956-70, U.S.$161 million was spent on drainage and irrigation projects, almost entirely for the improvement or reclamation of paddy land. Expenditure on drainage and irrigation during the First Malaysia Plan, 1966-70, represented 36 percent of total public expenditure on agricultural development.
This investment provided the technological, but perhaps not all the economic, preconditions for the rapid spread of double-cropping and the adoption of new varieties. The package of incentives was made complete by a policy that consistently maintained the domestic rice price at a premium over the world market. Between 1965 and 1972, the Malaysian wholesale price of Thai 100 percent rice stood at an average premium, net of marketing costs, of 17 percent above the c.i.f. level. Moreover, this margin was reflected, in large part, at the farm gate. During the last three years of that period, just prior to the leap in world rice prices, the premium averaged 26 percent. In addition to protection at the border, irrigation rates were heavily subsidized, and the government was a buyer of last resort of paddy varieties whose tariff-protected market price fell below the target support level.
Malaysia is representative of a number of rice-importing Asian countries that are attempting to attain self-sufficiency through adoption of modern agricultural inputs and infrastructure. Although this strategy may result in inefficient resource allocation when viewed from the national and, particularly, the Southeast Asian regional perspective, simple arguments about comparative advantage which ignore uncertainty do not win policy debates in these countries. The historical experience of these importing nations in Asia's unstable and fragmented rice markets has engendered an extreme skepticism regarding the wisdom of relying heavily on imported supplies.
It can be argued, however, that there are more efficient ways to assure a nation's rice supply than a policy of self-sufficiency. Ultimately, to evaluate the economics of Malaysia's self-sufficiency policy, one must understand the country's equity and distributive goals.
The next section of this paper summarizes briefly the early development of rice policy during the colonial period prior to World War II. Rice emerged as a "political crop" not only because of its strategic importance in consumption but also because its production is almost exclusively identified with the Malay com-

MALAYSIAN RICE POLlCY 253
TABLE I.-POPULATION: MALAY STATES
Area (sq. mi.) 1835a 1874b 1891" 1911" 1931"
Perak (7,980) 35,000 40-60,000 214,250 494,060 765,990 Selangor (3,166) 12,000 6-12,000 81,590 294,030 533,200 Negri
Sembilan (2,565) 27,000 40-50,000 65,220 130,200 233,800 Pahang (13,873) 40,000 30-50,000 57,450 118,710 180,110 Johore (7,330~ 25,000 180,000 505,311 Kedah (3,660 50,000d 246,000 429,691 Pedis (310) 32,000 49,296 Kelantan (5,750) 50,000 286,300 362,517 Trengganu (5,027) 31,000 154,000 179,789
a Data from Zahara Hj. Mahmud, "The Period and Nature of 'Traditional' Settlement in the Malay Peninsula," lournal of the Malay Branch of the Royal Asiatic Society, Pt. 2, 1970.
b Data from J. de V. Allen, "Malayan Civil Service, 1874-1941: Colonial Bureaucracy/Malayan Elite," paper presented at International Conference of Asian History, Kuala Lumpur, Aug. 5-10,1968.
"Data from J. de V. Allen (op. cit.); Rupert Emerson, Malaysia: A Study in Direct and Indirect Rule (Kuala Lumpur, 1937); Lim Teck Ghce, "Peasant Agriculture in Colonial Malaya: Its Development in Perak, Selangor, Negri Sembilan, and Pahang, 1874-1941," (unpub. Ph.D. diss., Australian National Dniv., 1971).
d Estimated at 100,000 at time of Siamese invasion, 1921, when about half moved to Province Wellesley. In the 1840s there was an influx of population into Kedah following restoration of the Sultan.
munity.2 The economic and political forces in the post-World War II period culminated in the decision to push toward self-sufficiency. Further sections contain an economic analysis of the self-sufficiency process, exploring first the forces behind the dramatic increase in Malaysian rice production from 1957-73. Next, an attempt is made to measure the effect of Malaysia's implicit tariff on rice prices, including its gross impact on Malaysian consumption and its contribution to the rate of self-sufficiency. An evaluation is then offered of the efficacy of Malaysia's rice policy with respect to stated policy goals, including the contribution to saving foreign exchange, stabilizing domestic rice prices, and, particularly, redistributing income. The paper concludes with a brief discussion of recent (1974-75) and likely future directions of Malaysian rice policy.
PRIOR TO WORLD WAR II
A century ago the name "Malaya" denoted a geographical entity rather than an area of concentrated settlement, let alone one organized into a single state.a
For this reason the origins of rice policy in Malaysia coincide largely with the development of significant rice cultivation.
Evidence of the sparseness of settlement in the 19th century is contained in Table 1 (see also Map 1 for location of states). These population estimates are
2 The ethnic composition of Malaysia's population is an important factor in the nation's political economy. The Malay community, which in 1970 comprised about one-half of the nation's population, considers Malaysia its homeland (although many Malays are descendents of rather recent migrants from Sumatra and Thailand). The large influx of Chinese and Indians commenced near the end of the 19th century.
3 See (40), which is available from the author for a detailed account of the development of Malaysian rice policy from the 19th century to 1945.

254 RICHARD H. GOLDMAN
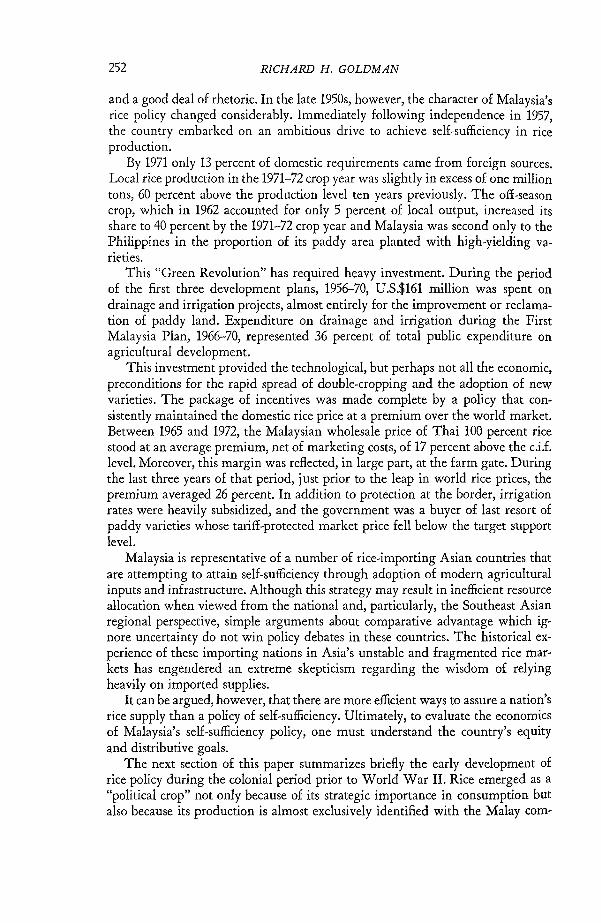
MAP I.-WEsT MALAYSIA, STATES AND PADDy-GROWING AREAS
Sungei Manik Irrigation Project
Traditional paddy-growing areas: •
Major drainage and irrigation project: : ..... .......
Kemubu
PAHANG
crude for the 19th century, but, nevertheless, they provide a valid idea of the diffuse settlement as well as the extremely rapid population growth which began in the latter part of the century.
Although the British had established three mercantile settlements on the coast (Penang-Province Wellesley, Malacca, and Singapore), the Peninsula was not an important world source of primary commodities prior to 1850. An additional reason for the sparce habitation was the lack of appropriate land resources for supporting a large rice-producing population. Malaya, unlike Burma and Thai-

MALAYSIAN RICE POLICY 255
land, does not possess great alluvial plains. Instead, the rivers of the Peninsula are rather short, and much of the west coastal region is dominated by thin clay soils underlain by deep peat. Only in the northwest states of Kedah and Perlis do there exist flat alluvial plains possessing easily drained clay soils. The northeast state of Kelantan's main river delta also possesses a natural rice-growing environment, but this area has a rolling topography and is exposed to severe northeast monsoon weather.
In the 19th century, the northern states possessed a large Malay population, descended from the Pat ani region of southern Thailand, which was organized around the production of wet paddy. The southern states were thinly populated by Malay communities comprising new immigrants from the Celebes, Borneo, and Sumatra. These communities cultivated swamp and irrigated paddy but generally relied upon dry land, rainfed cultivation for most of their crop.4 The traditional economy of these states depended on forest products and small-scale tin mining. As mining and cash cropping opportunities expanded in the late 19th and early 20th centuries, specialization in non-rice growing activities began to occur, much to the dismay of colonial officials and some members of the Malay aristocracy, who attempted to maintain rice production in the face of increasing opportunity costs to cultivators."
The British acquired suzerainty on a state-by-state basis. Between 1874 and 1888 the British established their "residency" system in Perak, Selangor, Negri Sembilan, and Pahang, the states with major tin deposits. In 1896 these states were organized into a political and economic structure known as the Federated Malay States (FMS). The remaining northern states of Kedah, Perlis, Kelantan, and Trengganu remained outside the British sphere until 1909, and in the south, Johore did not become a British protectorate until 1914. These states were known collectively as the Vnfederated Malay States (VMS).
In the FMS there was rapid economic expansion following the establishment of British rule. Revenue from tin exports was utilized to construct roads and railroads. Largely as a result of this infrastructure, the rubber boom, commencing at the turn of the century, had its greatest impact on the FMS and Johore, which benefited from its proximity to Singapore and the fact that it lay astride the Singapore-FMS rail and road link. In addition to Johore, only Kedah of the VMS benefited from the economic expansion of the colonial period. Though Kedah did not benefit directly from the expenditure of revenues generated in the FMS, it gained wealth from rice exports and the production from rubber estates located in its southern districts. Kelantan and Trengganu remained geographically isolated (the east coast rail link was not completed until 1931) and undeveloped throughout the colonial period. This uneven regional economic development became an important issue in forming rice policy in the post-Independence period.
Between 1874 and 1891, the population in the FMS increased by an astonishing 243 percent, as immigrants from southern China and Sumatra streamed in to
4 See (49) and (97) for an excellent discussion of the early development of rice cultivation on the Peninsula.
G Lim Tech Ghee presents an interesting analysis of the interplay between restriction and the tendency toward cash cropping (63). The increasing tendency for Malays to take wage employment on plantations and on other rubber farms also caused concern. See footnote 9 for further information on this point.
256 RICHARD H. GOLDMAN
take advantage of opportunities in tin, sugar, and coffee production. The population continued to grow during the first three decades of this century when the immigration of Chinese and Indonesians was supplemented by Indians who came to work on rubber estates and as laborers with the Public Works Department.
By 1890 rice imports into Selangor, Perak, Negri Sembilan, and Pahang constituted at least 35 percent of total imports (40, p. 15). This dependence fostered a concern on the part of many colonial officials and an interest in stimulating local production. As a consequence, in 1899 the Krian drainage and irrigation project, located on the northern coast of Perak, was initiated. It was completed in 1906 at an expense of Malaysian (M)$1.6 million and accounted for about half the total paddy area in the FMS.
Although the Krian Scheme represents the beginning of large public investment in paddy land infrastructure, the turn of the century witnessed a lively and protracted debate among colonial officials over the justification for increasing public expenditure on rice production." These early debates reveal the nature of the conflict out of which Malayan rice policy was born. The increasing wealth flowing into Malaya resulting from the comparative advantage in the production of rubber and tin compelled the government to follow an export-oriented strategy. Yet, as exports and non-rice producing immigrants increased, so also did the government's exposure to political risk, resulting from shrinking export markets or from foreign crop failures. Defining a rice policy and committing resources to increasing local rice production were made difficult by the need to spend scarce public revenue on the infrastructural requirements of the tin and rubber sectors and by the normal availability of cheap rice from the rapidly expanding supplies of nearby Burma and Siam. As a consequence, almost 30 years elapsed after the Krian project before another major drainage and irrigation project was undertaken in the FMS.7
Although the government was unwilling to allocate resources to a comprehensive irrigation policy, official concern and insecurity over rice imports continued. Between 1901 and 1921, the population in the FMS almost doubled as rubber production swept the western states, attracting large numbers of adult male immigrants. Rice imports, which between 1911 and 1916 contributed 82 percent of domestic requirements, soared.
In light of the government's desire for more local production of rice and its unwillingness to commit public resources to achieve the goal, rice policy was characterized largely by exhortation and rhetoric. It was supplemented by attempts to restrict the number of alternative opportunities available to rice growers through legislation and administrative policies regarding land alienation and through differential quit rents. The enormous response of Malay smallholders to opportunities in rubber growing after 1910, particularly in the boom years 1915-17, was met with increasing attempts by the government to thwart what was generally regarded as a flight out of rice and into rubber.
Attempts to restrict the transfer of resources into new uses was an aspect of
e Good discussions of the development of irrigation policy are in (63,83,84). 7 During this period, the only important investment in paddy land infrastructure took place in
Kedah, financed from state revenues. The extent and nature of this investment are virtually undocumented.
MALAYSIAN RICE POLICY 257
a developing paternalistic concern by the British to "protect" the Malay community from the impoverishment thought certain to befall it resulting from an inability to cope with the complexity and instability of capitalist expansion coupled with the superior commercial instincts of the immigrant population. Rice was the only crop produced almost exclusively by the Malay community. Although the restrictionist policy was motivated by a legitimate, though perhaps misplaced, concern for the welfare of Malay cultivators, this concern was in part an ideological veil over self-serving attempts to increase local rice production and to insure a more secure and cheaper food supply for the mining and plantation industries.s The policy was implemented in a rather haphazard fashion and can hardly be considered to have been an effective measure in reducing Malaya's extreme reliance upon the world rice market.9
The first major rice crisis occurred in 1918. Burma reduced rice exports to Malaya by 12 percent because of crop failure in British India, of which it was then a part. The crisis worsened in 1919 when Burmese exports fell by 50 percent and Siam (upon which Malaya depended for 66 percent of its imported supplies) prohibited rice exports because of drought. Malayan authorities attempted to arrange preferential allotments from Burma with their compatriots in India, but to no avail.
At the end of 1919, food control was introduced for the first time in Malaya, and the FMS government took over commercial stocks and arranged imports. Control lasted until February 1921, during which time the government subsidized the sale of imported rice to consumers. The total cost of this intervention in British Malaya (including the Straits Settlements, FMS, and UMS) was estimated at M$48 million, of which 50 percent was attributed to the FMS (63, p. 131).
The experience of this crisis heightened anxiety over dependence on foreign suppliers but did not result in an increasing commitment of resources to local rice production. In the latter half of the 1920s, British Malaya as a whole was importing about 75 percent of domestic consumption requirements.
Fundamental changes in Malaysian rice policy took place during the Great Depression of the early 1930s, resulting in increasing public investment in drainage and irrigation. Between 1929-31, export receipts fell by 65 percent. Unemployment was widespread and repatriation of immigrant workers commenced. Conditions worsened until 1934 when rubber prices began to recover following the introduction of the International Rubber Regulation Agreement. In addition, the period witnessed increased public concern with the welfare of the Malay community, whose demographic representation had fallen to 50 percent by 1931.
In 1930, the worst of the depression years in Malaya, the Rice Cultivation Committee was appointed, chaired by the Director of Agriculture of the FMS who was a strong advocate of expanded local rice production. The committee's most im-
8 Interesting, though by no m~ans conclusive, evaluations of this policy ar~ found in (2) and (63). 9 Rubber and rice compete for the same labor resources but not generally for the same land. Th~
evid~nce indicates that incr~asingly large numbers of Malays (not only those of Indonesian origin who immigrated specifically to participate in the economic ~xpansion) were attracted to cash cropping and estate employment (63). How~ver, the ric~ cultivation techniques of this ~arly period were more land than labor intensive, with labor for many tasks being supplied traditionally by wom~n. The extent of c?mpetition between paddy and cash cropping is, therefore, uncl~ar, particularly since most of th~ nc~ on the Peninsula (over 60 p~rc~nt) was produced in the north~rn UMS where other cash crops w~r~ of less importance.
258 RICHARD H. GOLDMAN
portant recommendation was that a separate drainage and irrigation department be organized to survey and develop large-scale rice projects (17). In 1932 the Straits Settlements and FMS Drainage and Irrigation Department was established. Due to the constitutional structure of British Malaya, the UMS, in which most of the productive paddy land was located, lay outside the jurisdiction of the Drainage and Irrigation Department. As a result, the department confined its development activities largely to reclaiming uncolonized peat swamps in Selangor and Perak, rather than to improving the natural and already colonized paddy lands in North Malaya.
In 1932 the department undertook construction of the Sungei Manik Scheme on coastal and riverine alluvial land in lower Perak. The 17,000 acres were brought into cultivation in four stages that continued (after interruption during World War II) into the 1950s. During the 1930s the department also commenced drainage of the Panchang Bedina and Tanjong Karang peat swamps of coastal Selangor. This work was completed in 1952. The 49,000-acre Irrigation Scheme in Tanjong Karang, where no rice was cultivated prior to 1932, today accounts for virtually all the rice acreage in the state of Selangor and about 10 percent of total Malaysian production.
In 1939 the Drainage and Irrigation Department, according to its own estimates, had provided some degree of water control to 68 percent of the wet rice area in the FMS and the Straits Settlements (63, p. 215).10 This investment, however, appears to have contributed little to overall Malayan production. In these states, average wet rice output increased by only 3 percent between 1932-35 and 1935-38. All of this increase is attributable to improvement in yield as acreage increases in some states were offset by declines in others. By contrast, the moderate increase in total Malayan wet paddy production registered during the 1930s was the result, primarily, of increases in both acreage and yield in Kedah and Kelantan, which lay outside the department's jurisdiction (although Kedah did receive advisory assistance).11 The Japanese occupation interrupted this expansion of drainage and irrigation activities in Malaya and the facilities constructed earlier fell into disrepair.
THE POST-WAR RECOVERY AND THE ORIGINS OF A NEW RICE POLICY, 1946-57
Rice policy in the years between World War II and the attainment of Independence in 1957 was characterized by the familiar pre-war pattern of intense colonial concern and frustration over dependence on the world market combined with a conservative allocation of public resources to paddy land infrastructure. Indeed, prior to Independence public investment in drainage and irrigation was more or less confined to reconstructing facilities damaged during the war and fulfilling drainage and irrigation plans, primarily in Selangor, Perak, and Negri Sembilan, which were adopted in the 1930s (49).
Immediately following the war, the rice trade in Southeast Asia was admin-
10 "Wet rice" includes all paddy except for the small portion grown on hillsides rather than under irrigated conditions or in rainfed swamps or catchments.
11 Kedah possessed substantial state revenues in its own right. By 1929 an estimated M$1.25 million had been spent on controlled drainage, and these facilities were reputed to be the best in British Malaya (17, p. 9).
MALAYSIAN RICE POLlCY 259
istered by the International Food Committee, which attempted to ration short supplies among importing countries (46, pp. 88-89). Malayan authorities established a purchase monopoly over a portion of the domestic crop. During this period an estimated 50 percent of rice supplies in Malaya were marketed through illegal channels (85). Beginning in 1946, the government offered a guaranteed minimum price to rice farmers in order to attract additional supplies. The price was set at the expected market price level, which was invariably underestimated by a substantial margin. For instance, the initial offer in 1946 was M$4.40 per picul (133 pounds). By the end of the year the government was offering M$20. In 1947 the government maintained its M$20 offer while market prices ranged as high as M$30 per pieul (31).
At the end of 1949, international control was withdrawn from rice, and in the following year the Malayan Government ended its compulsory sale program, although it continued to offer a guaranteed price to producers. By 1949 market prices were considerably below their immediate post-war peak, reflecting the recovery of production in both the traditional exporting countries and in Malaya.
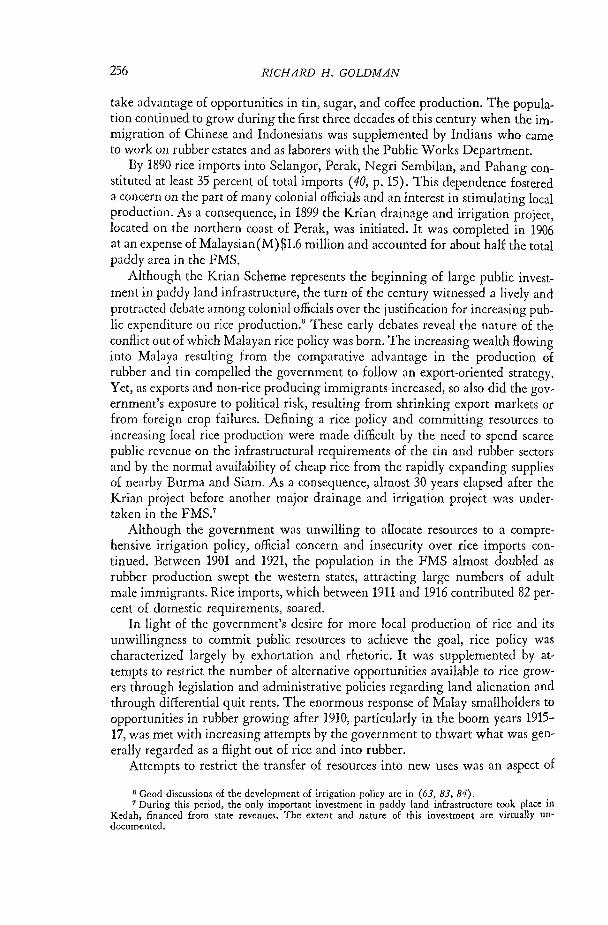
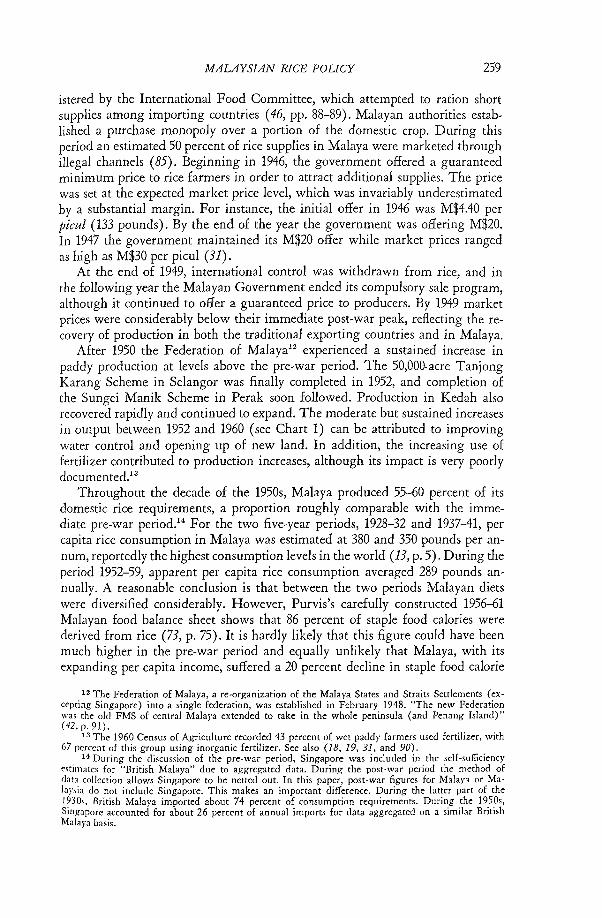
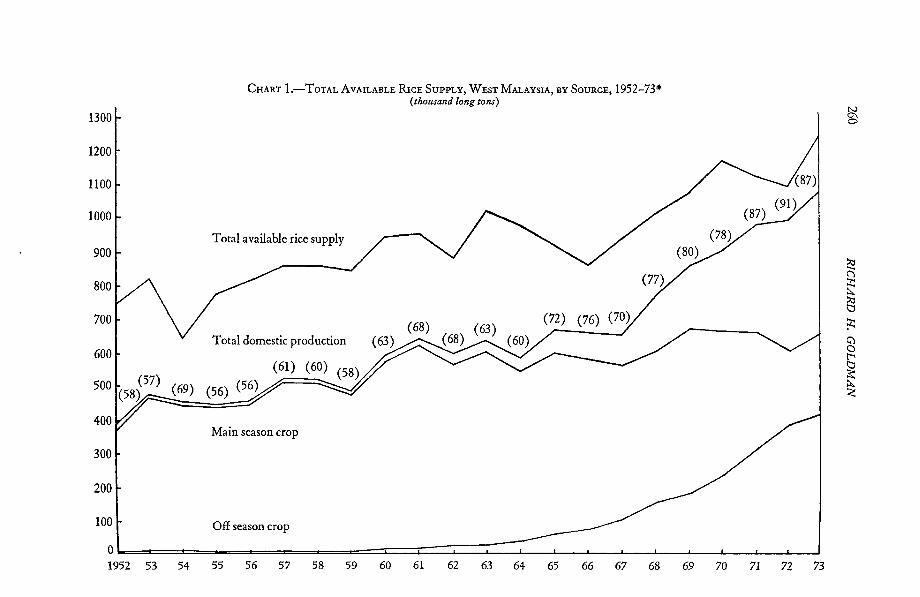
After 1950 the Federation of Malaya12 experienced a sustained increase in paddy production at levels above the pre-war period. The 50,000-acre Tanjong Karang Scheme in Selangor was finally completed in 1952, and completion of the Sungei Manik Scheme in Perak soon followed. Production in Kedah also recovered rapidly and continued to expand. The moderate but sustained increases in output between 1952 and 1960 (see Chart 1) can be attributed to improving water control and opening up of new land. In addition, the increasing use of fertilizer contributed to production increases, although its impact is very poorly documented.13
Throughout the decade of the 1950s, Malaya produced 55-60 percent of its domestic rice requirements, a proportion roughly comparable with the immediate pre-war period.14 For the two five-year periods, 1928-32 and 1937-41, per capita rice consumption in Malaya was estimated at 380 and 350 pounds per annum, reportedly the highest consumption levels in the world (13, p. 5). During the period 1952-59, apparent per capita rice consumption averaged 289 pounds annually. A reasonable conclusion is that between the two periods Malayan diets were diversified considerably. However, Purvis's carefully constructed 1956-61 Malayan food balance sheet shows that 86 percent of staple food calories were derived from rice (73, p. 75). It is hardly likely that this figure could have been much higher in the pre-war period and equally unlikely that Malaya, with its expanding per capita income, suffered a 20 percent decline in staple food calorie
12 The Federation of Malaya, a re-organization of the Malaya States and Straits Settlements (excepting Singapore) into a single federation, was established in February 1948. "The new Federation was the old FMS of central Malaya extended to take in the whole peninsula (and Penang Island)" (42, p. 91).
13 The 1960 Census of Agriculture recorded 43 percent of wet paddy farmers used fertilizer, with 67 percent of this group using inorganic fertilizer. See also (18,19,31, and 90).
14 During the discussion of the pre-war period, Singapore was included in the self-sufficiency c,timatcs for "British Malaya" due to aggregated data. During the post-war period the method of data collection allows Singapore to be netted out. In this paper, post-war figures for Malaya or Malaysia do not include Singapore. This makes an important difference. During the latter part of the 1930s, British Malaya imported about 74 percent of consumption requirements. During the 1950s, Singapore accounted for about 26 percent of annual imports for data aggregated on a similar British Malaya basis.
1300
1200
1100
1000
900
800
700
600
300
200
100
CHART I.-TOTAL AVAILABLE RICE SUPPLY, WEST MALAYSIA, BY SOURCE, 1952-73* (thot/sand long tons)
Total available rice supply
Total domestic production
(69) (56) (56)
(61) (60) (58)
Main season crop
Off season crop
O~======~========~==~=Z==~~==~~~ __ ~~ __ ~~ __ ~~~ 1952 53 54 55 56 57 58 59 60 61 62 63 64 65 66 67 68 69 70 71 72 73

MALAYSIAN RICE POLlCY 261
intake.1G It is probable that there are sizable errors in estimates of supplies. During the 1930s the domestic production estimates were probably less reliable than the import statistics, and Malaya may have been even more dependent on the world market in the pre-war period than records indicate. On the other hand, during the 1950s and 1960s, although production estimates improved/6 the import figures are certain to contain errors, since smuggling was induced by the establishment of protection in Malaysia and an export tax on rice in Thailand which forced domestic prices in Thailand substantially below the Malaysian market level.
Whatever the true degree of dependence, production gains made during the 1950s were not sufficient to mollify anxious officials. As world prices began to rise in 1952 and the domestic crop faltered, the Department of Agriculture warned, "The Federation can no longer be certain of importing all rice required" (31). A Rice Production Committee was formed "to consider ways and means whereby the acreage planted under padi in the Federation and the yield per acre can be materially increased within the next three years" (18, p. 1). The committee's Report, issued in 1953, contained a series of moderate recommendations regarding fertilizer subsidies, varietal research, data collection, Drainage and Irrigation Department staffing, and rent controls. The Report singled out double-cropping as a promising means of increasing output. Significantly, however, the committee did not recommend a large increase in investment in drainage and irrigation, but rather "further investigation of this [double-cropping] subject."
The political and economic forces partially responsible for the dramatic increase in public investment in rice production following Independence were first manifested in 1955 in a clash over the role of the government's Guaranteed Minimum Price (GMP). Since the end of the war this price had been adjusted annually, or more often, to correspond with world market conditions. Purchases had been made to support the GMP only in 1952-53 (14). At the end of 1954, as world prices fell rapidly in response to large stocks in Burma and Thailand, the GMP was adjusted from U.S.$5.67 per picul to U.S.$4.00. This change occurred on the eve of the first democratic elections of members to the state and federal legislative councils.17
The drastic adjustment of the GMP triggered a sharp response from local members of the Federal Legislative Council. A resolution of censure was introduced and passed in January 1955, as the rice price rapidly became an election issue. The vote of censure established the Rice Committee to investigate price support and other "measures which are necessary to assure an economic return on the padi cultivator."
The emphasis of the Final Report of the Rice Committee (1956), as in earlier reports, was on fertilizer subsidies, varietal research, farm size and credit, and marketing institutions. The report, however, did encourage investment in irrigation facilities for double-cropping and the development of new land for rice or
15 Purvis's cross-s~ction estimate of quantity elasticity was .004, with a quality elasticity for ric~ of .273 (73, p. 263). Time-s~ries ~stimates indicate an incom~ elasticity of .2 or higher (6).
16 The accuracy of production estimates was ~nhanced by mor~ systematic and statistically valid crop-cutting survey techniques, plus the increasing share of acreage under drainage and irrigation department supervision.
17 Independence followed in 1957. Prior to 1955, Malayan members of these councils were appointed.
262 RICHARD H. GOLDMAN
alternative crops. The report supported those who wished to use the GMP for more than procurement of strategic reserves but advised against using government intervention to maintain long-run producer prices above the world price level (19).
Events, however, had largely overtaken the committee. The democratically elected Legislative Council raised the GMP to U.S.$4.67 in the 1955-56 season and then to U.S.$5.00. "The consumer of rice in Malaya," announced the Minister of Finance in December 1955, "may have to give up something in the form of a fall in the cost of living he might otherwise enjoy in order to help shelter the Malayan padi grower from the hardship and depression which would otherwise fall upon him if there was a severe fall in the world market price for rice" (57, p. 366) .18
The commitment to a support price for paddy was only a small part of a fundamental change in the Malayan Government's economic development strategy and its philosophy regarding public finance and the general problem of enhancing rural incomes. As Independence approached, budget priorities began increasingly to reflect the interests of the rural smallholder, rather than those of the estate and urban sectors.
The fact that 58 percent of the Malayan population lived in rural areas in 1957 was reinforced by the disproportionate influence of the Malay community, 81 percent of whom were rural dwellers, in the political process. Although the Malay population comprised 49 percent of the total (Chinese, 37 percent; Indians, 11 percent) in 1957, they accounted for over 80 percent of registered voters in the 1955 elections. The first elected Federal Legislative Council included 34 Malays in a total of 52 elected members (42, p. 118) .19 As Ness reports in his study of government organization and rural development in Malaysia, "Almost immediately upon taking control of the Legislative Council in 1955, the indigenous leaders began to emphasize new goals in their budget speeches .... The new indigenous government planned deficits for every year from 1956 through 1960 to stimulate development through public investment" (71, pp. 91,93).
The major portion of this investment, which was accelerated in the 1960s, was in subsidies to smallholders for new planting and replanting rubber, land colonization projects for rubber and palm oil production, and the development of education and health facilities. In addition, the new priorities resulted in policies which revolutionized Malaysian rice production.
Following Malaysia's Proclamation of Independence in 1957/0 the new nation's titular monarch announced publicly the official decision to pursue the goal of complete self-sufficiency in rice production (14). The 1958-60 Triennial Report ot the Drainage and Irrigation Department states;
18 See the section on per capita consumption, protection, and sclf-sufficiency for a detailed analysis of the protective nature or the mechanism employed to finance the new GMP.
19 In the 1959 elections, the first following Independence, the number or registered Chinese voters increased rourfold. The Malay community, however, retained its political hegemony.
20 This new nation was known as the Federation of Malaya until 1963, when Singapore, Sabah, and Sarawak joined and the Federation or Malaysia was formed. Singapore withdrew in 1965. The analysis in the post-World War II section or this paper deals only with West Malaysia, the old Federation or Malaya. A large proportion or paddy in the Borneo States is produced by shifting cultivation techniques, and quantity estimates are subject to large errors. Until very recently there has been little effective public policy or investment regarding rice in these states.
MALAYSIAN RICE POLICY 263
The policy of the Minister for Agriculture is, briefly, to attain self-sufficiency in all foods including rice .... The department's irrigation planning had hitherto been concentrated on developing new land for rice cultivation and, although this objective is still important, it is only so against the background of the development of an economic farm unit. Government's target for farmer family income is M$300 [U.S.$100] per month. This figure cannot be achieved on any land by single-cropping rice by traditional methods of rice farming alone. More intensive use must be made of the land and the area of the family unit (now 3-5 acres or less) must be increased.
At the time of its inauguration, the self-sufficiency policy was seen as facilitating at least three major goals: reducing the risk attached to dependence upon the world market; saving foreign exchange; and increasing the welfare of the Malay paddy farmers, the latter a reflection of the new development priorities of the first post-Independence government. This policy will be evaluated with respect to these goals below, but the exclusive relationship between rice production and the Malay community deserves further mention here.
In 1957, 96 percent of all rice farmers enumerated by the Population Census were Malays. As shown in Table 2, these farmers were concentrated in the northern and eastern states of Perlis, Kedah, Kelantan, and Trengganu. The relative income position of paddy farmers is suggested by their predominance in the poorest states of the federation. Additional evidence is provided by Silcock who estimated that in 1957 the Malay community's per capita income was 63 percent of the national average (86, p. 279). More direct evidence is provided by a number of household surveys (32, 70, 72, 78, 79, 80, 81). These surveys, carried out by the Ministry of Agriculture in the latter part of the 1960s, revealed that single-crop rice farmers earned a net income (including own consumption) of about U.S.$100 from that activity and had an average annual total income of from U.S.$200 to U.S.$233. The Malaysian average family income in 1967, assuming a family of 5.5 members, was about U.S.$1,267 (87, p. 4).
The growing political influence of paddy farmers, exemplified by their success in the fight over the GMP, was enhanced by the results of the general election of 1959 when both Kelantan and Trengganu states returned governments controlled by the opposition Pan Malayan Islamic Party. This event reinforced the federal government's commitment to its rural development strategy.
DOUBLE·CROPPING AND THE DRIVE TOWARD SELF· SUFFICIENCY
Evidence of the success of the self-sufficiency policy is provided in Chart 1. In 1957, the year of Independence, West Malaysia produced only 61 percent of domestic rice requirements. By 1972 the share of local production had increased to 91 percent. These figures exaggerate the actual degree of self-sufficiency because they do not include rice smuggled into Malaysia from Thailand (see footnote 28). Nevertheless, Malaysia's production gains have been substantial. The moderate gain in self-sufficiency prior to 1960 is attributable to expanding area and improving yields in the main-season crop. From 1961 to 1968, however, neither main-season area nor yield shows a sustained upward trend and total production was more or less constant (32, 77).
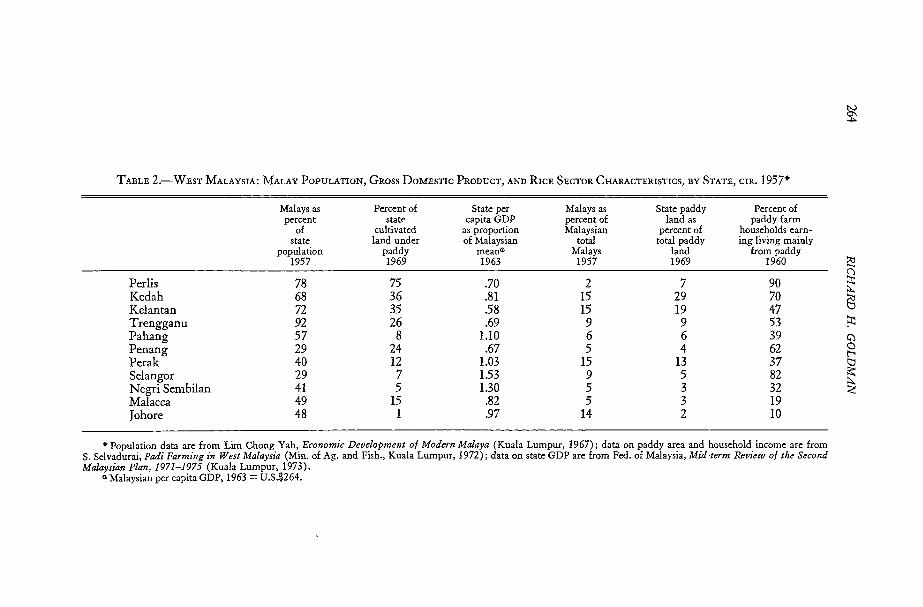
TABLE 2.-WEST MALAYSIA: MALAY POPULATION, GROSS DOMESTIC PRODUCT, AND RICE SECTOR CHARACTERISTICS, BY STATE, CIR. 1957*
Malays as Percent of State per Malays as State paddy Percent of percent state capita GDP percent of land as paddy farm
of cultivated as proportion Malaysian percent of households earn-state land under of Malaysian total total paddy ing living mainly
population paddy mean" Malays land from paddy 1957 1969 1963 1957 1969 1960
Perlis 78 75 .70 2 7 90 Kedah 68 36 .81 15 29 70 Kelantan 72 35 .58 15 19 47 Trengganu 92 26 .69 9 9 53 Pahang 57 8 1.10 6 6 39 Penang 29 24 .67 5 4 62 Perak 40 12 1.03 15 13 37 Selangor 29 7 1.53 9 5 82 Negri Sembilan 41 5 1.30 5 3 32 Malacca 49 15 .82 5 3 19 Johore 48 1 .97 14 2 10
.. Population data are from Lim Chong Yah, Economic Development of Modern Malaya (Kuala Lumpur, 1967); data on paddy area and household income are from S. Selvadurai, Padi Farming in West Malaysia (Min. of Ag. and Fish., Kuala Lumpur, 1972); data on state GDP are from Fed. of Malaysia, Mid-term Review of the Second Malaysian Plan, 1971-1975 (Kuala Lumpur, 1973).
"Malaysian per capita GDP, 1963 = U.S.$264.
!:I::I --() ::r:: ::... Eg ;:t: c;) 0 t-t tl
~ <;
MALAYSIAN RICE POLICY 265
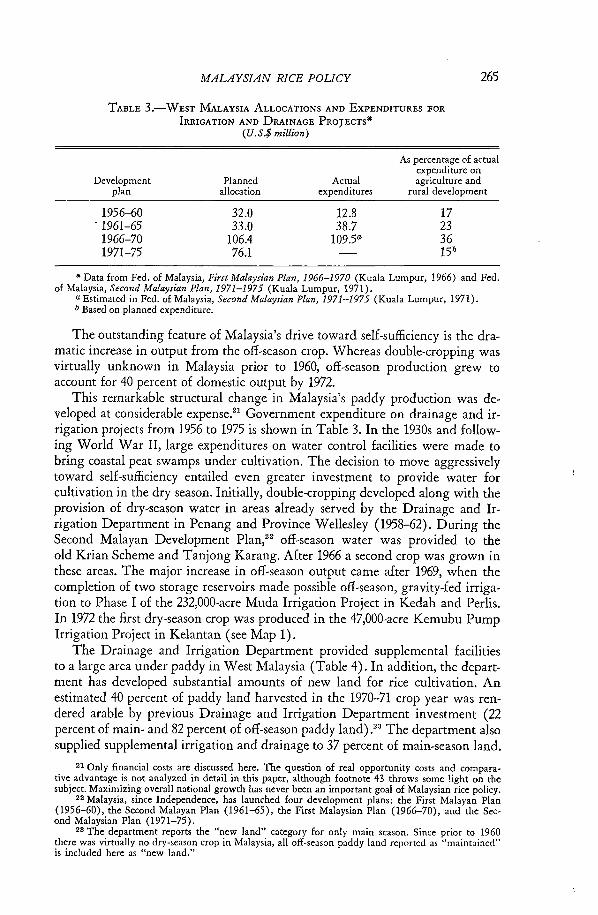
TABLE 3.-WEST MALAYSIA ALLOCATIONS AND EXPENDITURES FOR
IRRIGATION AND DRAINAGE PROJECTS· (U.S.$ million)
As percentage of actual expenditure on
Development Planned Actual agriculture and plan allocation expenditures rural development
1956-60 32.0 12.8 17 - 1961-65 33.0 38.7 23
1966-70 106.4 109.5a 36 1971-75 76.1 15b
• Data from Fed. of Malaysia, First Malaysian Plan, 1966-1970 (Kuala Lumpur, 1966) and Fed. of Malaysia, Second Malaysian Plan, 1971-1975 (Kuala Lumpur, 1971).
a Estimated in Fed. of Malaysia, Second Malaysian Plan, 1971-1975 (Kuala Lumpur, 1971). b Based on planned expenditure.
The outstanding feature of Malaysia's drive toward self-sufficiency is the dramatic increase in output from the off-season crop. Whereas double-cropping was virtually unknown in Malaysia prior to 1960, off-season production grew to account for 40 percent of domestic output by 1972.
This remarkable structural change in Malaysia's paddy production was developed at considerable expense.21 Government expenditure on drainage and irrigation projects from 1956 to 1975 is shown in Table 3. In the 1930s and following World War II, large expenditures on water control facilities were made to bring coastal peat swamps under cultivation. The decision to move aggressively toward self-sufficiency entailed even greater investment to provide water for cultivation in the dry season. Initially, double-cropping developed along with the provision of dry-season water in areas already served by the Drainage and Irrigation Department in Penang and Province Wellesley (1958-62). During the Second Malayan Development Plan,22 off-season water was provided to the old Krian Scheme and Tanjong Karang. After 1966 a second crop was grown in these areas. The major increase in off-season output came after 1969, when the completion of two storage reservoirs made possible off-season, gravity-fed irrigation to Phase I of the 232,000-acre Muda Irrigation Project in Kedah and Perlis. In 1972 the first dry-season crop was produced in the 47,000-acre Kemubu Pump Irrigation Project in Kelantan (see Map 1).
The Drainage and Irrigation Department provided supplemental facilities to a large area under paddy in West Malaysia (Table 4). In addition, the department has developed substantial amounts of new land for rice cultivation. An estimated 40 percent of paddy land harvested in the 1970-71 crop year was rendered arable by previous Drainage and Irrigation Department investment (22 percent of main- and 82 percent of off-season paddy land).23 The department also supplied supplemental irrigation and drainage to 37 percent of main-season land.
21 Only financial costs are discussed here. The question of real opportunity costs and comparative advantage is not analyzed in detail in this paper, although footnote 43 throws some light on the subject_ Maximizing overall national growth has never been an important goal of Malaysian rice policy.
22 Malaysia, since Independence, has launched four development plans: the First Malayan Plan (1956-60), the Second Malayan Plan (1961-65), the First Malaysian Plan (1966-70), and the Second Malaysian Plan (1971-75),
28 The department reports the "new land" category for only main season. Since prior to 1960 there was virtually no dry·season crop in Malaysia, all off-season paddy land reported as "maintained" is included here as "new land."

266 RICl-IARD H. GOLDMAN
TABLE 4.-WEST MALAYSIA: ESTIMATE OF NEW PADDY LAND DEVELOPED BY DRAINAGE AND IRRIGATION DEPARTMENT, TOTAL AND BY SEASON, 1970-71*
Harvest area on new paddy Total land developed by Drainage
harvested paddy area and Irrigation Departmenta (acres) (acres)
State Main season Off season Main season Off season
Johore 9,920 4,430 3,738b 3,031 Kedah 292,370 144,900 23,604 88,761 Kelantan 165,970 17,730 500 16,746 Malacca 27,470 3,800 7,595 3,697 Negri Sembilan 23,380 10,330 6,482 8,800 Pahang 12,520 4,940 12,5200 1,369 Penang 38,420 37,210 4,004 31,456 Perak 118,880 82,360 68,254 79,947 Pedis 65,630 27,500 10,431 27,500d
Selangor 50,600 49,210 49,941 b 49,210d
Trengganu 70,580 10,300 4,415 10,296 Total 875,740 392,710 191,484 320,836
.. Total area from Min. ot Agri. and Fish., Paddy Statistics, WeJt Malaysia (Kuala Lumpur, various years); Drainage and Irrigation Department area from Ministry of Agriculture and Cooperatives, Min. of Agri. and Co-operatives, Triennial Report of tile Drainage and Irrigation Division (Kuala Lumpur, various years).
a This is an estimate of paddy land rendered cultivable as a result of Drainage and Irrigation Department investment (i.e., the result of major non-supplemental works). In the case of the main season, the Drainage and Irrigation Department reports "additional land ma,1c available as a result of Scheme." The main season figures represent the cumulative total of that additional land since 1932. In cases when the reported total planted area on Drainage and Irrigation Department maintained land was less than the cumulative additional land figure, the total planted area figure was used. In the case of the off season, the Drainage and Irrigation Department reports harvested area on paddy land maintained by the Drainage and Irrigation Department. Since prior to 1960 there was almost no off-season crop in Malaysia, all of this off-season land reported as maintained by the Drainage and Irrigation Department is interpreted here as "additional land made available as a result of scheme." In cases where the total harvested off-season area as reported in (32) is less than the total reported on the Drainage and Irrigation Department land, the smaller figure is utilized. The figures on total harvested area reported in (32) arc collected by the Department of Statistics and Ministry of Agriculture. They are considered more reliable than those reported by the Drainage and Irrigation Department in (36).
b Total Drainage and Irrigation Department planted area (incl. supplemental). See note above. e Harvest area reporteu in (32). (The Drainage anu Irrigation Department reported figure is
25,800) . d Total harvested area reported in (32). Sec note above.
Five factors contributed to the rapid increase in double-cropping in West Malaysia: World Bank funding; good project management; availability of quickmaturing, high-yielding, marketable rice varieties; rapid adoption of new varieties by farmers; and substantial price distortions in both product and input markets, resulting in heavy producer subsidies. An important portion of the expenditure from 1966 to 1975 shown in Table 4 was financed by the World Bank. Public expenditure on the Muda Project in Kedah and Perlis amounted to U.S.$76 million, 40 percent of which was financed by the World Bank. An additional loan of U.S.$10 million assisted in the provision of off-season water to the Kemubu Scheme in Kelantan. These two projects, which involve about 72,000 farmers and 60 percent of Malaysia's dry-season paddy land, accounted for the bulk of the increase in double-cropping after 1969.21
21 Both projects arc developing in stages, with full production expected in 1975 or 1976.
MALAYSIAN RICE POLlCY 267
The implementation of large water resources projects in developing countries is often plagued by gross inefficiency, resulting in investment gestation periods far in excess of expectations.2v These difficulties have not been experienced by the Mucia Irrigation Project, supervised by the Malaysian-managed Muda Agricultural Development Authority. The project involved construction of two large dams and storage reservoirs, 62 miles of main irrigation canals, an internal distribution system to carry water to 232,000 acres of dry-season paddy land, a tidal barrage, and numerous access roads. Construction commenced in April 1966. By the end of 1969, the dams and reservoirs were completed, and 90 percent of the main canals and 60 percent of the distribution system were finished. The first dryseason crop was planted on about 100,000 acres, and by 1974, 90 percent of the planned area was fully double-cropped. The Kemubu project has not been so successful. It is, however, only one fifth of Muda's size.
Most traditional paddy varieties grown in Malaysia do not mature quickly enough to permit harvesting two crops a year. A 1966 pre-project survey of the Muda area showed only 1.8 percent of farmers growing short-term (less than 140 days) varieties (33). The small amount of double-cropping that was practiced prior to 1965 involved production of a quick-maturing Taiwanese variety, the consistency of which was too starchy for the Malaysian market.
The success of Malaysia's double-cropping strategy must be largely attributed to the development of marketable, quick-maturing varieties, although many of the better known varieties developed at the International Rice Research Institute (IRRI) such as IR-8, 20, and 22, have not been successful. Their cooking quality is often poor, resulting in substantial market discounts, and in large areas of Malaysia, particularly in the reclaimed peat swamps, rice is grown in water too deep for the very short varieties. In addition, the short-stalked varieties are expensive and difficult to harvest without mechanized equipment. However, a number of quick-maturing varieties have appeared successfully since 1964. The most popular and productive are Mashuri (a cross between Taichung 65 and a traditional variety, Mayang Eboss 60) and IR-5 (locally called Bahagia) , which is taller than most IRRI varieties. In addition there is a great proliferation of fast-maturing varieties that have been informally bred in farmers' fields and carried away from experimental plots.20
In virtually every area where the new varieties and the provision of dry-season water present an opportunity to increase net returns to the farm enterprise, the double-cropping activity has been adopted with minimal delay. Significant resistance has occurred only in areas where the second paddy crop displaced a higher valued activity. These instances are rare and include tobacco production in parts of the Kemubu Scheme and cultivation of vegetables in areas of Tanjong Karang and southern Perak.
The magnitude of this response is testimony to the Malaysian rice farmer's ability to evaluate and adjust to a changing economic environment. The incentive to which he responds results, however, not only from improvements in physical productivity, but also from subsidies in both input and product markets. The
2" Sec (91) for an interesting discussion of this problem. 20 Information about paddy varieties was obtained largely from conversations with Chew Boon
Hock, Plant Breeder and Rice Coordinator, Rice Research Centre, BlImhong Lima, Malaysia. Malaysian consumers prefer a long, translucent grain. An amylose content of abollt 25 percent results in the preferred consistency.
268 RICHARD H. GOLDMAN
most important subsidy element in the input markets is the artificially low water rate charged to farmers. In the Muda Scheme area, for instance, farmers pay a yearly water rate of M$8.40 per acre, whereas the annual administrative and maintenance costs alone were calculated by the Drainage and Irrigation Department to be M$24 per acre.27 Water rates and current costs vary depending on the vintage and complexity of the project, but the subsidy element is large throughout Malaysia.
Until August 1974, no fertilizer subsidy was paid in the major rice-growing areas of West Malaysia, although a limited quantity of subsidized fertilizer was available to farmers in "non-rice-bowl areas." In August 1974, however, all paddy farmers became eligible to obtain urea at a subsidized rate of M$10 per bag. The market price in January 1975 was M$16-18.
In addition to these input subsidies, the price of paddy is supported above the free market level by a complex support mechanism which is described in detail in the following section. Although this support price has an important income effect, its influence on the level of supply is unclear. No empirical estimate of paddy supply response is available. Although crops such as tobacco, sugarcane, and vegetables can be grown on some elevated alluvial soils, the alternative uses of most of Malaysia's paddy land are few and of low value due to environmental factors such as deep water conditions, marine clay, or highly acidic soils. Even in the controlled irrigation areas the water regime is not conducive to crops other than rice.
With respect to labor resources, in the early stages of the double-cropping program a significant portion of labor drawn into the second paddy crop was otherwise seasonally underemployed. However, the combination of double-cropping and the consequent strict time constraints on transplanting and harvesting has resulted in an increase in wages as workers have been bid away from alternative activities. In addition, the supply of labor available for paddy production may be decreasing as young male and female workers take full-time positions in the rapidly expanding light manufacturing sector in Kedah and Penang. It is generally felt in the Muda Scheme area, for instance, that agricultural labor markets have become increasingly tight as the scheme has expanded. The author's crude calculations from data collected by the Muda Agricultural Development Authority indicate that between 1971 and 1974 land rents in the scheme area increased by 50 percent compared with an 80 percent increase in harvest wage rates.
The production of rice is undoubtedly price responsive in Malaysia and perhaps increasingly so as variable human and chemical inputs playa greater part in the production of paddy. Nevertheless, the availability of short-term, highyielding varieties and the provision of drainage and irrigation for off-season cropping explain most of the remarkable recent increases in Malaysian rice production.
PER CAPITA CONSUMPTION, PROTECTION, AND SELF-SUFF1CIENCY
Malaysia's successful development of infrastructure and adoption of "Green Revolution" technology are impressive. Gains in production, however, have been the result of a broad strategy of import substitution aimed at both self-sufficiency
27 The rate was increased from M$6 to M$8.40 in January 1975. Current plans are to raise the water rate throughout the whole Muda area to M$15 by 1979.
MALAYSIAN RICE POLlCY
TABLE 5.-WEST MALAYSIA: SELF-SUFFICIENCY CHARACTERISTICS AND
PER CAPITA CONSUMPTION, 1952-71 *a
1952-56 1957-61 1962-66 1967-71
Total per capita consumptionb 288.8 297.8 269.4 263.4 Domestic sources 169.4 183.4 180.4 206.2 Imports 119.4 114.4 89.0 57.2
High quality 89.4 72.0 38.2 11.0 Low quality 30.0 42.4 50.8 46.2
Self-sufficiency rate 59.2 62.0 67.8 78.4
269
.. Data from Fed. of Malaysia, Dept. of Statistics, Monthly Bulletin of Statistics, West Malaysia and Peninsular Malaysia, Annual Statistics of External Trade (Kuala Lumpur, various years); Fed. of Malaysia, Min. of Agri. and Fish., Paddy Statistics, West Malaysia (Kuala Lumpur, various years); S. Selvadurai, Padi Farming in West Malaysia, Min. of Agri. and Fish. (Kuala Lumpur, 1972).
a Although inclusion of data from 1971-74 would be desirable here, the heavy accumulation of imported rice in government stocks in late 1973 and 1974 render the apparent consumption figures highly misleading (see footnote 28).
b Consumption figures given in annual average pounds per capita.
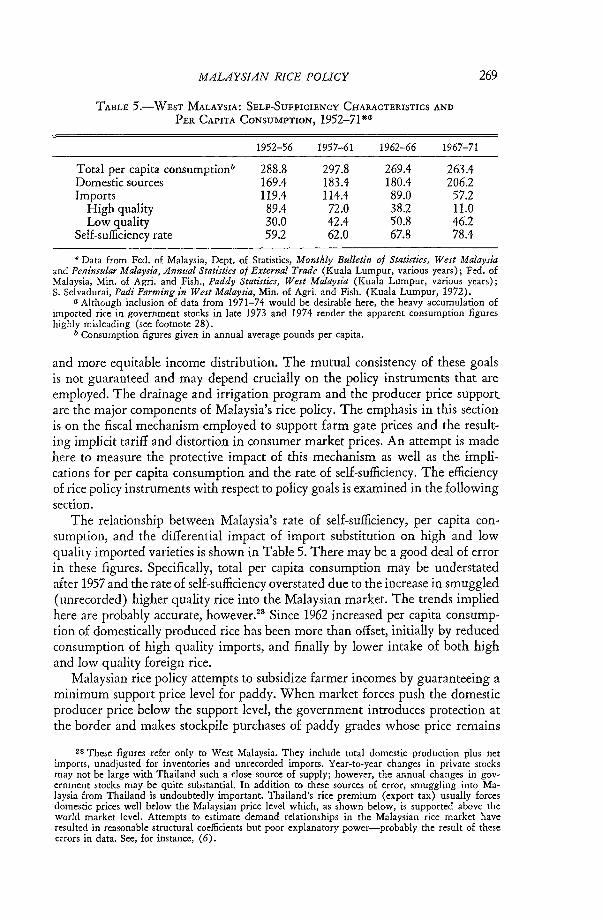
and more equitable income distribution. The mutual consistency of these goals is not guaranteed and may depend crucially on the policy instruments that are employed. The drainage and irrigation program and the producer price support;. are the major components of Malaysia's rice policy. The emphasis in this section is on the fiscal mechanism employed to support farm gate prices and the resulting implicit tariff and distortion in consumer market prices. An attempt is made here to measure the protective impact of this mechanism as well as the implications for per capita consumption and the rate of self-sufficiency. The efficiency of rice policy instruments with respect to policy goals is examined in the following section.
The relationship between Malaysia's rate of self-sufficiency, per capita consumption, and the differential impact of import substitution on high and low quality imported varieties is shown in Table 5. There may be a good deal of error in these figures. Specifically, total per capita consumption may be understated after 1957 and the rate of self-sufficiency overstated due to the increase in smuggled (unrecorded) higher quality rice into the Malaysian market. The trends implied here are probably accurate, however.28 Since 1962 increased per capita consumption of domestically produced rice has been more than offset, initially by reduced consumption of high quality imports, and finally by lower intake of both high and low quality foreign rice.
Malaysian rice policy attempts to subsidize farmer incomes by guaranteeing a minimum support price level for paddy. When market forces push the domestic producer price below the support level, the government introduces protection at the border and makes stockpile purchases of paddy grades whose price remains
28 These figures refer only to West Malaysia. They include total domestic production plus net imports, unadjusted for inventories and unrecorded imports. Year-to-year changes in private stocks may not be large with Thailand such a close source of supply; however, the annual changes in government stocks may be quite substantial. In addition to these sources of error, smuggling into Malaysia from Thailand is undoubtedly important. Thailand's rice premium (export tax) usually forces domestic prices well below the Malaysian price level which, as shown below, is supported above the world market level. Attempts to estimate demand relationships in the Malaysian rice market have resulted in reasonable structural coefficients but poor explanatory power-probably the result of these errors in data. See, for instance, (6).
270 RICHARD H. GOLDMAN
below the support level.20 The process of domestic rice price formation in Malaysia suggests that declining consumption may be largely explained by increasing world rice prices and/or increasing protection. In addition, even if during the period of investigation one observed no year-to-year changes in consumption, the mere existence of positive protection implies higher than world prices and lower than free market levels of consumption. An attempt is made in this section to develop evidence on the level of protection and on the differential impact of protection and world market forces on Malaysia's level of per capita consumption and degree of self-sufficiency.
Malaysia's use of protection policies rather than deficiency payments or stockpile sales at free market prices reveals an additional objective of Malaysian rice policy, that of minimizing cost to the government. Although the development of drainage, irrigation, and rice research is financed out of general revenues and debt, most of the support price mechanism is not. The National Padi and Rice Authority (LPN) is appropriated funds from general revenues to subsidize rice purchases made in defense of the support price levepo In order to reduce the volume of paddy offered for sale to the LPN and transfer most of the price support financing onto the consumer, the government introduces protection, which raises the market price of the nation's major staple food above the world level. This policy limits the government's loss but results in important distributive implications.
The difficulty in measuring the level of protection afforded rice in Malaysia derives from the fact that neither an ad valorem nor an explicit specific duty is charged. The government offers to purchase paddy from farmers at the GMP or rice from millers at the ex-mill GMP equivalent. Importers are required to purchase stockpile rice, in proportion to their imported quantities, at a price which is above the market wholesale price for stockpile quality rice. The resulting loss is equivalent to a tax imposed on imported rice. Rice imports are reduced until the domestic price rises to a premium above c.i.f. sufficient to cover normal marketing costs plus the government-induced loss. The process of substitution between domestic and imported rice varieties of similar quality operates to raise also the price of local rice. The result of this mechanism is an implicit specific duty on rice which varies with the importer's unit loss on stockpile purchases and with the proportion in which stockpile purchases are required relative to imports.81
20 The GMP offered to producers is M$16 per picu1 of paddy at the mill door. The GMP does not vary by variety, with the exception of a M$2 discount for all long-term varieties in the off season, regardless of market quality. Discounts are subtracted for all paddy for transport charges, moisture, and foreign matter content. Only those paddy grades whose protection supported market price is below the GMP are offered for sale to the government stockpile. In 1974 and 1975 the government, in order to build up stocks, purchased paddy in competition with private dealers at prices ranging from about M$25 to M$30 per picul depending on grade, although no formal long-term commitment has been made.
80 Prior to the establishment of the LPN in 1971, this support program was administered for a short time by the Federal Agriculture Marketing Authority (FAMA) and before that by the Supplies Division of the Ministry of Commerce and Industry.
81 The stockpile is intended primarily as a strategic reserve. An attempt is made to maintain the stockpile at a level equivalent to 4.6 pounds of rice per person per week for a period of three months (54). The actual inventory behavior of the stockpile is complex, however, because in addition to reserve requirements the stockpile absorbs purchases made in defense of the support price. The storage rules which underlie the movement of these additional stocks are unclear. In order to avoid losses the government relics on the importer purchase mechanism. During a period of falling world prices and/or when an outward shift occurs in the supply curve of rice grades requiring support (for example, 1965-66 and '1970-72 when large amounts of new off-season paddy acreage were brought under cultivation) it may be extremely difficult to settle on an import-stockpile purchase ratio which

MALAYSIAN RICE POLlCY 271
Abstracting from normal marketing charges and assuming a perfectly elastic supply of imports and importer-wholesaler services, a competitive market will shift the entire burden of the tax onto the consumer, so that
where
Pw = the equilibrium wholesale price of imported rice; Ru = the ratio of required stockpile purchases to imported rice; Pu = the government release price of stockpile rice;
P wu = the equilibrium wholesale price of stockpile rice; and
(1)
P w' = the wholesale equivalent c.i.f. price of imports (c.i.f. plus normal market costs ).
Equation (1) shows that the impact of Pw' on Pw is modified by the value of the implicit tariff, which is measured by the term Ru (Pu - PwU
). So long as Ru and Pu are positive and held constant, and assuming a positive cross-price elasticity between imported and stockpile varieties in the domestic market, the tariff bears an inverse relationship to Pw'. In other words, it operates as a variable levy. In fact, Ru and P u have not been held constant in Malaysia since they are the only variables in the price formation equation (in the absence of a quota) over which the government has direct control. Both Ru and Pu bear a positive relationship to the equilibrium whole price.82 The effect of this implicit tariff is captured in the difference between the border (c.i.f.) price of imported rice and the domestic price of the same quality rice, less appropriate normal marketing charges.
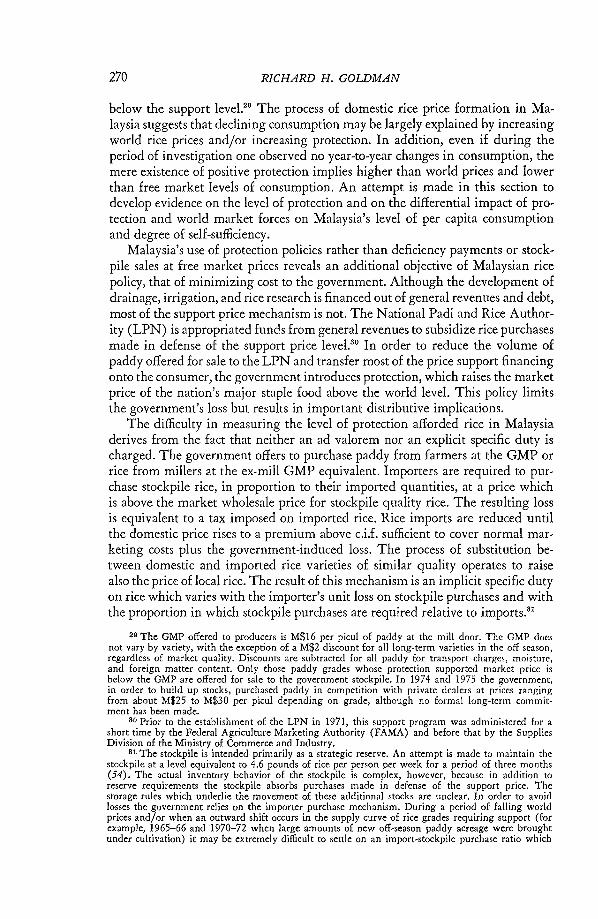
Historical price relationships in the Malaysian rice market are shown in Table 6. The domestic wholesale prices are recorded for particular grades of rice by the Department of Statistics (28). The actual c.i.f. prices of imported rice, however, are not available. Instead, proxies have been calculated in the form of unit values of various categories of imported rice from Malaysian trade statistics (29).
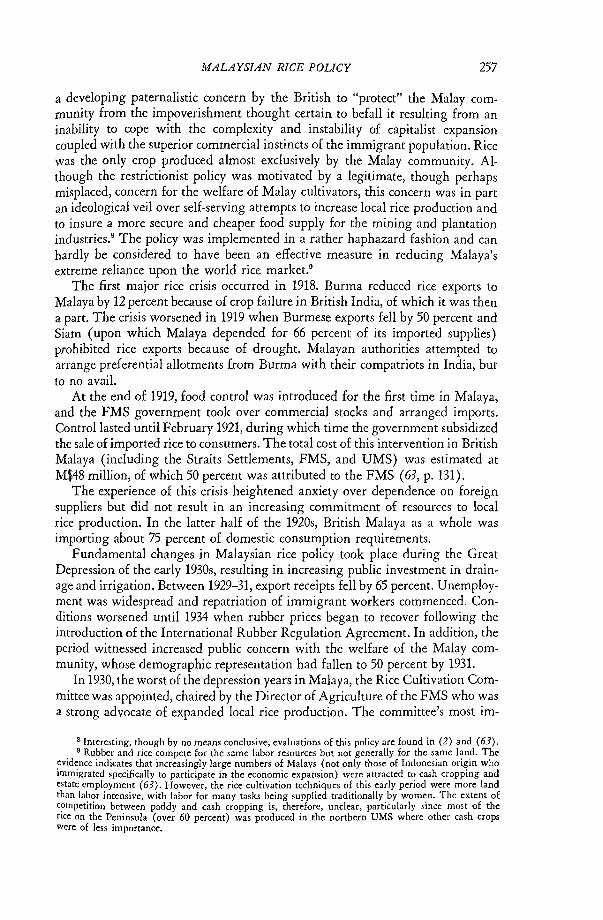
The wholesale-c.i.f. market margin for imported Thai 100 percent (whole milled) rice is shown in Chart 2. This margin includes four components: (1) the normal market charges involved in moving rice from the point of import to the wholesale market level; (2) measurement error resulting from matching the price of a quality of rice at wholesale level with one for a rice of different quality captured in the c.i.f. unit value; (3) the impact of quantitative restrictions from exporting countries; and (4) the impact of the implicit tariff mechanism and Malaysian direct quantitative restrictions.
Marketing costs are assumed to have been constant during the period 1955-72 due to Malaysia's stable price level and the apparent lack of important technical
affects the desired decumulation. In addition, administrative inertia and lack of market sophistication account for some of the inventory behavior of the stockpile.
Virtually no public information is available about year-to-year changes in the stock level. The Controller of Supplies once reported that between 1960 and 1964 the stockpile absorbed about 35 percent of yearly production, with annual variation ranging from 25 percent to 46 percent (54, p. 2). This does not represent net accumulation, however, since most of this rice was absorbed in order to facilitate stockpile turnover.
82 Since the establishment of the LPN in 1971, the government has relied increasingly on direct quantitative restrictions to effect protection. The more complex process described here was employed almost exclusively, however, during the period 1956-72 which is analyzed in detail in this paper. In 1975 the LPN was apparently using only its import licensing authority to restrict imports.
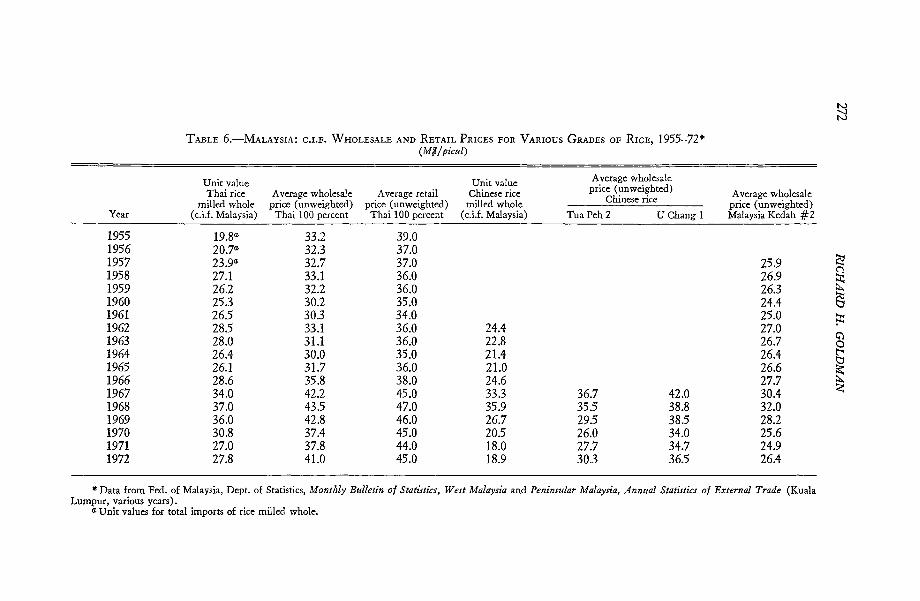
TABLE 6.-MALAYSIA: C.I.F. WHOLESALE AND RETAIL PRICES FOR VARIOUS GRADES OF RICE, 1955-72* (M$/picul)
Unit value Unit value Average wholesale
Thai rice Average wholesale Average retail Chinese rice price (unweighted) Average wholesale milled whole price (unweighted) price (unweighted) milled whole Chinese rice price (unweighted)
Year (c.i.f. Malaysia) Thai 100 percent Thai 100 percent (c.i.f. Malaysia) Tua Peh2 U Chang 1 Malaysia Kedah #2
1955 19.8'" 33.2 39.0 1956 20.7'" 323 37.0 1957 23.9'" 32.7 37.0 25.9 1958 27.1 33.1 36.0 26.9 1959 26.2 32.2 36.0 263 1960 25.3 30.2 35.0 24.4 1961 26.s 30.3 34.0 25.0 1962 28.s 33.1 36.0 24.4 27.0 1963 28.0 31.1 36.0 22.8 26.7 1964 26.4 30.0 35.0 21.4 26.4 1965 26.1 31.7 36.0 21.0 26.6 1966 28.6 35.8 38.0 24.6 27.7 1967 34.0 42.2 45.0 33.3 36.7 42.0 30.4 1968 37.0 43.s 47.0 35.9 35.s 38.8 32.0 1969 36.0 42.8 46.0 26.7 29.s 38.s 28.2 1970 30.8 37.4 45.0 20.s 26.0 34.0 25.6 1971 27.0 37.8 44.0 18.0 27.7 34.7 24.9 1972 27.8 41.0 45.0 18.9 30.3 36.s 26.4
• Data from Fed. of Malaysia, Dept. of Statistics, Monthly Bulletin of Statistics, West Malaysia and Peninsular Malaysia, Annual Statistics of External Trade (Kuala Lumpur, various years).
'" Unit values for total imports of rice milled whole.
N '-1 N
~
~ ~ ;t: ~ 0
b ~ <:

20
15
10
5
CHART 2.-MARKET MARGIN: THAI 100 PERCENT WHOLESALE - THAI MILLED WHOL!. C.1. F. (M$/picul)
O~--~--~--~----~--~--~--~~--~--~--~----~--~---L--~----~--~--~--~ 1955 56 57 58 59 60 61 62 63 64 65 66 67 68 69 70 71 72
.. Data from Fed. of Malaysia, Dept. of Statistics, Monthly BlIlletin of Statistics, West Malaysia (Kuala Lumpur, various years); Fed. of Malaysia, Dept. of Statistics, Peninsular Malaysia, Annual Statistics of External Tmde (Kuala Lumpur, various years); Fed. of Malaysia, Min. of Agri. and Fish., Paddy Statistics, West Malaysia (Kuala Lumpur, various years); S. SeJvadurai, Padi Farming in West Malaysia (Min. of Agri. and Fish., Kuala Lumpur, 1972).
~ t-< ~
~ s: <: ~ ~ tl:I '"\j 0 t: ~ "<:
274 RICHARD H. GOLDMAN
TABLE 7.-WEST MALAYSIA: DOMESTIC WHOLESALE PRICE CHANGE FROM
PREVIOUS YEAR PLUS BORDER PRICE AND TARIFF COMPONENTS*
(M$/picul)
Wholesale price c.i.f. price c.i.f. wholesale Year Thai 100 percent Thai whole-milled margin
1956 -0.9 +0.9 -1.8 1957 +0.4 +3.2 -Z.8 1958 +0.4 +3.Z -Z.8 1959 -0.9 -0.9 0 1960 -Z.O -0.9 -1.1 1961 +0.1 +1.2 -1.1 196Z +Z.8 +Z.O +0.8 1963 -Z.O -0.5 -1.5 1964 -1.1 -1.6 +0.5 1965 +1.7 -0.3 +Z.O 1966 +4.1 +Z.5 +1.6 1967 +6.4 +5.4 +1.0 1968 +1.3 +3.0 -1.7 1969 -0.7 -1.0 +0.3 1970 -5.4 -5.Z -0.2 1971 +0.4 -3.8 +4.Z 1972 +3.Z +0.8 +Z.4
• Calculated from Table 6.
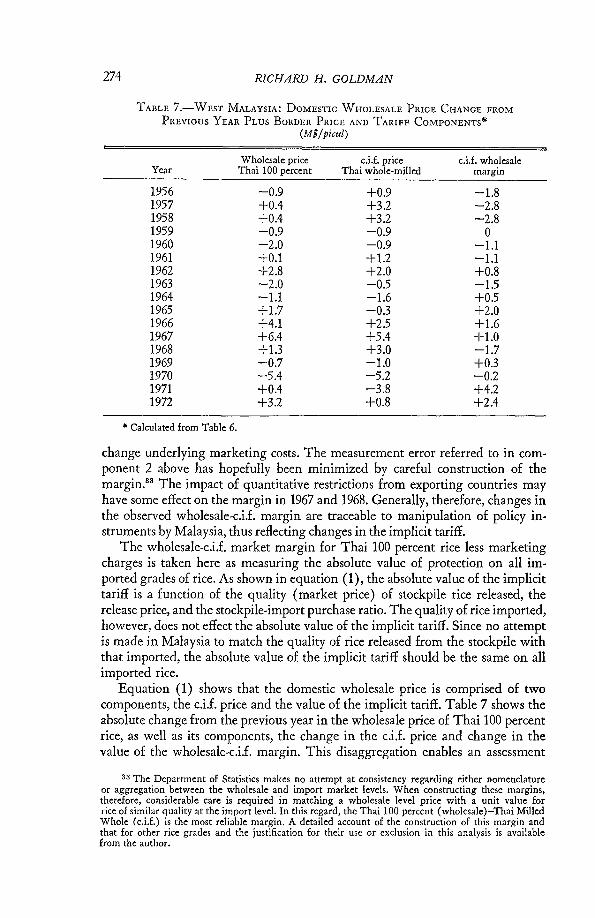
change underlying marketing costs. The measurement error referred to in component 2 above has hopefully been minimized by careful construction of the margin.s3 The impact of quantitative restrictions from exporting countries may have some effect on the margin in 1967 and 1968. Generally, therefore, changes in the observed wholesale-c.i.f. margin are traceable to manipulation of policy instruments by Malaysia, thus reflecting changes in the implicit tariff.
The wholesale-c.i.f. market margin for Thai 100 percent rice less marketing charges is taken here as measuring the absolute value of protection on all imported grades of rice. As shown in equation (1), the absolute value of the implicit tariff is a function of the quality (market price) of stockpile rice released, the release price, and the stockpile-import purchase ratio. The quality of rice imported, however, does not effect the absolute value of the implicit tariff. Since no attempt is made in Malaysia to match the quality of rice released from the stockpile with that imported, the absolute value of the implicit tariff should be the same on all imported rice.
Equation (1) shows that the domestic wholesale price is comprised of two components, the c.i.£. price and the value of the implicit tariff. Table 7 shows the absolute change from the previous year in the wholesale price of Thai 100 percent rice, as well as its components, the change in the c.i.£. price and change in the value of the wholesale-c.i.f. margin. This disaggregation enables an assessment
33 The Department of Statistics makes no attempt at consistency regarding either nomenclature or aggregation between the wholesale and import market levels. When constructing these margins, therefore, considerable care is required in matching a wholesale level price with a unit value for rice of similar quality at the import level. In this regard, the Thai 100 percent (wholesale)-Thai Milled Whole (c.i.f.) is the most reliable margin. A detailed account of the construction of this margin and that for other rice grades and the justification for their use or exclusion in this analysis is available from the author.

MALAYSIAN RICE POLICY 275
of the relative influence of world prices and changes in protection on domestic wholesale rice prices. Clearly in some years conditions in the world rice market have played an important part in discouraging domestic rice consumption. Only in those years when the change in protection was positive can the implicit tariff be said to have contributed to an observed decline in per capita consumption. If the declining trend in per capita rice consumption shown earlier in Table 5 is accurate, the role of the implicit tariff in this phenomenon may be significant since in recent years it has often reinforced increases and more than offset declines in the world price.
Although the tariff's influence on price variation is stabilizing in some years and destabilizing in others, in all years when protection was positive its effect was to raise the price level above its free market value. Hence, it is interesting to examine the extent to which per capita rice consumption would have increased had the implicit tariff's value been zero.
The level of protection will influence consumption only to the extent that price explains consumer demand. Econometric attempts to explain rice consumption in Malaysia have not been entirely successfu1.84 Estimates of price elasticity, however, have produced stable, plausible, and statistically significant results. The strongest estimates of average price elasticity of demand for rice in Malaysia are from Arromdee's work (6) which ranged from -0.35 (significant at 80 percent) to -0.46 (significant at 90 percent) for 1951-65. The author's own preliminary estimates for 1956-72 show a price elasticity of -0.40 (significant at 90 percent) .a5
The stability of these results is encouraging. In the calculations below, a price elasticity of -0.40 for both high and low quality rice is assumed.as
It is also necessary to estimate the absolute value of the tariff. The value of the implicit tariff from 1957 to 1972 is presented in column (1) of Table 8. This estimate is based on the assumption that normal import-wholesale marketing costs were constant at M$3.00 per picu1.37 The implicit tariff is positive in all years, although it was quite low in 1961, 1963, and 1964.
The estimated percentage changes of Thai 100 percent and Kedah #2 rice prices from their observed wholesale market level under an assumption of no tariff are shown in columns (4) and (5), respectively, of Table 8. Thai 100 per-
84 Arromdee (6) managed to explain 68 percent of the variation in apparent rice consumption with a model employing price and trend as causal variables, the latter picking up the influence of both income and population change. The weaknesses in the data, referred to earlier in footnote 28, are, undoubtedly, a major source of error. The general pattern of Arromdee's work and in the author's preliminary efforts is that as specification of the model improves (in terms of structural sense and significance of economically meaningful coefficients), the explanatory power declines.
85 The author's estimates are at the wholesale price level; Arromdee does not indicate which prices were used.
36 The short-run price elasticity is probably lower, and perhaps more so for low quality varieties. For this analysis, however, a long-run elasticity is more appropriate.
87 There is no published record of the value of marketing charges, so the M$3.00 estimate is based on scraps of evidence. In April 1974, just prior to the government's final decision regarding ceiling price control, wholesalers estimated their costs (including transportation from Kedah to Selangor, labor, and insurance) at M$3.43 per picul (see The Straits Times, Kuala Lumpur, April 4, 1974). The wholesalers' own estimate was made following a year and a half of inflation, whereas the present analysis covers a prior noninflationary period. The wholesalers suggested these costs to the government in defense of their own claims for a larger price-controlled margin (including profit), and it is unlikely they underestimated their costs. Finally, in 1970, 91 percent of imported rice entered Malaysia through the states of Penang, Selangor, and Malacca (77, p. 51), each of which is closer to Selangor than Kedah, the point of origin of the rice included in the wholesalers' cost estimate. These facts suggest that our own M$3.00 estimate may be high, which would result in an underestimate of the implicit tariff.
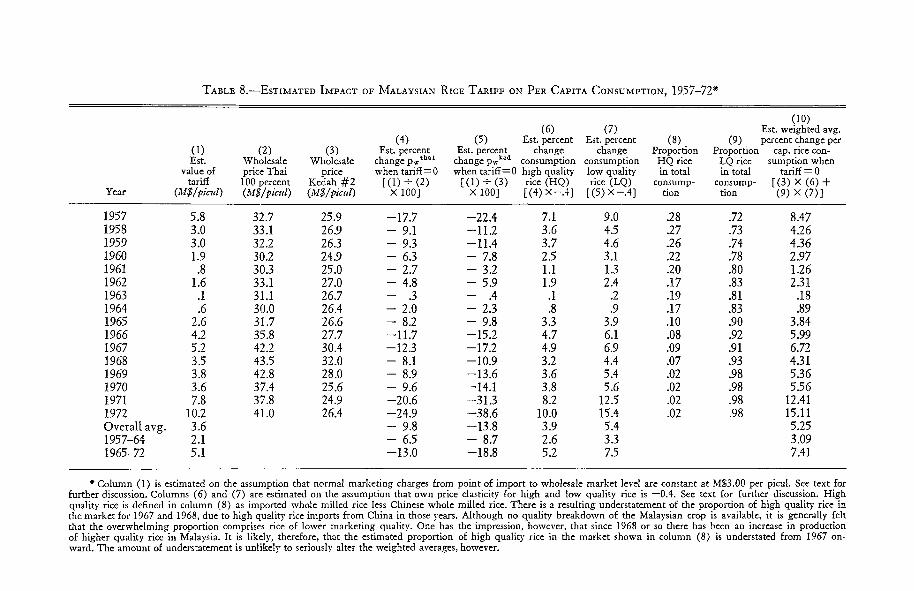
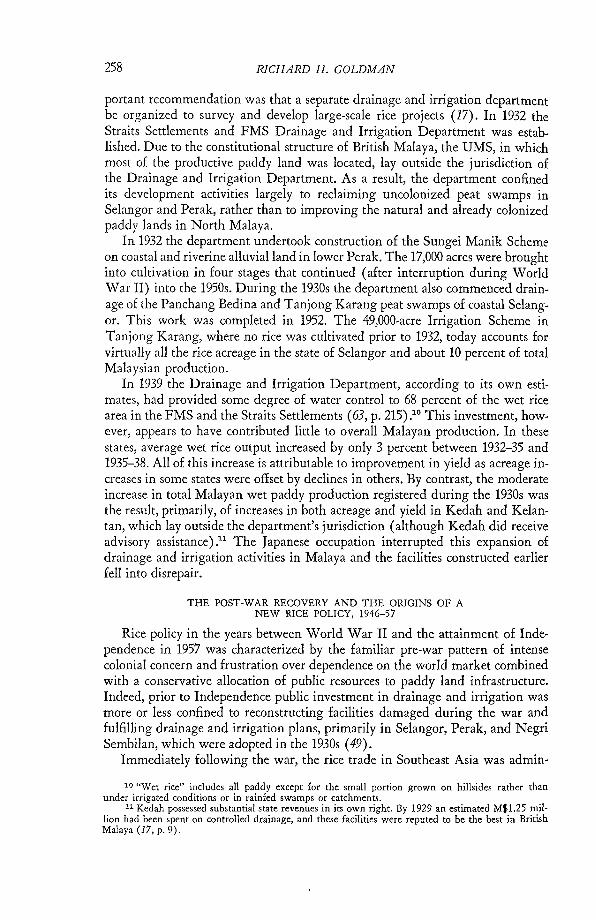
TABLE 8.-ESTIMATED h1PACT OF MALAYSIAN RICE TARIFF ON PER CAPITA CONSUMPTION, 1957-72*
(10) (6) (7) Est. weighted avg.
(4) (5) Est. percent Est. percent (8) (9) percen t change per (1) (2) (3) Est. percent Est. percent change change Proportion Proportion cap. rice con-Est. Wholesale Wholesale change pw thOl change pw k.d consumption consumption HQ rice LQ rice sumption when
value of price Thai price when tariff = 0 when tariff = 0 high quality low quality in total in total tariff = 0 tariff 100 percent Kedah #2 [(1)+(2) [(1) + (3) rice (HQ) rice (LQ) consump- consump- [(3) X (6) +
Year (M$ / piCtlI) (M$ / piCtlI) (M$ / piCtlI) X 100] X 100] [(4)X-.4] [(5)X-.4] tion tion (9) X (7)]
1957 5.8 32.7 25.9 -17.7 -22.4 7.1 9.0 .28 .72 8.47 1958 3.0 33.1 26.9 9.1 -112 3.6 4.5 27 .73 4.26 1959 3.0 322 26.3 - 9.3 -11.4 3.7 4.6 .26 .74 4.36 1960 1.9 302 24.9 - 6.3 - 7.8 2.5 3.1 .22 .78 2.97 1961 .8 30.3 25.0 - 2.7 - 3.2 1.1 1.3 .20 .80 1.26 1962 1.6 33.1 27.0 - 4.8 - 5.9 1.9 2.4 .17 .83 2.31 1963 .1 31.1 26.7 - .3 - .4 .1 .2 .19 .81 .18 1964 .6 30.0 26.4 - 2.0 - 2.3 .8 .9 .17 .83 .89 1965 2.6 31.7 26.6 - 8.2 - 9.8 3.3 3.9 .10 .90 3.84 1966 42 35.8 27.7 -11.7 -15.2 4.7 6.1 .08 .92 5.99 1967 52 42.2 30.4 -12.3 -17.2 4.9 6.9 .09 .91 6.72 1968 3.5 43.5 32.0 8.1 -10.9 32 4.4 .07 .93 4.31 1969 3.8 42.8 28.0 - 8.9 -13.6 3.6 5.4 .02 .98 5.36 1970 3.6 37.4 25.6 - 9.6 -14.1 3.8 5.6 .02 .98 5.56 1971 7.8 37.8 24.9 -20.6 -31.3 82 12.5 .02 .98 12.41 1972 10.2 41.0 26.4 -24.9 -38.6 10.0 15.4 .02 .98 15.11 Overall avg. 3.6 - 9.8 -13.8 3.9 5.4 5.25 1957-64 2.1 - 6.5 - 8.7 2.6 3.3 3.09 1965-72 5.1 -13.0 -18.8 52 7.5 7.41
"Column (1) is estimated on the assumption that normal marketing charges from point of import to wholesale market level are constant at MS3.00 per picul. See text for further discussion. Columns (6) and (7) are estimated on the assumption that own price elasticity for high and low quality rice is -0.4. See text for further discussion. High quality rice is defined in column (8) as imported whole milled rice less Chinese whole milled rice. There is a resulting understatement of the proportion of high quality rice in the market for 1967 and 1968, due to high qualitl' rice imports from China in those years. Although no quality breakdown of the Malaysian crop is available, it is generally felt that the overwhelming proportion comprises rice of lower marketing quality. One has the impression, however, that since 1968 or so there has been an increase in production of higher quality rice in Malaysia. It is likely, therefore, that the estimated proportion of high quality rice in the market shown in column (8) is understated from 1967 onward. The amount of understatement is unlikely to seriously alter the weighted averages, however.

MALAYSIAN RICE POLlCY
TABLE 9.-WEST MALAYSIA: ESTIMATED FREE MARKET SELF-SUFFICIENCY RATE, 1957-72
Estimated Estimated changea per cap. Actual free market rice consumption rate of rate of when tariff = 0 self·sufficiency self-sufficiency
Year (percent) (percent) (percent)
1957 8.47 61 56 1958 4.26 60 58 1959 4.36 58 56 1960 2.97 63 61 1961 1.26 68 67 1962 2.31 68 67 1963 .18 63 63 1964 .89 60 60 1965 3.84 72 69 1966 5.99 76 72 1967 6.72 70 66 1968 4.31 77 74 1969 5.36 80 76 1970 5.56 78 74 1971 12.41 87 77 1972 15.11 91 79 Overall average 5.25 70.8 67.5 1957-64 3.09 62.6 60.8 1965-72 7.41 78.9 73.3
a See Table 8, column (10).
277
cent is taken as a proxy for all high quality rice and Malaysian Kedah #2 as the proxy for all low quality rice, and the price elasticity of -0.4 is applied to the wholesale price changes.s8 Column (10) shows the weighted average percentage by which per capita consumption of rice would have increased, ceteras paribus, in the absence of protection.so
The results show that in an average year per capita consumption would have been 5.3 percent higher in the absence of the implicit tariff mechanism. In the most recent eight-year period of the analysis, however, the consumption effect averaged 7.4 percent. The regressive nature of protection, which is discussed more fully in the following section, is reinforced by the fact that the proportionate impact of the tariff is greatest on rice of lower quality.
The estimated impact of the implicit tariff on self-sufficiency is shown in Table 9. In an average year throughout the 1957-72 period, self-sufficiency would
S8 It is not always recognized in Malaysia that both high and low quality rice is affected by the tariff and that the burden of the tariff does not fall only on consumers of higher qualities of rice. For instance, see (56). At the very least, the prices of lower quality rice respond to protection through the cross-price elasticity between high and low qualities. So long as lower quality rice continues to be imported and subject to the same tariff as higher qualities, however, the effective cross·price elasticity is the one between domestic low quality grades and those which are imported, and this price effect is direct and very strong.
80 The proportion of high quality rice in the market is probably underestimated as, in the absence of any quality breakdown of the domestic crop, all domestic production is excluded from this category. It is generally agreed that Malaysia produces rice of low market quality. One has the impression, however, that the absolute amount of high quality, locally produced rice is increasing. This factor is unlikely to alter seriously the weighted averages.

278 RICHARD H. GOLDMAN
have been only 3.5 percentage points less, in the absence of protection. As selfsufficiency has increased, however, so has the tariff's contribution. Between 1965 and 1972, self-sufficiency in an average year would have been 5.5 percentage points less, if protection had been eliminated. During 1970-72, the initial years of the Muda and Kemubu Schemes, in the absence of protection Malaysia's annual average self-sufficiency rate would have diminished by 8.5 percentage points, from 85.5 percent to 76.8 percent.40
These estimates have been made on the assumption that, if protection were eliminated, either the government would continue to support the price of each domestically produced variety at the farm gate price that prevailed during the period of analysis or, alternatively, that domestic production would be price inelastic over the relevant range. If either assumption holds, then the increase in imports is equal to the increase in domestic consumption resulting from the elimination of protection. These assumptions are quite conservative. If domestic production is price elastic and the tariff reduction lowers producer prices, additional imports will enter the domestic market to replace the reduced local supplies; thus the impact of protection on self-sufficiency is understated here.41
EVALUATION OF POLICY INSTRUMENTS
Malaysian officials have displayed some awareness of the costs involved in becoming self-sufficient in rice. Indeed the Second Malaysia Plan, conceived during a period of low world prices for rice, revised the nation's rice production goal from complete self-sufficiency to meeting 80 to 90 percent of its requirements.42 In 1975, however, the Prime Minister and most major politicians were committed once again to achieving full self-sufficiency. The new development budget in the Third Malaysia Plan will undoubtedly provide for further investment in new doublecropping areas, and perhaps an attempt to colonize new rice land.
While Malaysia has not been doctrinaire regarding self-sufficiency, there has been no systematic evaluation of the cost of additional rice production in terms of overall growth. One explanation for this is that Malaysian officials have never expected rice policy to result in efficient investments toward the goal of maxi-
40 During most of 1973 and throughout 1974, world prices were higher than Malaysian prices, as the government subsidized the sale of imported rice in order to stabilize consumer prices. In the beginning of 1975, however, as world rice prices fell, the LPN announced it would support paddy prices at the existing level. Requests by importers for licenses were denied throughout the first half of 1975.
41 The author has not undertaken an estimate of the production effect of protection. As explained earlier, no supply response coefficients are available. In addition, the full impact of protection may not be felt at the farm gate price level, although a substantial amount of it surely is. The government makes most of its purchases from miIls, rather than directly from farmers. Farmers can sell directly to government miIls, but there are few of them and the government is not an active buyer. The amount of protection passed onto the farm level depends on competition at the miIling level. A significant change was taking place in 1975. The LPN constructed many integrated drying, miIling, and storage complexes in rice areas, and was actively purchasing directly from the farm gate.
42 Summarizing the results of its policy review prior to the construction of the Second Malaysia Plan, the Ministry of Agriculture and Fisheries stated (77, p. 3):
The Government has decided that in the first instance, the production target for rice be revised from that of self-sufficiency to meeting 80 to 90 percent of the country's requirements. This change in rice policy stems from the fact that the country is, and will remain for some time, a relatively high cost producer of rice .... In the revised policy, emphasis is now altered from one of self-sufficiency to enhancing the incomes and welfare of padi farmers through programs to increase yields per acre and reduce costs of production.

MALAYSIAN RICE POLICY 279
mlzlllg national income. Rice programs have been expected to contribute to conserving foreign exchange, reducing risk attached to dependence on the world market, and supplementing the incomes of paddy farmers within the larger context of helping the nation's poor. The remainder of this section will evaluate the nature of these contributions.43
Foreign Exchange
When it was originally conceived, the self-sufficiency policy was viewed as a partial remedy for balance-of-payments problems that were expected to emerge during the 1960s. Fear of dwindling foreign exchange reserves was an important factor sustaining continued public investment in paddy production. In 1965 the First Malaysian Plan warned, "The balance of payments problem arises from the fact that the value of Malaysian exports is growing very slowly at precisely the time when import requirements are on the increase" (24, p. 57). Analysis by Cord en (10) also projected difficulties for Malaysia's major export industries. Munro's ex post assessment, however, reveals that "far from tending to chronic deficit, the [official settlements] balance of payments seemed, at worst, to have been roughly in equilibrium over the decade. Net reserves rose slightly by M$62 million between 1960 and 1970" (67). Although in retrospect official alarm may have been unjustified, it was, nevertheless, an important element in policy formation at the time, and saving foreign exchange is still frequently referred to as a justification for pursuing rice self-sufficiency.
Even if the need in Malaysia to conserve foreign exchange was acute, it is difficult to understand the strategic importance of rice in this respect. Between 1961 and 1965 the value of rice imports accounted for only 5.6 percent of total imports. During the following six years the proportion of rice imports in the total fell to 3.8 percent. Considering the foreign exchange cost of this import substitution-the imported tractors, fertilizers, rice dryers, and debt service, particularlythe net gain cannot be large. It should also be noted that in the same period imports of wheat flour and "other cereals"44 increased in value from an average of U.S.$28.7 million, or 3.5 percent of the value of total imports, to U.S.$42.7 million, or 4.7 percent of total imports, during 1966-71. Although urbanization and rising per capita incomes must be important explanations, it would be interesting to
48 Because maximizing total growth has not been a goal of rice policy, and due to space and time limitations, the subject is not treated in detail here. Malaysia's international comparative advantage clearly does not lie in rice production to the point of self-sufficiency, although some production can be justified on this basis due to lack of alternative uses for much of the paddy land and labor. At current levels of production, however, the evidence is that incremental costs are quite high. In 1970, the Drainage and Irrigation Department reported, "Taking all the projects hitherto completed, the overall capital costs for irrigation schemes averages U .S.$70 per acre .... The capital costs per acre for the projects of Muda and Kemubu amount to U.S.$291 and U.S.$510 respectively" (77, p. 62). Doering has calculated an ex post social benefit/cost ratio of about one for the Muda project. Since per acre capital costs were higher and paddy yields much lower in the Kemubu project, the benefit/cost ratio is probably considerably less than one. In 1975 the World Bank's project completion ex post analysis of the Muda Scheme showed an 18 percent internal rate of return. The discrepancy between Doering's 1971 result and that of the Bank is partially accounted for by the unusually high paddyfertilizer price ratio prevailing during the period of the Bank's analysis plus a substantial underestimate of pre-project paddy yields in the Bank's analysis. See (14, pp. 95 and 102) on this latter point.
44 A large component of this category is probably unmi1led wheat, but it is difficult to determine from the trade statistics due to the method of aggregation.

280 RICHARD H. GOLDMAN
analyze the impact of the protection mechanism, which raised the price of rice but left the import of wheat duty free.
World Market Dependence
The traditional motivation for increasing the locally produced share of total consumption requirements in the face of normally cheap imports is to provide a hedge against sudden world shortage. The policy is predicated on the assumption that in time of world scarcity, domestic stocks can be isolated from the world market and distributed internally according to political rather than free-market formulae. As the share of "controlled"45 locally produced requirements increases, there is a commensurate decrease in the current foreign exchange and subsidy costs to the Treasury entailed in importing the marginal amounts required to achieve a policy target price for consumers and discourage the emergence of a "black market."
An alternative policy instrument is a buffer stock acquired from foreign sources during years of relative plenty. The buffer stock is a physical inventory which must be stored from year-to-year. On the other hand, the incremental increase in local production can be consumed from year-to-year (but is normally produced at a high opportunity cost) and prevented from flowing out of the country when desirable. The relative efficiency of these two instruments depends on a comparison of the incremental cost of storage with that of increasing local production.46
A third alternative is for the government simply to purchase rice on the world market during periods of high world prices and to subsidize its sale to domestic consumers. In the absence of a foreign exchange constraint, the drawbacks to complete reliance on this alternative are the unplanned nature of the expenditures, an aspect loathed by Malaysian Treasury officials, and the logistical difficulties involved in simply finding rice when the market is being rationed by governmentto-government sales.
For Malaysia, the optimal strategy probably calls for some mix of these instruments. The net returns to increasing domestic production must fall off rapidly, given the apparently high incremental cost of developing new double-cropping areas. While some modest increase in Malaysian rice production may be justified in the pursuit of supply security, this amount would surely not result in full selfsufficiency.
Income Distribution
Since Independence, Malaysia has maintained a strong policy commitment to improving the welfare of the rural population. The country's overall goal is to redistribute income into the policy-defined "poverty households." This category includes the lowest 40 percent of the income distribution. In 1970, when the Malaysian poverty line income was U.S.$550 for a family of 5.5 people, about 36.5 percent of all Malaysian families fell into this poverty category (3).
45 This category includes amounts controlled through outright procurement and export prohibition. 46 This calculation is complex and involves more variables than tho,e listed here. At the very
least, the return to increasing domestic production must be discounted to reflect the expected variance and sequence distribution of domestic yields. With respect to the buffer stock, a similar adjustment is required in order to estimate storage costs properly.
MALAYSIAN RICE POLlCY 281
Rice policy is seen as playing a major role in the attempt to redistribute income. In 1972 the Ministry of Agriculture and Fisheries stated (77, p. 2) :
The past policy resulting in increased production of padi has often been described as a concerted attempt to reach self-sufficiency in rice, the basic food. But this view conceals the real motive of increasing rice production which is primarily to improve the living standards of the padi growing population.
An evaluation of this aspect of rice policy requires knowledge of the distribution of benefits and, given the larger context of the redistribution program, of the incidence of taxes.
The distribution of paddy land by operating households shown in Chart 3 suggests that benefits from paddy-farm programs accrue largely to the 33 percent of farmers who operate about 60 percent of the paddy land. This distribution is misleading, however, for only main-season paddy area is included in the data portrayed in Chart 3. To gain insight into the distribution of benefits from publicly-financed paddy land infrastructure and price supports, the area data needs to be adjusted for productivity (yield) and cropping intensity. Adjustment factors, which incorporate the degree of double-cropping and relative yields, based on state averages are shown in column (2) of Table 10. These adjustment factors are weights which reflect the relative production potential of the rice fields shown in column (1) of Table 10. The five states with the largest rice farms are also those with the largest adjustment factors. It can be inferred, therefore, that the distribution of production capacity by farm household may be more concentrated than that shown in Chart 3. Paddy fields of less than three acres account for a smaller percentage of production capacity than of total paddy area due to their generally less productive land and to less double-cropping.
Part of the benefit from farm programs will flow into the hands of landowners as benefits are capitalized into land values. Although no data exist on the concentration of ownership of paddy land, it is probably at least as skewed as that for operating units.47 This flow of payments to owners of paddy land in Malaysia is complex, however. Evidence presented in columns (4) and (5) of Table 10 suggests that, although a disproportionate amount of the gross benefits from paddy farm programs are acquired by large-farm operators, a larger proportion of these benefits may be ultimately garnered by landlords than is the case for the smaller farms, which tend to be relatively more owner-operated.48 The actual determination of rent levels for paddy farms in Malaysia is unclear due to the large incidence of leasing from kin and the intra-family transfers involved (55). The capitalized value of benefits may be captured more at the point of land sale rather than in rental payments.
Although farmers or landlords normally benefit from price supports in direct proportion to the amount of output sold, this result is modified to a degree in Malaysia by the great increase in demand for wage labor resulting from the addition
47 The Centre for Policy Research at Universiti Sains Malaysia (USM) and the Muda Agricultural Development Authority (MADA) are jointly carrying out a comprehensive investigation of land tenure and ownership patterns in the Muda Scheme area.
48 These data, based on state averages, are suggestive only because they do not reveal the intrastate distribution of tenancy type by farm size.
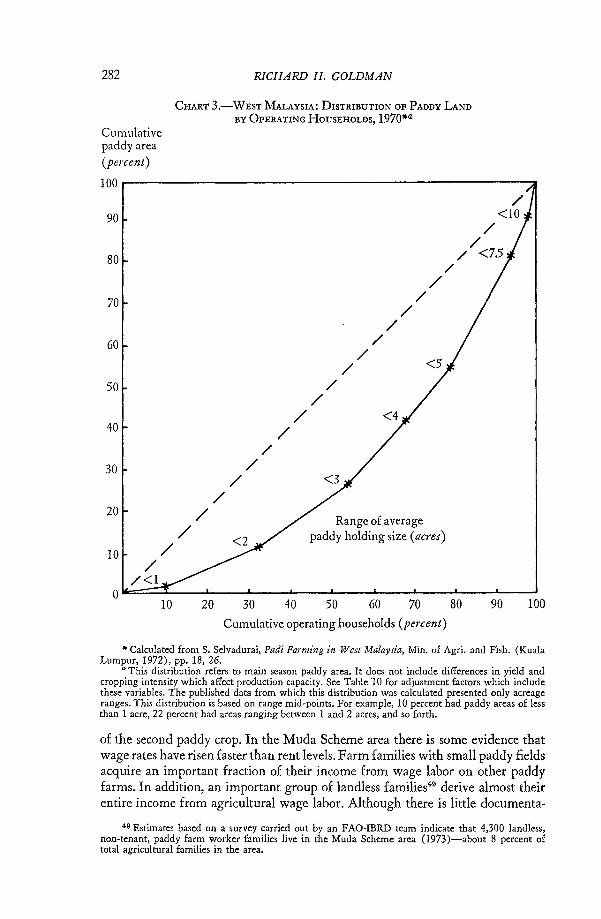
282
Cumulative paddy area (percent)
RICHARD H. GOLDMAN
CHART 3.-WEST MALAYSIA: DISTRIBUTION OF PADDY LAND
BY OPERATING HOUSEHOLDS, 1970"'a
100r-------------------------------------------~
90
80
70
60
50
40
30
20
10
/ /
/ /<1
/
/ /
/
/
/ /
/
/ /
/
/
/ /
/ /
/
Range of average paddy holding size (acres)
/ <10
/ /
/ <75
O~~~----~--~----~--~----~--~----~--~--~ 10 20 30 40 50 60 70 80 90 100
Cumulative operating households (percent)
.. Calculated from S. Selvadurai, Padi Farming in West Malaysia, Min. of Agri. and Fish. (Kuala Lumpur, 1972), pp. 18, 26.
e This distribution refers to main season paddy area. It does not include differences in yield and cropping intensity which affect production capacity. See Table 10 for adjustment factors which include these variables. The published data from which this distribution was calculated presented only acreage ranges. This distribution is based on range mid-points. For example, 10 percent had paddy areas of less than 1 acre, 22 percent had areas ranging between 1 and 2 acres, and so forth.
of the second paddy crop. In the Muda Scheme area there is some evidence that wage rates have risen faster than rent levels. Farm families with small paddy fields acquire an important fraction of their income from wage labor on other paddy farms. In addition, an important group of landless families49 derive almost their entire income from agricultural wage labor. Although there is little documenta-
49 Estimates based on a survey carried out by an FAO-IBRD team indicate that 4,300 landless, non-tenant, paddy farm worker families live in the Muda Scheme area (1973)-about 8 percent of total agricultural families in the area.

TABLE 10.-DIFFERENTIAL CHARACTERISTICS OF WEST MALAYSIAN PADDY FARMS AND FARMERS'"
Pure Average Farm size Percent of tenants as
paddy farm adjustment Malaysian percent of area, 1970a factor, paddy farms, paddy
State (acres) 1972-73b 1970 farmers"
Pedis 4.1 1.78 4.1 31 Kedah 4.0 2.18 27.4 35 Selangor 3.6 2.44 4.4 15 Perak 2.6 1.66 14.9 37 Penang 25 2.48 5.4 39 Kelantan 2.3 1.06 18.9 20 Trengganu 2.3 .79 6.4 22 Malacca 2.1 .89 4.1 30 Pahang 1.7 .81 6.8 16 Johore 15 1.39 1.4 10 Negri Sembilan 1.1 1.51 6.4 6
• Data from s. Selvadurai, Padi Farming in West Malaysia, Min. of Agri. and Fish. (Kuala Lumpur, a The area given is main-season paddy area.
Owners Percentage as percent paddy households
of with at least 50 paddy
farmers" percent of income from paddy, 19604
45 90 45 70 60 82 50 37 44 62 25 47 55 53 52 19 70 39 70 10 87 32
Specialized paddy farms as percent of total small holdings,
1970·
64 50 22 23 49 27 22 16 12 2
12
[
main-season yield off-season yield b Author's calculation: [(main-season planted area X national avg. main-season yield) + (off-season planted area X national avg. main-season yield)]
-;- main-season area] •
"Date of enumeration not given. d Calculated from 1960 Census of Agriculture. A paddy household is any household farming paddy. e Adapted from 1960 CenStis of Agriculture. "Specialized" is defined as a farm with 75 percent or more of its total area devoted to one crop, in this case, paddy.
~ :... t-< :... ~ ~ <: ~ -. R '" a t: C') "<:
N 00 w

284 RICHARD H. GOLDMAN
TABLE n.-PADDY AREA REQUIRED TO EARN ANNUAL POVERTY LINE
HOUSEHOLD INCOME, 1970·
Quality of paddy land
Class I Class II Class III
Required Paddy Area
Single-cropped, owner-operated
(acres)
6 6-7 8-9
Double-cropped, owner-operated
(acres)
3-4 3-4 4-5
* Malaysian Economic Planning Unit, unpublished. These estimates are constructed on the assumption that single-cropping families earn U.S.$47 non-paddy farm income and U.S.$163 off-farm income, and that double-cropping families earn U.S.$38 non-paddy farm income and U.S.$lOO offfarm income. The poverty line income for an average household is U.S.$550.
tion available, it seems clear that agricultural wage earners in paddy areas have benefited substantially from the gross transfers flowing from Malaysian rice programs.~o
Finally, the geographical concentration of large development expenditures combined with backward and final demand linkages from increased production may be having a significant regional development impact, particularly in Kedah and Perlis. The importance of rice production in these states is indicated by column (7) of Table 10, which shows that farms with over 75 percent of their area in paddy account for over half the number of total smallholdings in those states. The regional impact of the Muda Project should not be ignored in an appraisal of the distribution of paddy program benefits."l
This qualitative evidence on the distribution of gross benefits from Malaysian rice policy is inconclusive. The concentration of production capacity in the hands of farm operators is more skewed than the area distribution shown in Chart 3. In addition, the ownership distribution of this capacity is probably even more concentrated. These factors, which tend to skew the distribution of benefits, are modified by the tight labor markets prevailing in some major paddy areas, the high incidence of tenant-landlord relationships among kin, and the regional development impact of the Muda Scheme. The long-run distribution of benefits will be modified considerably if mechanized harvesting and transplanting (discussed briefly in the following section) become widespread. This change would transfer into land values the rent presently being acquired by labor.
In addition to distributional characteristics already mentioned, it is important to have some idea of the proportion of paddy farming households whose net annual incomes place them below the poverty line. One striking feature of Malaysian paddy farms is their small size. According to Chart 3, 80 percent of paddy holdings (i.e., the paddy land operated by a farm family) is under 75 acres and only 3 percent is larger than 10 acres. The paddy areas required for a normal household to earn a net income slightly above the poverty line, given different cropping conditions and amounts of non-paddy income, are estimated in Table 11. The amount of non-paddy income available to rice farming families is difficult
50 The author, as part of the USM-MADA Land Tenure Survey Team, and a group of researchers from the World Bank are presently carrying out investigations into aspects of this subject.
51 A regional input-output model for the Muda area is being constructed by a team from the Development Research Center of the World Bank.

MALAYSIAN RICE POLlCY
TABLE 12.-WEST MALAYSIA: EXPENDITURE ON RICE AS A PERCENTAGE OF TOTAL HOUSEHOLD INCOME, 1957-58*
Monthlya Expenditure on rice as a percentage of household incomeb
household Malay Indian Chine,e income
285
(M$) Rural Urhan Rural Urban Rural Urban
1-150 27 19 29 19 25 22 151-300 12 10 13 10 11 10 301-500 7 10 10 7 8 6
• Federation of Malaya, Household Budget Survey 0/ the Federation of Malaya, ]957-58 (1959). a The components of "income" as employed in the 1957-58 household budget survey are not
defined (see 87, p. 7). b The monthly income range mid-points are used for calculating percentages.
to know with certainty, particularly for the many farms with less than half their total area under paddy. However, the non-paddy income figures used to develop the estimates shown in Table 11 are considered realistic, having been based on the results of numerous farm household surveys (see 32,70,72,78,79,80,81).
Comparing Table 11 with Chart 3, even if all paddy farms were doublecropped and owner-operated, about 55 percent of the associated households would remain below the poverty line. It is likely that between 55 and 70 percent of paddy farming families are in the policy-defined poverty category. Therefore, while a disproportionate amount of gross benefits from farm programs accrues to the wealthier elements in the rural community-large farm operators and landlordsa substantial portion is indeed acquired by some of the poorest members of society through wage earnings and double-cropping on small- and medium-sized farms.
The efficacy of rice policy as an instrument of income redistribution is diminished to the extent that intended beneficiaries also bear the burden of financing the transfer. Given Malaysia's policy goals, it is important to know the incidence of paddy program costs on the total group of policy-defined poverty households, not simply those poverty households which are engaged in rice farming. A portion of rice policy benefits is financed by general revenue and various forms of debt. The incidence of this finance is not analyzed here (see 65 and 88). The one instrument of finance which is linked directly to rice policy is the implicit tariff mechanism. Part of this transfer is accomplished with revenue collected from the tax on imports, but most of the transfer is effected directly through the market with artificially high domestic rice and paddy prices rather than through budget expenditures.
It is difficult to envision a more regressive excise than a tax on staple foods, particularly one as important in the diet as rice in Malaysia. The implicit tariff's impact on domestic rice consumption was estimated earlier in Table 8. The tariff's impact on the real income of low income households is also revealing.
The importance of rice in Malaysian household budgets in 1957-58 is shown in Table 12.52 Although M$150 is slightly above the 1970 monthly poverty line income, the households represented in the M$1-M$150 range are a close proxy
52 The HotlSehold Budget Survey of the Federation 0/ Malaya, 1957-58 (21) is the most recent and reliable source of information on the distribution of household expenditures. The Malaysian Department of Statistics 1973 budget survey is, at the time of this writing, still unprocessed.
286 RICHARD H. GOLDMAN
for those in the poverty category. Rural households comprise 88 percent of the poverty households in Malaysia (3) . Weighting the expenditure proportions shown in Table 12 by the relative importance of rural and urban households in the poverty group reveals that, on average, families in the poverty category spend an estimated 26 percent of their income on rice. In Table 8 it was shown that between 1965 and 1972, in the absence of protection, the domestic price of low quality rice would have been about 19 percent lower than its observed leveL In other words, supporting farm gate prices in Malaysia through protection results in a 5 percent tax on income for the average household in the poverty group.53
There were an estimated 296,000 paddy-farming families in Malaysia in 1970 (77). Farm management data for different tenure and soil types, analyzed by the author, suggest that most paddy-farming families are self-sufficient and, therefore, not taxed by the artificially high consumer rice prices. Perhaps 20 to 25 percent of paddy-farming families depend on the market for a portion of consumption needs.54
The total number of poverty group families in 1970 is estimated at 586,190 (3). If the 20 percent of rice-farming families who operate the largest paddy areas (larger than 5 acres) are assumed not to be in poverty, then paddy-farming families constitute only 40 percent of total poverty group families. It is likely, therefore, that at least three-fifths of the poverty group families contribute a substantial portion of the resources required to finance rice program benefits.
Although the general revenues that help finance drainage and irrigation facilities and rice research are collected from a system of taxation more progressive than the one that finances the price supports (see 65 and 88), the regressive nature of the implicit tariff ensures that the net redistribution of income resulting from rice policy is considerably less than is suggested by the Row of gross benefits. This discrepancy will become increasingly important so long as the price support is maintained through protection and as the success of the double-cropping program moves more rice farming families out of the poverty category.
FUTURE POLICY DEVELOPMENTS AND DILEMMAS
Malaysia's experience in 1973 and 1974 with soaring world rice prices reinforced the traditional desire for independence from foreign supplies. In 1973 stockpiled rice was insufficient to stabilize domestic prices, and between January 1973 and October 1974 the government spent U.S.$46.7 million to subsidize the cost of 358,000 tons of rice imported, mostly from China, by the LPN.55 In mid-1974 legal retail rice price ceilings were imposed at about double the 1972 price level. The
53 Because the impact of the implicit tariff shown in Table 8 is measured at the wholesale price level, the calculation of the impact on consumer incomes requires the assumption that the price margin between wholesale and retail levels is proportionate.
54 These estimates are the result of the author's attempt to derive the number of acres required to feed a farm family of 5.5 members at the national average level of rice consumption. The calculations were made for owners and tenants on three different soil types and for single- and doublecropping.
55 LPN has not reported the volume of rice distributed, but there are indications that their 1975 carry-in was large, caused by a combination of imported rice and active buying of the domestic crop in 1974. It is not clear whether LPN's reported costs are based on the amount distributed or the amount procured. If import prices fall below the Malaysian ceiling level in 1975, LPN will have to decide whether or not to let the domestic price level fall and, thus, absorb a further loss on their stocks.

MALAYSIAN RICE POLICY 287
ceilings did not roll back prices, whose increase had been dampened by the reduction in the implicit tariff as world prices rose and then by the imposition of the consumer subsidy, but sought to prevent a further rise. The ceiling was successfully defended by the distribution of imported stocks. However, the direct financial cost to the Treasury and the logistical difficulties experienced by the LPN were large. The impact of this episode on policy makers was reinforced by the fact that federal elections were held in 1974. Throughout the election campaign, the Prime Minister and other officials recommitted the nation to the goal of complete self-sufficiency.
Production Plans
The Third Malaysia Plan, due to be announced in early 1976, is expected to provide for further expansion of double-cropping on presently single-cropped land. The opening of new double-cropping areas will temporarily push Malaysia further toward self-sufficiency. The long-run rate of self-sufficiency, however, will depend on the rate of paddy land colonization and yield increases relative to the growth of population, income, and urbanization. One Ministry of Agriculture projection, for instance, shows the nation reaching 97 percent self-sufficiency by 1977 but faIling off to 91 percent in 1985 (35).
There may be an attempt to colonize new paddy land in parts of West Malaysia and in Sarawak and Sabah, the two Borneo states. The government estimates that 60,000 acres of new rice land can be developed in Perak, Pahang, Johore, and Trengganu. Another 200,000 acres or more have been identified in Sabah and Sarawak (35). Although frequently discussed in Malaysia, large-scale paddy land colonization is unlikely to be undertaken in the near future due to the high cost involved and the difficulty in attracting settlers.
A more likely source of increased rice production in Malaysia is from improvements in paddy yields. Despite the rapid adoption of double-cropping and the widespread planting of new paddy varieties, Malaysia's yield performance has been disappointing. From 1962, just prior to the introduction of new seed varieties, to 1974 dry-season yields in irrigated areas increased at an average compound rate of only 1.86 percent. Although this figure summarizes a variety of experiences in Malaysia's different ecological zones, there appears to be substantial opportunity for productivity gains. The Muda Agricultural Development Authority is currently focusing research on this problem in its area.
Policy Dilemmas
Malaysian rice policy has pursued self-sufficiency and income redistribution goals simultaneously. The foregoing analysis has shown that although the net redistributive gain may be positive, it is probably not large. As self-sufficiency is approached, however, a direct conflict between these policy objectives is likely to emerge. In addition, production program costs may take on additional importance in the policy calculus, particularly if world rice prices approach pre-1973 levels.
Only one crop is currently grown on about 250,000 acres of paddy land in West Malaysia. Perhaps 60 percent of this acreage is technically feasible for the development of off-season irrigation, according to Drainage and Irrigation De-
288 RICHARD H. GOLDMAN
partment officials. These areas are most likely to be included in Third Malaysia Plan investments. The cost of this additional production will be high. The per acre capital costs of the Kemubu Project, for instance, were 1.7 times greater than for Muda although the two projects were contemporaneous (77, p. 62). The remaining single-cropped areas in Malaysia are small catchments of less than a thousand to, perhaps, 20,000 acres, broken by hills often planted with rubber. The irrigation systems planned for these areas are generally of the river barrage type and probably entail larger per acre costs than the Kemubu Project. In addition, these areas have paddy soils of relatively low fertility and, being in the southern part of the country, a less distinct and reliable dry season. In 1974 the irrigated, off-season acreage in the four southern-most states produced paddy yields that were only 62 percent of those in the state of Kedah. Although differing cultivation techniques may explain part of this discrepancy, poorer soils and lower available solar energy may be of greater importance. Given this high cost, if world rice prices settle at a pre-1973 level Malaysian officials may decide once again, as was the case in 1970, not to push toward full self-sufficiency.
Whether the production and income redistribution goals of rice policy come into direct conflict will depend primarily on two factors-the future of the price support program, and the expansion of mechanized cultivation. As a result of the consumer subsidy and legal price ceilings at the retail level, producer prices were held below the world market level during 1973, 1974, and the first half of 1975. Nevertheless, the ceiling equivalent mill-door paddy price was almost double that prevailing in 1972. In 1974 the LPN was having difficulty competing with private millers at M$28-30 per picul of clean, dry paddy. In 1972 the milldoor price was M$16-18. In early 1975 world rice prices began falling sharply from their high levels of 1974. The LPN, however, promised to restrict imports if necessary to maintain the paddy price throughout the year. During the off-season harvest in August and September farmers were offered only slightly less than 1974 prices, and requests for licenses by importers were denied.
As world prices continue to fall in 1976 producer price supports will once again become operative. Although the government remains publicly committed to the price support policy, it has not announced a long-term support level. In addition to substantial opposition from Malay paddy farmers, a large reduction in the support price may be precluded by the requirements of the self-sufficiency program. The single-cropped areas, where supplemental irrigation facilities are likely to be installed, are cultivated by families who generally earn over half their income from non-paddy work (96). An artificially high paddy price may be required to bid labor out of other crops and non-agricultural employment and into a second rice crop. Moreover, if yield increases entail increased fertilizer application, the paddy output will become more sensitive to the paddy-fertilizer price ratio.
Although public storage and milling capacity have increased substantially during the past two years, there is no indication that the government is prepared to absorb the cost of price support through its budget. Protection may continue to be imposed through restrictive import licensing rather than through a return to the import-stockpile purchase arrangement. Yet both mechanisms have equally regressive impacts on consumers. As shown in the previous section, protectionsupported paddy prices benefit an increasing proportion of non-poverty group

MALAYSIAN RICE POLICY 289
farmers at the expense of poor consumers. If this trend continues, a direct conflict will emerge between the production and income redistribution goals of rice policy.
Mechanized cultivation has not yet become a source of conflict in Malaysian rice policy. New developments, however, may alter this situation. During the past two decades, there has been a great increase in the use of tractors for land preparation in Malaysia's major paddy areas. These machines replaced water buffalos and enabled cultivators to prepare their land in sufficient time to plant a second crop. The elimination of a strategic bottleneck during land preparation thus facilitated double-cropping and generated a large increase in the aggregate demand for labor as well as an increase in output.
In recent years, however, the Malaysian government with Japanese assistance has been experimenting with 25-horsepower, paddy-harvesting machinery. Prototype transplanters are also being developed. The feasibility of this equipment is still under investigation. The rationale behind this development has to do with the tightening labor market during transplanting and harvesting time, particularly in the Muda Scheme area. In addition, farmers and government officials would prefer to speed up harvesting and reduce the risk of an early arriving rainy season interfering with the dry-season harvest. Finally, an additional incentive for the development of harvesting and transplanting equipment will be created if new paddy land is opened up and settlers are difficult to attract (or expensive to provide for).
The expansion in the demand for labor resulting from double-cropping and the increase in wage rates during seasons of peak labor demand have been great sources of benefit to landless laborers and to small farm families who receive income from wage labor. Tight labor markets have enabled wage earners to acquire part of the economic rent generated by public investment in drainage, irrigation, and research. There is not a large alternative demand for the skills possessed by most paddy farm workers. If further mechanization takes place, therefore, its likely impact will be to capitalize into land values the rents heretofore captured by labor. This result would be ironic indeed for a rice policy whose major goal is augmenting incomes of the rural poor.
CITATIONS
1 Afifuddin bin Hj Omar, "Social Implications of Farm Mechanization in the Muda Scheme," paper presented at ADC Seminar on Farm Mechanization in Southeast Asia, Malaysia, Nov. 27-Dec. 2, 1972.
2 Allen, J. de V., "Malayan Civil Service, 1874-1941: Colonial Bureaucracy /Malayan Elite," paper presented at International Conference of Asian History, Kuala Lumpur, Aug. 5-10, 1968.
3 Anand, Sudhir, "The Size Distribution of Income in Malaysia," International Bank for Reconstruction and Development, 1973, unpub.
4 Ani bin Arope et al., Report of the Subcommittee on Prospects f01" Self-sufficiency in Rice in West Malaysia, Ministry of Agriculture and Lands, Malaysia, 1970, mimeo.
5 --- and Abdul Rahman bin Hj Yusof, "Rice Policy in Malaysia," Agricultural Economics Bulletin, Malaysian Agricultural Research and Development Institute, Sept. 1971.
6 Arromdee, V., "Can West Malaysia Become Self-Sufficient in Rice in 1975?," Malayan Economic Review, Oct. 1969.
7 Baldwin, William L., "The Thai Rice Trade as a Vertical Market Network:

290 RICHARD H. GOLDMAN
Structure, Performance, and Policy Implications," Economic Development and Cultural Change, Jan. 1974.
8 Brown, C. P., "Rice Price Stabilization and Support in Malaysia," The Developing Economics, June 1973.
9 Caldwell, J. C., "The Demographic Background," in T. H. Silcock and E. K. Fisk (eds.), The Political Economy of Independent Malaya (Canberra, 1963).
10 Corden, W. M., "Prospects for Malayan Exports," in T. H. Silcock and E. K. Fisk (eds.), The Political Economy of Independent Malaya (Canberra, 1963).
11 Crotty, R., "A Theoretical Concept of the Malaysian Rice Marketing System," Ministry of Agriculture and Co-operatives, Kuala Lumpur, Dec. 1967, mimeo.
12 Dalrymple, D. G., "Imports and Plantings of High-Yielding Varieties of Wheat and Rice in the Less Developed Countries," USDA, Foreign Economics Development Report #8, Jan. 1971.
13 Ding Eing (Tan Soo Hai), The Rice Industry in Malaya 1920-40 (Singapore, 1963).
14 Doering, Charles Otto, "Malaysian Rice Policy and the Muda Irrigation Project" (unpub. Ph.D. Diss., Cornell Univ., 1973).
15 Drabble, H. J., Rubber in Malaya, 1876-1922 (Kuala Lumpur, 1973). 16 Emerson, Rupert, Malaysia: A Study in Direct and Indirect Rule (Kuala Lum
pur, 1937). 17 Federated Malay States, Report of the Rice Cultivation Committee, 2 vols.
(Kuala Lumpur, 1931). 18 Federation of Malaya, Report of the Rice PfOduction Committee, 1 (Kuala
Lumpur, 1953). 19 ---, Final Report of the Rice Committee (Kuala Lumpur, 1956). 20 --, A Plan for the Development of Malaya, 1956-1970 (Kuala Lumpur,
1956) . 21 ---, Department of Statistics, Household Budget Survey of the Federation
of Malaya, 1957-1958 (Kuala Lumpur, 1959). 22 ---, Ministry of Agriculture and Co-operatives, Census of Agriculture, Fed
eration of Malaya, 1960 (Kuala Lumpur, 1962). 23 ---, Policies and Measures Leading Toward Greater Diversification of the
Agricultural Economy of the Federation of Malaya, Ford Foundation Survey Team Report (Kuala Lumpur, Feb. 1963).
24 Federation of Malaysia, First Malaysian Plan, 1966-1970 (Kuala Lumpur, 1966).
25 --, Mid-Term Review of the First Malaysian Plan, 1966-1970 (Kuala Lumpur, 1969).
26 --, Second Malaysian Plan, 1971-1975 (Kuala Lumpur, 1971). 27 --, Mid-Term Review of the Second Malaysian Plan, 1971-1975 (Kuala
Lumpur, 1973). 28 ---, Department of Statistics, Monthly Bulletin of Statistics, West Malaysia
(Kuala Lumpur, various years). 29 ---, ---, Peninsular Malaysia, Annual Statistics of External Trade (Ku
ala Lumpur, various years). 30 ---, Federal Agricultural Marketing Authority, Malaysia, "Production Costs
of Various Agricultural Commodities (Preliminary)"; Agricultural Economics Bulletin, 1, 1971.
31 ---, Ministry of Agriculture and Fisheries, Annual Report (Kuala Lumpur, various years).
32 ---, ---, Paddy Statistics, West Malaysia (Kuala Lumpur, various years). .
33 ---, Ministry of Agriculture and Co-operatives, Farm Economzc Survey of the Muda River Project, 1966 (Kuala Lumpur, 1967).
34 ---, Ministry of Agriculture and Lands, A Preliminary Report on the Rice Industry of West Malaysia (Kuala Lumpur, Oct. 1971).
MALAYSIAN RICE POLICY 291
35 ---, Ministry of Agriculture and Fisheries, "Self-sufficiency Policy for Rice," Oct. 1973, mimeo.
36 ---, Ministry of Agriculture and Co-operatives, Triennial Report of the Drainage and Irrigation Division (Kuala Lumpur, various years).
37 Ferguson, D. S., "The Sungei Manik Scheme," The Malayan Journal of Tropical Geography, March 1954.
38 Fisk, E. K., Studies in the Rural Economy of Southeast Asia (Singapore, 1964). 39 Floyd, John E., "The Effects of Farm Price Supports on the Returns to Land
and Labor in Agriculture," The Journal of Political Economy, April 1965. 40 Goldman, Richard H., "The Political Economics of Malaysian Rice Policy from
Pre-Colonial Times to 1945," unpublished, Dec. 1974. 41 Gullick,J.M.IndigenousPoliticaISystemsof Western Malaya (London, 1958). 42 --,Malaya (New York, 1964). 43 Ho, Robert, "Mixed Farming and Multiple Cropping in Malaya," Journal of
Tropical Geography, Oct. 1962. 44 ---, Farmers of Central Malaya, Research School of Pacific Studies, Aus
tralian National University (Canberra, 1967). 45 ---, "Rice Production in Malaya: A Review of Problems and Prospects,"
Journal of Tropical Geography, Dec. 1969. 46 Ingram, James C., Economic Change in Thailand 1850-1970 (Stanford, 1971). 47 International Bank for Reconstruction and Development, The Economic De
velopment of Malaya (Baltimore, 1955). 48 Jackson, James C., Planters and Speculators: Chinese and European Enterprise
in Malaya, 1786-1921 (Kuala Lumpur, 1968). 49 ---, "Rice Cultivation in West Malaysia," Journal of the Malay Branch of
the Royal Asiatic Society, Pt. II, 1972. 50 ---, "Small holding Cultivation of Cash Crops," in Wang Gungwu (ed.),
Malaysia, a Survey (Singapore, 1964). 51 Jegatheesan, S., "The Economics of Mechanization in Rice Double Cropping
The Muda Irrigation Scheme," paper presented at the ADC Seminar on Farm Mechanization in Southeast Asia, Malaysia, Nov. 27-Dec. 2, 1972.
52 Josling, T. E., "Agricultural Policies in Developed Countries: A Review," Journal of Agricultural Economics, Sept. 1974.
53 Khairi Hj Mohamed, "Agricultural Labour and Padi Varieties," State Dept. of Agriculture, Kedah, Malaysia, cir. 1969-70, mimeo.
54 Khatija Ahmad, "A Comment on Government Policies in Padi and Rice Marketing," Review of Agricultural Economics Malaysia, Dec. 1967.
55 Kuchiba, M., and Y. Tsubouchi, "Paddy Farming and Social Structure in a Malay Village: A Social Anthropological Study of a Community in Kedah," The Developing Economies, 5, 1967.
56 Lai Kok Chew, "A Proposed Model for Planning of Pricing and Import Policy for Rice Based on Income and Welfare Considerations," Agricultural Economic Bulletin, Malaysian Agricultural Research and Development Institute, Oct. 1971.
57 Lee Hock Lock, "Public Policies and Measures Towards Economic Diversification-A Critical Study of the Experience of West Malaysia, 1957-1970" (unpub. PhD. Diss., Univ. Malaya, 1974).
58 Lewis, Stephen R., "Agricultural Taxation in a Developing Economy," in H. M. Southworth, and B. F. Johnston (eds.), Agricultural Development and Economic Growth (Ithaca, 1967).
59 ---, "Agricultural Taxation and Intersectoral Resource Transfers," Food Research Institute Studies, 2,1973.
60 Lim Chong Yah, Economic Development of Modern Malaya (Kuala Lumpur, 1967).
61 Lim, David, Economic Growth and Development in West Malaysia, 1947-1970 (Kuala Lumpur, 1973).
62 Lim Lin Lean, Some Aspects of Income Differences in West Malaysia, Mono-

292 RICHARD H. GOLDMAN
graph on Malayan Economic Development, Faculty of Economics and Administration University of Malaya, 1971. '
63 Lim Teck Ghee, "Peasant Agriculture in Colonial Malaya: Its Development in Perak, Selangor, Negri Sembilan and Pahang, 1874-1941" (unpub. Ph.D. Diss., Australian National Univ., 1971).
64 Lipton, M., "Farm Price Stabilization in Underdeveloped Agricultures: Some Effects on Income Stability and Income Distribution," in P. Streeten (ed.), Unfashionable Economics: Essays in Honour of Lord Balogh (London, 1970).
65 McLure, Charles E., Jr., "The Incidence of Taxation in West Malaysia," The Malayan Economic Review, Oct. 1972.
66 Meyanathan, Sahathavan, "Analytical Aspects of West Malaysian Rice Price Stabilization and Support" (unpub. M.A. thesis, Univ. Malaya, Feb. 1974).
67 Munro, Gordon, "The Malaysian Balance of Payments to 1980: Part I," Kajian Ekonomi Malaysia, June 1973.
68 Nair, Ragavan, "High Yielding Padi Varieties in West Malaysia, Some Implications for Price Policy," Review of Agricultural Economics Malaysia, 4, 1, n.d.
69 Narkswasdi, U., A Report to the Government of Malaysia of the Rice Economy of West Malaysia, FAO (Rome, Jan. 1968).
70 ---, and S. Selvadurai, Economic Survey of Padi Production in West Malaysia (Selangor, Collective Padi Cultivation in Bachang, Malacca), Ministry of Agriculture and Co-operatives (Kuala Lumpur, 1968).
71 Ness, G. D., Bureaucracy and Rural Development in Malaysia (Berkeley, 1967). 72 Purcal, J. T., Rice Economy-A Case Study of Four Villages on West Malaysia
(Honolulu, 1972). 73 Purvis, Malcomb, "Evaluation and Use of Under-developed Agricultural Sta
tistics: The Food Economy of Malaysia" (unpub. Ph.D. Diss., Cornell Univ., 1966). 74 Ridler, Duncan, and C. A. Yandle, "Changes in Patterns and Policies in Interna
tional Trade in Rice," IMF Staff Papers, March 1972. 75 Rutherford, J., "Double Cropping of Wet Padi in Penang, Malaya," Geographi
cal Review, 1966. 76 Sands, W. N., "Review of the Present Position of Rice Production in Malaya,"
Malayan Agricultural Journal, March 1930. 77 Selvadurai, S., Padi Farming in West Malaysia, Ministry of Agriculture and
Fisheries (Kuala Lumpur, 1972). 78 ---, Padi Survey: Sungei Manik and Changkat Jong Irrigation Areas, Perak,
Ministry of Agriculture and Fisheries (Kuala Lumpur, 1972). 79 ---, Krian Padi Survey, Ministry of Agriculture and Fisheries (Kuala Lum
pur, 1972). 80 ---, Ani Arope, and Nik Hassani bin Mohammad, Socio-Economic Study of
Padi Farms in the Kemubu Area of Kelantan, 1968, Ministry of Agriculture and Cooperatives (Kuala Lumpur, 1969).
81 Selvadurai, S., and Ani Arope, Socio-Economic Study of Padi Farms in Province Wellesley, 1968, Ministry of Agriculture and Co-operatives (Kuala Lumpur, 1969).
82 Sharom Ahmat, "The Structure of the Economy of Kedah, 1870-1905," Journal of the Malay Branch of the Royal Asiatic Society, Pt. 2, Dec. 1970.
83 Short, D. E., "Some Aspects of the Role of Irrigation in Rural Development in Malaya" (unpub. Ph.D. Diss., Univ. Hull, 1971).
84 ---, and James C. Jackson, "The Origins of an Irrigation Policy in Malaya," Journal of the Malay Branch of the Royal Asiatic Society, Pt. 1, 1971.
85 Silcock, T. H., "The Economy of Malaya: Relevance of the Competitive LaissezFaire Model," in C. B. Hoover (ed.), The Economic Systems of the Commonwealth (Durham, 1961).
86 --, and E. K. Fisk (eds.), The Political Economy of Independent Malaya: A Case Study in Development (Berkeley, 1963).
87 Snodgrass, Donald R., "Trends and Patterns in Malaysian Income Distribution, 1957-70," The Center for International Affairs, Harvard University, March 1974.

MALAYSIAN RICE POLlCY 293
88 ---, "The Fiscal System as an Income Redistributor in West Malaysia," The Center for International Affairs, Harvard University, 1972.
89 Straits Settlements Government, Report of the Rice Supply of the Colony and Native States, 1891, Proceedings of Straits Settlements Legislative Council, 1893.
90 Tan Bock Thian, and T. F. Weaver, "Sources of Output of Rice Production in West Malaysia, 1951-1967," paper presented at the Agriculture Institute of Malaysia Rice Symposium, Kuala Lumpur, Aug. 8-9, 1969.
91 Thomas, John W., "Development Institutions, Projects, and Aid in the Water Development Program of East Pakistan," Pakistan Economic and Social Review, Spring 1974.
92 Van de Goor, G. A., and G. Zijlstra, The Consumptive Use of Water, the Possibilities of Double-Cropping and the Irrigation Requirements for Rice Lands in Malaya, FAO (Rome, 1963).
93 Weaver, Thomas F., "Irrigation Evaluation Under Monsoon Rainfall Patterns: A Case Study for Raipur District, Madhya Pradesh, India," Cornell International Agricultural Development Bulletin 10 (Ithaca, March 1968).
94 Welsh, Delane E., and Sop in Tongpan, "Rice in Thailand," in International Rice Research Institute, Viewpoints on Rice Policy in Asia (Los Banos, Aug. 1971).
95 Wilson, T. B., The Economics of Padi Production in North Malaya, Part I (Kuala Lumpur, 1958).
96 Yukon Huang, "Some Reflections on Padi Double Cropping in West Malaysia," Malayan Economic Review, April 1972.
97 Zahara Hj Mahmud, "The Period and Nature of 'Traditional' Settlement in the Malay Peninsula," Journal of the Malay Branch of the Royal Asiatic Society, Pt. 2, 1970.
98 Zin, U. T., Survey Report on Rice Processing in West Malaysia, 2 vols. Food Technology Division (Kuala Lumpur, 1969 and 1970).
