stanford university global climate & energy project biomass energy: the climate protective...
TRANSCRIPT

Stanford University
Global Climate & Energy Project
Biomass Energy: the Climate Protective Domain
Chris Field
[email protected]://dge.ciw.edu
Sept, 2008

2
Constraints
Food Fuel
Fossil offsets Other emissions
Energy Nature

3
Climate-protective biofuels
• Grow more plants– Without more environmental downsides
• Get more energy per unit of plant biomass
• Figure out where it does and doesn’t make sense to produce biofuels

4
Land Type
Area (Mha)
Mean NPP(ton C/ha/y)
Total NPP(Pg C/y)
Total Energy*(EJ/y)
Global Crop 1,445 4.6 6.7 119
Pasture 3,321 3.4 11.3 200
US Crop 173 5.7 1.0 18
Pasture 226 3.5 0.8 14
Global Primary Energy = 480 EJ/y* In ½ biomass (to allow for roots), assume 45% C
Energy in ag and pastures?

5
Will yields increase dramatically?
• Historical trends – a century of success– 1-2%/y for major crops
• Will this continue?– Can it accelerate?

6
Ag yields – a century of successincreases of 1-2% y-1
Lobell and Field ERL 2007

7
Extracting climate sensitivity
• First difference yield
• Define locally-weighted climate
• Regress against– Growing season tmax, tmin, precip
– Define growing season based on explained variance
• Reconstruct trend with (observed) and without (climate corrected) climate
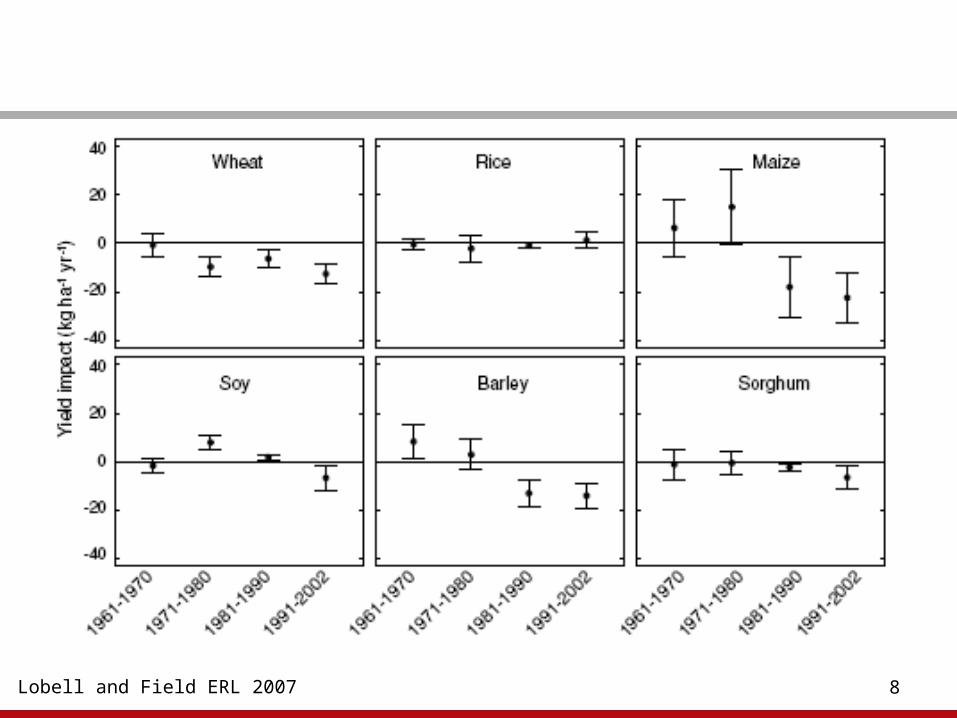
8Lobell and Field ERL 2007

9
Global area, production, and yield changesfor six major world crops
Wheat rice maize barley soybean sorghum
2002 Area (Mha) 214 148 139 55 79 42
2002 Production (Mt yr-1) 574 578 602 137 181 54
Yield change, 1981-2002 (kg/ha) 846 1109 1178 473 632 -80
Climate driven yield change, 1981-2002 (kg/ha) -60.1 -6.5 -89.5 -140.3 23.1 -20.0
Climate driven production change, 1981-2002 (Mt yr-1) -12.9 -1.0 -12.4 -7.8 1.8 -0.8

10Lobell and Field ERL 2007

11
• Ag in relation to natural NPP– Ag/NPP -- Globally about 65%
• Global average crop yields unlikely to exceed natural NPP for at least the next several decades

Field, Campbell, Lobell TREE 2008


Field et al TREE 2008
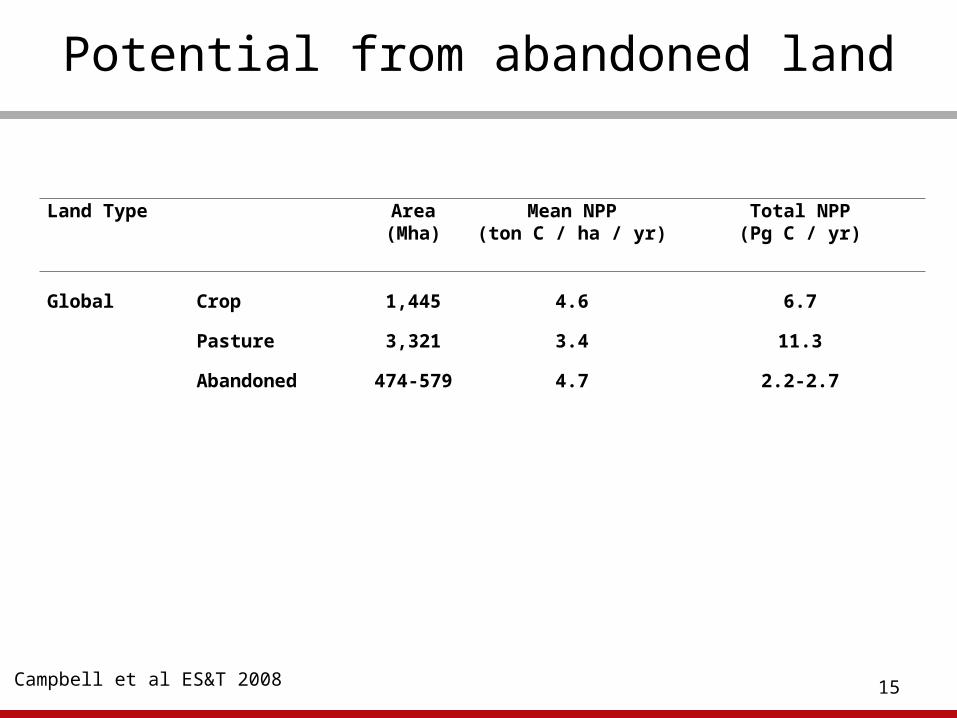
15
Land Type Area (Mha)
Mean NPP(ton C / ha / yr)
Total NPP(Pg C / yr)
Global Crop 1,445 4.6 6.7
Pasture 3,321 3.4 11.3
Abandoned 474-579 4.7 2.2-2.7
Potential from abandoned land
Campbell et al ES&T 2008

16
Land Type Area (Mha)
Mean NPP(ton C / ha / yr)
Total NPP(Pg C / yr)
Global Crop 1,445 4.6 6.7
Pasture 3,321 3.4 11.3
Abandoned 474-579 4.7 2.2-2.7
In Forest 72 6.5 0.5
In Urban 18 5.0 0.1
In Other 385-472 4.3 1.6-2.1
From available abandoned land
1.6 – 2.1 Pg C x 2 g Plant/g C x 0.5 g top/g plant x 20 EJ/Pg = 32 - 41 EJ
= 7-8% of current global energy system

17

18
Bioenergy
• Climate impact depends on pre-existing ecosystem
• Indirect as well as direct paths to carbon loss• Natural NPP reasonable proxy for potential
yield under ag management• Available land resource limited
– Quantity and quality
• Big potential in absolute terms• But a small slice of present or future demand

19
Biomass energy:the climate protective domain
• Food/Biomass energy interactions– Roz Naylor, Holly Gibbs
• Biomass in areas converted to bioenergy– Greg Asner, Scott Loarie
• Albedo feedbacks from bioenergy agriculture– David Lobell, Matt Georgescu
• Available land, potential yield, GHG balance– Chris Field, Elliott Campbell

20
Future energy needs:Many times current

21
Biomass energy
• Corn $190/ton
• Coal Power River $15/tonCentral Appalachia $149/ton
• Crude oil $820/ton

22
Ferment or burn?
0
20,000
40,000
60,000
80,000
Small Car
Midsize Car
Small SUV
Fullsize SUV
Tra
nspo
rtat
ion
Ene
rgy
(mil
es h
a-1
)
ICV City
BEV City
ICV Highway
BEV Highway
0
20,000
40,000
60,000
80,000
Small Car
Midsize Car
Small SUV
Fullsize SUV
Tra
nspo
rtat
ion
Ene
rgy
(mile
s ha
-1)
ICV City
BEV City
ICV Highway
BEV Highway
0
20,000
40,000
60,000
80,000
Small Car
Midsize Car
Small SUV
Fullsize SUV
Tra
nspo
rtat
ion
Ene
rgy
(mile
s ha
-1)
ICV City
BEV City
ICV Highway
BEV Highway
a) Corn Today b) Corn CO2 Intensive c) Cellulosic

23
Understanding deforestation
• Where is it occurring?
• Where will it occur in the future?
• What are the drivers?

PRODES deforestation matches low biomass from RADAR
PRODES not forested, 2000 RADAR low biomass, 2000

25
Large-scale patterns:Kernel approach to deforestation rate
fraction not forested, 2000fraction low biomass, 2000

26
Year-by-year deforestation
Pre-deforestation biomass (Mg ha-1)

27
Greater biomass in remaining forests