standing genetic variation and the evolution of drug
TRANSCRIPT
Standing Genetic Variation and the Evolution of DrugResistance in HIVPleuni Simone Pennings*
Harvard University, Department of Organismic and Evolutionary Biology, Cambridge, Massachusetts, United States of America
Abstract
Drug resistance remains a major problem for the treatment of HIV. Resistance can occur due to mutations that were presentbefore treatment starts or due to mutations that occur during treatment. The relative importance of these two sources isunknown. Resistance can also be transmitted between patients, but this process is not considered in the current study. Westudy three different situations in which HIV drug resistance may evolve: starting triple-drug therapy, treatment with asingle dose of nevirapine and interruption of treatment. For each of these three cases good data are available fromliterature, which allows us to estimate the probability that resistance evolves from standing genetic variation. Depending onthe treatment we find probabilities of the evolution of drug resistance due to standing genetic variation between 0 and39%. For patients who start triple-drug combination therapy, we find that drug resistance evolves from standing geneticvariation in approximately 6% of the patients. We use a population-dynamic and population-genetic model to understandthe observations and to estimate important evolutionary parameters under the assumption that treatment failure is causedby the fixation of a single drug resistance mutation. We find that both the effective population size of the virus beforetreatment, and the fitness of the resistant mutant during treatment, are key-parameters which determine the probabilitythat resistance evolves from standing genetic variation. Importantly, clinical data indicate that both of these parameters canbe manipulated by the kind of treatment that is used.
Citation: Pennings PS (2012) Standing Genetic Variation and the Evolution of Drug Resistance in HIV. PLoS Comput Biol 8(6): e1002527. doi:10.1371/journal.pcbi.1002527
Editor: Rob J. De Boer, Utrecht University, Netherlands
Received January 11, 2012; Accepted April 4, 2012; Published June 7, 2012
Copyright: ! 2012 Pennings. This is an open-access article distributed under the terms of the Creative Commons Attribution License, which permits unrestricteduse, distribution, and reproduction in any medium, provided the original author and source are credited.
Funding: This work was supported by a long-term fellowship of the Human Frontier Science Program. The funders had no role in study design, data collectionand analysis, decision to publish, or preparation of the manuscript.
Competing Interests: The authors have declared that no competing interests exist.
* E-mail: [email protected]
Introduction
For most HIV patients, treatment with modern antiretroviraltherapy leads to a rapid decline of viral load (VL) of several ordersof magnitude. However, when the virus acquires resistance to oneor more drugs, treatment can fail. It is still an open questionwhether the mutations responsible for resistance originate usuallyfrom standing genetic variation (also referred to as pre-existingmutations or minority variants), or from new mutations whichoccur during therapy. In fact, there is no single biological systemfor which the relative role of pre-existing and new mutations is wellknown [1]. Another important open question is whether multiplesimultaneous mutations are needed for the viral population to beable to grow during therapy, or whether a single mutation allowsescape. Amongst evolutionary biologists, it is commonly assumedthat therapy with multiple drugs works so well because the virusneeds multiple mutations to escape, which is unlikely to happen.However, patient data show that patients often fail therapy with asingle resistance mutation [2,3] which suggests that a singlemutation can increase the fitness of the virus to above 1, eventhough the virus is still susceptible to two of the drugs in thetreatment. In this scenario, the main benefit of combinationtherapy over monotherapy would be that combination therapyreduces the population size of the virus and therefore theprobability that mutations occur. In this study we will analyzepatient data under the assumption that a single mutation can lead
to virologic failure and thereby propose an alternative view on theevolution of drug resistance during multi-drug therapy.We will look at the establishment of drug resistance mutations in
three different situations: (1) when triple-drug therapy (ART) isstarted for the first time, (2) when pregnant women are treatedwith a single dose of nevirapine (sdNVP) to prevent infection of thebaby during birth and (3) when ART is interrupted and restarted(an overview of abbreviations is given in table 1). We will arguethat standing genetic variation plays a crucial role in each of thesecases. We find that the probability that resistance mutationsbecome established in each of these cases can be understood byusing a simple population genetic model.For readers who are not familiar with HIV, it is important to
know that the genotype-phenotype map for drug resistance in HIVis very well known. Lists of the important resistance mutations foreach drug are published (e.g., in the International AIDS Society–USA drug resistance mutations list, [4], so that doctors cancompare the genotype of the virus of a patient before treatmentwith this list to decide which drugs to prescribe. The aim oftreatment is to achieve viral suppression. If treatment fails, i.e., theviral load stays or becomes higher than a predetermined threshold,such as 50/ml, despite adherence to the regimen, a secondgenotypic test will be performed to see whether the virus hasacquired new resistance mutations. Since the second half of the1990s, treatment is usually with a combination of three drugs,which are chosen such that mutations which confer resistance
PLoS Computational Biology | www.ploscompbiol.org 1 June 2012 | Volume 8 | Issue 6 | e1002527
against one of the drugs do not confer cross-resistance against theother two drugs. Soon after its introduction, it became clear thattriple-drug therapy was an enormous success and saved the lives ofmany HIV patients [5]. One reason why therapy with three drugsworks better than treatment with one or two drugs is that the rateat which resistance evolves is slower when patients are treated withthree drugs [6]. It is commonly thought that resistance does notevolve in patients on triple-drug therapy because it would requirea viral particle to acquire three mutations at the same time.However, in patients who are treated with triple-drug therapy, it isoften observed that resistance against one of the drugs evolves, atleast initially. Data from several cohort studies in different parts ofthe world, such as from Canada [2] and the UK (UK CHICcohort study [3], clearly show that in most patients who failtherapy due to resistance, the virus is resistant against one of thedrugs and almost never against all three. The UK study, for
example, reports that out of 4306 patients who started therapybetween 1996 and 2003, after two years of therapy, 13% havedrug resistance. A majority of the patients with drug resistance(7%) have resistance against just one of the drugs. Less than half ofthe patients (6%) have resistance against more than one class ofdrugs and a only small number of patients (1%) have resistanceagainst 3 classes of drugs, even though all patients of this cohortwere treated with three classes of drugs. These data show thattreatment can fail due to resistance against one of the drugs in aregimen. In such cases, it may be that the other two drugs cannotkeep the VL completely suppressed, even though they still work.The viruses that have acquired resistance against two or threeclasses of drugs may have acquired these mutations at the sametime or they may have acquired them one by one. For now, we willassume the latter and focus only on the probability of acquiring thefirst drug resistance mutation (DRM).For many common drugs, especially reverse transcriptase
inhibitors, a single mutation can confer resistance against thedrug and only a small number of mutations is responsible forresistance in most patients. For example, resistance against thedrug nevirapine is almost always due to one of two amino acidchanges, namely K103N or Y181C in the reverse-transcriptasegene [7]. Because of the importance of a small number ofmutations, several studies have investigated whether thesemutations are present in untreated patients due to transmitteddrug resistance or due to spontaneous mutation. Recent studieshave used allele-specific PCR and related methods to determinethe frequency of several important mutations in untreated patients.Low-frequency drug resistance mutations (DRMs), likely due tospontaneous mutation (and not transmitted from other patients)were detected in up to 40% of patients (see [8] for an overview).The detection of drug resistance mutations in untreated patients,together with the knowledge that a single mutation can conferresistance against a drug and allow viral escape, suggest that pre-existing resistance mutations (or standing genetic variation in thepopulation genetic jargon) may play an important role in theevolution of drug resistance in HIV.Throughout the paper, we will assume that a single mutation
can allow viral escape and we focus on the probability that such afirst drug resistance mutation becomes established (i.e., it reachessuch a frequency that it can be expected to become the majorityvariant unless treatment is stopped or changed quickly). Whathappens after a first mutation has become established, or how fastsuch an established mutation wanes in the absence of treatmentare important questions, but they fall outside the scope of thisstudy. In this paper, ‘‘triple-drug therapy’’ and ART refer totreatment with two drugs of the class NRTI plus either an NNRTIor an unboosted PI (for a list of abbreviations in the paper, seeTable 2). The results are likely to be different for other drugcombinations.
Starting therapyWhen a patient starts therapy for the first time, one would
expect that there should be a substantial probability that drugresistance evolves due to pre-existing DRMs. Indeed, recentstudies have shown that the presence of drug resistance mutationsat low frequency (v1%) increases the risk that treatment fails (e.g.,[9],[10], [7], see [11] for a review). However, the situation is not assimple as one may hope: even if no pre-existing DRMs can bedetected, resistance mutations may become established quickly,and even if DRMs are detected, treatment is still successful in themajority of patients. We will attempt to understand thoseobservations using population genetic theory. Other authors havelooked at the question of pre-existing DRMs previously (e.g., [12],
Table 1. Abbreviations.
Abbreviation Explanation
VL Viral load, the number of viral particles per ml blood
ART Antiretroviral therapy, here used to mean treatment withtwo NRTIs and an NNRTI or an ‘‘unboosted’’ PI
PMTCT Prevention of mother to child transmission
DRM drug resistance mutation
NRTI Drug of class nucleoside reverse transcriptase inhibitor
NNRTI Drug of class non-nucleoside reverse transcriptaseinhibitor
PI Drug of class protease inhibitor, PIs can be used‘‘unboosted’’ or ‘‘boosted’’ with an additional drug.
NVP Nevirapine, an NNRTI
sdNVP Single dose nevirapine
ZDV Zidovudine, also known as AZT, an NRTI
3TC, DDI, FTC, TDF Drugs of NRTI class
PP Post partem, used here for drugs which are added tosdNVP right after the mother has given birth
doi:10.1371/journal.pcbi.1002527.t001
Author Summary
For HIV patients who are treated with antiretroviral drugs,treatment usually works well. However, the virus can, andsometimes does, become resistant against one or moredrugs. HIV drug resistance results from the acquisition ofspecific and well known mutations. It is currently unknownwhether drug resistance mutations usually stem fromstanding genetic variation, i.e., they were already presentat low frequency before treatment started, or whetherthey tend to occur during treatment. In the currentmanuscript, I make use of several large datasets andevolutionary modeling to estimate the probability thatdrug resistance mutations are present before treatmentstarts and lead to viral failure. I find that for the mostcommon type of treatment with a combination of threedrugs, drug resistance evolves from pre-existing mutationsin 6% of the patients. With other types of treatment, thisprobability varies from 0 to 39%. I conclude that there isroom for improvement in preventing the evolution of drugresistance from pre-existing mutations.
Standing Variation and Drug Resistance in HIV
PLoS Computational Biology | www.ploscompbiol.org 2 June 2012 | Volume 8 | Issue 6 | e1002527
[13]), however, it is worth reconsidering the topic. First of all, wenow have a wealth of data available for pre-existing DRMs andthe establishment of drug resistance mutations in HIV patients,and secondly, we now have a better theoretical framework toconsider the role of standing genetic variation for adaptation [14].
Prevention of mother to child transmission (PMTCT)Pregnant women in low resource settings are often treated with a
single dose of the non-nucleoside reverse transcriptase inhibitorneverapine when labor starts. Single dose nevirapine (sdNVP) is thecheapest and simplest way to reduce the probability of mother-to-child-transmission, but it is shown to lead to the establishment ofdrug resistance mutations in the mothers and the babies. In a meta-analysis [15], found that, in 7 different studies, on average 44% ofthe patients treated with sdNVP had detectable NVP resistancemutation several weeks after the treatment. The presence of suchmutations makes future treatment of these women harder [16]. Toavoid the establishment of resistance mutations, several alternativestrategies are used in combination with sdNVP. We will use thesame population genetic framework as in the other two cases to tryto understand why sdNVP leads to establishment of resistancemutations in so many patients, and how this can be avoided. In thecurrent study we will only focus on the probability that NVPresistance mutations become established during treatment forPMTCT. The issue of how these mutations wane and possiblyresurface when treatment is started again is important andinteresting but falls outside the scope of the current paper.
Treatment interruptionsIt was long suspected that treatment interruptions lead to drug
resistance. Indeed, cohort studies show that treatment interrup-tions due to non-adherence are associated with faster accumula-tion of drug resistance mutations ([17,18,19]. Clear evidence thattreatment interruptions of at least a couple of weeks lead to theestablishment of resistance mutations comes from clinical trials(e.g., [20,21,22] which were done in a time when it was believedthat treatment interruptions may be beneficial for patients. In2006 the SMART trial was stopped because treatment interrup-tions were shown to have a negative effect on patients’ health [23].However, treatment interruptions still occur, for example, when apatient is forgetful or is unable to purchase drugs due to financialor logistic barriers. It is important to understand how treatmentinterruptions lead to resistance and whether this effect can beavoided.The main idea that currently governs the thinking about
treatment interruptions and resistance is that insufficient drug-levels allow for replication and, at the same time, select forresistance (e.g., [24,25,18]. This effect is aggravated when drugsthat are part of combination therapy have very different half-lifes,so that interrupting combination therapy can result in effectivemonotherapy. It is generally believed that this ‘‘tail of monother-apy’’ is the main reason why treatment interruptions lead to drugresistance. However, several observations are not compatible withthe ‘‘tail’’ hypothesis. For example, Fox et al ([25]) found nosignificant difference in the number of resistance mutations aftersimultaneous, ‘‘staggered’’ or ‘‘switched’’ treatment interruptionsin patients from the SMART trial (a ‘‘staggered’’ stop means thatthe long half-life drug is interrupted several days before the otherdrugs and a ‘‘switched’’ stop means that before interrupting,patients switch to a regimen with only short half-life drugs). Inaddition, the ‘‘tail’’ hypothesis fails to explain why treatmentinterruptions increase the risk of resistance in patients on proteaseinhibitor-based (PI) regimens which do not have long half-lifes[26,20,27,28,29,30]. Another explanation is therefore needed tounderstand the observed patterns.When treatment is interrupted, the viral load rapidly increases
until it has reached its original level after approximately four weeks[31]. Basic population genetics tells us that such population growthalso leads to an increase in the probability that DRMs are present.When treatment is started again, selection may work on such pre-existing mutations, which provides a simple explanation for howtreatment interruptions lead to the establishment of resistancemutations.In this paper we will attempt to explain the observed patterns by
considering selection on pre-existing variation and selection onnew mutations. It is worth noting here that pre-existing does notnecessarily mean old, such a mutation may have originated just aday before the start of treatment. Throughout the paper, we use amathematical model for adaptation from standing geneticvariation which we developed previously [14] and forward-in-time, individual-based computer simulations. The model capturesmutation, drift and selection, including changing selectionpressures (due to stopping and starting of therapy) which lead tochanges in population size. Because we only focus on theestablishment of the first drug resistance mutation, we can ignoreepistatic interactions between different drug-resistance mutationsand recombination. In each of the three cases of interest, we usepublished data on the percentage of patients with established drugresistance mutations to estimate important parameter values (forstarting ART or sdNVP) and to predict outcomes (for treatmentinterruptions).
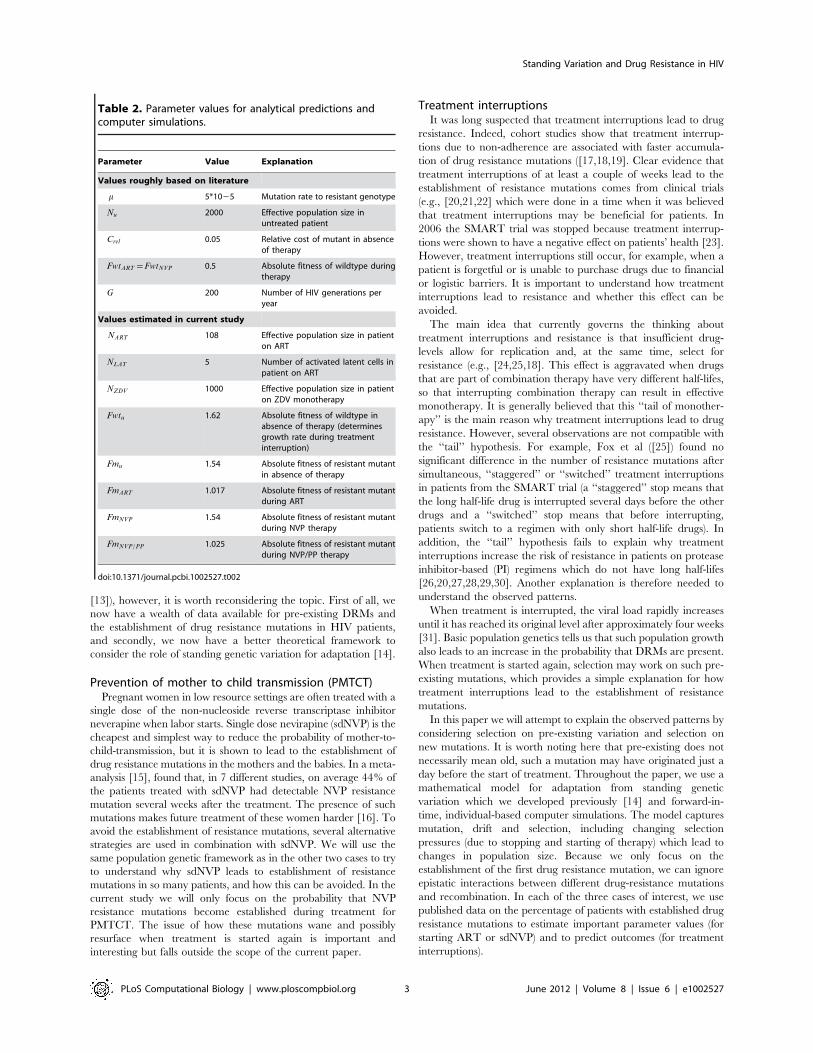
Table 2. Parameter values for analytical predictions andcomputer simulations.
Parameter Value Explanation
Values roughly based on literature
m 5*1025 Mutation rate to resistant genotype
Nu 2000 Effective population size inuntreated patient
Crel 0.05 Relative cost of mutant in absenceof therapy
FwtART~FwtNVP 0.5 Absolute fitness of wildtype duringtherapy
G 200 Number of HIV generations peryear
Values estimated in current study
NART 108 Effective population size in patienton ART
NLAT 5 Number of activated latent cells inpatient on ART
NZDV 1000 Effective population size in patienton ZDV monotherapy
Fwtu 1.62 Absolute fitness of wildtype inabsence of therapy (determinesgrowth rate during treatmentinterruption)
Fmu 1.54 Absolute fitness of resistant mutantin absence of therapy
FmART 1.017 Absolute fitness of resistant mutantduring ART
FmNVP 1.54 Absolute fitness of resistant mutantduring NVP therapy
FmNVP=PP 1.025 Absolute fitness of resistant mutantduring NVP/PP therapy
doi:10.1371/journal.pcbi.1002527.t002
Standing Variation and Drug Resistance in HIV
PLoS Computational Biology | www.ploscompbiol.org 3 June 2012 | Volume 8 | Issue 6 | e1002527

Model
Model, assumptions and fixation probability of a drugresistance mutationThe model we use in this paper describes the population
dynamics and population genetics of a panmictic viral populationin a single patient. Details of the model can be found in thesupplementary material. We assume that as long as the patient isnot treated, the viral population will be stable at population sizeNu (u for untreated). Drugs reduce the fitness of the wildtype virusto below 1 so that the population will shrink. We assume that thereis a large reservoir of latently infected cells of which a fixednumber (NLAT ) become activated per generation, so that the viruscan not die out. Drug resistant virus can be created by mutationand is assumed to be resistant against one of the drugs in thetreatment regimen. If the patient is not taking drugs, the drugresistant virus is less fit than the wildtype by a factor Crel (relativecost of the resistant virus), but if the patient is taking drugs, theresistant virus has a fitness that is higher than 1 (FmARTw1),whereas the wildtype has a fitness lower than 1 (FwtARTv1). Inreality, there may also be resistance mutations that conferresistance against one of the drugs, but that do not lead to afitness higher than 1. Such mutations will quickly die out and cansafely be ignored in the model. Throughout the paper we focus onthe the processes that allow a first major drug resistance mutationto become established in the patient. Patients are assumed to beART-naive and have no transmitted drug resistance.Evolutionary biologists have long known that most mutations
will be lost by genetic drift even if they confer a fitness benefit [32].This is also true for drug resistance mutations (DRMs) in patientson anti-retroviral therapy, although it is all too often ignored indrug resistance studies. The clinical relevance of this old result hasrecently become very clear. It was found in several studies thateven though low frequency DRMs increase the risk of treatmentfailure and establishment of drug resistance, the majority ofpatients with detected low frequency DRMs will respond well totreatment [7]. This result shows that DRMs can die out, even ifthey have reached frequencies high enough to be detected. Thereason is probably that most viral particles will not infect any newcells and produce no new viral particles, even if, on average, theyproduce more than 1.The probability that a DRM becomes established in the patient
depends on the number of copies that are present, the averagenumber of offspring of the drug resistant particles and the variancein offspring number. Traditionally, fixation or establishmentprobabilities are calculated using the relative fitness differencebetween the mutant and the wildtype, but in the case of HIV it ismore useful to use the fitness of the mutant virus to calculate itsestablishment probability. The reason is that anti-retroviraltherapy works so well that wildtype fitness may be very low(much lower than 1). In such case fitness of the mutant may not berelated to the fitness of the wildtype and because the wildtypecannot grow, the two types do not compete for resources. In otherwords, the mutant can occupy a niche that is not occupied by thewildtype. In those cases, and as long as FmART{1vv1, theestablishment probability of the mutant will be approximatelyPest&
2(FmART{1)s2 where s2 is the variance in offspring number. In
the simulations and throughout this paper, we use the varianceeffective population size, in which case one can assume that s2~1,so that
Pest&2 (FmART{1) ð1Þ
Note that by setting s2~1, we ignore all mutations which occurin virus which is not part of the effective population size. The
establishment probability of a mutation in a random viral particle(e.g., when observed in a patient) may be much lower. It isimportant to realize that if the establishment probability of a DRMdepends on its absolute fitness, anything that reduces its fitness willreduce the establishment probability. For example, if a drug that isadded to a regime reduces fitness of both wildtype and resistantvirus, then it will reduce the probability that a pre-existing resistantmutant becomes established. This is true even if the effect of theadded drug on wildtype and resistant virus is exactly the same.Similarly, if the immune system works well, this may also reducethe probability of establishment.In most population genetics models, the focus is on the fixation
probability, rather than the establishment probability of amutation. And in many models, if a mutation becomes established,it will go to fixation. However, if selection pressures change,establishment does not necessarily lead to fixation. This isespecially clear when we will later consider the effect of a single-dose of nevirapine. A few weeks after a single dose of nevirapine,nevirapine resistance mutations can be detected in a largeproportion of patients, but these mutations may never take overthe whole viral population, because the treatment duration is veryshort and wildtype virus will quickly become a majority again (seefor example, [16]). In fact, the standard results on fixationprobability [32] are really results on establishment probabilities, sowe can use them without problems.
Psgv vs. PnewFor drug resistance to evolve, the viral population needs viral
particles that carry drug resistance mutations. Such particles mayalready be present before treatment is started. To denote thispossibility we use Psgv or the probability that drug resistanceestablishes from the standing genetic variation. If the mutation isnot already present, or if was present but was subsequently lost,then the viral population has to wait for a new mutation to occurand become established. We denote this possibility as Pnew, or theprobability that resistance evolves due to new mutations. In thelatter case, we have to indicate a time window, such as per year orper generation.The goal of this study is to understand and, albeit roughly,
quantify Pnew and Psgv for HIV drug resistance in patients ontriple-drug regimes (consisting of an NNRTI or an unboosted PIplus two NRTI’s) and in patients who are treated with single dosenevirapine.
Results
Starting standard therapyWhen a patient starts anti-retroviral therapy for the first time,
the viral population in that patient will move from an equilibriumwithout drugs to an equilibrium with drugs. At the pre-treatmentequilibrium, the viral population size will at its equilibrium level(Nu), and resistance mutations are expected to be at mutation-selection-drift equilibrium, where most mutations will be present atvery low frequencies (see, e.g., [7]). Note that mutation-selection-drift equilibrium is reached quickly for mutations that are verycostly to the virus. So even though it may take years for neutraldiversity to reach an equilibrium level in an HIV patient [33],important drug resistance mutations which are 5 or 10% less fitthan the wildtype are expected to reach their (dynamic)equilibrium in weeks or months.Standard population genetic theory predicts that the average
frequency of a resistance mutation is equal to the mutation rate (m,per viral particle and per replication) divided by the relative cost(Crel ) of the resistance mutation, though drift causes actual
Standing Variation and Drug Resistance in HIV
PLoS Computational Biology | www.ploscompbiol.org 4 June 2012 | Volume 8 | Issue 6 | e1002527
frequencies to vary greatly between different time points andbetween patients (see also [34]). Even though the averagefrequency is independent of the population size, in largerpopulations, it is more likely that DRMs are present and theabsolute number of drug resistant particles will, naturally, behigher. When treatment starts, resistance mutations will confer afitness benefit to the virus and they can (but are not guaranteed to)increase in frequency and become established. The probabilitythat this happens depends on the number of resistant particles inthe population and on the establishment probability of a mutationthat is present in a single particle. In [14] we derived formulas tocalculate the probability that adaptation to a new environmenthappens from the standing genetic variation (Psgv). We will use theapproximate equation 8 in [14]:
Psgv&1{(1zFmART{1
Crel){2mNu ð2Þ
It is also possible to use the the number of resistant particles in apatient (B), if this is known, and the fitness of these copies (in theenvironment with drugs) to calculate the probability that aresistance mutation becomes established:
Psgv~1{(1{Pest)B ð3Þ
where we use the probability that all copies of the resistancemutation die out to calculate the probability that at least onesurvives. The probability that resistance mutations becomeestablished increases with the number of copies of resistant virusand the probability that any one of these survives.
Evolution of resistance during therapyIf resistance did not evolve from standing genetic variation, it
may evolve due to new mutations. The probability that thishappens in a given year will depend on the number of generations(G) in a year, the mutation rate (m), the effective population sizeduring antiretroviral treatment (NART ) and the establishmentprobability of a mutation (Pest). In principle, the establishmentprobability during therapy may not be the same as in the verybeginning of therapy, for example because the number of availablecells which a particle can infect could be different. However,throughout this paper we will assume that Pest depends only on thekind of therapy and not on how long a patient has been treated.Using a poisson approximation, we find that the per yearprobability that resistance evolves is
Pnew~1{exp ({G NART m Pest) ð4Þ
It is debated whether during therapy, there is ongoingreplication or whether a reservoir of latently infected cells isentirely responsible to residual viremia. If the reservoir reflects thecomposition of the viral population before treatment, then theexpected frequency of the resistance mutation in the reservoirwould be m
Crel. If the number of latently infected cells that become
activated every generation is NLAT , then the expected number ofactivated cells with resistant virus would be NLAT m
Crel. The per year
probability that resistance evolves due to activated cells from thereservoir would be
Pnew~1{exp ({G NLAT m Pest
Crel) ð5Þ
It is also possible that there is ongoing replication, but that thereservoir also plays a role at the same time, so that the reality willbe reflected best by a combination of equations 4 and 5. Note thatNART and NLAT are both effective population sizes, and may bemuch lower than the census population sizes.
Comparison with data and parameter estimationPublished data show that the rate of evolution of drug resistance
is roughly constant over long times (see for example the study by[3], in which patients were followed for up to eight years). This fitswith expectations if NART and Pest remain constant so that Pnew
stays constant. However, several studies show that the probabilitythat resistance mutations become established is higher in the firstyear of therapy, as compared to later years. This can be seen, forexample, in a study on a large cohort in British Columbia,especially when one considers the most adherent group of patients(figure 2 in [35], see also [17]). A similar effect is seen in [11] whenone considers the patients with pre-existing DRMs. This effect,that resistance is more likely to evolve in the first year of therapy ascompared to later years, can be easily explained by standinggenetic variation.Under the assumption that Pnew is indeed constant, we can use
published data to estimate both Pnew and Psgv. Margot et al [36]reported the number of patients in which resistance was detectedin the first, second and third year after treatment initiation in acohort of patients who were treated with NNRTI-based ART.The reported data (see table S1 in supplementary text S2) showthat the probability that resistance was detected in the first yearwas 9.5%, whereas in the second and third year it was only 3.7%(see supplementary material for details on how this was estimated).The difference of 5.8% is likely due to standing genetic variation atthe start of therapy.We will use the estimates for Pnew (0.037 per year) and Psgv
(0.058) from [36], in combination with other, published, estimatesto get a rough estimate of the important evolutionary parameters.First of all, we will assume that the mutation rate from onenucleotide to a specific other nucleotide is 10{5 [37], so that ifthere are five main resistance mutations for a given drugcombination, the total mutation rate is approximately 5|10{5.For the remainder of the paper, we will only use this total mutationrate. If the mutation rate would be higher (lower) than ourassumption, the estimated population sizes would be lower (higher)than our estimates. An overview of the parameter values we use inthe paper is given in table 2.We know that the important drug resistance mutations are at
least somewhat costly for the virus. Their cost, Crel , has beenestimated for several drug resistance mutations, both in vivo and invitro (for an overview on resistance mutations in the reversetranscriptase gene see [38]). For example, [39] find that therelative cost of resistance mutation M184V is approximately0:04{0:08. Wang et al [40] estimate a cost of 0:01{0:04 forK103N, which is the most common NNRTI resistance mutation.Other studies were not able to detect any cost of K103N, but givenits low frequency in untreated patients [7], it seems likely that it isassociated with a significant cost. In this paper we will use anaverage cost of 0:05 for all mutations.Given the cost, the mutation rate, Psgv and Pnew, and using the
assumption that there are 200 HIV generations in a year [41], wecan find the combinations of Nu, NART and FmART that arecompatible with the data (shown in figure 1). Estimates for theeffective population size in untreated patients range from 103 [42]to 105 [43]. We know that a large proportion of untreated patientscarries low frequency drug resistance mutations, but not allpatients, which gives us some additional information about the
Standing Variation and Drug Resistance in HIV
PLoS Computational Biology | www.ploscompbiol.org 5 June 2012 | Volume 8 | Issue 6 | e1002527

population size in an untreated patient (see figure 1b). If we choosea value of Nu of 2|103, then we find that about half of thepatients should carry pre-existing DRMs. This is somewhat higherthan what is usually detected, but that can be due in part to thelimits of detection of current tests [8]. An overview of theparameter estimates that were used in the simulations and foranalytical predictions can be found in table 2.Given our choice of Nu, we find that FmART must be
approximately 1:017, leading to Pest&0:034. Under the assump-tion Pest stays the same during treatment, the Margot et al data arecompatible with a 18-fold reduction of the effective population sizedue to therapy, to an effective population size of NART&108 .Note however, that the estimate of a 18-fold reduction dependsheavily on the assumption that Crel~0:05 . For example, had weassumed a 10% cost, then the estimated reduction would havebeen 37-fold , and for a 1% cost, the reduction would have beenonly 4-fold . The reason is that if we assume that costs are high,then we must also assume that the mutant fitness (FmART ) isrelatively high, in order to find Psgv~0:06, and if FmART is high,NART must be low, to explain Pnew~0:037.If the evolution of resistance during therapy is not due to
ongoing replication, but due to continuous activation of latentcells, then, under the assumption that Crel~0:05, the effectivenumber of cells (NLAT ) must be approximately 5 per generation.This means a reduction of effective population size of almost 400-fold. However, it is not so clear whether in this case the word‘‘population size’’ should still be used, because the number 5 is notan estimate of the size of the reservoir, but an estimate of theeffective size of the part of the reservoir that is reactivated everygeneration.The result that the frequency of resistance mutations in the
reservoir depends on their fitness cost ( mCrel
), whereas the cost doesnot play a role for new mutations due to ongoing replication, couldbe harnessed to estimate the relative importance of the reservoir. Ifthe reservoir is the most important source of resistance mutationsduring therapy, then the same set of mutations should be found inpatients whose virus acquires resistance quickly after the start oftherapy and in those who acquire mutations during therapy.However, if ongoing replication is the source of resistancemutations during therapy, then mutations with a high cost inthe absence of drugs should occur relatively more often duringtherapy than quickly after therapy is started.The data and the results from simulations and predictions (using
equations 2 and 4) are shown in figure 2. The percentage ofpatients with resistance after one year is lower in the simulationsthan in the analytical predictions, because in the simulations, ittakes time for a mutation to increase in frequency and be detected.We assume that it is detected as soon as it is more frequent thanthe wildtype, the result is that in the simulations (and probably inreality) Pnew is lower in the first year than in the other two years. Itis unclear how large this effect is in reality, but it means that the6% we find is a conservative estimate of the role of standinggenetic variation. If it would take 3 months for a mutation toincrease in frequency and become detected, then Pnew in year 1would be 75% of its value in the later years, and Psgv would beapproximately 7% in stead of 6%.
Single-dose nevirapine for prevention ofmother-to-child-transmissionA single dose of nevirapine (sdNVP) just before labor starts
reduces the risk that a mother transmits HIV to her baby at birth,but leads to high levels of resistance in many women. Because ofthe long half life of nevirapine, even a single dose lasts at least afew days. However, this is a very short amount of time (only a few
HIV generations) so that probably most or all detected NVPresistance mutations are due to standing genetic variation.Because it is known that sdNVP can lead to the establishment of
resistance mutations, and also to further reduce the risk that thebaby becomes infected with HIV, several different treatmentstrategies are being used. In this study, we focus only on thosestrategies that include a single dose of nevirapine (and exclude, forexample, pregnancy limited triple-drug therapy). Basically, sdNVPcan be combined with either a short course of zidovudinemonotherapy during the third trimester of pregnancy (ZDV/sdNVP), or it can be combined with additional drugs during andafter labor up to one month postpartum (sdNVP/PP). It can alsobe used alone (sdNVP) or combined with both (ZDV/sdNVP/PP),resulting in four possible strategies.Under the assumption that all resistance is due to standing
genetic variation, it is straightforward to predict, at leastqualitatively, the effect of the four treatment options. Single dosenevirapine plus two additional drugs (sdNVP/PP) is a three drugregimen, and similar to standard antiretroviral therapy (ART),except that it only lasts a few days or weeks. We therefore expectsimilar levels of drug resistance due to standing genetic variation.If only NVP resistance is considered (and not resistance to theother two drugs), we expect to find somewhat lower levels than inthe normal case, although the difference may not be large becauseresistance against NVP is more common than resistance to mostother drugs. Treating with only sdNVP is different from startingART, in that there is only one drug. The result is that the fitness ofboth wildtype and resistant virus will not be reduced as much as inthe normal case. Specifically, NVP resistant virus will have arelatively high fitness during NVP monotherapy. This high fitness(FmNVP) leads to a high establishment probability (Pest) foravailable resistance mutations. In fact, the establishment proba-bility may be so high that in virtually all patients that carry some
Figure 1. Probability of detecting resistance per year oftreatment. The probability that resistance is detected for the firsttime in the first, second or third year of treatment, given that it was notdetected until then. Grey bars are the estimates from the Margot et al([36]) dataset, and the number of patients on which the estimates arebased are noted at the top of the graph. The red dashed area reflectsthe inferred probability that resistance mutations from standing geneticvariation become established. The black squares are values calculatedusing equations 2 and 4. The red circles are estimated from 1000simulations. Parameters as in table 2.doi:10.1371/journal.pcbi.1002527.g001
Standing Variation and Drug Resistance in HIV
PLoS Computational Biology | www.ploscompbiol.org 6 June 2012 | Volume 8 | Issue 6 | e1002527

NVP resistance before treatment, the resistant virus will increase infrequency during NVP treatment.An interesting treatment option is to start with a few weeks of
ZDV monotherapy before treating with a single dose ofnevirapine. The ZDV treatment will reduce the population sizeof the virus, Nu, so that the probability that NVP resistance isavailable and the copy number of such resistant mutants if they areavailable will be lower by the time the patient is treated with NVP.ZDV monotherapy ultimately leads to ZDV resistance, but therisk that resistance mutations become established during a shortcourse is small. ZDV monotherapy reduces the viral loadapproximately three-fold [44]. Finally, adding ZDV treatmentbefore labor and two additional drugs during and after labor(ZDV/sdNVP/PP) will reduce both the availability of NVPresistant virus and the establishment probability of such virus,which should lead to an even lower probability that NVPresistance mutations from standing genetic variation becomeestablished.
Comparison with data for single dose nevirapineWe identified 23 published studies that reported on NVP
resistance 6 to 8 weeks after women were treated with sdNVP.Several of the studies directly compared two different treatmentoptions. We found at least three studies for each of the fourdifferent treatment options. An overview of the studies can befound in table S2 in the supplementary text S2. For each study werecorded which of the four treatment options was used and in howmany of the patients NVP resistance mutations were detectedusing simple Sanger (population) sequencing (we excluded studiesthat only recorded deep-sequencing or allele-specific PCR results,as there were too few of those to allow us to compare the treatmentoptions). For each of the four treatment options, we also calculatedthe overall probability that resistance mutations were detected in apatient (simply by summing the number of patients with resistanceand summing the total number of patients in the studies). Wefound that sdNVP leads to detectable resistance mutations in 39%of 952 patients, ZDV/sdNVP leads to detectable resistancemutations in 22% of 888 patients, adding two drugs during andafter labor (sdNVP/PP) lead to detectable resistance mutations in7.8% of 372 patients and ZDV/sdNVP/PP lead to detectableresistance mutations in none of 292 patients (see figure 3).We now used these data, in combination with our previous
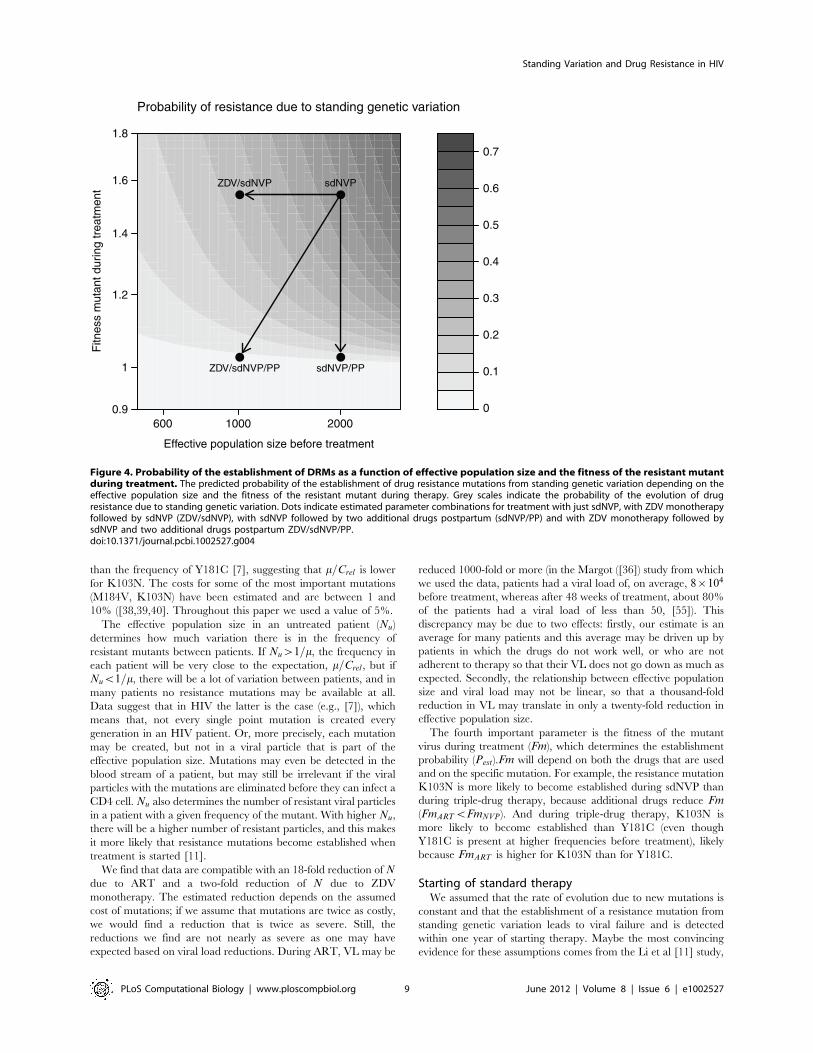
parameter estimates, to estimate the fitness of a NVP resistantmutant during NVP therapy (FmNVP) and the reduction of thepopulation size due to ZDV treatment (NZDV ). We find thatFmNVP&1:54 and that ZDV reduces the effective population sizeapproximately two-fold (table 2 and figure 4). The results showthat a reduction in population size by ZDV monotherapy doesreduce the probability that NVP resistance mutations becomeestablished, but adding two drugs to sdNVP helps much more. Wealso estimate the fitness of the mutant during therapy withnevirapine and two additional drugs and find a slightly highervalue than our previous estimate (1:025 vs 1:017), though thesedifferences are not statistically significant.
Interruption of therapyDuring a treatment interruption, drugs are first removed from
the body, which can take from a couple of hours to a several daysor even weeks ([45,46,47]. With some delay, depending on thehalf-life of the drugs, the viral population begins to grow, which isobserved as an increase of viral load (see figure 5). Published datashow that after treatment is stopped, viral load quickly increases inalmost all patients (e.g., [2]. Davey et al [31] show that averageviral load plateaus four weeks after treatment is interrupted.
Garcia et al [48] and Trkola et al ([49]) both report that a plateauis reached between four and eight weeks after treatmentinterruptions. An interruption is ended when treatment is startedagain and viral load goes down, hopefully to undetectable levels.Figure 1 shows a cartoon of the pharmacodynamics andpopulation dynamics of a treatment interruption.
Restarting therapyIf the length of a treatment interruption is so long that the
population size is back to pretreatment level and mutation-selection-drift equilibrium is again reached, the probability thatresistance mutations become established when therapy is startedagain will equal the probability that resistance mutations becomeestablished the first time a patient starts treatment, Psgv fromequation 2. But if a treatment interruption is shorter than that, it is
Figure 2. Possible combinations of population size and fitnessand the effect of population sizes on the probability that DRMsare present before treatment. Figure 2a: Continuous line:combinations of population size before treatment (Nu) and fitness ofmutant virus during therapy (FmART ) that lead to the observedprobability that resistance mutations from standing genetic variationbecome established (Psgv~0:058). Dashed line: combinations ofpopulation size during treatment (NART ) and fitness of mutant virusduring therapy (FmART ) that lead to the observed probability thatresistance mutations from standing genetic variation become estab-lished (Psgv~0:058). Open dot: Nu~2000 and FmART~1:017, closeddot: NART~108, FmART~1:017. Figure 2b: Probability that a patienthas any pre-existing DRMs before the start of therapy for differentpopulation sizes, and m~5|10{5. Open dot: Nu~2000.doi:10.1371/journal.pcbi.1002527.g002
Standing Variation and Drug Resistance in HIV
PLoS Computational Biology | www.ploscompbiol.org 7 June 2012 | Volume 8 | Issue 6 | e1002527

hard to calculate the exact probability that resistance will evolveupon re-initiation of therapy because neither population-dynamic,nor population-genetic equilibrium will have been reached. Theabsence of the population-genetic equilibrium is most problematicif resistance mutations are not very costly to the virus. However,for a costly mutation it takes only on the order of 1=Crel
generations to reach mutation-selection-drift equilibrium. Theabsence of population-dynamic equilibrium is less problematic,because it is relatively easy to predict the population size of thevirus or to measure viral load. In the simulations, we allow thepopulation to grow exponentially until it reaches the baseline level.The resulting population size can be plugged into equation 2 to getan estimate of the probability that resistance mutations becomeestablished due to a treatment interruption.
Comparison with data for treatment interruptionsUsing the parameter values from the last two sections, we can
predict the risk that resistance mutations become established dueto a treatment interruption of a certain length. We use theestimated fitness of the mutant virus during NVP therapy, andassume that the fitness of the mutant in absence of drugs is thesame. With that value, we can calculate the fitness of the wildtypein the absence of drugs, because of the assumption that the cost ofthe resistance mutation is 5%. The wildtype fitness will determinehow fast the virus grows in the simulations after treatment isinterrupted, and therefore how long it takes before the populationsize is back at the pretreatment level. Specifically, we useFwt~1:62. In the simulations, the population size plateaus afterjust 14 days, but Psgv reaches its expected value only after 60 days(figure 6).We collected information from structured treatment interrup-
tion trials to test the predictions. The probability that resistancemutations become established due to a single treatment interrup-tion was estimated for seven clinical trials with different lengths oftreatment interruptions [50,22,51,52,53,54,20]. An overview ofthe trials can be found in table S3 in text S2 (supplementarymaterial). We first calculated the risk under the assumption that allobserved resistance was due to treatment interruptions and thensubtracted the estimated probability that resistance mutationsbecome established during therapy. The corrected values areshown in figure 6. The data show that longer treatmentinterruptions indeed lead to a higher risk of resistance. The riskplateaus around 37 days, which is consistent with the time it takesfor viral load to reach its equilibrium level (although thesimulations suggest that the risk should plateau later than thepopulation size). The highest risk was found to be approximately6% per interruption, just like the risk of starting therapy for thefirst time.
Discussion
The main aim of our study was to understand and quantify theimportance of standing genetic variation for the evolution of drugresistance in HIV. We find that the probability that at least oneresistance mutation becomes established due to standing geneticvariation (Psgv) depends on the kind of treatment chosen. Mostclearly, it is much higher when treatment is with sdNVP (which ismonotherapy) than if treatment is with triple-drug combinationtherapy. For standard combination therapy (ART), we use twodifferent data sources to estimate the probability that resistancemutations from standing genetic variation become established. Inthe first part of this paper we used data on the number of patientsin which resistance was detected in the first year of treatmentversus later years. In the third part of this paper we used data from
clinical trials on treatment interruptions. In both cases, we foundthat the probability that resistance mutations from standinggenetic variation became established was approximately 6%.The importance of new mutations as compared to pre-existing
mutations could be estimated from the Margot et al ([36]) study.We estimated that the probability that a resistance mutationbecomes established during therapy (Pnew) is 3.7% per year, whichmeans that pre-existing mutations and new mutations are equallyimportant after about one-and-a-half year of treatment. Two ofthe interruption studies also provided estimates for Pnew, whichwere slightly higher (4.3% and 4.8% per year) than the estimatefrom the Margot et al [36] study (see table S3 in text S2). It is likelythat some of the patients in these studies were not perfectlyadherent to treatment, so that our estimate of Pnew is inflated bypatients who interrupted treatment. This does not affect ourestimates of Psgv. However, it means that the relative importanceof pre-existing mutations is highest in completely adherent patients(because new mutations are relatively unimportant for them) andlower in non-adherent patients (see [7] but see [11]).A stochastic model was used to understand the effect of standing
genetic variation on the evolution of drug resistance during HIVtreatment. Four parameters are crucial to understand the role ofstanding genetic variation. Three of them determine the amountof genetic variation that is available (effective population size,mutation rate and cost of the resistance mutations) and onedetermines how likely it is that the available mutations becomeestablished (the absolute fitness of the resistant virus duringtreatment).The cost and the mutation rate are parameters that are different
for each specific mutation. Together, they determine the expectedfrequency of the mutant in an untreated patient. For example, inuntreated patients the frequency of K103N was found to be lower
Figure 3. The probability that resistance mutations aredetected in women treated for prevention of mother-to-childtransmission. The probability that resistance mutations are detected 6to 8 weeks after treatment with single dose nevirapine. Black crossesare data from single studies, grey bars with estimated standard error arepercentages for all studies combined (the number of patients that wereused to calculate this percentage is indicated at the top of the graph).Red circles with standard error are results from 1000 simulations andthe black squares are analytical predictions. Parameter values as intable 2.doi:10.1371/journal.pcbi.1002527.g003
Standing Variation and Drug Resistance in HIV
PLoS Computational Biology | www.ploscompbiol.org 8 June 2012 | Volume 8 | Issue 6 | e1002527
than the frequency of Y181C [7], suggesting that m=Crel is lowerfor K103N. The costs for some of the most important mutations(M184V, K103N) have been estimated and are between 1 and10% ([38,39,40]. Throughout this paper we used a value of 5%.The effective population size in an untreated patient (Nu)
determines how much variation there is in the frequency ofresistant mutants between patients. If Nuw1=m, the frequency ineach patient will be very close to the expectation, m=Crel , but ifNuv1=m, there will be a lot of variation between patients, and inmany patients no resistance mutations may be available at all.Data suggest that in HIV the latter is the case (e.g., [7]), whichmeans that, not every single point mutation is created everygeneration in an HIV patient. Or, more precisely, each mutationmay be created, but not in a viral particle that is part of theeffective population size. Mutations may even be detected in theblood stream of a patient, but may still be irrelevant if the viralparticles with the mutations are eliminated before they can infect aCD4 cell. Nu also determines the number of resistant viral particlesin a patient with a given frequency of the mutant. With higher Nu,there will be a higher number of resistant particles, and this makesit more likely that resistance mutations become established whentreatment is started [11].We find that data are compatible with an 18-fold reduction of N
due to ART and a two-fold reduction of N due to ZDVmonotherapy. The estimated reduction depends on the assumedcost of mutations; if we assume that mutations are twice as costly,we would find a reduction that is twice as severe. Still, thereductions we find are not nearly as severe as one may haveexpected based on viral load reductions. During ART, VL may be
reduced 1000-fold or more (in the Margot ([36]) study from whichwe used the data, patients had a viral load of, on average, 8|104
before treatment, whereas after 48 weeks of treatment, about 80%of the patients had a viral load of less than 50, [55]). Thisdiscrepancy may be due to two effects: firstly, our estimate is anaverage for many patients and this average may be driven up bypatients in which the drugs do not work well, or who are notadherent to therapy so that their VL does not go down as much asexpected. Secondly, the relationship between effective populationsize and viral load may not be linear, so that a thousand-foldreduction in VL may translate in only a twenty-fold reduction ineffective population size.The fourth important parameter is the fitness of the mutant
virus during treatment (Fm), which determines the establishmentprobability (Pest).Fm will depend on both the drugs that are usedand on the specific mutation. For example, the resistance mutationK103N is more likely to become established during sdNVP thanduring triple-drug therapy, because additional drugs reduce Fm(FmARTvFmNVP). And during triple-drug therapy, K103N ismore likely to become established than Y181C (even thoughY181C is present at higher frequencies before treatment), likelybecause FmART is higher for K103N than for Y181C.
Starting of standard therapyWe assumed that the rate of evolution due to new mutations is
constant and that the establishment of a resistance mutation fromstanding genetic variation leads to viral failure and is detectedwithin one year of starting therapy. Maybe the most convincingevidence for these assumptions comes from the Li et al [11] study,
Figure 4. Probability of the establishment of DRMs as a function of effective population size and the fitness of the resistant mutantduring treatment. The predicted probability of the establishment of drug resistance mutations from standing genetic variation depending on theeffective population size and the fitness of the resistant mutant during therapy. Grey scales indicate the probability of the evolution of drugresistance due to standing genetic variation. Dots indicate estimated parameter combinations for treatment with just sdNVP, with ZDV monotherapyfollowed by sdNVP (ZDV/sdNVP), with sdNVP followed by two additional drugs postpartum (sdNVP/PP) and with ZDV monotherapy followed bysdNVP and two additional drugs postpartum ZDV/sdNVP/PP.doi:10.1371/journal.pcbi.1002527.g004
Standing Variation and Drug Resistance in HIV
PLoS Computational Biology | www.ploscompbiol.org 9 June 2012 | Volume 8 | Issue 6 | e1002527

where their figure 2 shows that (1) patients without detected pre-existing DRMs show a constant rate of evolution of resistance and(2) patients with detected pre-existing DRMs show an increasedrate compared to the patients without pre-existing DRMs, butonly in the first year of treatment. We used these assumptions toestimate the probability that resistance mutations from standinggenetic variation become established. However, the estimated roleof standing genetic variation may be a slight underestimate,because establishment of new mutations should need some time sothat Pnew would normally be somewhat lower in the first year oftreatment. The observation that the effect of standing geneticvariation only lasts a year, means that fixation of a resistancemutation must take less than a year. This limits possible values forNART and FmART to such values for which the fixation time is lessthan 200 generations.If resistance indeed evolves due to standing genetic variation in
6% of patients on standard ART, then there is clearly room forimprovement. Note that those 6% of patients have already losttheir first treatment option shortly after having started treatment.They have to switch to second-line treatment which is moreexpensive, usually more complicated (more pills per day) and likelyhas more side effects. It is therefore worth exploring ways to avoidthe establishment of resistance mutations from standing geneticvariation. Figure S2 suggests two options to reduce Psgv, by
reducing the population size or by reducing the fitness of theresistant mutants. The first may be achieved by ZDV monother-apy, as shown in the section on PMTCT, whereas the second maybe achieved by adding additional drugs to the treatment.Obviously, triple-drug combination treatment is already standardfor most HIV patients, but it may be worth considering specificallywhich treatment options would be best to prevent the evolution ofresistance from standing genetic variation. This may mean, forexample, to add a fourth drug to the therapy in the first couple ofweeks of treatment. Resistance to boosted PI’s is very uncommon,so they may be a good choice for starting treatment, incombination with two or three other drugs.
Resistance due to sdNVPStudying treatment with a single dose of nevirapine gives us a
unique opportunity to study the effect of standing geneticvariation, because treatment is so short (only a few HIVgenerations) that we can assume that most or all resistancemutations that are detected are from standing genetic variation.Data show that the risk that resistance mutations becomeestablished due to such treatment is very high (39%). We findthat this high probability can be explained entirely by selection onpre-existing drug resistance mutations, because the fitness of NVPresistant virus is probably very high during NVP monotherapy.We estimate that its fitness is approximately 1.5. The probabilitythat a resistance mutation becomes established can be reduced byeither adding additional drugs to lower the fitness or by loweringthe population size so that fewer mutants are available. A studyfrom Zambia [56] showed that the additional drugs even help toreduce the establishment of NVP resistance mutations consider-ably if the additional drugs are given as a single dose (in stead oftreatment for a couple of days or weeks). We did not include thisstudy in the overview, because there was only one study thatlooked at this treatment option.The results on ZDV/sdNVP/PP treatment (i.e., treatment with
ZDV during pregnancy and NVP plus two other drugs duringlabor) are surprising in that NVP resistance mutations were notdetected in any of the women who received this treatment, eventhough the model would predict that mutations would be detectedin 4% of the women. Most of the data on this treatment option arefrom the Lallemant [57] paper (222 women). In this study, theauthors do find some mutations that confer resistance to theNRTI’s in the study (in 2.3% of the women). The same study alsolooked at women who were treated with ZDV/sdNVP and also inthese women the percentage with resistance mutations was verylow (6.4%) and much lower than the mean value for women whoreceive this treatment (22%). The reason for the surprisingly lowvalues of drug resistance in this study could be that the women inthe study had very low viral loads (median 2800). This probablyalso means that they have a low effective population size. Ittherefore seems unlikely that the extremely good results from theLallemant study [57] can be replicated in other populations.However their results still show that using additional drugs toreduce the population size and to reduce the fitness of the mutantmay be a good strategy to reduce the probability that resistancebecomes established.
Treatment interruptionsConsidering treatment interruptions, our model provides several
testable predictions. 1) resistance mutations are more likely tobecome established after long treatment interruptions when viralloads are higher, 2) the risk that resistance mutations becomeestablished due to a treatment interruption can not be larger thanthe risk at the start of treatment, 3) treatment interruptions
Figure 5. Drug level and population size during and after atreatment interruption. Drug level (dashed line) and viral populationsize (solid line) during and after a treatment interruption. Red barsindicate when drugs are taken.doi:10.1371/journal.pcbi.1002527.g005
Standing Variation and Drug Resistance in HIV
PLoS Computational Biology | www.ploscompbiol.org 10 June 2012 | Volume 8 | Issue 6 | e1002527

increase the risk of establishment of resistance mutations even fordrugs with short half-lifes.Data from seven clinical trials show that indeed, longer
interruptions increase the probability that resistance mutationsbecome established (figure 6). Moreover, the estimated probabilityappears to plateau after 37 days, which is similar to the time ittakes for viral load to reach its pretreatment level. This suggeststhat the risk of establishment of resistance mutations is directlylinked to the viral load when treatment is started again. Thesecond prediction was also found to hold: the estimated risk thatresistance mutations from standing genetic variation becomeestablished at the start of treatment was found to be similar to therisk due to a long treatment interruption (6% in both cases). Thethird prediction also holds, as data show that interruptionsincrease the risk of establishment of resistance mutations evenfor PI based treatment [20,51], where the ‘‘tail of monotherapy’’cannot explain the observations.A potential problem with the data is that not only the length of
the interruptions, but also the length of treatment periods betweenthe interruptions differed between the seven studies. The trials thatwere compared also differed in the drugs that were used (see tableS3 in text S2), which makes direct comparison difficult. Despite allthese limitations, it becomes clear that longer interruptions carry ahigher risk of evolution of resistance than shorter interruptions.If interruptions lead to the establishment of resistance mutations
only due to the ‘‘tail of monotherapy’’, as is usually assumed in theHIV literature [24,25,18], we would predict that: 4) treatmentinterruptions increase the risk that resistance mutations becomeestablished only for drugs with long half-lifes, 5) the risk thatresistance mutations become established due to a treatment
interruption is unrelated to the risk at the start of treatment and 6)the largest risk would be due to an interruption with a length thatis exactly the time it takes for the last drug to lose its effect on thewildtype virus. All of these predictions do not hold. This is not tosay that the ‘‘tail of monotherapy’’ is not important at all. But itdoes show that on its own, the ‘‘tail of monotherapy’’ cannotexplain the risk that resistance mutations become established dueto treatment interruptions. When one considers possible interven-tion strategies, this may be good news. If treatment interruptionsare risky because of restarting rather than stopping therapy, thiswould give doctors a possibility to reduce the risk that resistancemutations become established even after a patient has alreadystopped taking his or her drugs. The establishment of resistancemutations at re-initiation of treatment may be avoided bypretreatment (such as with ZDV) to reduce the availability ofmutations or by using more drugs or higher doses in the first weeksof treatment to reduced the establishment of pre-existingmutations.
General remarksWe have used a population-dynamic and population-genetic
model to study several patterns of drug resistance in HIV. Themodel explains why resistance mutations are likely to becomeestablished in the first year of standard treatment, in women whoare treated with a single dose of nevirapine and in patients whointerrupt treatment. In all three cases, standing genetic variationcan explain the observations.Our results illustrate that for adaptive evolution to happen,
selection and the creation of new variation need not happen at thesame time, if selection can work on standing genetic variation. In
Figure 6. The relationship between the length of a treatment interruption and the probability that DRMs become established.Estimated probability that resistance mutations become established due to a single treatment interruption. Grey bars are data from seven clinicaltrials, z={ estimated standard error (see supplementary table S3 in text S2). The number of patients (and the number of interruptions per patient)are noted at the top of the graph. The red circles are estimated from 1000 simulations, z={ estimated standard error. The black squares arepredictions using the average population size from the simulations and equation 2. Parameters as in table 2.doi:10.1371/journal.pcbi.1002527.g006
Standing Variation and Drug Resistance in HIV
PLoS Computational Biology | www.ploscompbiol.org 11 June 2012 | Volume 8 | Issue 6 | e1002527
the case of antiretroviral treatment, this means that insufficientdrug levels (which allow for replication and selection at the sametime) are not a necessary condition for the evolution of drugresistance. This result about time-heterogeneous drug levels issimilar to the result on heterogeneity in space by Kepler andPerelson [58], who showed that genetic variation may be createdin compartments where drugs cannot penetrate whereas selectionhappens in other compartments.Our model provides a simple and quantitative explanation for
why resistance is less likely to evolve when patients are treated withmultiple drugs in stead of just one drug. Additional drugs reducethe fitness of a mutant that is resistant against one drug, andtherefore the establishment probability of such a resistant mutant.In addition, additional drugs reduce the population size of thevirus and thereby the creation of new resistance mutations. Thismeans that there will be fewer resistance mutations with lowerestablishment probabilities, together leading to a strong reductionin the probability that resistance evolves. In newer therapies withboosted PIs, drug resistance has become very rare [3], which maybe because boosted PIs are so strong that no single mutation canlift the virus’ fitness above 1.The model in this study may be relevant to other diseases than
HIV. For example, the evolution of resistance is a problem inchronic myeloid leukemia (CML) which is a cancer of white bloodcells. A recent study suggested that the probability that drugresistance evolves in CML goes down with time because thepopulation size of the cancer goes down with time [59].Resistance is also a problem in tuberculosis (TB), and in TB it is
also known that treatment interruptions increase the risk ofevolution of resistance [60]. This effect may also be due to anincreased population size during the interruptions. In general,stopping treatment may be risky in cases where treatment has tobe started again, which is always the case for HIV and often forTB. Each time therapy is started, resistance mutations fromstanding genetic variation may become established, and even if
this risk is only a few percent it adds up quickly when patientsinterrupt treatment regularly.
Supporting Information
Text S1 Description of the model, the simulations, thecalculation of the fixation probability and the data that were usedfor the analysis.(PDF)
Text S2 Text S2 includes tables S1, S2, S3. Table S1: Numberof patients with at least one resistance mutation detected by theend of the first, second and third year of NNRTI-basedantiretroviral therapy. Data from [36] Table S2: Overview ofclinical trials which used single dose nevirapine treatment toprevent mother-to-child transmission and which reported thenumber of patients with nevirapine resistance detected 6 to 8weeks after treatment. Table S3: Overview of clinical trials withstructured treatment interruptions which reported the number ofpatients with at least one drug resistance mutation detected.(PDF)
Text S3 Computer code, written in C++, which was used to runthe simulations, as used for figures 1, 3 and 6.(TXT)
Acknowledgments
I would like to thank Marijn van Ballengooijen, Sebastian Bonhoeffer, JohnCoffin, Andreas Gros, Joachim Hermisson, Sergey Kryazhimskiy, DanKuritzkes, Rebecca Meredith, Igor Rouzine, George Shirreff, JohnWakeley and Meike Wittmann for fruitful discussions.
Author Contributions
Conceived and designed the experiments: PSP. Performed the experi-ments: PSP. Analyzed the data: PSP. Contributed reagents/materials/analysis tools: PSP. Wrote the paper: PSP.
References
1. Barrett RDH, Schluter D (2008) Adaptation from standing genetic variation.Trends Ecol Evol 23: 38–44.
2. Harrigan PR, Whaley M, Montaner JS (1999) Rate of HIV-1 RNA reboundupon stopping antiretroviral therapy. AIDS 13: F59–F62.
3. Cozzi-Lepri A, Dunn D, Pillay D, Sabin CA, Fearnhill E, et al. (2010) Long-term probability of detecting drug-resistant hiv in treatment-naive patientsinitiating combination antiretroviral therapy. Clin Infect Dis 50: 1275–1285.
4. Johnson V, Brun-Vezinet F, Clotet B, Guenthard H, Kuritzkes D, et al. (2010)Update of the drug resistance mutations in HIV-1: December 2010. Top HIVMed 18: 156–63.
5. Mocroft A, Vella S, Benfield TL, Chiesi A, Miller V, et al. (1998) Changingpatterns of mortality across europe in patients infected with hiv-1. Lancet 352:1725–1730.
6. Deeks SG, Smith M, Holodniy M, Kahn JO (1997) Hiv-1 protease inhibitors - areview for clinicians. JAMA 277: 145–153.
7. Paredes R, Lalama CM, Ribaudo HJ, Schackman BR, Shikuma C, et al. (2010)Pre-existing minority drug-resistant hiv-1 variants, adherence, and risk ofantiretroviral treatment failure. J Infect Dis 201: 662–671.
8. Gianella S, Richman DD (2010) Minority variants of drug-resistant hiv. J InfectDis 202: 657–666.
9. Johnson JA, Geretti AM (2010) Low-frequency hiv-1 drug resistance mutationscan be clinically significant but must be interpreted with caution. J AntimicrobChemother 65: 1322–1326.
10. Geretti AM, Fox ZV, Booth CL, Smith CJ, Phillips AN, et al. (2009) Low-frequency k103n strengthens the impact of transmitted drug resistance onvirologic responses to first-line efavirenz or nevirapine-based highly activeantiretroviral therapy. J Acquir Immune Defic Syndr 52: 569–573.
11. Li JZ, Paredes R, Ribaudo HJ, Svarovskaia ES, Metzner KJ, et al. (2011) Low-frequency hiv-1 drug resistance mutations and risk of nnrti-based antiretroviraltreatment failure a systematic review and pooled analysis. JAMA 305:1327–1335.
12. Bonhoeffer S, Nowak MA (1997) Pre-existence and emergence of drug resistancein hiv-1 infection. Proc Biol Sci 264: 631–637.
13. Ribeiro RM, Bonhoeffer S, Nowak MA (1998) The frequency of resistantmutant virus before antiviral therapy. AIDS 12: 461–465.
14. Hermisson J, Pennings PS (2005) Soft sweeps: Molecular population genetics ofadaptation from standing genetic variation. Genetics 169: 2335–2352.
15. Arrive E, Newell ML, Ekouevi DK, Chaix ML, Thiebaut R, et al. (2007)Prevalence of resistance to nevirapine in mothers and children after single-doseexposure to prevent vertical transmission of hiv-1: a meta-analysis.Int J Epidemiol 36: 1009–1021.
16. Lockman S, Hughes MD, McIntyre J, Zheng Y, Chipato T, et al. (2010)Antiretroviral therapies in women after single-dose nevirapine exposure.N Engl J Med 363: 1499–1509.
17. Tam LWY, Chui CKS, Brumme CJ, Bangsberg DR, Montaner JSG, et al.(2008) The relationship between resistance and adherence in drug-naiveindividuals initiating haart is specific to individual drug classes. J AcquirImmune Defic Syndr 49: 266–271.
18. Gardner EM, Hullsiek KH, Telzak EE, Sharma S, Peng G, et al. (2010)Antiretroviral medication adherence and class-specific resistance in a largeprospective clinical trial. AIDS 24: 395–403.
19. Lima VD, Harrigan PR, Senecal M, Yip B, Druyts E, et al. (2010) Epidemiologyof antiretroviral multiclass resistance. Am J Epidemiol 172: 460–468.
20. Yerly S, Fagard C, Gunthard HF, Hirschel B, Perrin L, et al. (2003) Drugresistance mutations during structured treatment interruptions. Antivir Ther 8:411–415.
21. Danel C, Moh R, Minga A, Anzian A, Ba-Gomis O, et al. (2006) Cd4-guidedstructured antiretroviral treatment interruption strategy in hiv-infected adults inwest africa (trivacan anrs 1269 trial): a randomised trial. Lancet 367: 1981–1989.
22. Danel C, Moh R, Chaix ML, Gabillard D, Gnokoro J, et al. (2009) Two-months-off, four-months-on an-tiretroviral regimen increases the risk ofresistance, compared with continuous therapy: A randomized trial involvingwest african adults. J Infect Dis 199: 66–76.
23. El-Sadr WM, Lundgren JD, Neaton JD, Gordin F, Abrams D, et al. (2006)Cd4+count-guided inter-ruption of antiretroviral treatment. New Engl J Med355: 2283–2296.
24. Taylor S, Boffito M, Khoo S, Smit E, Back D (2007) Stopping antiretroviraltherapy. AIDS 21: 1673–1682.
25. Fox Z, Phillips A, Cohen C, Neuhaus J, Baxter J, et al. (2008) Viralresuppression and detection of drug resistance following interruption of a
Standing Variation and Drug Resistance in HIV
PLoS Computational Biology | www.ploscompbiol.org 12 June 2012 | Volume 8 | Issue 6 | e1002527

suppressive non-nucleoside reverse transcriptase inhibitor-based regimen. AIDS22: 2279–2289.
26. Dybul M, Nies-Kraske E, Daucher M, Hertogs K, Hallahan CW, et al. (2003)Long-cycle structured intermittent versus continuous highly active antiretroviraltherapy for the treatment of chronic infection with human immunodeficiencyvirus: Effects on drug toxicity and on immunologic and virologic parameters.J Infect Dis 188: 388–396.
27. Arnedo-Valero M, Garcia F, Gil C, Guila T, Fumero E, et al. (2005) Risk ofselecting de novo drug-resistance mutations during structured treatmentinterruptions in patients with chronic hiv infection. Clin Infect Dis 41: 883–890.
28. Henry K, Katzenstein D, Cherng DW, Valdez H, Powderly W, et al. (2006) Apilot study evaluating time to cd4 t-cell count ,350 cells/mm(3) after treatmentinterruption following antiretroviral therapy +/2 interleukin 2: Results of actga5102. J Acquir Immune Defic Syndr 42: 140–148.
29. Ruiz L, Paredes R, Gomez G, Romeu J, Domingo P, et al. (2007) Antiretroviraltherapy interruption guided by cd4 cell counts and plasma hiv-1 rna levels inchronically hiv-1-infected patients. AIDS 21: 169–178.
30. Darwich L, Esteve A, Ruiz L, Paredes R, Bellido R, et al. (2008) Drug-resistancemutations number and k70r or t215y/f substitutions predict treatmentresumption during guided treatment interruptions. AIDS Res Hum Retroviruses24: 725–732.
31. Davey RT, Bhat N, Yoder C, Chun TW, Metcalf JA, et al. (1999) Hiv-1 and tcell dynamics after interruption of highly active antiretroviral therapy (haart) inpatients with a history of sustained viral suppression. Proc Natl Acad Sci U S A96: 15109–15114.
32. Haldane JBS (1927) A mathematical theory of natural and artificial selection,part v: Selection and mutation. Proc Camb Philol Soc 23: 838–844.
33. Shankarappa R, Margolick JB, Gange SJ, Rodrigo AG, Upchurch D, et al.(1999) Consistent viral evolutionary changes associated with the progression ofhuman immunodeficiency virus type 1 infection. J Virol 73: 10489–10502.
34. Gadhamsetty S, Dixit NM (2010) Estimating frequencies of minority nevirapine-resistant strains in chronically hiv-1-infected individuals naive to nevirapine byusing stochastic simulations and a math-ematical model. J Virol 84:10230–10240.
35. Harrigan PR, Hogg RS, Dong WWY, Yip B, Wynhoven B, et al. (2005)Predictors of hiv drug-resistance mutations in a large antiretroviral-naive cohortinitiating triple antiretroviral therapy. J Infect Dis 191: 339–347.
36. Margot NA, Lu B, Cheng A, Miller MD, Study T (2006) Resistancedevelopment over 144 weeks in treatment-naive patients receiving tenofovirdisoproxil fumarate or stavudine with lamivudine and efavirenz in study 903.HIV Med 7: 442–450.
37. Mansky LM, Temin HM (1995) Lower in vivo mutation rate of human-immunodeficiency virus type 1 than that predicted from the fidelity of purifiedreverse transcriptase. J Virol 69: 5087–5094.
38. Martinez-Picado J, Martinez MA (2008) Hiv-1 reverse transcriptase inhibitorresistance mutations and fitness: A view from the clinic and ex vivo. Virus Res134: 104–123.
39. Paredes R, Sagar M, Marconi VC, Hoh R, Martin JN, et al. (2009) In vivofitness cost of the m184v mutation in multidrug-resistant human immunode-ficiency virus type 1 in the absence of lamivudine. Journal of Virology 83:2038–2043.
40. Wang DN, Hicks CB, Goswami ND, Tafoya E, Ribeiro RM, et al. (2011)Evolution of drug-resistant viral populations during interruption of antiretroviraltherapy. J Virol 85: 6403–6415.
41. Fu YX (2001) Estimating mutation rate and generation time from longitudinalsamples of dna sequences. Mol Biol Evol 18: 620–626.
42. Leigh-Brown AJ (1997) Analysis of hiv-1 env gene sequences reveals evidence fora low effective number in the viral population. Proc Natl Acad Sci U S A 94:1862–1865.
43. Rouzine IM, Coffin JM (1999) Linkage disequilibrium test implies a largeeffective population number for hiv in vivo. Proc Natl Acad Sci U S A 96:10758–10763.
44. BrunVezinet F, Boucher C, Loveday C, Descamps D, Fauveau V, et al. (1997)Hiv-1 viral load, phenotype, and resistance in a subset of drug-naive participantsfrom the delta trial. Lancet 350: 983–990.
45. van Heeswijk RPG, Veldkamp AI, Mulder JW, Meenhorst PL, Wit F, et al.(2000) The steady-state pharmacokinetics of nevirapine during once daily andtwice daily dosing in hiv-1-infected individuals. AIDS 14: F77–F82.
46. van Heeswijk RPG, Veldkamp A, Mulder JW, Meenhorst PL, Lange JMA, et al.(2001) Combination of protease inhibitors for the treatment of hiv-1-infectedpatients: a review of pharmacokinetics and clinical experience. Antivir Ther 6:201–229.
47. Pirillo M, Palmisano L, Pellegrini M, Galluzzo C, Weimer L, et al. (2010)Nonnucleoside reverse transcriptase inhibitor concentrations during treatmentinterruptions and the emergence of resistance: A substudy of the iss-part trial.AIDS Res Hum Retroviruses 26: 541–545.
48. Garcia F, Plana M, Ortiz GM, Bonhoeffer S, Soriano A, et al. (2001) Thevirological and immunological consequences of structured treatment interrup-tions in chronic hiv-1 infection. AIDS 15: F29–F40.
49. Trkola A, Kuster H, Rusert P, Joos B, Fischer M, et al. (2005) Delay of hiv-1rebound after cessation of antiretroviral therapy through passive transfer ofhuman neutralizing antibodies. Nat Med 11: 615–622.
50. Ananworanich J, Nuesch R, Le Braz M, Chetchotisakd P, Vibhagool A, et al.(2003) Failures of 1 week on, 1 week off antiretroviral therapies in a randomizedtrial. AIDS 17: F33–F37.
51. Hoen B, Fournier I, Lacabaratz C, Burgard M, Charreau I, et al. (2005)Structured treatment inter-ruptions in primary hiv-1 infection - the anrs 100primstop trial. J Acquir Immune Defic Syndr 40: 307–316.
52. Palmisano L, Giuliano M, Bucciardini R, Fragola V, Andreotti M, et al. (2007)Determinants of virologic and immunologic outcomes in chronically hiv-infectedsubjects undergoing repeated treatment interruptions - the istituto superiore disanita-pulsed antiretroviral therapy (iss-part) study. J Acquir Immune DeficSyndr 46: 39–47.
53. Reynolds SJ, Kityo C, Mbamanya F, Dewar R, Ssali F, et al. (2009) Evolution ofdrug resistance after virological failure of a first-line highly active antiretroviraltherapy regimen in uganda. Antivir Ther 14: 293–297.
54. Reynolds SJ, Kityo C, Hallahan CW, Kabuye G, Atwiine D, et al. (2010) Arandomized, controlled, trial of short cycle intermittent compared to continuousantiretroviral therapy for the treatment of hiv infection in Uganda. Plos One 5:e10307.
55. Gallant JE, Staszewski S, Pozniak AL, DeJesus E, Suleiman J, et al. (2004)Efficacy and safety of tenofovir df vs stavuldine in combination therapy inantiretroviral-naive patients - a 3-year randomized trial. JAMA 292: 191–201.
56. Chi BH, Sinkala M, Mbewe F, Cantrell RA, Kruse G, et al. (2007) Single-dosetenofovir and emtricitabine for reduction of viral resistance to non-nucleosidereverse transcriptase inhibitor drugs in women given intrapartum nevirapine forperinatal hiv prevention: an open-label randomised trial. Lancet 370:1698–1705.
57. Lallemant M, Ngo-Giang-Huong N, Jourdain G, Traisaithit P, Cressey TR, etal. (2010) Efficacy and safety of 1-month postpartum zidovudine-didanosine toprevent hiv-resistance mutations after intrapartum single-dose nevirapine. ClinInfect Dis 50: 898–908.
58. Kepler TB, Perelson AS (1998) Drug concentration heterogeneity facilitates theevolution of drug resistance. Proc Natl Acad Sci U S A 95: 11514–11519.
59. Tomasetti C (2011) A new hypothesis: imatinib affects leukemic stem cells in thesame way it affectsall other leukemic cells. Blood Cancer J 1: e19.
60. Weis SE, Slocum PC, Blais FX, King B, Nunn M, et al. (1994) The effect ofdirectly observed therapy on the rates of drug-resistance and relapse intuberculosis. N Engl J Med 330: 1179–1184.
Standing Variation and Drug Resistance in HIV
PLoS Computational Biology | www.ploscompbiol.org 13 June 2012 | Volume 8 | Issue 6 | e1002527

STANDING GENETIC VARIATION AND THE EVOLUTION OF DRUGRESISTANCE IN HIV - SUPPLEMENTARY TEXT S1
PLEUNI S. PENNINGS
Supplementary text S1 for Pennings, P.S., Standing genetic variation and
the evolution of drug resistance in HIV, PLoS Comp Biol, 2012
Model. The model describes population dynamics and population genetics of a panmicticvirus population in a single patient. Only virus in infected cells is considered and the dy-namics of free virus and uninfected cells are ignored. The total number of cells that can beinfected is limited to K, the carrying capacity. Because the life cycle of the virus is simplifiedto just one step in which infected cells “give birth” to infected cells, all drugs have the sameeffect: they reduce the number of cells that can be infected by the virus in an infected cell.We will refer to the infected cells by the virus they are infected with.
When patients fail therapy, this is often due to virus that is resistant against just onedrug even if the patient was treated with three drugs (as described in the Introduction). Wetherefore assume in our model that there are just two types of viruses: wildtype virus thatis susceptible to all drugs and resistant virus that is resistant against one of the drugs in theregimen of the patient. We assume that prior to establishment of single drug-resistant virus(hereafter: resistant virus), there is no virus present that is resistant against more than onedrug. We only focus on the probability that single drug-resistant virus becomes established.
The resistant type has a growth rate larger than 1 even in the presence of drugs, but inthe absence of drugs it is less fit than the wildtype. Initially the population consists of onlywildtype virus, resistant virus can be created by mutation. Absolute fitnesses are determinedfor wildtype and resistant virus, in the absence of drugs (denoted by u for untreated) andduring treatment (either ART or NVP). These fitnesses are absolute fitnesses, which areequivalent to the reproductive ratio, or the expected number of cells a viral particle wouldinfect in a completely susceptible population of host cells. Without drugs, wildtype virus isfitter than resistant virus, so that the population will always be dominated by wildtype virus.During treatment, resistant virus is fitter than wildtype, so that the population will ultimatelybecome dominated by resistant virus. However, if evolution is mutation-limited, it can takea long time before the equilibrium with resistant virus is reached. One of the successes ofcombination therapy is to make this waiting time much longer than with monotherapy.
The relative cost or selective disadvantage is defined as Crel = (Fwtu −Fmu)/(Fwtu), or,in other words, how much less fit resistant virus is in the absence of drugs, relative to thewildtype. As will be shown later, the fitness of the wildtype with drugs is not important inthe current model (although we do have to determine its value for the simulations).
If the average fitness of the viral population is larger than 1, the viral population growsexponentially until it reaches the carrying capacity (K), at which point the population stopsgrowing and stays stable. If the average fitness of the population is below 1, the populationshrinks until it reaches NLAT/(1 − Fwt), where NLAT is a fixed number of particles whichis added to the population each generation. This reflects the latently infected cells in an
1

2 PLEUNI S. PENNINGS
HIV infected patient. These latently infected cells have very long half-lifes and function asa reservoir for the HIV population. Because of these cells, the virus population does not dieout, even if therapy is very successful and there is (almost) no replication.
Simulation details. Time is counted in generations. Each generation is split in 10 time-steps. At each time step, each viral particle has a probability of 1/10 to be chosen to reproduceand die. The expected life-time of a viral particle is therefore 1 generation and this is the samefor wildtype and resistant virus. All particles that are chosen to reproduce at a given time-stepdie and are replaced by their offspring (i.e. newly infected cells). The number of offspring isequal to [number of chosen wildtype particles]∗[Fwt]+[number of chosen resistant particles]∗[Fres]. If this number is smaller than 20, stochastic effects should be taken into account, soinstead of using the number directly, we take a random number from the Poisson distributionwith the expected number as the mean. If adding of the new offspring to the population wouldlead the population size to be higher than K, we add fewer individuals so that the populationsize will be exactly K. The new offspring can be either wildtype or resistant. It is assigneda type at random, with probability
[number of chosen wildtype particles] ∗ [Fwt]
[number of chosen wildtype particles] ∗ [Fwt] + [number of chosen res particles] ∗ [Fres]
to be wildtype, and resistant otherwise. This is a standard procedure (also used in [1])The choice of 10 time-steps per generation is a compromise between the speed of simulatingdiscrete generations and the reality of continuous replication.
Mutation occurs only from wildtype to resistant. Back-mutation to wildtype is ignored.The number of mutations in a generation depends on the (per particle and per generation)mutation rate, µ, and the number of newly created infected cells, which in turn depends onfitness and population size.
Analytical calculation of the fixation probability. To calculate the probability thatresistance mutations become established when treatment is started (either for the first time orafter an interruption), there are two possibilities. When the relative cost of resistance in theabsence of drugs, the fitness of the resistant virus with drugs and the viral population size areall known, we can use the theory from [1] to calculate the probability that resistance mutationsfrom the standing genetic variation become established. Alternatively, if the number of copiesof the resistant virus and the fitness of resistant virus are known, it is possible to calculate theprobability that at least one of these copies will survive, in which case the population becomesresistant. For the latter, we need the probability that a single resistant mutant spreads inthe population and ultimately goes to fixation, as opposed to being lost due to genetic drift.In the current model, individuals (viral particles in infected cells) will “produce” a Poissondistributed number of newly infected cells (we call these offspring). The mean number ofoffspring, λ, determines the probability that a lineage dies out or survives. Usually, it isassumed that the mean number of offspring of a genotype depends on its fitness relative tothe mean fitness of the population. However, when a patient takes drugs, the populationsize of the virus will be much lower than the carrying capacity, so that there is effectivelyno competition between resistant and wildtype virus. The mean number of offspring, λ,therefore does not depend on the relative fitness, but simply equals the absolute fitness ofthe resistant virus. In 1927, Haldane [2] showed that the relationship between the meannumber of offspring (λ) and the fixation probability is

STANDING GENETIC VARIATION AND THE EVOLUTION OF DRUG RESISTANCE IN HIV - SUPPLEMENTARY TEXT S13
(1) λ = − log(1− Pfix)
Pfix= 1 +
Pfix
2+
P 2fix
3+
P 3fix
4+
P 4fix
5+O(P 5
fix)
Traditionally, the fixation probability is calculated using the selection coefficient, sb =Fres−Fwt
Fwt, instead of the expected number of offspring, λ. In a population with stable pop-
ulation size and competition between genotypes this is fine because λ = 1 + sb, but in thecurrent model, this does not hold and sb is irrelevant.
If λ− 1 is small, a simple approximation for the fixation probability is:
(2) Pfix ≈ 2(λ− 1)
When λ is larger, Haldane’s equation needs to be solved numerically using more terms ofthe Taylor expansion.
Data from clinical trials. Starting standard therapy. The probability that resistancemutations from standing genetic variation become established at the start of therapy wasestimated from a data set that was published in [3], see supplementary table S1 in text S2 forthe raw data. The study reported the number of patients where resistance was detected in thefirst, second and third year of treatment, for two treatment groups and for three categoriesof resistance mutations. Because in each case only the first resistance mutation in a givenpatient was recorded, the data for the three different resistance classes could not be analyzedseparately. A saturated model was fitted using R [4] after which non-significant interactionswere removed. It was found that the probability that resistance mutations became establisheddid not differ significantly between the two treatment groups (p=0.26) and also not betweenyear 2 and year 3 (p=0.78). However, there was a clear difference between year 1 and theother two years (p < 10−5). The average risk per year in year 2 and 3 was 3.7%, whereas theaverage risk in year 1 was 9.5%. The difference between year 1 and the other 2 years was5.8%, which could be due to the standing genetic variation before treatment started.
Single dose nevirapine. We searched the web of science (ISI) database for publishedstudies on single dose nevirapine and resistance. We limited ourselves to studies that reportedthe fraction of women that had detectable resistance at 4 to 6 weeks postpartum usingstandard sequencing. An overview of the studies can be found in supplementary table S2 intext S2.
Interruption studies. Seven studies were identified that reported on clinical trials inwhich patients interrupted treatment multiple times for a fixed length of time (i.e., all patientsin the trial were on the same schedule) and which tested genotypic resistance on plasmasamples of all patients in which treatment failed (and ideally of all patients) before and afterthe trial. Characteristics of the seven studies can be found in supplementary table S3 n textS2. The shortest interruption length was two days and the longest 60 days. If possible, weremoved patients which had evidence of resistance before the trial started. In all but oneof the studies, patients were on traditional triple-drug regimens (NNRTI or PI based withtwo NRTIs). Only in the Staccato study some patients were on a boosted PI regimen [5].These patients were taken out of the analysis because resistance seems to evolve much slowerin regimens with boosted PI’s compared to NNRTI and unboosted PI regimens [6]. In twotrials, the interruptions had varying lengths [7, 8], in which case we used the mean length ofthe interruptions for the plot (see figure 6).
4 PLEUNI S. PENNINGS
For each study, the fraction of patients (F ) which did not acquire any resistance mutationsduring the trial was calculated. The number of treatment interruptions (T ) which wererelevant for the resistance data was calculated. For example, if genotypic resistance tests weredone on samples that were obtained during treatment interruption 4, it was assumed that anyresistance had occurred due to treatment interruption 1, 2 or 3 so that T = 3. Furthermoreit was assumed that each treatment interruption (TI ) contributed equally to the probabilitythat resistance mutations became established. The probability (P ) that resistance mutationsbecame established due to a single interruption was calculated as follows:
(3) F = (1− P )T ⇒ P = 1− F1/T
Two of the studies also allowed for an estimation of the risk that resistance mutationsbecame established during continuous treatment [9, 10, 11]. We find a rate of evolution ofresistance of 4.3% and 4.8% per year (see table S3 in text S2). Using the mean of thesetwo rates, we can estimate the probability that resistance mutations became establishedduring the time on treatment in each of the trials and we corrected the estimated risk ofan interruption by subtracting the probability that resistance mutations became establishedduring treatment.
References
1. Hermisson J, Pennings PS (2005) Soft sweeps: Molecular population genetics of adaptation fromstanding genetic variation. Genetics 169: 2335-2352.
2. Haldane JBS (1927) A mathematical theory of natural and artificial selection, part v: Selection andmutation. Proceedings of the Cambridge Philosophical Society 23: 838-844.
3. Margot NA, Lu B, Cheng A, Miller MD, Study T (2006) Resistance development over 144 weeksin treatment-naive patients receiving tenofovir disoproxil fumarate or stavudine with lamivudine andefavirenz in study 903. Hiv Medicine 7: 442-450.
4. R Development Core Team (2011) R: A Language and Environment for Statistical Computing. RFoundation for Statistical Computing, Vienna, Austria. URL http://www.R-project.org. ISBN 3-900051-07-0.
5. Ananworanich J, Nuesch R, Le Braz M, Chetchotisakd P, Vibhagool A, et al. (2003) Failures of 1 weekon, 1 week off antiretroviral therapies in a randomized trial. Aids 17: F33-F37.
6. Lima VD, Gill VS, Yip B, Hogg RS, Montaner JSG, et al. (2008) Increased resilience to the developmentof drug resistance with modern boosted protease inhibitor-based highly active antiretroviral therapy.Journal of Infectious Diseases 198: 51-58.
7. Hoen B, Fournier I, Lacabaratz C, Burgard M, Charreau I, et al. (2005) Structured treatment inter-ruptions in primary hiv-1 infection - the anrs 100 primstop trial. Jaids-Journal of Acquired ImmuneDeficiency Syndromes 40: 307-316.
8. Palmisano L, Giuliano M, Bucciardini R, Fragola V, Andreotti M, et al. (2007) Determinants ofvirologic and immunologic outcomes in chronically hiv-infected subjects undergoing repeated treatmentinterruptions - the istituto superiore di sanita-pulsed antiretroviral therapy (iss-part) study. Jaids-Journal of Acquired Immune Deficiency Syndromes 46: 39-47.
9. Reynolds SJ, Kityo C, Mbamanya F, Dewar R, Ssali F, et al. (2009) Evolution of drug resistanceafter virological failure of a first-line highly active antiretroviral therapy regimen in uganda. AntiviralTherapy 14: 293-297.
10. Reynolds SJ, Kityo C, Hallahan CW, Kabuye G, Atwiine D, et al. (2010) A randomized, controlled,trial of short cycle intermittent compared to continuous antiretroviral therapy for the treatment of hivinfection in uganda. Plos One 5.
11. Danel C, Moh R, Chaix ML, Gabillard D, Gnokoro J, et al. (2009) Two-months-off, four-months-on an-tiretroviral regimen increases the risk of resistance, compared with continuous therapy: A randomizedtrial involving west african adults. Journal of Infectious Diseases 199: 66-76.

STANDING GENETIC VARIATION AND THE EVOLUTION OF DRUGRESISTANCE IN HIV - TEXT S2 WITH TABLES S1, S2, S3
PLEUNI S. PENNINGS
Supplementary tables S1, S2, S3 for Pennings, P.S., Standing genetic
variation and the evolution of drug resistance in HIV, PLoS Comp Biol,
2012
Table S1. Number of patients with at least one resistance mutation detected bythe end of the first, second and third year of NNRTI-based antiretroviral therapy.Data from [1].
Year Group Resistant Not Resistant1 TDF 35 2642 TDF 8 2563 TDF 9 2471 d4T 22 2792 d4T 10 2693 d4T 11 258
1

2 PLEUNI S. PENNINGS
Table S2. Overview of clinical trials with single dose nevirapine which reported thenumber of patients with nevirapine resistance detected 6 to 8 weeks after treatment.
Reference and name trial Number ofpatients
Treatment Treatment code Est. prob of es-tablishment ofresistance
Remarks
Eshleman 2005 [2], Malawi 65 sdNVP sdNVP 0.69
Eshleman 2005 [2], Uganda 241 sdNVP sdNVP 0.26
Farr 2010 [3], Malawi 65 sdNVP sdNVP 0.34
Hudelson 2010 [4], Uganda 30 sdNVP sdNVP 0.43
Jackson 2000 [5], Uganda 15 sdNVP sdNVP 0.20
Kassaye 2007 [6], Zim-babwe
32 sdNVP sdNVP 0.35
Lee 2005 [7], Zimbabwe 32 sdNVP sdNVP 0.34
Loubser 2006 [8], SouthAfrica
44 sdNVP sdNVP 0.54 Results only forK103N mutation
Ly 2007 [9], Cambodia 35 sdNVP sdNVP 0.23
Martinson 2009 [10], SouthAfrica, HIVNET 012
108 sdNVP sdNVP 0.38
Martinson 2009 [10], SouthAfrica, HIVNET 012
193 sdNVP sdNVP 0.46
McIntyre 2009 [11], SouthAfrica
74 sdNVP sdNVP 0.59
Rajesh 2010 [12], India 12 sdNVP sdNVP 0.33
Toni 2005 [13] , Ivorycoast 29 sdNVP sdNVP 0.21
Farr 2010 [3], Malawi 120 sdNVP + 7 days3TC/ZDV
sdNVP/PP 0.017
McIntyre 2009 [11], SouthAfrica
164 sdNVP + 4 days3TC/ZDV
sdNVP/PP 0.097
McIntyre 2009 [11], SouthAfrica
168 sdNVP + 7 days3TC/ZDV
sdNVP/PP 0.073
Chaix 2007[14], Ivorycoast,ANRS/Ditrame Plus
63 ZDV from 36 weeks +sdNVP
ZDV/sdNVP 0.33
Chalermchokcharoenkit2009 [15], Thailand
190 ZDV 3rd trimester +sdNVP
ZDV/sdNVP 0.18
Chi 2009 and 2007 [16, 17],Zambia
166 ZDV 3rd trimester +sdNVP
ZDV/sdNVP 0.25
Lallemant 2009 [18], Thai-land, PHPT2
222 ZDV 3rd trimester +sdNVP
ZDV/sdNVP 0.064
Ly 2007 [9], Cambodia 16 ZDV from 28 weeks +sdNVP
ZDV/sdNVP 0.19
Shapiro 2006 [19],Botswana
155 ZDV from 34 weeks +sdNVP
ZDV/sdNVP 0.45
Van Zijl 2008 [20], SouthAfrica
76 ZDV from 34 weeks +sdNVP
ZDV/sdNVP 0.17
Arrive 2010 [21], Cam-bodia/Ivorycoast/SouthAfrica, TEmAA ANRS12109
33 ZDV from enrollment+ sdNVP + 1 weekTDF/FTC
ZDV/sdNVP/PP 0.0
Dabis 2009 [22], Cam-bodia/Ivorycoast/SouthAfrica, TEmAA ANRS12109
37 ZDV from enrollment+ sdNVP + 1 weekTDF/FTC
ZDV/sdNVP/PP 0.0
Lallemant 2009 [18], Thai-land, PHPT4
222 ZDV 3rd trim +sdNVP + 1 monthZDV/DDI
ZDV/sdNVP/PP 0.0

STANDING GENETIC VARIATION AND THE EVOLUTION OF DRUG RESISTANCE IN HIV - TEXT S2 WITH TABLES S1, S2, S33
Table S3. Overview of clinical trials with structured treatment interruptions whichreported the number of patients with at least one drug resistance mutation detected.
Reference and nametrial
% onPI
Numberof pa-tients
Patientsexcluded
Patientswithgenotypicresistance
Fractionnot re-sistantat end oftrial
TI’srele-vant forcalcula-tion
Lengthof TI(days)
Treatmentperiod(days)
Est. probof evo-lution ofresistanceper TI
Correctedprob ofevolu-tion ofresistance
Interruption armsReynolds 2009and 2010 [23, 24],Uganda FOTO arm
2% 57 1 (no geno-type)
4 52/56 72 2 5 0 0
Ananworanich2003 [25], StaccatoWOWO arm
0% 36 22 (onboostedPI) 2 (hadresistancebeforetrial)
3 9/12 17 7 7 0.02 0.02
Reynolds 2009and 2010 [23, 24],Uganda WOWOarm
6% 32 3 (left thetrial)
9 20/29 18 7 7 0.02 0.02
Yerly 2003 [26] ,SSITT trial
100% 87 4 (lost tofollow-up)3 (alreadyresistancebeforetrial)
11 69/80 4 14 56 0.04 0.03
Hoen 2005 [27],ANRS 100 Prim-stop trial
100% 26 4 (re-sistancebeforetrial) 1(resistancein first TI)
2 19/21 2 14, 28(mean21)
84 0.05 0.04
Palmisano 2007[28], ISS PART
25% 136 16 (es-timatednumberthat hadresistancebefore)
22 98/120 3 28,28, 56(mean37)
91 0.07 0.06
Danel 2009 [29],Ivory Coast NCT00158405
10% 325 10 (nogenotypes)
76 239/315 4 60 91 0.07 0.06
Continuous armsReynolds 2009and 2010 [23, 24],Uganda continuousarm
2% 51 0 3 48/51 – – 504 – 0.043/year
Danel 2009 [29],Ivory Coast NCT00158405
15% 110 3 (no geno-types)
10 97/107 – – 728 – 0.048/year
References
1. Margot NA, Lu B, Cheng A, Miller MD, Study T (2006) Resistance development over 144 weeksin treatment-naive patients receiving tenofovir disoproxil fumarate or stavudine with lamivudine andefavirenz in study 903. Hiv Medicine 7: 442-450.
2. Eshleman SH, Guay LA, Wang J, Mwatha A, Brown ER, et al. (2005) Distinct patterns of emergenceand fading of k103n and y181c in women with subtype a vs. d after single-dose nevirapine - hivnet012. Jaids-Journal of Acquired Immune Deficiency Syndromes 40: 24-29.
4 PLEUNI S. PENNINGS
3. Farr SL, Nelson JAE, Ng’ombe TJ, Kourtis AP, Chasela C, et al. (2010) Addition of 7 days of zidovudineplus lamivudine to peripartum single-dose nevirapine effectively reduces nevirapine resistance postpar-tum in hiv-infected mothers in malawi. Jaids-Journal of Acquired Immune Deficiency Syndromes 54:515-523.
4. Hudelson SE, McConnell MS, Bagenda D, Piwowar-Manning E, Parsons TL, et al. (2010) Emergenceand persistence of nevirapine resistance in breast milk after single-dose nevirapine administration. Aids24: 557-561.
5. Jackson JB, Becker-Pergola G, Guay LA, Musoke P, Mracna M, et al. (2000) Identification of the k103nresistance mutation in ugandan women receiving nevirapine to prevent hiv-1 vertical transmission. Aids14: F111-F115.
6. Kassaye S, Lee E, Kantor R, Johnston E, Winters M, et al. (2007) Drug resistance in plasma and breastmilk after single-dose nevirapine in subtype c hiv type 1: Population and clonal sequence analysis. AidsResearch and Human Retroviruses 23: 1055-1061.
7. Lee EJ, Kantor R, Zijenah L, Sheldon W, Emel L, et al. (2005) Breast-milk shedding of drug-resistanthiv-1 subtype c in women exposed to single-dose nevirapine. Journal of Infectious Diseases 192: 1260-1264.
8. Loubser S, Balfe P, Sherman G, Hammer S, Kuhn L, et al. (2006) Decay of k103n mutants in cellulardna and plasma rna after single-dose nevirapine to reduce mother-to-child hiv transmission. Aids 20:995-1002.
9. Ly N, Phoung V, Min DC, Srey C, Kruy LS, et al. (2007) Reverse transcriptase mutations in cambodiancrf01ae isolates after antiretroviral prophylaxis against hiv type 1 perinatal transmission. Aids Researchand Human Retroviruses 23: 1563-1567.
10. Martinson NA, Morris L, Johnson J, Gray GE, Pillay V, et al. (2009) Women exposed to single-dosenevirapine in successive pregnancies: effectiveness and nonnucleoside reverse transcriptase inhibitorresistance. Aids 23: 809-816.
11. McIntyre JA, Hopley M, Moodley D, Eklund M, Gray GE, et al. (2009) Efficacy of short-course azt plus3tc to reduce nevirapine resistance in the prevention of mother-to-child hiv transmission: A randomizedclinical trial. Plos Medicine 6: 9.
12. Rajesh L, Ramesh K, Hanna LE, Narayanan PR, Swaminathan S (2010) Emergence of drug resistantmutations after single dose nevirapine exposure in hiv-1 infected pregnant women in south india. IndianJournal of Medical Research 132: 509-512.
13. Toni TD, Masquelier B, Lazaro E, Dore-Mbami M, Ba-Gomis FO, et al. (2005) Characterization ofnevirapine (nvp) resistance mutations and hiv type 1 subtype in women from abidjan (cote d’ivoire)after nvp single-dose prophylaxis of hiv type 1 mother-to-child transmission. Aids Research and HumanRetroviruses 21: 1031-1034.
14. Chaix ML, Ekouevi DK, Peytavin G, Rouet F, Tonwe-Gold B, et al. (2007) Impact of nevirapine (nvp)plasma concentration on selection of resistant virus in mothers who received single-dose nvp to preventperinatal human immunodeficiency virus type 1 transmission and persistence of resistant virus in theirinfected children. Antimicrobial Agents and Chemotherapy 51: 896-901.
15. Chalermchockcharoenkit A, Culnane M, Chotpitayasunondh T, Vanprapa N, Leelawiwat W, et al.(2009) Antiretroviral resistance patterns and hiv-1 subtype in mother-infant pairs after the adminis-tration of combination short-course zidovudine plus single-dose nevirapine for the prevention of mother-to-child transmission of hiv. Clinical Infectious Diseases 49: 299-305.
16. Chi BH, Ellis GM, Chintu N, Cantrell RA, Sinkala M, et al. (2009) Intrapartum tenofovir and emtric-itabine reduces low-concentration drug resistance selected by single-dose nevirapine for perinatal hivprevention. Aids Research and Human Retroviruses 25: 1099-1106.
17. Chi BH, Sinkala M, Mbewe F, Cantrell RA, Kruse G, et al. (2007) Single-dose tenofovir and emtric-itabine for reduction of viral resistance to non-nucleoside reverse transcriptase inhibitor drugs in womengiven intrapartum nevirapine for perinatal hiv prevention: an open-label randomised trial. Lancet 370:1698-1705.
18. Lallemant M, Ngo-Giang-Huong N, Jourdain G, Traisaithit P, Cressey TR, et al. (2010) Efficacyand safety of 1-month postpartum zidovudine-didanosine to prevent hiv-resistance mutations afterintrapartum single-dose nevirapine. Clinical Infectious Diseases 50: 898-908.

STANDING GENETIC VARIATION AND THE EVOLUTION OF DRUG RESISTANCE IN HIV - TEXT S2 WITH TABLES S1, S2, S35
19. Shapiro RL, Thior I, Gilbert PB, Lockman S, Wester C, et al. (2006) Maternal single-dose nevirapineversus placebo as part of an antiretroviral strategy to prevent mother-to-child hiv transmission inbotswana. Aids 20: 1281-1288.
20. van Zyl GU, Claassen M, Engelbrecht S, Laten JD, Cotton MF, et al. (2008) Zidovudine with nevirapinefor the prevention of hiv mother-to-child transmission reduces nevirapine resistance in mothers fromthe western cape, south africa. Journal of Medical Virology 80: 942-946.
21. Arrive E, Chaix ML, Nerrienet E, Blanche S, Rouzioux C, et al. (2010) Maternal and nenonataltenofovir and emtricitabine to prevent vertical transmission of hiv-1: tolerance and resistance. Aids24: 2478-2485.
22. Dabis F, Grp TEAS (2009) Tolerance and viral resistance after single-dose nevirapine with tenofovirand emtricitabine to prevent vertical transmission of hiv-1. Aids 23: 825-833.
23. Reynolds SJ, Kityo C, Hallahan CW, Kabuye G, Atwiine D, et al. (2010) A randomized, controlled,trial of short cycle intermittent compared to continuous antiretroviral therapy for the treatment of hivinfection in uganda. Plos One 5.
24. Reynolds SJ, Kityo C, Mbamanya F, Dewar R, Ssali F, et al. (2009) Evolution of drug resistanceafter virological failure of a first-line highly active antiretroviral therapy regimen in uganda. AntiviralTherapy 14: 293-297.
25. Ananworanich J, Nuesch R, Le Braz M, Chetchotisakd P, Vibhagool A, et al. (2003) Failures of 1 weekon, 1 week off antiretroviral therapies in a randomized trial. Aids 17: F33-F37.
26. Yerly S, Fagard C, Gunthard HF, Hirschel B, Perrin L, et al. (2003) Drug resistance mutations duringstructured treatment interruptions. Antiviral Therapy 8: 411-415.
27. Hoen B, Fournier I, Lacabaratz C, Burgard M, Charreau I, et al. (2005) Structured treatment inter-ruptions in primary hiv-1 infection - the anrs 100 primstop trial. Jaids-Journal of Acquired ImmuneDeficiency Syndromes 40: 307-316.
28. Palmisano L, Giuliano M, Bucciardini R, Fragola V, Andreotti M, et al. (2007) Determinants ofvirologic and immunologic outcomes in chronically hiv-infected subjects undergoing repeated treatmentinterruptions - the istituto superiore di sanita-pulsed antiretroviral therapy (iss-part) study. Jaids-Journal of Acquired Immune Deficiency Syndromes 46: 39-47.
29. Danel C, Moh R, Chaix ML, Gabillard D, Gnokoro J, et al. (2009) Two-months-off, four-months-on an-tiretroviral regimen increases the risk of resistance, compared with continuous therapy: A randomizedtrial involving west african adults. Journal of Infectious Diseases 199: 66-76.