standardizing environmental performance evaluation of
TRANSCRIPT

Procedia CIRP 90 (2020) 528–533
Contents lists available at ScienceDirect
Procedia CIRP
journal homepage: www.elsevier.com/locate/procir
Standardizing environmental performance evaluation of manufacturing
systems through ISO 20140
Hitoshi Komoto
a , William Z. Bernstein
b , ∗, Soonjo Kwon
c , d , Fumihiko Kimura
e
a National Institute of Advanced Industrial Science and Technology, Namiki, 1-2-1, Tsukuba 305-8564, Japan b Engineering Laboratory, National Institute of Standards and Technology, 100 Bureau Dr, Gaithersburg, MD 20899, USA c Associate, Engineering Laboratory, National Institute of Standards and Technology, 100 Bureau Dr, Gaithersburg, MD 20899, USA d Korea Advanced Institute of Science and Technology, 291, Daehak-ro, Yuseong-gu, Daejeon 34141, Republic of Korea e Professor Emeritus, The University of Tokyo, Hongo 7-3-1, Bunkyo-ku, Tokyo 113-8656, Japan
a r t i c l e i n f o
Keywords:
Standards
ISO 20140
smart manufacturing
sustainable manufacturing
environmental performance evaluation
(EPE) data
ISO TC184 SC5 WG10
a b s t r a c t
To evaluate the environmental performance of manufacturing systems, practitioners often deploy ad-hoc
methods or implement one-off solutions that are difficult to replicate in similar scenarios. Such situa-
tions can drive-up costs and cause significant delays. Hence, there is a strong need for standard methods
that help describe and replicate environmental performance evaluation (EPE) processes. In response, ISO
20140 provides guidelines for converting and aggregating environmental performance evaluation data.
This paper provides an overview of ISO 20140, and showcases the usefulness of ISO 20140 by describing
and analyzing the usage view of the EPE process. The analysis is conducted with an evaluation exper-
iment about the machining of a mill-tern part, in which energy consumption of a variety of process
modes such as active machining, tools change, rapid traverse, and pausing, are evaluated. The experi-
ment is jointly conducted by National Institute of Standards and Technology in the United States and the
National Institute of Advanced Industrial Science and Technology in Japan.
Published by Elsevier B.V.
This is an open access article under the CC BY-NC-ND license.
( http://creativecommons.org/licenses/by-nc-nd/4.0/ )
i
c
a
a
d
c
s
a
I
a
s
p
t
o
m
r
1. Introduction
Standards play a critical role in realizing more sustainable prac-
tices in manufacturing systems. This is especially significant con-
sidering trends in digitization and virtualization of production sys-
tems. More data is being generated at unprecedented rates and
variety than ever before. In response, a host of standards de-
velopment activities have focused on constructing representations
and methods for consistent use of data for environmental perfor-
mance ( Rachuri et al., 2009 ). For example, ASTM E3012 ( ASTM
E3012, 2019 ) provides a conceptual model for curating analytical
models that estimate or predict environmental influences of man-
ufacturing processes. However, there still remain significant chal-
lenges in identifying, constructing, and evaluating baseline met-
rics and performance for sustainable manufacturing ( Rachuri et al.,
2010 ). In response to these unmet needs, ISO 20140 provides
guidelines for the evaluation of energy efficiency and other factors
of manufacturing systems that influence the environment.
∗ Corresponding author.
E-mail addresses: [email protected] , [email protected] (W.Z. Bernstein).
m
2
b
https://doi.org/10.1016/j.procir.2020.02.043
2212-8271/Published by Elsevier B.V. This is an open access article under the CC BY-NC-N
Akin to other standards, ISO 20140 offers considerable flexibil-
ty with a large degree of freedom from two aspects. First, users
an specify a manufacturing process as an evaluation object at an
rbitrary level of a process hierarchy. Secondly, they can formulate
rbitrary relationships among environmental key performance in-
icators (KPIs), system values, environmental influences, and pro-
ess data collected from equipment constituting a manufacturing
ystem. As a result, ISO 20140 leaves users with the difficulty of
pplying its protocols to a designated context. To help the users of
SO 20140, a usage guide for the standard is in preparation. Such
usage guide includes typical scenarios used by managers respon-
ible for production system performance, engineers planning out
roduction sequences, designers for new product system installa-
ions, and foremen responsible for carrying out fabrication. More-
ver, a usage template is in preparation, which specifies the infor-
ation to be supplied by the users and their manufacturing envi-
onment for conducting the evaluation process.
To clarify the utility and efficacy of the standardized environ-
ental performance evaluation (EPE) process supported by the ISO
0140 usage guide and template, we take an approach learned
ased on the design guidelines of Industrial IoT systems. The
D license. ( http://creativecommons.org/licenses/by-nc-nd/4.0/ )

H. Komoto, W.Z. Bernstein and S. Kwon et al. / Procedia CIRP 90 (2020) 528–533 529
Fig. 1. Usage view of the EPE process.
g
t
s
i
v
c
o
m
o
t
h
v
I
/
f
t
r
s
f
o
a
l
c
l
n
A
p
c
t
o
o
t
c
E
m
Fig. 2. The EPE process focused in ISO 20140-2 and -3.
2
2
s
t
c
d
e
n
3
s
t
o
a
m
5
e
m
u
a
a
q
t
c
t
a
a
d
a
r
a
2
t
r
b
E
p
E
f
p
E
uideline, also known as the Industrial Internet Reference Archi-
ecture (IIRA) ( Industrial Internet Consortium, 2015 ) suggests de-
igners to describe the system from business, usage, function, and
mplementation viewpoints. The system description from the usage
iewpoint ( Platform I4.0, 2018 ) is particularly fit to describe the
oncerns (and interactions) of the users of (with) the system and
f other other stakeholders, which will be further analyzed with
odeling and simulation techniques ( Komoto and Masui, 2018 ).
The objective of this paper is to investigate the usage view
f the standardized EPE process for various stakeholders, as illus-
rated in Fig. 1 . In smart manufacturing environments, these stake-
olders interact with manufacturing systems in order to execute a
ariety of manufacturing processes (see the arrows (A) in Fig. 1 .
n this study, an additional human / software agent that manually
automatically performs the EPE process by receiving information
rom stakeholders (arrow-B) and manufacturing systems (arrow-C)
o eventually offer benefit through the evaluation result, such as
ecommendations to stakeholders concerning, e.g., a variety of de-
ign choices (arrow-D). The internal structure of the agent, i.e., the
unctional view that computes the results from these inputs, is out
f the scope of this paper and described elsewhere ( Vijayaraghaven
nd Dornfeld, 2010 ). Through this usage view, we describe the fol-
owing contributions in this paper:
• Brief introduction of a usage template for reporting ISO 20140
compliant evaluation experiments.
• Clarification of the necessary inputs of the EPE process with ref-
erence to the usage template.
• Analysis of the benefits of potential stakeholders of the EPE
process.
• Demonstration of practical use of the EPE process through an
evaluation experiment.
To verify the description of the usage view, we are currently
onducting an experiment that evaluates the EPE process by a col-
aboration between the National Institute of Standards and Tech-
ology (NIST) of the United States and the National Institute of
dvanced Industrial Science and Technology (AIST) of Japan. In this
aper, we describe the experiment from a view of users aiming at
omparing process plans in the context of the machining of a mill-
urn part.
The paper is organized as follows. Section 2 presents an
verview of ISO 20140. Section 3 briefly introduces various types
f stakeholders (users) of ISO 20140 and a description of the usage
emplate that is used to report plans and results of a standard-
ompliant EPE process. Section 4 describes the usage view of an
PE process based on the evaluation experiment. Section 5 sum-
arizes and concludes the paper.
. Background
.1. Interpretation of key concepts, terms, and definitions
Before describing the ISO 20140 EPE process, following the
tructure of the documents of the Standard, the paper first explains
he key concepts, terms, and definitions. Please refer to the indi-
ated clauses of ISO 20140 Part 2 ( ISO 20140-2:2018, 2018 ) that
escribe the precise definition, scope, and characterization. This
xplanation in the paper complements (somewhat abstract) defi-
itions in the documents of the Standard.
Environmental Performance Evaluation (EPE) Data (Clauses
.1, 3.6) : EPE data refer to quantities obtained from manufacturing
ystems (processes) necessary for the calculation of environmen-
al influences. EPE data can be but not limited to the attributes
f equipment of manufacturing systems, products to be produced,
nd inputs/outputs of manufacturing processes such as energy and
aterials. The classification of EPE data is described in ISO 20140-
( ISO 20140-5:2017, 2017 ) in detail.
Environmental influences (Clause 3.3) : Environmental influ-
nces are changes in physical quantities in the global environ-
ent resulting (often as by-products) from the execution of man-
facturing processes under consideration. Examples include energy
nd material consumption, toxicity emissions, and waste. As shown
bove, environmental influences are derived from EPE data.
System Values (Clauses 3.8, 6) : System values are physical
uantities measured in terms of the primary results of the execu-
ion of manufacturing processes under consideration. Examples in-
lude the number and/or quantity of products manufactured. Sys-
em values provide a basis for which environmental influences
cross different instances can be compared.
Environmental KPIs (Clauses 3.4, 3.5, 3.7) : Environmental KPIs
re used to evaluate the target processes and compare alternative
esigns of the target processes and/or resulting products. As shown
bove, they are defined by functions whose arguments are envi-
onmental influences and system values. Such KPIs are designed to
llow for direct comparison across manufacturing instances.
.2. Overview of ISO 20140
ISO 20140 standardizes the EPE process of manufacturing sys-
ems with environmental KPIs defined by environmental influences
elative to a system value ( ISO 20140-3:2019, 2019 ). The terms
riefly explained above appear as the inputs and outputs of the
PE processes. ISO 20140 consists of 5 parts, of which these four
arts have been recently published.
• Part 1: Overview and general principles ( ISO 20140-1:2019,
2019 )
• Part 2: EPE process ( ISO 20140-2:2018, 2018 )
• Part 3: EPE data aggregation process ( ISO 20140-3:2019, 2019 )
• Part 5: EPE data ( ISO 20140-5:2017, 2017 )
Among them, Part 2 and Part 3 describe the protocol for the
PE process and the EPE data aggregation process, respectively. The
ocus of Part 2 and Part 3 can be summarized by Fig. 2 . The EPE
rocess produces environmental KPIs as outputs, while it accepts
PE data and a system value as input. The EPE aggregation pro-
530 H. Komoto, W.Z. Bernstein and S. Kwon et al. / Procedia CIRP 90 (2020) 528–533
Table 1
Components of the usage template under development as an informative of ISO 20140.
Template component Description
[0] General Description Schedule, duration, and level of evaluation of manufacturing process under consideration
[1] Objective of Evaluation Description about the objective (purpose) of environmental performance evaluation
[2] Scope of Evaluation Specification of the target manufacturing process and conditions for EPE
[3] System Value Physical quantity measured in terms of primary results of the execution of manufacturing processes under consideration
(e.g., the number and/or quantity of products manufactured)
[4] Environmental KPI Evaluation criteria of the target process (specified by [1]) and of alternative designs of the target processes and/or resulting
products taking [3] and [5] as parameters.
[5] EPE Data Data obtained from manufacturing systems necessary for the calculation of environmental influences
[6] EPE Data Aggregation Calculation details of environmental influences from EPE data [5]
[7] Evaluation Calculation Calculation details of environmental KPIs [5]
[8] Evaluation Report Presentation of the conditions and results of environmental performance evaluation
Table 2
Description of the evaluation experiment following the usage template.
Template component Description
[0] General Description This experiment has been planned and conducted during 3 months between Autumn and Winter 2019 with a focus on
machine tools used for machining of a test mill-turn part.
[1] Objective of Evaluation The objective of this study is to compare the environmental performance of multiple process plans (i.e., 3-axis + 5-axis
milling and turning then 5-axis milling) from two different locations (i.e., AIST and NIST) for the same mill-turn part.
[2] Scope of Evaluation The complete machining process of a test part is the scope of evaluation. The machining of the fixtures to attach the work
piece to these machining tools is out of the scope of the EPE process. The same CAD model is used as the basis of the
study’s evaluation conditions.
[3] System Value Number of parts per cycle ( N ) [dimensionless]. N is 1 as defined by our comparison study.
[4] Environmental KPI Cumulative energy demand over parts per cycle ( E / N ) [kWh per cycle]
[5] EPE Data Energy consumption of equipment (kWh), or alternative data item such as load carried by the motors are allowed.
[6] EPE Data Aggregation Cumulative energy demand ( E ) [kWh] during the target machining process is measured and its sum is calculated. In
addition to the active machining mode, relevant modes such as tool change, rapid traverse, paused, waiting, warming up,
cooling down, stopped (due to alarms) are included.
[7] Evaluation Calculation As indicated in Part 2 ( ISO 20140-2:2018, 2018 ), the KPI value is the cumulative energy demand divided by parts per cycle
[8] Evaluation Report It will be filled after the EPE process. Whether the KPI, and other contents in the usage template are relevant for the
evaluation objective should be clarified therein.
m
t
c
o
f
i
o
u
e
t
a
e
t
t
t
m
e
c
b
f
t
i
3
e
f
o
e
cess accepts EPE data as input and instantiates environmental in-
fluences as outputs, which is used to calculate environmental KPIs
together with system values.
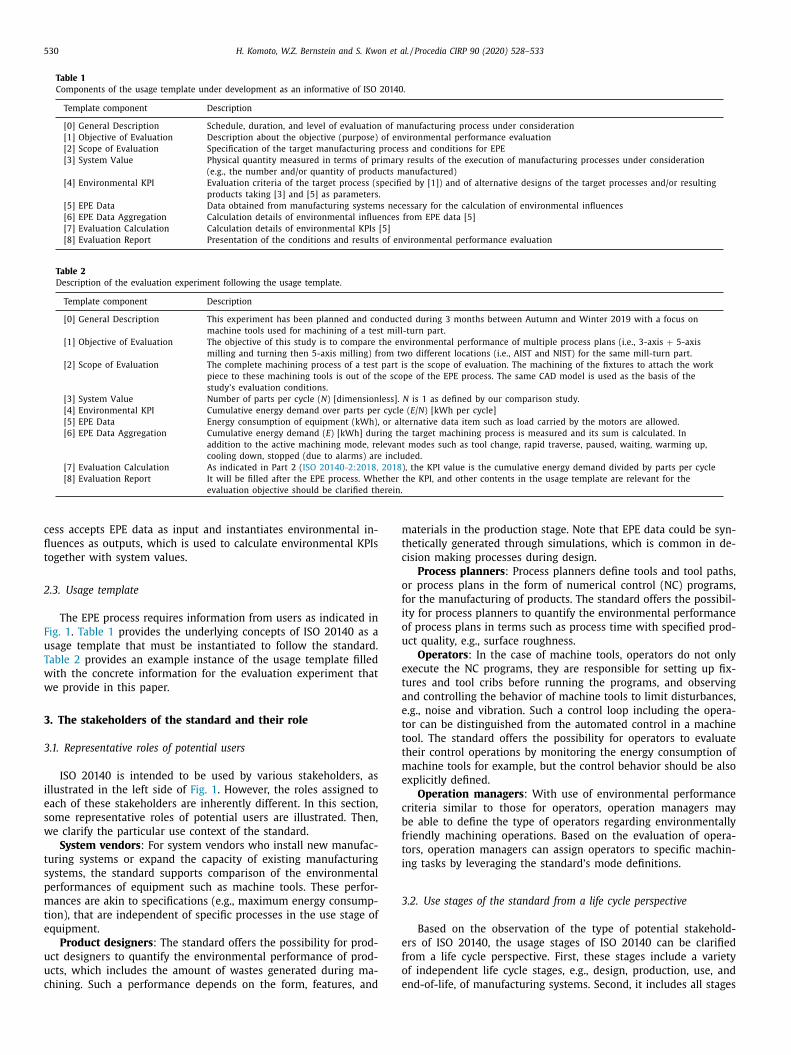
2.3. Usage template
The EPE process requires information from users as indicated in
Fig. 1 . Table 1 provides the underlying concepts of ISO 20140 as a
usage template that must be instantiated to follow the standard.
Table 2 provides an example instance of the usage template filled
with the concrete information for the evaluation experiment that
we provide in this paper.
3. The stakeholders of the standard and their role
3.1. Representative roles of potential users
ISO 20140 is intended to be used by various stakeholders, as
illustrated in the left side of Fig. 1 . However, the roles assigned to
each of these stakeholders are inherently different. In this section,
some representative roles of potential users are illustrated. Then,
we clarify the particular use context of the standard.
System vendors : For system vendors who install new manufac-
turing systems or expand the capacity of existing manufacturing
systems, the standard supports comparison of the environmental
performances of equipment such as machine tools. These perfor-
mances are akin to specifications (e.g., maximum energy consump-
tion), that are independent of specific processes in the use stage of
equipment.
Product designers : The standard offers the possibility for prod-
uct designers to quantify the environmental performance of prod-
ucts, which includes the amount of wastes generated during ma-
chining. Such a performance depends on the form, features, and
aterials in the production stage. Note that EPE data could be syn-
hetically generated through simulations, which is common in de-
ision making processes during design.
Process planners : Process planners define tools and tool paths,
r process plans in the form of numerical control (NC) programs,
or the manufacturing of products. The standard offers the possibil-
ty for process planners to quantify the environmental performance
f process plans in terms such as process time with specified prod-
ct quality, e.g., surface roughness.
Operators : In the case of machine tools, operators do not only
xecute the NC programs, they are responsible for setting up fix-
ures and tool cribs before running the programs, and observing
nd controlling the behavior of machine tools to limit disturbances,
.g., noise and vibration. Such a control loop including the opera-
or can be distinguished from the automated control in a machine
ool. The standard offers the possibility for operators to evaluate
heir control operations by monitoring the energy consumption of
achine tools for example, but the control behavior should be also
xplicitly defined.
Operation managers : With use of environmental performance
riteria similar to those for operators, operation managers may
e able to define the type of operators regarding environmentally
riendly machining operations. Based on the evaluation of opera-
ors, operation managers can assign operators to specific machin-
ng tasks by leveraging the standard’s mode definitions.
.2. Use stages of the standard from a life cycle perspective
Based on the observation of the type of potential stakehold-
rs of ISO 20140, the usage stages of ISO 20140 can be clarified
rom a life cycle perspective. First, these stages include a variety
f independent life cycle stages, e.g., design, production, use, and
nd-of-life, of manufacturing systems. Second, it includes all stages

H. Komoto, W.Z. Bernstein and S. Kwon et al. / Procedia CIRP 90 (2020) 528–533 531
Fig. 3. NIST Product Manufacturing Information (PMI) Test Model used for the eval-
uation experiment ( Lipman and Filliben, 2017 ).
o
u
c
I
d
c
2
4
e
e
A
B
c
i
S
t
P
I
m
t
p
4
a
a
k
(
p
e
w
p
a
4
t
A
(
Fig. 4. Process plans in preparation.
Fig. 5. Machining of a work piece (block) with two machine tools.
e
s
(
A
fi
O
t
f
s
p
a
p
t
b
p
t
i
w
o
m
e
4
f the life cycle as an object of the design and analysis of prod-
ct life cycles of manufacturing systems. Moreover, the standard
an be applied to the production stage of products, in isolation.
n other words, the environmental performance of products (pro-
uced with manufacturing systems) in the other stages of the life
ycle of products can be considered outside of the scope of ISO
0140.
. The usage view of the EPE process in context of an
valuation experiment
In this section, we describe an experiment designed for the
valuation of the EPE process by machining a test part at NIST and
IST. At NIST, we use the Smart Manufacturing Systems (SMS) Test
ed
1 , a standards-based, digitally-enabled machining test bed that
aptures controller-based data via MTConnect. Note that the phys-
cal components of the SMS Test Bed are managed by the NIST
hops, a contract manufacturing shop akin to a small manufac-
urer. At AIST, we use two machining centers situated in the Cyber
hysical Systems (CPS) Research Facility in AIST Tokyo Waterfront.
n order to execute the EPE process for this experiment, the CAD
odel of the product to be fabricated and its specifications about
he tolerances and dimensions are fixed. The usage template pre-
ared for this experiment is shown in Table 2 .
.1. Test part design
We chose a solid model, shown in Fig. 3 , that already serves
s a test artifact ( Lipman and Filliben, 2017 ) for testing compliance
nd conformance to the latest ISO 10303 standard, more commonly
nown as the Standard for the Exchange of of Product model data
STEP). To reduce cost and improve the manufacturability of the
art, we made some small modifications, including (1) scaling the
ntire part by 80 % and (2) introducing a continuous radius fillet
here two flat surfaces meet. The revised model and alternative
rocess plans, which will be introduced later, are open and will be
vailable for download.
.2. Process planning
The process plans were developed assuming the use of machine
ools available at one of the aforementioned facilities at NIST and
IST. At NIST, a machine tool with milling and turning functions
i.e., Mazak Integrex) is used for the entire machining process. The
1 More information can be found at https://smstestbed.nist.gov .
f
ntire process plan is divided into (i) a process plan for the front
ide with ten cutting tools (turning, boring, and flat end-mill) and
ii) another plan for the back side with three cutting tools. At
IST, the entire process plan is divided to rough machining, semi-
nishing, and finishing processes. The 3-axis machining center (i.e.,
kuma M460VE) is used for the rough machining with four cutting
ools, and the 5-axis machining center (i.e., Makino D200Z) is used
or the other processes with eight cutting tools. Furthermore, the
election of the initial shape of work pieces influence the type of
ossible machining processes, the design of fixtures, and eventu-
lly the process duration. Fig. 4 shows the overview of the process
lans developed at AIST. Fig. 5 showcases the physical implemen-
ation of the process plans.
In order to compare two process plans, the EPE process should
e able to deal with a variation of process decomposition. In the
rocess planning stage, the process planners can evaluate alterna-
ive process plans in terms of the number of sub-processes (includ-
ng set-up, fixture changes, and tool changes), or process duration,
hich can be roughly estimated by experienced process planners
r process simulators. Such estimations can be based on process
odels, mental models possessed by the planners, or digital mod-
ls used by simulations, all specific to the employed machine tool.
.3. Part manufacturing
Test workpieces with the same design are manufactured at both
acilities according to their own process plans. The machine tools

532 H. Komoto, W.Z. Bernstein and S. Kwon et al. / Procedia CIRP 90 (2020) 528–533
Table 3
Conditions and results of the EPE experiment held at AIST.
Processes Initial shapes Cutting parameters
Energy demand (EI)
[kWh]
Work count
(SV) [Unit]
Energy Demand per
Work KPI = EI/SV
[kWh/Unit]
Rough
Machining
Block (w100, l100,
h75 [mm])
F750S2400-F600S4000,
F700S2500-F500S4000
4.83 (4.49), 5.42
(4.89)
2 5.13 (4.69)
Rough
Machining
Cylinder (d100,
h75 [mm])
F700S2500-F400S4000 3.57 (3.45) 1 3.57 (3.45)
(Semi)
Finishing
Not applicable. F450S3250, F360S3250,
F495S3250
10.33 (7.51), 7.41
(5.93), 8.41 (5.52)
3 8.71 (6.32)
Fig. 6. Data used in the EPE process for the rough machining processes.
t
(
c
p
a
fi
s
i
i
p
5
p
t
o
d
e
s
m
a
o
h
p
n
p
c
t
D
i
c
d
A
c
M
i
H
e
R
A
I
generate the data about their behavior outputting a variety of data
items. Fig. 6 shows the data used in the EPE process for rough
machining with the 3-axis machining center with different initial
shapes. Specifically, Fig. 6 (a) shows the position and the applied
load of each axis, which are typical types of usage data collected
from the machine when a tool change occurs in the machining
process. Fig. 6 (b) shows the power and energy demands moni-
tored in the machining process, which are the EPE data for this
evaluation experiment. In the EPE aggregation process, the EPE
data are aggregated according to the process modes. As there is
only one piece of equipment in this experiment, the mode of the
machine is regarded as the mode of the process. Fig. 6 (c) shows
the mode of the machine in the machining process, which includes
a tool change and rapid traverses. These modes are recognized by
analyzing the data as shown in Fig. 6 (a). Fig. 6 (d) summarizes the
result of the EPE aggregation process regarding the modes in terms
of the average power and total active time. These values define the
proportion of the energy demand for a specific mode.
Table 3 shows the reference cutting conditions and results of
the EPE experiment. The energy demand, the number of units,
and the energy demand per unit corresponds to the environmen-
al influence ( EI ), system value ( SV ), and KPI of this experiment
KP I = EI/SV ), respectively. The modes other than the active ma-
hining (shown in Fig. 6 (c)) are included in the scope of the EPE
rocess, but the score excluding these modes from the scope are
lso shown in brackets in Table 3 . The cutting conditions are de-
ned by the reference feed rate and spindle speed. The results
how that the selection of the cylinder rather than the block as
nitial shape of the machining process is a good choice consider-
ng the KPI value. It is a typical recommendation to the process
lanners of the machining process.
. Conclusion
ISO 20140 plays a crucial role in evaluating the environmental
erformance of manufacturing systems and processes, while main-
aining consistency in the process for performance comparison. In
rder to clarify the benefits for the users of ISO 20140, this study
escribed and analyzed the usage view of the EPE process with an
valuation experiment jointly conducted by NIST and AIST. Further
tudy includes reporting the result of the EPE evaluation experi-
ent following as specified by the usage template, and investigate
utomated decomposition of machining processes and aggregation
f EPE data as specified by the usage template in terms of the be-
avior of machine tools.
To conclude, this experiment demonstrates that a standard tem-
late for setting up a proper evaluation process promotes commu-
ication across facilities regardless of specific installation and ca-
abilities. Such communication is vital for properly comparing and
ontrasting the environmental performance of different manufac-
uring set-ups.
isclaimer
This work represents an official contribution of NIST and hence
s not subject to copyright in the US. Identification of commer-
ial systems in this paper are for demonstration purposes only and
oes not imply recommendation or endorsement by NIST.
cknowledgments
The authors thank the members of ISO TC184/SC5/WG10 for
omments and advice regarding the contents of ISO 20140, and
anufacturing Science and Technology Center (MSTC) for support-
ng the evaluation experiment at AIST. The authors thank Dr. G.
ererra and Dr. J. Herwan at AIST for conducting the machining
xperiment.
eferences
STM E3012 , 2019. Standard guide for characterizing environmental aspects of man-
ufacturing processes. ASTM . Revision in print ndustrial Internet Consortium , 2015. Industrial Internet Reference Architecture 1.7.
Industrial Internet Consortium .

H. Komoto, W.Z. Bernstein and S. Kwon et al. / Procedia CIRP 90 (2020) 528–533 533
I
I
I
I
K
L
P
R
R
V
SO 20140-1:2019 , 2019. Automation Systems and Integration – Evaluating EnergyEfficiency and Other Factors of Manufacturing Systems that Influence the Envi-
ronment – Part 1: Overview and General Principles. ISO . SO 20140-2:2018 , 2018. Automation Systems and Integration – Evaluating Energy
Efficiency and Other Factors of Manufacturing Systems that Influence the Envi-ronment – Part 2: Environmental Performance Evaluation Process. ISO .
SO 20140-3:2019 , 2019. Automation Systems and Integration – Evaluating EnergyEfficiency and Other Factors of Manufacturing Systems that Influence the En-
vironment – Part 3: Environmental Performance Evaluation Data Aggregation
Process. ISO . SO 20140-5:2017 , 2017. Automation Systems and Integration – Evaluating Energy
Efficiency and Other Factors of Manufacturing Systems that Influence the Envi-ronment – Part 5: Environmental Performance Evaluation Data. ISO .
omoto, H. , Masui, K. , 2018. Model-based design and simulation of smart factoryfrom usage and functional aspects. CIRP Ann. 67 (1), 113–116 .
ipman, R.R. , Filliben, J.J. , 2017. Guide to the NIST PMI CAD Models and CAD SystemPMI Modeling Capability Verification Testing Results. US Department of Com-
merce, National Institute of Standards and Technology . latform I4.0 , 2018. Usage Viewpoint of Application Scenario Value-Based Services.
Federal Ministry for Econimic Affairs and Energy (BMWi) . achuri, S. , Sriram, R.D. , Narayanan, A. , Sarkar, P. , Lee, J.H. , Lyons, K.W. , Kem-
merer, S.J. , 2010. Sustainable manufacturing: metrics, standards, and infrastruc-ture-workshop summary. In: 2010 IEEE International Conference on Automation
Science and Engineering. IEEE, pp. 144–149 .
achuri, S. , Sriram, R.D. , Sarkar, P. , 2009. Metrics, standards and industry best prac-tices for sustainable manufacturing systems. In: 2009 IEEE International Confer-
ence on Automation Science and Engineering. IEEE, pp. 472–477 . ijayaraghaven, A. , Dornfeld, D. , 2010. Automated energy monitoring of machine
tools. CIRP Ann. 59 (1), 21–24 .