environmental risk evaluation report ... · environmental risk evaluation report:...
TRANSCRIPT

i
ENVIRONMENTAL RISK EVALUATION REPORT:PERFLUOROOCTANESULPHONATE (PFOS)
D Brooke, A Footitt, T A Nwaogu
Research Contractor:
Building Research Establishment Ltd Risk and Policy Analysts Ltd ISBN: 978-1-84911-124-9 Product Code: SCHO1009BRBL-E-P
ii
© Environment Agency 2004
All rights reserved. No part of this document may be reproduced, stored in a retrieval system,or transmitted, in any form or by any means, electronic, mechanical, photocopying, recordingor otherwise without prior permission of the Environment Agency.
It is not the intention of this report to imply that any particular substance should or should notbe used for any particular purpose. It is the aim of this report to evaluate concerns in respectof a wide range of different substances. This report should only be used as a tool to assist inidentifying priorities for environmental risk assessment. It should not be used in isolation toassess whether any particular substance should be used for any particular purpose.
The Agency has used all reasonable skill and expertise to ensure that the findings of thisreport are factually correct. The Agency accepts no liability for:- any losses that arise from any subsequent interpretation or application of the
findings of this report by a third party; or- indirect or consequential loss (including loss of business, profit, reputation or
goodwill).
The Agency does not intend to exclude any liability that cannot be excluded at law.
Dissemination StatusInternal: Release to RegionsExternal: Public domain
Statement of UseThis report summarises the environmental hazards and risks of PFOS based on its recent andcurrent use pattern in the EU. The information will be used by the Chemicals Policy functionof the Agency and the Department of Environment, Food & Rural Affairs to inform decisionson the need for risk management.
KeywordsPFOS, perfluorooctane sulphonate, perfluoroalkylated, hazard, risk, PBT
Research ContractorBuilding Research EstablishmentBucknalls Lane, Garston, Watford, WD25 9XX
Risk and Policy AnalystsFarthing Green House, 1 Beccles RoadLoddon, Norfolk, NR14 6LT
Environment Agency’s Project ManagerSteve RobertsonEnvironment Agency, Chemicals Assessment SectionIsis House, Howbery Park, Wallingford OX10 8BDFax: +44 (0)1491 828556 http://www.environment-agency.gov.uk/
This report was produced by the Environment Agency’s Science Group.

iii
Foreword
Perfluorooctane sulphonate (PFOS) is a fully fluorinated anion, the related compounds ofwhich are members of the large family of perfluoroalkylated substances (PFAS). The termPFOS-related substances is used in this document to represent any substance containing thePFOS moiety (C8F17SO2) with the potential to degrade to PFOS in the environment.
In 2000, 3M (a major global producer of PFOS based in the United States) announced that thecompany would phase out the production of PFOS voluntarily from 2001 onwards.Production by 3M has now ceased. At a meeting of the OECD Task Force on ExistingChemicals following this announcement, several OECD countries agreed to work togetherinformally to collect information on the effects of PFOS on the environment and on humanhealth to allow hazard assessment to be produced. This hazard assessment concluded that thepresence and persistence of PFOS in the environment, as well as its toxicity andbioaccumulation potential, indicate a cause for concern for the environment and for humanhealth.
In response to these findings, the Environment Agency has commissioned this study to reviewthe risks arising from current uses of PFOS-related substances. This work is being undertakenin tandem with a study commissioned by the Department for Environment, Food and RuralAffairs (Defra) to prepare a Risk Reduction Strategy for PFOS-related substances, includingan analysis of the advantages and drawbacks of potential risk reduction options. This RiskReduction Strategy will follow the provision of the EU Existing Substances Regulationaccording to which, where controls on the marketing and use of the substances in question areproposed, an analysis of the advantages and drawbacks of the substance should be undertaken.
A PBT assessment has been carried out as part of this risk evaluation. Although this PBTassessment concludes that PFOS is a PBT, calculations to allow a PEC:PNEC comparisonhave also been conducted to help establish priorities for the risk reduction strategy.
This risk evaluation report (RER) has been prepared in accordance with the principles ofCouncil Regulation (EEC) 793/93 on the evaluation and control of the risks of “existing”substances (the “Existing Substances Regulation” or “ESR”) and the methods laid down inCommission Regulation (EC) 1488/941 which is supported by a technical guidance document(TGD)2. The layout follows the format of an ESR RAR with a few small modifications, sothat a reader familiar with such assessments can quickly find the information in which theyare interested. It has been produced using publicly available data gathered and assessed by thecontractor for the Environment Agency. Additional information has been submitted byvarious organisations and companies as part of the information gathering and consultation forthe preparation of the Risk Reduction Strategy. Comments received during a consultation on adraft version of this report in June 2004 have also been taken into account.
Peer review process: The Environment Agency wishes to ensure that the data used in thisreport are as complete and accurate as possible. Original reports have been obtained andassessed for reliability where possible (it is clearly indicated where this is not the case), exceptwhere this has already been done for OECD SIDS purposes. In addition, results from therobust summaries in the 3M assessment (3M, 2003) have been included on the basis of the
1 O.J. No. L 161, 29/06/1994 p. 0003 – 0011
2 Technical Guidance Document, (First edition), Part I-V, ISBN 92-827-801[1234] and Second Edition, Parts I-IV, EUR 20418 EN/1-4

iv
validity markings given in them. The report is currently under discussion by stakeholders withthe aim of reaching consensus. However, it has not been possible to obtain as much industry-specific information as initially hoped. The information contained in this report does not,therefore, necessarily provide a sufficient basis for decision-making regarding the hazards,exposures or the risks associated with the substance.
In order to avoid possible misinterpretations or misuse of the findings in this draft, anyonewishing to cite or quote this report is advised contact the Environment Agency beforehand.
The Environment Agency would like to thank those who contributed information to the RiskReduction Strategy and hence to this risk evaluation.
Date of Last Literature Search: February 2004

v
Executive Summary
PFOS is the perfluorooctane sulphonate anion and is not a substance as such. It is or wascommercially available in the form of salts, derivatives (PFOS-substances) and polymers(PFOS-polymers). The PFOS moiety is very stable, and has been found in biota in large partsof the world. This evaluation has been produced to support the development of a riskreduction strategy for PFOS, and has been carried out using the methods of the EU TechnicalGuidance Document.
The term PFOS-related substance is used to refer to any or all of the substances which containthe PFOS moiety (defined as the C8F17SO2 group) and may break down in the environment togive PFOS. PFOS, the substances and the polymers are made from a common source material.The major producer of the substances, 3M, has voluntarily ceased production. Hence the usein some areas has reduced significantly or even stopped, although the potential market for useremains since there are other known suppliers.
The major uses for the PFOS-related substances were in providing grease, oil and waterresistance to materials such as textiles, carpets, paper and in general coatings. The substancesused in these areas were largely PFOS-polymers for fabrics and PFOS-substances for papertreatment and coatings. Other smaller volume uses, which are continuing for the present, arein chromium plating, photolithography, photography and in hydraulic fluids for aviation. Onefurther use in fire-fighting foams is discussed; the inclusion of PFOS-related substance in newfoams has ceased, but stockpiles of foams containing PFOS still exist and may be used.
In order to simplify the calculations and evaluation, the use areas have been treated as if theyuse one or more of: PFOS itself; an example PFOS substance; or a hypothetical polymer.Estimates of emissions from each use area have been made, including for those uses which areconsidered to have reduced or ceased (as it is possible that other suppliers could provideproducts for use in these areas). The estimates are made on the basis of a mixture ofinformation from industry, emission scenario documents and the default values from theTechnical Guidance Document. The emission estimates are for emissions of PFOS, PFOS-substance or PFOS-polymer as appropriate. The calculations of the environmental distributionand concentrations have been made using the EUSES 2 program, considering variouscombinations of the use patterns and different rates at which the substances and polymers maybreak down to PFOS in the environment.
PFOS is not degradable, either abiotically or through aerobic or anaerobic biodegradation. Ithas low volatility. It accumulates in fish, with a measured bioconcentration factor of 2796.Measured sorption coefficients show moderate sorption in soils, less in sediment.
The ecotoxicity data for PFOS have been reviewed. Although limited, the data do not showany obvious differences in toxicity between different salts. PFOS is moderately toxic toaquatic organisms, with acute toxicity values (L(E)C50) in the range 1 - 10 mg/l. Coupled withthe lack of degradability, this indicates that it would be classified as dangerous for theenvironment, with the risk phrases R51 (toxic to aquatic organisms) and R53 (may cause longterm adverse effects on the aquatic environment). There are several long term test results withaquatic organisms available, the lowest no effect concentration being 0.25 mg/l for Mysidshrimp. The PNECs for freshwater and marine water are derived from this value as 25 µg/land 2.5 µg/l respectively.

vi
Mammalian toxicity data have not been reviewed for this evaluation; instead the evaluationcarried out for the OECD hazard assessment has been used. The key study reviewed for theOECD report was a two-year feeding study with rats which had a no observed adverse effectlevel of 0.5 ppm for liver effects in male rats. This has been used to give a PNEC forsecondary poisoning of 0.0167 mg/kg wwt. An alternative PNEC of 0.067 mg/kg has alsobeen considered.
A PBT assessment shows that PFOS meets the P (and likely the vP), B and T criteria. Strictlythis means that a conventional risk evaluation through a PEC:PNEC comparison is notrequired. However, it was considered useful to carry out such a comparison in order to assistin the setting of priorities for the risk reduction strategy. The risk evaluation shows possiblerisks for secondary poisoning for all use areas in all of the scenarios used to examine theeffects of different rates of break down and different combinations of releases. Risks are alsoindicated for secondary poisoning through exposure to the calculated regional backgroundconcentrations, for the freshwater and marine food chains. The same is true when using thealternative PNEC value. As both the PNECs are based on long term studies, possiblerefinement of the evaluation seems most likely through revision of the emission estimates. Forfreshwater, the regional emissions would need to be reduced to less than one twelfth of theestimated values in order to remove the risk at the regional level (assuming a similardistribution of emissions), or to less than one third if the alternative PNEC is used. There arealso indications of possible effects from the releases of fire fighting foams to water. Again thePNEC is unlikely to be revised upwards; here, the release estimates are necessarily arbitrary tosome degree, as they relate to the use in fighting fire.
There are a number of areas of uncertainty in the evaluation, in particular in relation to thedegradation of PFOS-substances to PFOS in the environment (both the rate and the yield). Anumber of different assumptions about this have been included in the evaluation. Althoughsome of the alternative assumptions result in a reduction in the PEC/PNEC ratios, in mostcases the risks for secondary poisoning remain. A comparison of the PNEC(s) withconcentrations measured in aquatic biota suggests that levels of concern may be present insome areas.
N.B. No assessment of risk to humans has been carried out.

vii
CONTENTS
1 GENERAL SUBSTANCE INFORMATION ................................................................. 11.1 IDENTIFICATION OF THE SUBSTANCE ................................................................. 1
1.2 PURITY/IMPURITIES, ADDITIVES............................................................................ 21.2.1 Composition ......................................................................................................................................21.2.2 Additives............................................................................................................................................2
1.3 PHYSICO-CHEMICAL PROPERTIES ........................................................................ 21.3.1 Physical state (at ntp).........................................................................................................................21.3.2 Melting point .....................................................................................................................................21.3.3 Boiling point ......................................................................................................................................21.3.4 Relative density .................................................................................................................................31.3.5 Vapour pressure.................................................................................................................................31.3.6 Water solubility .................................................................................................................................31.3.7 n-Octanol-water partition coefficient.................................................................................................31.3.8 Henry’s Law constant ........................................................................................................................41.3.9 pKa ....................................................................................................................................................41.3.10 Summary of physico-chemical properties .........................................................................................4
2 GENERAL INFORMATION ON EXPOSURE............................................................. 52.1 PRODUCTION ................................................................................................................. 5
2.1.1 Production process.............................................................................................................................5
2.2 GROUPING OF PFOS-RELATED SUBSTANCES ..................................................... 6
2.3 USES .................................................................................................................................. 82.3.1 General information on uses ..............................................................................................................82.3.2 Metal (chromium) plating..................................................................................................................92.3.3 Photolithography (semi-conductors)..................................................................................................92.3.4 Photography.....................................................................................................................................102.3.5 Aviation ...........................................................................................................................................102.3.6 Fire-fighting foams ..........................................................................................................................112.3.7 Protective coatings for fabrics (carpets, textiles and leather) ..........................................................122.3.8 Paper treatment ................................................................................................................................122.3.9 Coatings...........................................................................................................................................132.3.10 Other uses ........................................................................................................................................132.3.11 Summary..........................................................................................................................................13
2.4 TRENDS .......................................................................................................................... 14
2.5 LEGISLATIVE CONTROLS........................................................................................ 14
3 ENVIRONMENTAL EXPOSURE................................................................................ 153.1 ENVIRONMENTAL RELEASES ................................................................................ 15
3.1.1 General introduction ........................................................................................................................153.1.2 Metal (chromium) plating................................................................................................................153.1.3 Photolithography .............................................................................................................................173.1.4 Photography.....................................................................................................................................193.1.5 Aviation ...........................................................................................................................................203.1.6 Fire-fighting foams ..........................................................................................................................213.1.7 Fabric treatment ...............................................................................................................................223.1.8 Paper treatment ................................................................................................................................253.1.9 Coatings...........................................................................................................................................263.1.10 Summary..........................................................................................................................................26
3.2 ENVIRONMENTAL FATE AND DISTRIBUTION .................................................. 263.2.1 Atmospheric degradation.................................................................................................................263.2.2 Aquatic degradation.........................................................................................................................273.2.3 Degradation in soil...........................................................................................................................30

viii
3.2.4 Evaluation of environmental degradation data ................................................................................303.2.5 Environmental distribution ..............................................................................................................303.2.6 Bioaccumulation and metabolism....................................................................................................33
3.3 ENVIRONMENTAL CONCENTRATIONS ............................................................... 363.3.1 Background to calculations..............................................................................................................363.3.2 Aquatic compartment (surface water, sediment and wastewater treatment plant)...........................393.3.3 Terrestrial compartment...................................................................................................................423.3.4 Atmospheric compartment...............................................................................................................433.3.5 Food chain exposure ........................................................................................................................44
4 EFFECTS ASSESSMENT: HAZARD IDENTIFICATION AND DOSE(CONCENTRATION) - RESPONSE (EFFECT ASSESSMENT)............................. 51
4.1 AQUATIC COMPARTMENT (INCLUDING SEDIMENT)..................................... 514.1.1 Aquatic studies ................................................................................................................................514.1.2 Sediment toxicity .............................................................................................................................544.1.3 Wastewater treatment plant (WWTP) micro-organisms..................................................................544.1.4 Predicted No Effect Concentrations (PNECs) for the aquatic compartment ...................................54
4.2 TERRESTRIAL COMPARTMENT ............................................................................ 554.2.1 Terrestrial toxicity data....................................................................................................................554.2.2 Calculation of PNEC for the soil compartment ...............................................................................56
4.3 ATMOSPHERIC COMPARTMENT........................................................................... 57
4.4 NON-COMPARTMENT SPECIFIC EFFECTS RELEVANT TO THE FOODCHAIN (SECONDARY POISONING) ........................................................................ 57
4.4.1 Mammalian toxicity data .................................................................................................................574.4.2 Avian toxicity ..................................................................................................................................584.4.3 Derivation of PNECoral.....................................................................................................................58
4.5 CLASSIFICATION FOR ENVIRONMENTAL HAZARD ....................................... 59
5 RISK EVALUATION..................................................................................................... 605.1 AQUATIC COMPARTMENT ...................................................................................... 60
5.1.1 Surface water and sediment .............................................................................................................605.1.2 Wastewater treatment plant (WWTP) micro-organisms..................................................................62
5.2 TERRESTRIAL COMPARTMENT ............................................................................ 62
5.3 ATMOSPHERIC COMPARTMENT........................................................................... 63
5.4 NON-COMPARTMENT SPECIFIC EFFECTS RELEVANT TO THE FOODCHAIN (SECONDARY POISONING) ........................................................................ 63
5.4.1 Freshwater food chain......................................................................................................................635.4.2 Terrestrial food chain.......................................................................................................................64
5.5 MARINE ENVIRONMENT .......................................................................................... 655.5.1 PBT assessment ...............................................................................................................................655.5.2 Marine risk evaluation .....................................................................................................................68
5.6 UNCERTAINTIES ......................................................................................................... 705.6.1 PFOS-salt properties........................................................................................................................705.6.2 PFOS releases ..................................................................................................................................715.6.3 PFOS-substance properties ..............................................................................................................715.6.4 PFOS-substance degradation ...........................................................................................................71
5.7 SUMMARY OF CONCLUSIONS ................................................................................ 72
6 REFERENCES................................................................................................................ 74

1
1 GENERAL SUBSTANCE INFORMATION
1.1 IDENTIFICATION OF THE SUBSTANCE
The subject of this risk evaluation is not a discrete substance and does not have a CASnumber. It is the perfluorooctane sulphonate anion, known as PFOS. The parent sulphonicacid and some of its commercially important salts are:
Perfluorooctane sulphonic acid (CAS No. 1763-23-1)Potassium salt (CAS No. 2795-39-3)Diethanolamine salt (CAS No. 70225-39-5)Ammonium salt (CAS No. 29081-56-9)Lithium salt (CAS No. 29457-72-5)
The following sections deal with the properties of this group of substances, generallydetermined for the potassium salt. The risk evaluation also considers possible releases ofPFOS from other products, either directly or from the breakdown of other substances. Section2 discusses the production of these substances and the properties necessary for assessing theirenvironmental behaviour are discussed in Section 3. Some issues relating to the purity andcomposition are considered in the current section.
For the purpose of this evaluation, all substances (simple or polymeric) which contain thePFOS moiety (C8F17SO2-) are termed PFOS-related substances.
Structure
PFOS acid
Potassium salt
Example amido derivative, N-EtFOSE (n-ethylperfluorooctanesulphonamidoethanol)
It is expected that the anion will be the form present in the environment, probably associatedwith metal cations (3M, 2003).

2
1.2 PURITY/IMPURITIES, ADDITIVES
1.2.1 Composition
The production processes for PFOS-related substances are described in Section 2. Althoughthe starting material is n-octane sulphonyl fluoride, this will contain some non-linear C8compounds. The fluorination process is expected to lead to some fragmentation of the chain.Thus the product of the fluorination step will contain linear and non-linear chains, mostly C8but with other chain lengths present. RIKZ (2002) quote 3M as reporting a final product (asPFOSF, see Section 2) of approximately 70% n-PFOSF and 30% branched impuritiesincluding odd and even chain lengths. An alternative description of the content is 90% of C8molecules, of which 25% are branched, with 5-10% C6 compounds and the remainder C7 (2-5%) and C5 compounds. A similar distribution is assumed to apply to all products based onthe ECF process (see Section 2.1.1), whether produced by 3M or by other companies. Nospecific information on other companies’ products has been identified.
These figures relate to the major precursor of PFOS-related substances, and are assumed toapply to the products made from this. For the purpose of this evaluation, the presence ofdiffering chain lengths is ignored. The quantities of PFOS-related substances produced andused are assumed to relate to the C8 moiety, recognising that this may lead to some over-estimation of releases.
Other issues relating to the composition of substances and polymers made from the precursorare considered in Section 2, in particular in relation to the presence of residual monomers orunreacted substances in products.
1.2.2 Additives
No information on possible additives has been located.
1.3 PHYSICO-CHEMICAL PROPERTIES
This section discusses the properties relevant to the PFOS anion, mainly in the form of thepotassium salt. Data are taken largely from the OECD hazard assessment (OECD, 2002) andthe 3M assessment (3M, 2003). The original sources of these data have not been reviewed; inmany cases they are 3M reports, which are summarised in the robust summaries in the 3M(2003) document.
1.3.1 Physical state (at ntp)
The potassium salt of PFOS is a white powder at normal temperature and pressure.
1.3.2 Melting point
No indications of melting were seen with the potassium salt at up to 400°C, which was themaximum temperature specified for the instrument used. A value of >400°C will be used inthis evaluation.
1.3.3 Boiling point
In view of the high melting point, no attempts have been made to measure the boiling point.

3
1.3.4 Relative density
The relative densities (specific gravities) of the salts are given in the OECD assessment as:potassium ~0.6; lithium ~1.1; ammonium ~1.1; diethanolamine ~1.1.
1.3.5 Vapour pressure
A vapour pressure of 3.31x10⁻⁴ Pa has been measured for the potassium salt, using thespinning rotor method (OECD 104). A note in the 3M assessment comments that this result isthought to be due to volatile impurities in the substance. This is supported to some extent by acalculated vapour pressure of 1.9x10⁻⁹ Pa using the modified Grain method in theMPBPVPWIN (v 1.41) program, with a melting point of 400°C selected. Calculated valuesfor other substances range from 3.1x10⁻¹¹ Pa for the diethanolamine salt to 0.85 Pa for theacid. The measured value will be used in this evaluation, recognising its limitations.
1.3.6 Water solubility
The OECD assessment quotes a value of 570 mg/l in pure water from 3M (1999) reports. Themore recent 3M assessment (2003) has the results of two determinations. Both involved theequilibration of an excess of the substance with pure water at 30°C, followed by equilibrationat a lower temperature (either 20°C or 24-25°C). Solutions in the 24-25°C experiment werecentrifuged before sampling and analysis, this process was not noted for the 20°Cexperiment. The results were 519 mg/l at 20±0.5°C, and 680 mg/l at 24-25°C. The 3Massessment takes a mean value of 600 mg/l. Both studies are given a validity rating of 1 andso are considered fully valid. For this evaluation the value at 20°C, 519 mg/l, will be used ascloser to environmental conditions.
Solubility has also been determined in salt waters (3M, 2003), and is reduced from that inpure water. In natural seawater a solubility of 12.4 mg/l at 22-23°C was measured. A value of20.0 mg/l was obtained for a sodium chloride solution at 3.5% salinity, the same as thenatural seawater.
1.3.7 n-Octanol-water partition coefficient
The surface active properties of the substance make a direct determination of the octanol-water partition coefficient impossible. In a preliminary study reported by 3M an inseparableemulsion was formed. 3M determined the solubility of PFOS in octanol as 56 mg/l, andcalculated the log Kow from the ratio of solubilities, giving a value of -1.08. The studysummary notes that this is not a real value.
Using the KOWWIN program, a value of 4.13 is calculated for log Kow for the potassiumsalt, and a value of 6.28 for the acid. The reliability of this program for substances of thistype is unknown.
The octanol-water partition coefficient is often used to estimate other properties such asbioconcentration factors and sorption coefficients. The lack of a reliable measured value forthis substance means this cannot be done here. However, a number of the required propertieshave been measured directly, and although there are limitations to these measurements theywill be used in the evaluation. Where values for properties have not been measured, asurrogate value for the log Kow will be estimated from suitable measured data. These valueswill be discussed in Section 3.
4
1.3.8 Henry’s Law constant
3M report a study designed to measure air-water partitioning directly. Although a non-standard method, it was considered suitable for substances with low air-water partitioncoefficients (Kaw). The conclusion from the study was that PFOS was essentially non-volatile,significantly less so than water, which has a Kaw of 2x10⁻⁵ (Henry’s law constant of0.044 Pa m3/mole).
From the solubility and vapour pressure values above, the Henry’s Law constant can becalculated as the ratio, at 3.19x10⁻⁴ Pa m3/mole (Kaw = 1.35x10⁻⁷). This value will be used inthe evaluation as an indication of the properties of the substance.
1.3.9 pKa
No direct measurement of the pKa of the acid has been located. A calculated value of -3.27has been provided in comments from Finland, obtained from the ACD/I-Lab Web Service.3M (personal communication) confirm that the substance is considered to be a strong acid.The value indicates that PFOS will be present in the environment completely in the ionisedform, and that all determination of properties here which involve the substance in solutionrelate to the anionic form.
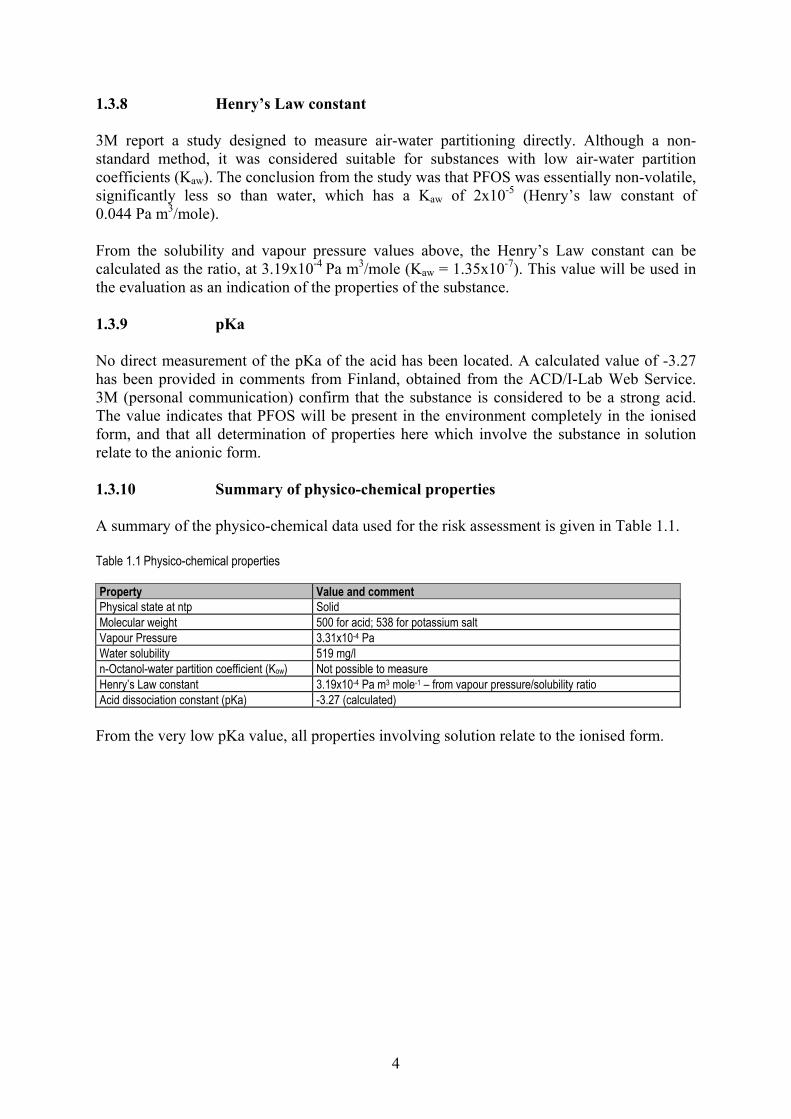
1.3.10 Summary of physico-chemical properties
A summary of the physico-chemical data used for the risk assessment is given in Table 1.1.
Table 1.1 Physico-chemical properties
Property Value and commentPhysical state at ntp SolidMolecular weight 500 for acid; 538 for potassium saltVapour Pressure 3.31x10⁻⁴ PaWater solubility 519 mg/ln-Octanol-water partition coefficient (Kow) Not possible to measureHenry’s Law constant 3.19x10⁻⁴ Pa m3 mole-1 – from vapour pressure/solubility ratioAcid dissociation constant (pKa) -3.27 (calculated)
From the very low pKa value, all properties involving solution relate to the ionised form.

5
2 GENERAL INFORMATION ON EXPOSURE
Information in this Section and Section 3 has been taken from a number of sources. Wherethese are published sources, this has been indicated. In some cases the information wasobtained as part of the consultations carried out for the production of the Risk ReductionStrategy report, which included consultation on aspects required for this risk evaluation.Reference to “the consultation” in this report is intended to cover these cases. More detail canbe found in the Risk Reduction Strategy report in some cases.
2.1 PRODUCTION
It is understood that production of significant quantities of PFOS-related substances has nevertaken place in the UK. All such substances have been imported. Therefore this life cycle stepis not considered further in this evaluation in terms of quantities produced or emissions.However, a description of the production processes is needed to explain the source of thedifferent types of substances considered in this evaluation, and to contribute to the basis onwhich they are later grouped. 2.1.1 Production process
Information in this section is taken from the 3M assessment (3M, 2003) and the OECDhazard assessment (OECD, 2002). PFOS-related substances are manufactured by a processknown as Simons Electro-Chemical Fluorination (ECF). In this process, organic feedstocksare dispersed in liquid anhydrous hydrogen fluoride, and an electric current is passed throughthe solution, leading to the replacement of all of the hydrogen atoms in the molecule withfluorine atoms.
The starting feedstock for this process is 1-octanesulphonyl fluoride, and the initial product isperfluorooctanesulphonyl fluoride (PFOSF). This product is sold commercially to someextent, but is mainly used as an intermediate in the production of other substances. Thesimplest of these is PFOS itself, produced by hydrolysis of PFOSF. The various salts are thenproduced from this.
The majority of PFOSF is reacted first with either methylamine or ethylamine to give eitherN-methyl- or N-ethyl perfluorooctane sulphonamide. These intermediates can be used tomake various amides, oxazolidinones, silanes, carboxylates and alkoxylates which areavailable commercially.
The sulphonamide derivatives can be reacted with ethyl carbonate to form either N-methyl-or N-ethylperfluorooctanesulphonamidoethanol (N-MeFOSE and N-EtFOSE). These thenform the basis of adipates, phosphate esters, fatty acid esters, urethanes, copolymers andacrylates as commercialised products. The majority of the PFOSF-related products made by3M were from this group of products.
It should be noted that the secondary reactions producing the various products are single orsequential batch reactions, and do not necessarily lead to pure products. There may bevarying amounts of fluorochemical residuals (unreacted or partially reacted starting materialsor intermediate products) carried forward into the final product. According to 3M theseresidues are present at around 1% or less in the final commercial products. Whereinformation has been provided on fluorochemical residuals for this evaluation, it has beenassumed that it relates to these unreacted materials. Possible releases of these residuals are

6
considered along with releases of the products themselves in Section 3, with an assumedcontent of 1% if no more specific information is available.
Figure 2.1 shows the flow of PFOS-related substances from initial production to finalproducts.
2.2 GROUPING OF PFOS-RELATED SUBSTANCES
As part of the work in developing the Risk Reduction Strategy, a list of substances containingthe PFOS moiety was produced (Appendix 1). These substances are considered to have thepotential to lead to releases of PFOS to the environment. These include salts of PFOS, simplederivatives and polymeric materials. In attempting to assess the emissions of PFOS-relatedsubstances to the environment, it is neither practical nor realistic to attempt to assess therelease and fate of each individual substance. Rather, these substances have been grouped in away that takes account of the apparent relative ease with which PFOS could be produced.This has been done on a fairly subjective basis, as there is little information on the breakdownof these substances in the environment. In grouping these substances, the general type anddescription of the PFOS-related substances used in each sector have been used to select therelevant group for the substances. A three way division has been employed on the abovebasis.
The first group includes substances which are effectively PFOS itself, in the form of salts ofperfluorooctane sulphonic acid - salts with potassium, lithium, sodium, ammonium (includingquaternary ammonium) and diethanolamine. The use of products containing these substancescan lead to the direct emission of PFOS to the environment. The properties of PFOS saltshave been used as far as possible in estimating emissions and behaviour in the environment.Measured property values have been used as far as possible, rather than the usual estimatesfrom QSAR approaches - in particular, measurements of sorption coefficients andbioaccumulation. For the purpose of estimating releases and environmental behaviour, thesesubstances will be called PFOS-salts (salts rather than acids as the species will be fullyionised in water in the environment).
In the second group are individual substances which are made from perfluorooctanesulphonyl fluoride (PFOSF) in a parallel route to the production of PFOS. These are theFOSA and FOSE-type substances, together with their relatively simple derivatives. These areconsidered to be potential sources of PFOS in the environment through degradation. There issome evidence for this with the substance N-EtFOSE, but little or none for any othersubstance. The 3M report (3M, 2003) comments that no production of PFOS was seenthrough hydrolysis or aqueous photolysis of a number of compounds; formation of PFOS wasonly seen through biodegradation, largely in studies on N-EtFOSE. Thus assumptions aboutthe extent to which this happens, and the rate, have been made in the model calculations inSection 3. It is not possible to treat each substance of this group individually, so a generic setof properties has been used to estimate emissions and behaviour. There is also littleinformation on the properties of these substances. Most of the information available relates toN-EtFOSE, and this will be used as the basis for these calculations. For the purpose ofestimating releases, these substances will be called PFOS-substances.

Figure 2.1 Masul
Electro-chemical fluorination (ECF) cells(Octanesulphonyl fluoride + HF + electricity)
C-
A-
O-
jorph
Perfluorooctanesulphonyl fluoride(PFOSF)
(Chemical intermediate)
N-Alkylperfluorooctane-sulphonamidoethanol
(FOSE)Chemical intermediate
N-Alkylperfluorooctanesulphonamide(FOSA)
Chemical intermediatePesticide active ingredient
Perfluorooctanesulphonic acid(PFOSA)
Chemical intermediateAcid catalyst for photoresists
arboxylates antistatic agent in photographic paper.
mides pesticide active ingredient.
xazolidinones waterproofing casts/wound dressings.
Alcohols
Silanes
Alkoxylates
Fatty acid esters
Adipates
Urethanes
Polyesters
Acrylates
Copolymers
Phosphate esters
Soil/water repellence for:- carpet;- fabric/upholstery;- apparel;- leather; and- metal/glass.
Oil/water repellence for:- plates;- food containers;- bags;- wraps;- folding cartons- containers;- carbonless forms;- masking papers.
K+, Li+, DEA, NH4+ Salts
- surfactant in fire-fighting foam;- surfactant for alkaline cleaners;- emulsifier in floor polish;- mist suppressant for metal plating
baths;- surfactant for etching acids for circuit
boards; and- pesticide active ingredient for ant bait
traps.
Amines- mist suppressant for metal plating
baths.
Quaternary Ammonium Salts- mist suppressant for metal plating
baths.
Amphoterics- water/solvent repellence for
leather/paper.
7
Product Categories and Applications for Perfluorooctyl-onates (OECD, 2002)

8
The third group are polymeric materials, higher molecular weight polymers derived largelyfrom the FOSE-type substances. These have also been suggested as potential sources ofPFOS in the environment. RIKZ (2002) assumed that all of the PFOS contained in thesesubstances was released. 3M in contrast considered that the polymers were non-degradable.No specific evidence on this has been located. The properties of these polymers may varyover a considerable range, and generic values will be needed. It has been assumed that theyhave low vapour pressures, low solubilities and a higher affinity for solid phases in theenvironment. Assumptions have been made about the extent to which they will break down toPFOS in the environment in the model calculations in Section 3. These substances maycontain residual PFOS-substances, and releases of these will also be considered. This groupof substances will be called PFOS-polymers.
It has been assumed throughout that only substances and polymers derived originally fromPFOSF have the potential to degrade to PFOS in the environment. Hence telomer-derivedsubstances and materials are not included, nor are perfluorooctanoic acid (PFOA) relatedsubstances. It should however be noted that in some areas, it is not always possible to tellwhich specific type of material is being used. Similarly, the distinctions between the threegroups (PFOS-salts, PFOS-substances and PFOS-polymers) are not always clear, and hencein some cases materials may be incorrectly allocated. In some cases the allocation has beensimplified by assuming that all of the material used in a particular area is of one group, wherethe reality may be that substances from different groups are used.
2.3 USES
2.3.1 General information on uses
The use pattern for PFOS-related substances in the UK and the EU has changed significantlysince 3M announced their intention to cease the manufacture of a range of these substances.Information collected during the consultation indicates that their use in a number of the majorareas has effectively ceased, as users have moved to different types of substance to provide asimilar function.
The discussion of uses will initially address those uses expected to continue after thecessation of manufacture by 3M, either because there are no alternatives available at present3,or where there are stocks of PFOS-related substances to use up. These include:
• metal plating;• semi-conductors;• photographic;• aviation; and• fire fighting foams stock.
Uses which have taken place in the UK in the past but which are not considered to be relevantat present will also be considered, especially where products treated with PFOS-relatedsubstances may be in use from some time. These include:
3 Although 3M have ceased production of these substances, there are other potential suppliers for continuinguses. Consultation identified a number of possible suppliers to the UK, for more details see the Risk ReductionStrategy. The EA review of perfluoroalkylated substances (EA, 2001) also has some information on potentialother producers of PFOS-related substances, in the confidential project record.

9
• carpets; • leather/apparel;• textiles/upholstery;• paper and packaging; and• coatings and coating additives.
Other uses which are not considered relevant to the UK or the EU will be mentioned.
In order to provide a common baseline, usage data from 2000 have been used in theevaluation wherever possible. These are largely from information supplied by 3M on theamounts of PFOS-related substances imported into the UK.
2.3.2 Metal (chromium) plating
PFOS-related substances are used to lower the surface tension of metal plating solutions toprevent the formation of mists containing potentially harmful components from the baths. Assuch they are used in chromium plating, in anodising and in acid pickling. The substancesused are of the PFOS-salt type. Four companies supplying mist suppressants containingPFOS-related substances in the UK and the EU indicated the use of the tetraethylammoniumsalt of PFOS for this purpose.
The amount used in the UK has been estimated as <0.5 tonnes per year from informationcollected during the consultation. This level of use is considered to have been stable for thelast few years. The Risk Reduction Strategy estimated that there were around 300 chromiumplaters in the UK. A company in Germany estimated that the EU market was 8.6 - 10 tonnesper year for PFOS-related substances, and this level of use will be used in the estimations.
2.3.3 Photolithography (semi-conductors)
PFOS-related substances are used in a number of functions within the semi-conductorindustry. These relate to photolithography, which is the process by which the circuits areproduced on the semi-conductor wafers. This process uses photoresists, materials whosecomposition is altered on exposure to light, making them either easier or more difficult toremove and so allowing structures to be built up in the wafer. The PFOS-related substancescan form part of the photoresist itself, acting as a photoacid generator in the chemicalamplification of the effect of exposure. They can also be used to add a thin coating to theresist to reduce reflections, either to the top (top anti-reflective coatings, TARC) or bottom(bottom anti-reflective coatings, BARC). PFOS-related substances may also be used assurfactants in developers, or in ancillary products such as edge bead removers (EBRs). ESIA(European Semi-Conductor Industry Association) and SEMI (Semiconductors Equipment &Materials International) have provided information on the use of PFOS-related substances inthe EU in 2002 and this is presented in Table 2.1. The total use is 470 kg per year.
Table 2.1 Typical Concentrations and EU Consumption of PFOS Related Substances in Preparations Used inSemiconductor Applications
Application PFOS Concentration EU Consumption (kg/y)Photoresists 0.02 - 0.1% 46EBR Not available 86TARCs 136BARCs ca. 0.1% 8Developers (surfactant) ca. 0.01% 195

10
There is little information about the specific substances which are used in this area, and thecompanies involved are reluctant to identify them. For the purpose of this evaluation, it isassumed that they are all PFOS-substance type. This assumption will result in greateremissions of PFOS than if they were assumed to be polymers.
2.3.4 Photography
Information collected through the consultation indicates that PFOS-related substances areused in coatings applied to photographic films, papers and printing plates. The substanceswere also used in developing solutions in the past, but recent information from EPCI(European Photographic Chemicals Industry) states that they have been removed from suchproducts. The main function of the substances is to act as anti-static agents. This is to preventstatic discharge, both for the possible effects on workers handling the material, and from thepossible exposure of photographic materials to the discharge. The substances also help inreducing friction, thereby improving transport in cameras, printers and projectors, and areessential to the laying down of multiple thin layers of photographic material on film, creatingcoatings of high complexity in a highly consistent and rapid manner. EPCI indicate that themain area of use for PFOS-related substances is in the medical area (x-rays), with 85% of EUuse in this sector.
In the course of the consultation, six substances which are used in this area were identified.Of these, one is of the PFOS-salt group, one of the PFOS-substance group and the other fourare PFOS-polymers. The OECD assessment indicates that the carboxylate derivatives of N-alkyl-perfluorooctane sulphonamide are used as anti-static agents. For these calculations thesubstances used in this area are assumed to be PFOS-salt for the production of film step, andPFOS-polymers for subsequent steps. The polymers are assumed to contain 1% of PFOS-substances as residuals. Information on the relative proportions of the various types wouldallow the estimates to be improved.
EPCI have provided data on the use of PFOS-related substances in the EU. The amount ofPFOS-related substance used in the production of film in the EU is estimated to be 850 kg peryear. In addition to this, finished articles containing PFOS-related substances imported intothe EU add a further 150 kg per year. Exports of articles containing PFOS-related substancesaccount for 250 kg per year. Hence the overall amount of PFOS-related substance in filmused in the EU is 750 kg per year.
Information from EPCI indicates a concentration of PFOS-related substance in film of 0.1 -0.8 µg/cm2. According to the emission scenario document on the photographic industry in theTechnical Guidance document (TGD), x-ray film has a double coating of photographicmaterial. As this is the main use area of PFOS-related substances according to theinformation from EPCI, the high end of the composition range will be used in thecalculations. Using this, the amount of film which would contain 750 kg is 9.4x1011 cm2. Forcomparison, the amount of x-ray film used in the EU according to the ESD is 7.9x1011 cm2,which is in good agreement.
2.3.5 Aviation
PFOS-related substances are used as a component of fire-resistant hydraulic fluids in aircraft.They act to inhibit erosion and damage to parts of the hydraulic systems and are present inthe fluids at ppm levels. The specific substance used in these fluids is potassiumperfluoroethylcyclohexyl sulphonate, rather than the perfluorooctane sulphonate which is

11
PFOS. Nevertheless they are included in this evaluation, as the perfluorooctane salt may bethe replacement should the ethylcyclohexyl substance become unavailable. Theethylcyclohexyl compound has also been identified by other regulatory agencies in the USand Canada, and 3M have also included this in the products which they have discontinued.
The manufacture of these fluids takes place outside the EU, and so this step is not consideredin the evaluation. The world-wide use of PFOS-related substances in this area is estimated tobe 2.2 tonnes per year (information collected through the consultation). For the purpose ofthis evaluation, it is assumed that one third of this, or 0.73 tonnes, is used in the EU eachyear. The substance is of the PFOS-salt type.
2.3.6 Fire-fighting foams
Foams have been developed to assist in fighting fires involving flammable liquids, where theuse of water is unable to extinguish the fire and may contribute to its spread. Fluorocarbonsurfactants are a component of such foam concentrates, along with synthetic foaming agents,solvents and other substances. In use these foam concentrates are mixed with water andaspirated with air to produced the finished foam. In aqueous film-forming foams, thefluorinated surfactants move to the solution-air interface and produce a very thin film whichspreads over the liquid fuel fire. They are also used in alcohol-resistant foams for firesinvolving more polar solvents, which tend to disintegrate conventional foams. Information onfoam products provided during the consultation indicates that the PFOS-related substancesused are of the PFOS-salt type.
From the consultation, the majority of fluorocarbon surfactants included in foams producedcurrently are derived from the alternative telomer based technology, and so will not give riseto PFOS (the substances involved in the telomer products are largely based on C6 chainsrather than C8). However, PFOS-related substances have been used in such foams and so theproduction and use of these foams is included in this evaluation.
In terms of quantities, it has to be considered that the foam concentrates are stockpiled bypotential users, to be used as and when needed. There are two types of holders of such stockswithin the UK, the Fire Authorities (FA) and major installations (which hold stocks for theirown use and as part of mutual agreements between FAs and industry for provision of firecover at major accidents). Information on the current size of such stockpiles at each of theseholders has been gathered for the Risk Reduction Strategy. The resulting figures are ~76,000litres of PFOS-based foam concentrate held by Fire Authorities, and 2,367,000 litres by majorinstallations (in the UK).
The stocks held by major installations are not considered in this evaluation. These will beused in the event of a major incident, and such use is not considered to be part of the ‘normal’use of the substances. The frequency of use by Fire Authorities is expected to be muchhigher. The average use of fire fighting foams in general by Fire Authorities in the UK hasbeen estimated as 15% per year.
The estimate of use of PFOS-based foams is therefore based on the amounts held by FireAuthorities. Assuming a density of 1, there are 76 tonnes of foam concentrate in the UK,which at a content of 1% of PFOS corresponds to 760 kg. Based on a use rate of 15%, the useof PFOS-related substances in foams is 114 kg per year. Taking the UK as 20% of the EU,the total use is 570 kg per year, with 57 kg in the region.

12
The production of foam concentrates can be considered to be a formulation process. Thereare a limited number of companies producing foams of this type - ten are reported for theEuropean Economic Area, with none in the UK. Information on the quantity produced is onlyavailable for one company, this will be used to estimate local emissions. The use of PFOS-related substances at this site was 40 tonnes per year, which at a concentration of 1% in thefoam concentrate made a total of 4,000 tonnes of concentrate. Note that these are historicaldata, as the company no longer uses PFOS-related substances in its foams.
2.3.7 Protective coatings for fabrics (carpets, textiles and leather)
PFOS-related substances have been used on a range of fabrics and other materials to providesoil, water and oil resistance. They have generally been applied as a coating to the surface, tocreate a protective barrier. The types of PFOS-related substances are the acrylate, adipate andurethane polymers produced from the intermediate substance N-ethylperfluorooctanesulphonamido ethanol. Therefore, for the purpose of this evaluation they are considered to bePFOS-polymers. As such, they contain residual levels of low molecular weight substancesfrom the manufacturing processes. This residual material is assumed to be PFOS-substances,and is present at a level of 1% of the polymer (information provided for the consultation).
The treatment of fabrics with PFOS-related substances is no longer thought to take place inthe UK. For the purpose of this evaluation, the possible emissions from the treatment processwill be considered as an example calculation. Although no longer produced in the UK, treatedfabrics are in use at present and will be so for some time, as at least some of the treatedproduct (carpets, upholstery) have significant lifetimes. Therefore estimates are made of thepossible releases of polymers and of PFOS-substances from such materials in use.
Information on the use of PFOS-related substances in this area was obtained through theconsultation exercise. The approximate figure for use in the UK was 48 tonnes of PFOS-related substance (as polymer), with 23 tonnes on carpets, 15 tonnes on apparel and leather,and 10 tonnes on upholstery. These figure have been used to make estimates of the possibleemissions from this area. Assuming that the UK accounts for 20% of EU use, the total for theEU would be 240 tonnes.
2.3.8 Paper treatment
PFOS-related substances have been used to treat a range of paper types and products. As forfabrics, the main function is to impart grease, oil and water resistance. Such products havebeen used in food contact applications. The major type of substance used appears to bephosphate derivatives of N-EtFOSE (3M, 1999), and they are therefore considered to bePFOS-substances for this evaluation. They are consider to be mainly applied during the papermaking process, rather than being added to finished paper in subsequent operations. Theapproximate use of PFOS-related substances in this area in 2000 was 32 tonnes; assumingthat the UK accounts for 20% of the use then the EU total would be 160 tonnes.
Releases from the paper making process are estimated in Section 3. For paper, there is thepossibility of recycling. However, the nature of the use of these treated papers (foodwrapping etc) suggests that they are more likely to be disposed of in household or municipalwaste rather than entering the recycling streams. Therefore a paper recycling scenario is notconsidered.

13
2.3.9 Coatings
Perfluorinated substances (as a more general class than PFOS-related) have been indicated asbeing used in a wide range of areas in the coatings industries. Some of these areas overlapwith areas covered above, such as textiles. No information on specific uses of PFOS-relatedsubstances has been found in this area, and it may be that such uses are no longer relevant forthe UK. For the purpose of this evaluation, it is assumed that the use was in paints, and thatPFOS-substances were used. The amount used in the UK in 2000 was 18 tonnes; assumingthe UK to account for 20% of the EU gives an EU total of 90 tonnes. The content of PFOS-related substances in coatings is indicated as 0.1 - 1.0% from the consultation information;assuming an average of 0.55% means that 3,273 tonnes of coating were produced in the UKper year, and 16,346 tonnes in the EU.
2.3.10 Other uses
2.3.10.1 Industrial and household cleaning products
A wide range of applications of fluorosurfactants in the household and personal care andindustrial cleaning areas has been identified in the consultation for the Risk ReductionStrategy. For more details, see the Risk Reduction Strategy report. As far as PFOS-relatedsubstances are concerned, specific mention is made of products marketed as alkaline cleaners,floor polishes, denture cleaners and shampoos. These products may have been used byconsumers as well as in industrial contexts. PFOS-related substances have been found in floorpolishes and waxes in a survey in Denmark (this might also be considered as a coating use).There is no information on the amounts used in these areas, and so it is not possible to makeany emission estimates.
2.3.10.2 Pesticides
The use of PFOS-related substances in the manufacture of baits against ants and beetles hasbeen described by 3M. The consultation exercise found one company in the EU producingsuch baits, using 0.5 tonnes of PFOS-related substances (PFOS-salt type) per year. No suchuse has been identified in the UK. There are no scenarios available for emissions from the useof such baits. If all of this quantity were released to the environment then it could make asignificant contribution, but no information on the fate of component in such baits isavailable.
2.3.11 Summary
Table 2.2 summarises the quantities estimated as being used in the EU from the informationin the preceding sections. Note that these figures relate largely to the situation before some ofthe PFOS products were removed from the market.

14
Table 2.2 Estimated EU use for each area
Use area EU quantity(tonnes/year)
Substance type Notes
Chromium plating 10 acid Estimate from German companyPhotolithography 0.47 substance ESIA/SEMI estimate
0.85 acid EPCI estimate, production of filmPhotography0.75 polymers EPCI estimate, use of film
Aviation 0.73 acid One third of world use estimateFire fighting foams 0.57 acid From UK estimate of foam useFabric treatment 240 polymer From UK estimate of 48 tonnes, assuming UK is 20% of EUPaper treatment 160 substance From UK estimate of 32 tonnes, assuming UK is 20% of EUCoatings 90 substance From UK estimate of 18 tonnes, assuming UK is 20% of EU
2.4 TRENDS
The major world producer of PFOS-related substances was 3M. Quantitative data onproduction are only available for this company, but it is considered that the combinedcapacity of the other producers was very much less than that of 3M. The EA review ofperfluoroalkylated substances (Environment Agency, 2001) indicated that 3M had the vastmajority of the market for PFOS-based substances. In 2000, 3M produced around 3,665tonnes of PFOSF, the precursor for PFOS-related substances. In 2003 this had been reducedto zero following 3M’s decision to cease manufacturing.
As a result, the level of use in many areas has decreased significantly over the last two orthree years, in some cases to zero. Users have moved to alternative fluorine-based products(telomer based) in some areas, and to other technologies in other areas. Details of thesechanges are included in the Risk Reduction Strategy report. The main areas where use iscontinuing at present are included in the first list in Section 2.3.1. It is expected that the use infire-fighting foams will reduce further and eventually stop when existing stocks are used upor exceed their shelf life (unless they are disposed of without being used). The level of use inthe other areas may depend on the outcome of the risk reduction strategy.
2.5 LEGISLATIVE CONTROLS
There is currently no legislation on the use of PFOS-reported substances in the EU directlyrelated to their potential environmental and/or human health effects.
As noted above, the main producer of PFOS-related substances, 3M, voluntarily decided tophase out the production of these substances in 2000. A number of industry sectors havetaken voluntary measures to reduce the potential emissions and risks from PFOS-relatedsubstances. More details of these are included in the Risk Reduction Strategy.
There have been a number of international initiatives. The US EPA introduced a significantnew use rule (SNUR), requiring companies to inform them before manufacturing orimporting any listed PFOS chemicals. There have been two such SNURs, listing 88substances and allowing some derogations for essential uses (so that the rule does not applyto substances for these uses). Work is being carried out under the auspices of OSPAR toidentify groups of PFOS substances which should be added to the OSAPR list of Chemicalsfor Priority Action.

15
3 ENVIRONMENTAL EXPOSURE
The evaluation of PFOS is complicated by the number of substances involved and the lack ofinformation about the degree to which they act as sources of PFOS in the environment. Asdescribed in Section 2, the PFOS-related substances have been grouped into three types tosimplify the evaluation. The approach taken here is to estimate the emissions of each of thesethree groups in the form that they used - acid, substance or polymer. Information on the fateand behaviour of PFOS is considered, along with any similar information for the substancesor polymers. The evaluation considers the effect of different assumptions about the rate atwhich the substances and polymers break down in the environment on the predicted levels ofPFOS. Various combinations of uses are also considered, to provide indications of possiblelevels from past uses and possible levels if certain uses were to continue.
3.1 ENVIRONMENTAL RELEASES
3.1.1 General introduction
Emissions have been estimated using a range of different sources of information. It ispreferable to use information related to the specific substance and the specific area of use. Inthis evaluation there are specific estimates of PFOS-related substance emissions fromphotolithography, and some information on losses of polymeric materials from treatedfabrics. For the other areas, use has been made of emission scenario documents (ESDs) wherethese are relevant. Documents used come from the Technical Guidance document, and alsodrafts from the OECD Task Force on Environmental Exposure Assessment. Where there isno suitable ESD, the default A and B tables from the Technical Guidance document havebeen used.
Releases have been estimated for local sources on a daily basis where appropriate. Largerscale emissions are presented on an annual basis. A large number of assumptions have had tobe made in the course of this evaluation. In order to allow some comparison between thedifferent use areas, the standard assumption of 10% activity in the region has been used as thebasis for the regional emission estimates (with the exception of some formulation steps). Thishas been maintained even where there is specific information about the level of use in theUK.
3.1.2 Metal (chromium) plating
The substances used in this area are considered to be of the PFOS-salt type. Information fromthe consultation indicates that any formulation step for these products is likely to be simpledilution, and so only emissions from their use are considered here.
Emissions to water are estimated using the approach taken in the risk assessment forchromium (VI) compounds under the Existing Substances Regulation4. This approach was inturn based on an Emission Scenario Document on Metal Finishing (Environment Agency,1997). It is assumed that a large scale processor treats 40 m2 of metal per hour, over a 12 hourday for 240 days per year. Losses can occur from the treatment tank through solutionremaining on the metal articles as they are removed from the tank – this is called drag-out.For a rack deposition system, the typical drag-out rate is 5 litres per 100 m2 of surface treated.Hence for the site above, the drag-out rate would be 2 litres per hour. Information received
4 Draft risk assessment report available from the European Chemicals Bureau at http://ecb.jrc.it/existing-chemicals/, search on ESIS for substance name sodium dichromate

16
indicates that PFOS-salt substances are present in the treatment bath at ppm levels (personalcomm.). Assuming a level of 10 ppm, then the removal rate for PFOS would be 20 mg perhour. Chromium plating takes place at ~40°C, and consequently there is some evaporation ofwater from the tank. This allows some of the drag out or rinse water to be returned to thetreatment tank. The ESD suggests that 25% of the drag-out can be returned in this way, andso the amount lost is reduced by 25%, to 15 mg per hour. The drag out is removed from themetal by rinsing, so this substance is diluted in the rinse water, but the rate of loss is notaffected by this. For a 12 hour day, the daily loss to water is therefore 180 mg/day. Over240 days the annual loss is 43 g/year.
There may also be the possibility of emissions to air from this process. This should be low, asthe function of the substance is to prevent mist formation during the plating process, and thesubstance has a low vapour pressure. An approach to estimating such emissions is to considerthe maximum limit for chromium (VI) in air of 0.05 mg/m3, and to assume that allcomponents of the treatment bath are present in any mist at their ‘working’ concentrations.From the ESD, the concentration of chromium (VI) in a hard hexavalent chromium bath is~130 g/l. The volume containing 0.05 mg is therefore 3.8x10⁻⁷ litres. At a concentration of10 ppm, this contains 3.8x10⁻⁶ mg of PFOS, hence the air concentration of PFOS is3.8x10-6 mg/m3. No specific information on air flow rates in chromium plating works isavailable, but a rate of 7,200 m3/hour has been used for large lubricant blending sites(Environment Agency 1997a) and is used here as an illustration. For a 12 hour day, this givesa daily removal of air of 86,400 m3, and hence a release of PFOS of 0.33 mg/day. For a240 day year, this is an annual emission of 79 mg.
From the calculations, the overall emission from the site is 43 g/year. This appears to be toolow to account for the amount of PFOS used in this industry in the UK, which is estimated at500 kg per year (Section 2.3.2). It would require over 10,000 sites of the size for which thecalculation has been performed to account for this amount of PFOS, whereas in Section 2.6.6there are estimated to be around 300 platers in the UK. The reasons for this difference are notclear. Consultation with the UK Health and Safety Executive (HSE) has indicated that themist suppressant is added periodically to the tanks every two weeks, which suggests that theability of the substance to provide the suppressant function is lost or reduced over this lengthof time. However, no specific information on amounts added is available. Losses of thesubstance are also possible when the contents of plating baths are disposed of, butinformation from the ESD and from industry is that such baths are maintained in use overlong periods of time without disposal. Bath solutions can be cleaned up by filtration and ionexchange to remove particulates and other metals, but these methods are unlikely to removePFOS. For this evaluation, the daily emissions estimated above will be used to estimate localconcentrations. On the larger scale, it will be assumed that all of the substances sold for usein this area in a year are released to waste water during the course of a year. Emissions to airon this scale are neglected.
Total use in the EU was estimated in Section 2.3.2 to be 10 tonnes per year. Releases areassumed to be 10% (1 tonnes) to the region and 90% (9 tonnes) to the continent, to wastewater. Table 3.1 below provides a summary of emissions from chromium plating.
Table 3.1 Summary of Emissions from Chromium Plating
Local (mg/day) Regional (kg/year) Continental (kg/year)180 (waste water)
0.33 (air) 1000 (waste water) 9000 (waste water)
Note: all releases are of PFOS-salt.
17
3.1.3 Photolithography
For this sector, use has been made of a draft Emission Scenario Document on photoresist usein semiconductor manufacturing produced by the United States Environmental ProtectionAgency. This document has been reviewed by the OECD Task Force on EnvironmentalExposure Assessment, and is intended for publication in the OECD Environmental Healthand Safety Publications series on Emission Scenario Documents.
The PFOS-related substances used in this industry are considered to be PFOS-substances (seeSection 2.3.3).
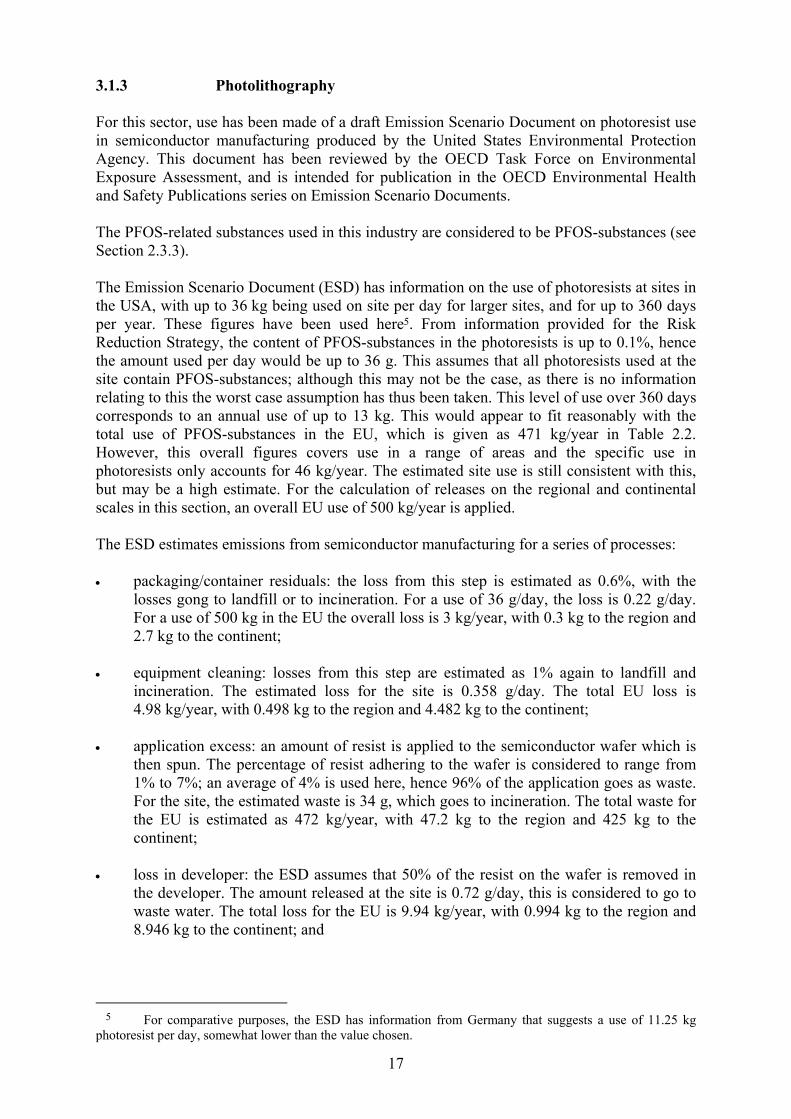
The Emission Scenario Document (ESD) has information on the use of photoresists at sites inthe USA, with up to 36 kg being used on site per day for larger sites, and for up to 360 daysper year. These figures have been used here5. From information provided for the RiskReduction Strategy, the content of PFOS-substances in the photoresists is up to 0.1%, hencethe amount used per day would be up to 36 g. This assumes that all photoresists used at thesite contain PFOS-substances; although this may not be the case, as there is no informationrelating to this the worst case assumption has thus been taken. This level of use over 360 dayscorresponds to an annual use of up to 13 kg. This would appear to fit reasonably with thetotal use of PFOS-substances in the EU, which is given as 471 kg/year in Table 2.2.However, this overall figures covers use in a range of areas and the specific use inphotoresists only accounts for 46 kg/year. The estimated site use is still consistent with this,but may be a high estimate. For the calculation of releases on the regional and continentalscales in this section, an overall EU use of 500 kg/year is applied.
The ESD estimates emissions from semiconductor manufacturing for a series of processes:
• packaging/container residuals: the loss from this step is estimated as 0.6%, with thelosses gong to landfill or to incineration. For a use of 36 g/day, the loss is 0.22 g/day.For a use of 500 kg in the EU the overall loss is 3 kg/year, with 0.3 kg to the region and2.7 kg to the continent;
• equipment cleaning: losses from this step are estimated as 1% again to landfill andincineration. The estimated loss for the site is 0.358 g/day. The total EU loss is4.98 kg/year, with 0.498 kg to the region and 4.482 kg to the continent;
• application excess: an amount of resist is applied to the semiconductor wafer which isthen spun. The percentage of resist adhering to the wafer is considered to range from1% to 7%; an average of 4% is used here, hence 96% of the application goes as waste.For the site, the estimated waste is 34 g, which goes to incineration. The total waste forthe EU is estimated as 472 kg/year, with 47.2 kg to the region and 425 kg to thecontinent;
• loss in developer: the ESD assumes that 50% of the resist on the wafer is removed inthe developer. The amount released at the site is 0.72 g/day, this is considered to go towaste water. The total loss for the EU is 9.94 kg/year, with 0.994 kg to the region and8.946 kg to the continent; and
5 For comparative purposes, the ESD has information from Germany that suggests a use of 11.25 kgphotoresist per day, somewhat lower than the value chosen.

18
• loss on etching and stripping: the ESD assumes that the rest of the resist is removed atthis stage. As 50% was removed at the previous stage, the emissions at this step are thesame as those for developing: 0.72 g/day to water at the local site, 9.94 kg/year for theEU, 0.994 kg/year for the region and 8.946 kg/year for the continent. These emissionsare to waste water or to recycling, release to waste water has been assumed as a worstcase.
Table 3.2 below provides a summary of emissions based on the ESD.
Table 3.2 Summary of emissions for photolithography based on ESD
Step Local emission (g/day) EU (kg/year)Container residual (l/i) 0.22 3Equipment clean (l/i) 0.358 4.98Application excess (l/i) 34 472Developer (ww) 0.72 9.94Etching/stripping (ww) 0.72 9.94
Notes: l/i – landfill/incineration ww – waste water
The overall breakdown of the fate of the PFOS-substances according to the ESD is ~20 kg towaste water and 480 kg to incineration/landfill. This is based on the use of 500 kg per year.ESIA and SEMI estimated a mass balance for the EU based on a use level of 471 kg per year,and concluded a larger proportional release to water, 251 kg/year to waste water and218 kg/year to incineration. Examining the mass balance, the differences arise largelythrough the use of PFOS-substances in areas other than as photoresists. For the anti-reflectivecoatings, the mass balance assumes 40% is present on the wafer when it goes to thedeveloping step, whereas the ESD has only 4% of the photoresist material. On developing, allof the remaining anti-reflective coating is removed, thus entering the waste water streamrather than going to incineration as in the ESD. Part of the PFOS-substances are used in thedeveloper in the EU, and this is considered to go directly into waste water according to themass balance. The net effect is that a greater proportion of the PFOS-substances used go intowaste water.
The mass balance is considered to be more relevant for the EU, and so the overall emissionsfrom this will be used for the regional and continental emissions.
These give 25 kg/year to waste water on the regional scale, and 226 kg/year to waste water onthe continental scale. For the local scale, the emissions estimated with the ESD will be used,but with the addition of a release for the use of PFOS-substances in the developer. It isassumed that the site uses developer and resist materials containing PFOS-substances in thesame proportions. The site used for calculations uses 13 kg of PFOS-substance as resists etc,from a total of 276 kg for this type of use (or 4.7%). The amount of PFOS-substance indevelopers is therefore 4.7% of the total in developer (195 kg/year), or 9.2 kg/year. For360 days of use, this is 25.6 g/day. Combined with the estimated releases from resistmaterials of 1.43 g/day, the local emission is 27 g/day. Table 3.14 below provides a summaryof emissions from photolithographic processes.
Table 3.3 Summary of emissions from photolithography
Local (g/day) Regional (kg/year) Continental (kg/year)27 25 226
Note: All emissions are to waste water and are of PFOS-substances.

19
In comments on the consultation for the risk reduction strategy, ESIA/SEMI indicated thatthe use of PFOS-related substances in developers is not a critical use (in contrast to the use inresists) and so could be replaced. The effect of phasing out the use of PFOS-relatedsubstances in this area is considered in Appendix 3.
3.1.4 Photography
From Section 2.3.4, both PFOS-salts and PFOS-polymers may be used in this area. For thepurpose of these calculations, it will be assumed that they are PFOS-salt for the production offilm step, and PFOS-polymers for subsequent steps. The polymers are assumed to contain 1%PFOS-substance. Information on the relative proportions of the various types would allow theestimates to be improved.
The use of PFOS-related chemicals for the production of film in the EU is estimated inSection 2.3.4 as 850 kg/year. The Technical Guidance Document for the Existing SubstancesRegulation in the EU has been used to estimate releases from the production of film,considered as a formulation step. The emission factors for a substance used in the productionof films etc are 0.0001 to air (for vapour pressures below 1 Pa) and 0.002 to water (for anyfunction other than control of crystal growth). The content of PFOS-related substances in filmis 0.1 – 0.8 µg/cm2. Taking the highest value as representative of use in medical applications,which account for 85% of use in this area, and assuming the use of 850 kg per year, a total of1.06x1012 cm2 of film containing PFOS-related substances could be produced.
The most common backing material for film is PET (polyethylene terephthalate), accordingto Kirk-Othmer (1994). The material has a density of 1.39 g/cm3. The depth of film in Kirk-Othmer is suggested as 45 µm, with 10µm of base layer (backing) and 35µm of coating. Inthe absence of other information, the density will be assumed to apply to the whole film. Themass per unit area is then given as 1.39 x 45x10-4 or 6.3x10⁻³ g/cm2. For a production of1.06x1012 cm2 this gives 6,630 tonnes of film. This quantity of film can be used in the Btables of the TGD (Table B2.8) to estimate the amount produced at one site and the numberof days of operation. This gives a fraction of 0.4 used at one site, applied to the total tonnage,and use over 300 days. The amount of PFOS-related substances used in the EU is 850 kg, so40% is 340 kg, at 1.13 kg/day. From the emission factors above, the releases to air are0.11 g/day and to waste water 2.27 g/day. Overall EU emissions are 0.085 kg/year to air and1.7 kg/year to waste water. As the site accounts for 40% of emissions, these are used for theregional releases. So the regional releases are 0.034 (air) and 0.68 (waste water) kg per year,and the continental releases are 0.051 (air) and 1.02 (waste water) kg per year.
There is little information on whether any of the substances are released from the film when itis processed. EPCI commented that approximately 5-10% of one PFOS material may bereleased from film into film developer. None of the other PFOS materials used in imagingwould be expected to be released on developing. The substances are intended to remain in thefilm, in order to perform their function. The Emission Scenario Document on thephotographic industry in the TGD has a default release factor of 1 in the absence ofinformation, i.e. all of a substance is removed on processing, but this is considered to beinappropriate for these substances. For the purpose of this evaluation, it will be assumed thatany PFOS-substance present will be released on developing, and that polymeric material willremain in the film.
From the Emission Scenario Document, the amount of film (taken as x-ray film) processed inone day at a representative site is 110 m2. The concentration of PFOS-polymer in the film is0.8 µg/cm2, or 8x10⁻⁶ kg/m2. Hence the amount of PFOS-polymer in the film processed in

20
one day is 0.88 g. The amount of PFOS-substance is 1% of this, or 8.8 mg, and this isassumed to be released to water. Across the EU, the 750 kg of PFOS-related substance infilms used in this area would give rise to 7.5 kg of PFOS-substance released to waste water,with 0.75 kg to the region and 6.75 kg to the continent. The polymers not released at this time will remain in the film or other material and may bekept for considerable periods of time. At the end of their use, X-ray film, movie film andcommercial films are typically collected by brokers, and sold for secure disposal (movie film)or recycling of silver and/or PET polymer. These usually result in the incineration of residualmaterials.
Table 3.4 below provides a summary of emissions from the photographic industry.
Table 3.4 Summary of Emissions from Photographic Industry
Step Local (g/day) Regional (kg/year) Continental (kg/year)Film production (formulation) 0.11 (air)
2.27 (waste water)0.034 (air)
0.68 (waste water)0.051 (air)
1.02 (waste water)Film development (processing) 0.0088 (waste water) 0.75 (waste water) 6.75 (waste water)
Note: formulation emissions are of PFOS-salt; processing emissions are of PFOS-substance.
3.1.5 Aviation
PFOS-related substances are used in hydraulic fluids in the aviation industry (Section 2.3.5).These are considered to be PFOS-salt for these calculations (see note on composition inSection 2.3.5). The manufacture of these fluids takes place outside the EU, so there is no needfor a formulation step.
Information relating to emissions of hydraulic fluids is taken from an Emission ScenarioDocument on Lubricants and Lubricant Additives (Environment Agency, 1997a). Losses aremost likely to occur on installation into equipment, during maintenance and on removal fordisposal. Aviation systems are expected to be well sealed and so losses during use areexpected to be low. It is assumed that all of the substances sold during a year go to replacethe fluids lost during the same period, as the suggested replacement or reconditioningfrequency for these types of fluids is one year. The suggested fate of the fluids is 2% loss tothe environment (1.4% to soil, 0.6% to water) over the service life and 98% taken to chemicaldisposal from which no significant emissions are expected.
The world use of PFOS-related substances in this area is 2.2 tonnes, the EU is assumed to useone third of this, or 0.73 tonnes. The losses in the EU are therefore 4.4 kg/year to water and10.2 kg/year to soil. In other work it has been assumed that 10% of the EU releases couldrelate to one large airport. Hence the local and regional annual emissions are 0.44 kg to waterand 1.02 kg to soil. The local site emissions are assumed to take place over 300 days, hencethe daily emissions are 1.5 g/day to waste water and 3.4 g/day to soil.
Table 3.5 below provides a summary of emissions from hydraulic fluids used in the aviationindustry.
Table 3.5 Summary of aviation releases
Local (g/day) Regional (kg/year) Continental (kg/year)1.5 (waste water)
3.4 (soil)0.44 (waste water)
1.02 (soil)3.94 (waste water)
9.2 (soil)Note: all as PFOS-substances

21
3.1.6 Fire-fighting foams
3.1.6.1 Formulation
This calculation has been included to indicate possible releases from the formulation of fire-fighting foams containing PFOS-related substances. Such foams are not thought to beproduced in the UK any longer.
Section 2.3.6 presented information relating to a producer of foams, which gave a use level of40 tonnes of PFOS-related substances per year (the company no longer uses PFOS-basedproducts). At a concentration of 1% in the foams this would make 4,000 tonnes ofconcentrate. This seems high in comparison to the UK stock figures below – these indicate atotal stock of all foams (not just those with PFOS) of just under 4x10⁶ litres, or 4,000 tonnesassuming a density of 1 g/cm3. Nevertheless this tonnage is used as an illustration.
There are no specific data regarding emissions from the production of the foams, so thedefault values from the Technical Guidance Document are used, treating the process as aformulation. The relevant emission factors are 0.001 to air and 0.02 to water, with productionover 300 days per year. The resulting emissions are 0.13 kg/d to air and 2.7 kg/d to water. Asnoted in the next section, these are considered to be PFOS-salt. Larger scale emissions are notconsidered for this use pattern, as full release on use is included in the next section.
3.1.6.2 Use
The fraction of the stock of foams (all types) used by fire services in 2002 was 15%, althoughthe fraction of PFOS-containing foams used was only 0.5%. For the purposes of thesecalculations it will be assumed that the higher rate of use is the normal rate, and that theremaining stock will be used at this rate6. The shelf life of the foams, based on informationfrom the fire services through the consultation, is 10-20 years; a use rate of 15% would useup the existing stock within this time frame, whereas the reduced use rate would leave muchof the stockpile to be disposed of. If the PFOS-containing foam is not used then the releasesbelow will be over-estimates. The volume of PFOS-containing foam concentrates stockpiledin the UK is estimated as 76,000 litres (Section 2.3.6).
Confidential information on the quantities and compositions of formulations imported intothe UK in the past has been provided. From this, it is reasonable to assume a concentration of1% PFOS related substance in the foams as stored (i.e. corresponding to the volumes above).From the information provided the major part of the PFOS containing material was of thePFOS-salt type, and so this will be assumed for these calculations.
Assuming a density of 1 kg/l for the concentrates, the amount of foam is 76 tonnes,containing 760 kg of PFOS-salt. At a use rate of 15% per year, this is a use of 114 kg per yearfor the UK. It is assumed that all of this is released to the environment. As every fire willhave different characteristics, there is probably no such scenario as a typical fire. As anillustrative calculation, it is assumed that 1% of this total is used at a fire7. Two scenarios forthe release to the environment are considered, as possible extremes. In the first (use A), there
6 An alternative calculation assuming use of only 0.5% of PFOS-containing foams is included in Appendix 4and is considered in the risk evaluation.7 Foams may also be used in training exercises. As the assumption of 1% release is only for illustration, thescenario can be considered to cover use in large training exercises. As the water and foam from such exercises islikely to be collected, then use B may be more relevant to the training situation.

22
is no containment of the foam and water, and so 50% of the release (0.57 kg) goes to surfacewater without treatment and 50% (0.57 kg) to soil. In the second (use B), it is assumed thatthe foam and water are collected and passed to a waste water treatment plant, hence 1.14 kgto waste water treatment. The release is assumed to take place over one day.
The UK emissions are assumed to be 20% of those for the EU for these calculations, hencethe EU release is 570 kg/year. This is assumed to be split evenly between surface water andsoil. The regional emissions are 28.5 kg/year to surface water and to soil, and the continentalemissions are 257 kg/year to surface water and to soil.
Table 3.6 below provides a summary of emissions from use of fire fighting foams from fireservice use.
Table 3.6 Summary of Emissions from Use of Fire Fighting Foams
Local (kg/day) Regional (kg/year) Continental (kg/year)Use A: 0.57 (drain)
0.57 (soil)Use B: 1.14 (wwtp)
28.5 (surface water)28.5 (soil)
257 (surface water)257 (soil)
Note: all emissions are of PFOS-salt
These calculations do not specifically address the possible releases from the use of foams onoffshore installations, or in fire protection systems on ships. No specific information on theseareas of use has been located for this evaluation, although Norway indicated that PFOS-containing foams were used in these areas. As the amounts used at a fire as estimated aboveare based on an arbitrary choice, it is suggested that in the first instance these may also beconsidered for the evaluation of offshore use. The calculations for the marine environmentwould be the most relevant (for Use B, the marine calculation will assume direct emission tothe sea without passing through a wwtp) .
3.1.7 Fabric treatment
3.1.7.1 Treatment step
A number of different types of fabric have been treated with PFOS-related substances. Forthe estimation of releases from the treatment step, the treatment of textiles will be used as anexample. Releases from the treatment of other materials may differ to some extent.
To estimate emissions from this treatment step, information from the risk assessment ofdecabromodiphenyl ether (EC 2002) and a draft Emission Scenario Document on textileprocessing produced by the Umweltbundesamt in Germany were used. This ESD has beenreviewed by the OECD Task Force on Environmental Exposure Assessment, and is intendedfor publication in the OECD Environmental Health and Safety Publications series onEmission Scenario Documents. The substances used here are considered to be PFOS-polymer, with a residual 1% content of PFOS-substance.
The assessment of decabromodiphenyl ether considers losses from the backcoating oftextiles, and this will be taken as being similar to the treatment of textiles with PFOS-relatedsubstances. The loss estimated was of 1 kg of formulation per batch used. This was lost towaste water from the setting up and washing down of the coating equipment. It was alsoassumed that a representative site would process five batches per day, hence the daily losswould be 5 kg of formulation. From data on products imported to the UK, the average content

23
of PFOS-related substances in formulations for apparel, carpets and fabrics was ~27%. Hencethe daily emissions to waste water from the site would be 1.35 kg/day.
From Section 2.3.7, the amount of PFOS-related substances used in the apparel, carpet andfabric areas was 48 tonnes. At an average content of 27% this equates to ~180 tonnes offormulation. RIKZ (2002) indicated that a content of 2-3% by weight of perfluoro productwas required in the fabric, which indicates that ~1900 tonnes of fabric could be treated.
From the ESD on textiles, the suggested realistic worst case amount of fabric treated at a siteper day is 13 tonnes, with 225 days production giving 2,925 tonnes of fabric treated per year.As it is unlikely that all of a site’s production each day will be of only one finish on onefabric type, a factor of 0.3 is used to adjust these figures. The result is 3.9 tonnes of fabrictreated with a specific finish per day, and 878 tonnes per year. This yearly figure is just underhalf of the total estimated above for the whole of the UK, which may indicate that thesubstances are used over a smaller number of days, or that the amount used on a site is lessthan estimated.
Taking the 3.9 tonnes per day, at a content of 2.5% PFOS-related substance the amount ofPFOS-related substance used per day would be 97.5 kg. The estimated release per day was1.35 kg, giving an emission factor of 1.4%. Applying this to the UK use level of 48 tonnesgives an annual emission of 672 kg. Taking the UK as 20% of the EU, the total EU emissionswould be 3,360 kg. The regional emission would be 336 kg/year, and the continentalemission 3,024 kg/year. These values relate to the PFOS-polymer. Assuming a 1% content ofPFOS-substance, the releases of PFOS-substance would be 3.4 kg/year (regional) and30 kg/year (continental).
3.1.7.2 Service life releases
As noted earlier, the use of PFOS-related substances in treatment of fabrics has effectivelyceased in the UK. However, there are materials currently in use in articles which containPFOS-related substances from earlier treatments, and these may contribute to releases ofPFOS during the course of the service life of the articles. The possible emissions from thesearticles are estimated in this section. The substances used in treating fabrics were for the most part polymeric materials, i.e. PFOS-polymers. They also contained a small amount of residual PFOS-substances. For thesecalculations, it is assumed that the level of residual material is 1% (based on the informationprovided for the consultation exercise).
The relevant quantities of substances for these calculations are assumed to be those whichwere used annually on fabric treatment up until 2000. The use in the different areas waspresented in Section 2.3.7, and is 23 tonnes in carpets, 15 tonnes in apparel/leather and10 tonnes in fabrics (upholstery).
Carpets
Releases during the service life of carpets may arise from cleaning (vacuum or washing) orthrough wear. RIKZ (2002) quote 3M as providing a worst case estimate of 95% loss ofPFOS from carpets over their working life, with 50% through abrasion from walking andvacuuming, and 45% through steam cleaning.

24
Walking and vacuuming losses may be considered to go to land or to water. The use ofvacuum cleaners would probably be expected to lead to removal to solid waste and disposalwith household refuse and consequently landfill or incineration. However there is noinformation to apportion losses to walking (wear) and to vacuuming, so it will be assumedthat releases are to the environment as a worst case. In ESR assessments the loss ofparticulates as wear from plastics has been considered as ‘waste remaining in theenvironment’ and distributed as 75% to soil and 25% to water. Assuming a similardistribution for these releases gives 37.5% to soil and 12.5% to water. Releases from steamcleaning are assumed to go to water, hence 45% to water. The overall releases are therefore57.5% to water and 37.5% to soil. The amount remaining on the carpet at the end of thelifetime is assumed to be disposed of with the carpet, to landfill or to incineration.
The loss factors are estimated over the whole working life. As such they can be applied to theannual use level (this assumes a constant level of use). For a tonnage of 23 tonnes, the UKemissions would therefore be 13.2 tonnes to water and 8.6 tonnes to soil. As before, it isassumed that the UK accounts for one fifth of the EU, so the overall totals are 66 tonnes towater and 43 tonnes to soil. The regional emissions are 6.6 tonnes (water) and 4.3 tonnes(soil), the continental emissions are 59.4 tonnes (water) and 38.7 tonnes (soil). The above areemissions of polymeric material, and would be expected to be mostly associated withparticulate material worn from the fabric.
The polymers are considered to contain 1% of PFOS-substances, so the releases of these are:regional 66 kg/year (water), 43 kg/year (soil); continental 0.59 tonnes/year (water),0.39 tonnes/year (soil).
Upholstery and Furnishing Fabrics
There is no specific information on losses of PFOS-related substances from these materials sothe information on carpets will be used as the basis for the assumptions. These materials willbe cleaned, although probably not frequently, and so the loss through washing is taken as thesame as that for steam cleaning of carpets, i.e. 45% to water. The degree of wear is assumedto be less than that for carpets, and is taken as half of that figure, i.e. 25%. As for carpets thisis split between water and soil in the ratio 25:75, although some would be to solid waste. Theoverall emission factors are therefore 51.25% to water and 18.75% to soil. The amountremaining on the fabrics at the end of the lifetime is assumed to be disposed of with the fabricto landfill or to incineration.
From a tonnage of 10 tonnes per year, the UK emissions would be 5.1 tonnes to water and1.9 tonnes to soil. Assuming the UK is 20% of the EU, the total emissions would be25.5 tonnes to water and 9.5 tonnes to soil. The regional emissions are 2.6 tonnes (water) and0.95 tonnes (soil), the continental emissions are 23 tonnes (water) and 8.6 tonnes (soil). Theseare emissions of polymeric substances, probably in association with particulate material. Asbefore, taking the content of PFOS-substances as 1% the emissions of these substances are:regional 26 kg/year (water), 9.5 kg/year (soil); continental 0.23 tonnes/year (water),0.09 tonnes/year (soil).
Apparel and Leather
These two areas are treated together as use in treating clothing. There is no specificinformation about the loss of PFOS-related substances from clothes, so the information oncarpets has again been used as the basis for the assumptions. Clothing will be washed morefrequently than carpets or upholstery, although the purpose of the treatment is to reduce the

25
staining of fabrics. Against this, the lifetime of most clothing is much shorter than that of thetwo categories above. Washing losses are therefore taken as half of those above, i.e. 22.5%.Wear is expected to be less than for carpets, and is taken as the same as for fabrics above, i.e.25%. This is again split as 75% to soil, 25% to water, or 18.75% to soil and 6.25% to water.The overall emission factors are therefore 28.75% to water and 18.75% to soil. From atonnage of 15 tonnes per year, the UK emissions would be 4.3 tonnes to water and 2.8 tonnesto soil. Assuming the UK is 20% of the EU, the total emissions would be 21.5 tonnes to waterand 14 tonnes to soil. The regional emissions are 2.15 tonnes (water) and 1.4 tonnes (soil),the continental emissions are 19.4 tonnes (water) and 12.6 tonnes (soil). These are emissionsof polymeric substances, probably in association with particulate material. As before, takingthe content of PFOS-substances as 1% the emissions of these substances are: regional22 kg/year (water), 14 kg/year (soil); continental 0.19 tonnes/year (water), 0.13 tonnes/year(soil).
Tables 3.7 below provides a summary of emissions from treatment of fabrics (carpets,upholstery and leather).
Table 3.7 Summary of Emissions from Treatment of Fabrics
PFOS-polymer PFOS-substanceArea Regional
(tonnes/year)Continental
(tonnes/year)Regional(kg/year)
Continental(kg/year)
Carpets 6.6 (w)4.3 (s)
59.4 (w)38.7 (s)
66 (w)43 (s)
594 (w)387 (s)
Upholstery &Furnishing Fabrics
2.6 (w)0.95 (s)
23 (w)8.6 (s)
26 (w)9.5 (s)
230 (w)86 (s)
Apparel & Leather 2.15 (w)1.4 (s)
19.4 (w)12.6 (s)
22 (w)14 (s)
194 (w)126 (s)
Total 11.35 (w)6.65 (s)
101.8 (w)59.9 (s)
114 (w)66.5 (s)
1018 (w)599 (s)
3.1.8 Paper treatment
PFOS-related substances have been used to treat a range of paper types and products (greaseproof paper, food cartons etc.). The major type of substance used appears to be phosphatederivatives of N-EtFOSE, and these will be considered here as PFOS-substances. They areconsidered to be applied mostly during the paper making process, rather than as a coating insubsequent operations.
A level of use of 1 – 1.5% by weight of paper is indicated (RIKZ, 2002). The approximateusage in the UK was 32 tonnes, so that 2,100-3,200 tonnes of paper could be treated. For theEU, assuming the UK accounted for 20% of use, the figures would be 160 tonnes ofsubstances, and 10,700-16,000 tonnes of paper.
The Appendices in the Technical Guidance document have been used to estimate theemissions from paper. The substances are intended to remain in the paper, so the maincategory is 2, use resulting in inclusion into a matrix. The use category is 31 (impregnatingagent). The resulting emission factors are zero to air and 0.05 to waste water.
The information in Section 2.3.8 suggests there were only a few users for this type oftreatment. Large companies is chosen as the category for the B table, which results in afraction of main source of 0.333 and 300 days production. The fraction of main source isapplied to the UK tonnage in this case, as this gives a result in keeping with the information

26
available. This results in the use of 10.7 t of PFOS-substance at the site per year, or35.7 kg/day. The estimated release to waste water is 1.8 kg/day.
From above, the total use in the EU was estimated as 160 tonnes per year. The release istherefore estimated as 8 tonnes per year, with 800 kg to the region and 7.2 tonnes for thecontinent. These are releases of PFOS-substance to waste water.
The possibility of emissions from paper in use could be considered. However, the lifetime ofsuch papers is not expected to be very long. On disposal, such papers as food wrappings etcmight be expected to be disposed of with household waste rather than entering the paperrecycling streams. Hence most of the substances used are likely to be disposed of to landfillor incineration.
3.1.9 Coatings
A range of possible uses in coatings of various kinds is described in Section 2.3.9. In somecases there appears to be some overlap with areas which have already been addressed. Inorder to obtain some indication of the possible emissions from this area, it has been assumedthat the default emission factors for paints, lacquers and coatings in the Technical GuidanceDocument can be applied.
A use of ~18 tonnes for the UK is assumed for these calculations. The content of PFOS-related substances in coatings is indicated to be 0.1-1.0%; taking an average of 0.55% gives aquantity of coating containing PFOS-related substances of 3,270 tonnes per year.
The substances are treated as PFOS-substances for simplicity, and are considered to besurface active agents, use category 50. Assuming the paints are water based, the emissionfactors are zero to air and 0.005 to waste water. Considering the UK as 20% of the EU, theamount of paints containing PFOS-substances in the EU would be 16,364 tonnes. From the Btables this indicates a fraction of main source of 0.1, or use of 1,636 tonnes per year at therepresentative site. This would be over 300 days, and equates to the use of 9 tonnes of PFOS-substance at the site. Using the factor of 0.005, the emission to waste water would be45 kg/year, or 0.15 kg/day. The total emissions for the EU would be 450 kg/year, with 45 kgto the region and 405 kg to the continent. These are emissions of PFOS-substances to wastewater.
There would also be the possibility of emissions of the PFOS-substances from the coatingsduring the course of their service life. No information on these possible releases is available,and so no estimates are possible at this time.
3.1.10 Summary
The releases estimated in Sections 3.1.2 to 3.1.9 are summarised in Table 3.8.
3.2 ENVIRONMENTAL FATE AND DISTRIBUTION
3.2.1 Atmospheric degradation
There are no experimental data. The AOP program (v1.91) estimates a rate constant for thereaction of PFOS (as the acid) with OH radicals of 1.4x10⁻¹³ cm3 molec-1s-1. With a

27
concentration of 5x10⁵ molec cm-3, this gives a half life of 114 days. Combined with the lowvolatility, this indicates that degradation in the atmosphere is not likely to be significant.
The PFOS-substance N-EtFOSE is calculated to be more reactive, with a half life of16 hours. This is almost entirely due to hydrogen abstraction from the amide substituentgroup, and may indicate that this part of the substance may break down to leave the PFOSbackbone.
Table 3.8 Summary of Emissions from PFOS-salts, PFOS-substances and PFOS-polymers
Use area Compartment Local (per day)
Regional (per year)
Continental(per year)
PFOS-saltsair 0.33 mgChromium Platingwaste water 180 mg 1000 kg 9000 kgair 0.11 g 0.034 kg 0.051 kgPhotographicwaste water 2.27 g 0.68 kg 1.02 kgwaste water 1.5 g 0.44 kg 3.94 kgAviationsoil 3.4 g 1.02 kg 9.2 kgair 0.13 kgFire fighting foams -
formulation waste water 1.07 kgsurface water 0.57 kg 28.5 kg 257 kgFire fighting foams –
use soil 0.57 kg 28.5 kg 257 kg(alternative local ) waste water 1.14 kgPFOS-substancesPhotolithography waste water 27 g 25 kg 226 kgPhotographic waste water 8.8 mg 0.75 kg 6.75 kgFabrics – treatment waste water 13.5 g 3.4 kg 30 kg
water 114 kg 1018 kgFabrics – service lifesoil 66.5 kg 599 kg
Paper treatment waste water 1.8 kg 800 kg 7.2 tonnesCoatings waste water 0.15 kg 45 kg 405 kgPFOS-polymersFabrics – treatment waste water 1.35 kg 336 kg 3024 kg
water 11.35 tonnes 101.8 tonnesFabrics – service lifesoil 6.65 tonnes 59.9 tonnes
Notes: Waste water - all releases treated in wwtp.Surface water - release direct to surface water and not treated.Water - releases split 80:20 wwtp:direct to surface water.
3.2.2 Aquatic degradation
3.2.2.1 Abiotic degradation
3.2.2.1.1 Hydrolysis
The hydrolysis of the potassium salt of PFOS has been studied over a wide range of pHvalues, from 1.5 to 11 (3M, 2003). Tests were carried out at 50°C to accelerate any reaction.No loss of PFOS was seen in any of the experiments. Based on the limit of quantification,and adjusting for the higher temperature of the tests, the half life at 25°C was estimated to be>41 years.
RIKZ (2002) quote 3M studies showing that some PFOS-related substances can undergohydrolysis. The acrylate derivative of N-EtFOSE and N-MeFOSE have half lives of 35 and99 days respectively at pH 7 and 25°C. The products of hydrolysis were not identified, butRIKZ suggested that they were likely to include acrylic acid and N-EtFOSE and N-MeFOSE.

28
Longer half life times of 6.3 years for N-MeFOSE and 7.3 years for N-EtFOSE are alsoquoted by RIKZ from 3M reports.
3.2.2.1.2 Photolysis
The possible photolysis in water of the potassium salt of PFOS has been studied in varioustest matrices, allowing for both direct and indirect photolysis (3M, 2003). No evidence ofdirect or indirect photolysis of PFOS was observed under any of the conditions tested. Fromthe limit of quantitation of loss of PFOS, the minimum half life for photolysis in water wasestimated to be >3.7 years.
RIKZ (2002) quote a 3M study showing no photolysis of N-EtFOSE.
3.2.2.2 Biodegradation
3.2.2.2.1 Aerobic
The OECD Hazard Assessment (OECD, 2002) and the 3M assessment (3M, 2003) concludedthat PFOS was not biodegradable. Information on the main studies reviewed in theseassessments is presented below.
A MITI test (Kurume Lab, 2002, quoted in OECD 2002) found zero removal as measured byoxygen demand, 3% by removal of parent compound and 6% by reduction in total organiccarbon. These values indicated no significant degradation.
The OECD assessment includes a study summary for a 35-day biodegradation test. Activatedsludge from a municipal waste water treatment plant was used , with 50 ml of settled sludgeadded per litre of mineral salts medium used. The concentration of PFOS (as the potassiumsalt) was 2.582 mg/l. The study found no evidence of degradation over the 35 day period. Therecovery of PFOS from the sludge was good.
The summary also indicates that a number of other compounds were also quantified. Nonewere detected. The majority of the substances listed are other PFOS-related substances,which may break down to give PFOS. It appears unlikely that any of these might be producedfrom the degradation of PFOS. These would seem to relate better to other work on thedegradation of N-EtFOSE, which is considered below.
The 3M (2003) assessment includes a summary of an 18 day biodegradation test on PFOS(potassium salt). The experimental details are similar to those reported for the 35 day studyabove, except that the activated sludge was allowed to settle for five weeks rather than twodays after collection, and the exposure concentration was 2.45 mg/l. No degradation of PFOSwas measured in this study. As above, a group of other PFOS-related substances was alsoquantified, and none were detected. A note in the summary relates to a previous study toevaluate the biodegradation of N-EtFOSE over 35 days and to determine its metabolites. Thisseems a more relevant study for the determination of the other substances. There is no furtherinformation on this study in the documentation available, but Cahill and Mackay (2002) madeuse of this information in a recent study (see below). Further experiments on the biodegradation of PFOS are included in study summaries in the3M assessment (3M, 2003). An inoculum was produced from a mix of activated sludge fromtwo waste water treatment plants, with material from a rotating biological contactor plant,sediment from below a water treatment plant outfall, and sandy soil. The test medium

29
included the inoculum, primary influent from one of the waste water treatment plants, andOECD 301A medium. The initial PFOS concentration was 20.8 mg/l. At weekly intervals,70% of the bioreactor contents were removed and replaced with fresh medium includingfreshly collected waste water treatment plant effluent and inoculum, and additional PFOS.The final concentration of PFOS was 28.4 mg/l. There were no indications of biodegradationin this study. The PFOS was associated primarily with the biomass at the end of the study.
After 12 weeks of acclimation, activated sludge from the above study was added to OECD301A medium, with PFOS at two concentrations, and placed in closed serum vials. The vialswere sampled at intervals of up to 63 days. No clear evidence of the biodegradation of PFOSwas seen in this study.
Other substances
RIKZ (2002) presented a degradation pathway for N-EtFOSE in waste water sludge, takenfrom two 3M reports. The ultimate products are shown as PFOS (anion) andperfluorooctanoic acid (PFOA). There is no indication of the rate of biodegradation, theoverall yield of the two products or any intermediate product, or the relative amount of thetwo products formed. RIKZ (2002) considered that it was likely that N-MeFOSE wouldfollow a similar degradation pathway. They quote a 3M report as stating that the likelyendpoints of aerobic biodegradation of ECF-products are PFOS and PFOA. In the sequenceof studies carried out by 3M (3M, 2001), the initial products of aerobic biodegradation of N-EtFOSE were identified, and then tested in further aerobic biodegradation tests. The processof identifying and testing products was continued with eventual tests on five intermediatesproducts, PFOS and PFOA. Each of the intermediate products was biodegradable to somedegree in the 18-day studies. PFOS and PFOA were not degradable and so represent the endof the chain. These were produced at intermediate stages as well as from degradation of thelast intermediate product. The extent of degradation varied between the different substancestested.
Cahill and Mackay (2002) reported the development of a multi-species model, with PFOS-related substances being used in demonstrating the model. For the degradation of N-EtFOSEthey used a rate constant of 0.014 – 0.0014 h-1. The upper value was derived from a 3Mstudy (3M (2000),assumed to be that referred to above), the lower rate was taken as 10-foldlower to reflect the lower densities of microbial communities in the environment compared tothe test. This lower rate will be used in the modelling calculations later in this evaluation,along with other illustrative degradation rates, in the absence of more specific information.Cahill and Mackay (2002) also quote the same 3M report (3M, 2000) as reportingpreliminary results showing that the microbial degradation of N-EtFOSE and M-EtFOSEpredominantly resulted in PFOS formation (92%), with 8% of PFOA. In the executivesummary for the completed studies (3M, 2001) there are no comments on the overall extentof production of PFOS from the biodegradation of N-EtFOSE. For the main calculations inthis evaluation, complete conversion of PFOS-substances to PFOS through biodegradation inthe environment will be assumed, recognising that this is a worst case assumption.Alternative assumptions will be considered in the later discussion on uncertainties in theevaluation (Section 5.6).
3.2.2.2.2 Anaerobic
A study on the degradation of PFOS (potassium salt) under anaerobic conditions issummarised in 3M (2003). The inoculum was derived from the anaerobic digestor of a waste

30
water treatment plant, and exposures took place for 56 days in the dark. The concentration ofPFOS in the test was 20.8 mg/l (nominal). No apparent degradation was seen in the study.
The 3M report (3M, 2003) also summarises a study using four pure microbial cultures to tryto degrade PFOS (potassium salt). None of the species appeared able to degrade PFOS.
In contrast to these results, Schroder (2003) observed the disappearance of PFOS spiked intoa laboratory-scale closed-loop bioreactor using columns filled with glass foam beads. PFOSwas added initially at 5-10 mg/l; the inoculum was taken from the anaerobic sludgestabilisation tank of the Aachen-Soers STP, Germany. Anaerobic conditions were maintainedand monitored. After two days the concentration of PFOS had fallen to below the detectionlimit. PFOA remained stable during this period, but following the reduction in the PFOS thelevel of PFOA also fell, to below the detection limit after 25 days. The fluoride ionconcentration was monitored during the experiments and showed no increase, indicating thatcomplete mineralization was not occurring. This may indicate some potential for degradationunder certain conditions, however at present this will not be included in the evaluation due tothe lack of information on the relevance to an environmental evaluation.
3.2.3 Degradation in soil
The degradation of PFOS, potassium salt, has been studied in a mixed soil and sedimentculture (study summarised in 3M, 2003). Soils were obtained from three locations in theUSA, sediments were taken from a brackish site below a waste water treatment plant outfalland from one other location. Soil and sediment samples were air dried, sieved and mixed inequal dry weight proportions. A nutrient mixture, containing sterile potting soil extract, tracemineral salts, yeast extract and water, was added to the soil/sediment mixture, to 75% ofwater holding capacity. Tests were conducted in the dark at 22°C for 20 weeks. No PFOSdegradation was observed in the test system (by parent compound analysis).
3.2.4 Evaluation of environmental degradation data
None of the tests carried out show any indication of the biodegradation of PFOS in aquaticsystems, under either aerobic or anaerobic conditions. There are also no indications of abioticdegradation in water. The rate estimated for reaction with hydroxyl radicals in air is slow.The one available study in soil also shows no degradation.
The limited information on other PFOS-related substances indicates that N-EtFOSE can bebiologically degraded and that one of the products is PFOS. For the purpose of thisevaluation, it will be assumed that PFOS is not degradable. For PFOS-substances, it will beassumed that they can be degraded to PFOS. This degradation will be assumed to take placein water, aerobic sediment and in soil. In the absence of more specific information it will beassumed as a worst case that this transformation is quantitative, i.e. one mole of PFOS-substance gives rise to one mole of PFOS. The effect of considering different rates for thisprocess will be considered in the modelling section.
3.2.5 Environmental distribution
3.2.5.1 Adsorption
For most substances, adsorption is predicted on the basis of the log Kow value. As a value forthis property cannot be measured for PFOS, this is not possible. Measurements are available

31
on the sorption of PFOS to soils, sediment and sludge, and these will be used in thisevaluation.
Sorption of the potassium salt of PFOS to three types of soil, a sediment and a sludge from adomestic waste water treatment plant has been measured using a method based on OECD 106(3M, 2003). Adsorption occurred rapidly in all cases, and the concentrations remained fairlyconstant after 16 hours. Desorption was also investigated - again, the desorption whichoccurred took place rapidly, and after eight hours the concentration in water did not varysignificantly. Values for the sorption and desorption coefficients were calculated. These arepresented in Table 3.9
Table 3.9 Sorption and desorption coefficients for various matrices
Matrix type Kd (L/kg) Kdes (L/kg) MeanClay soil 18.3 47.1 32.7Clay loam soil 9.72 15.8 12.8Sandy loam soil 35.3 34.9 35.1River sediment 7.42 10 8.7WWTP sludge 1028Note: mean values are mean of sorption and desorption coefficients. For sludge, value is the mean of the Freundlichcoefficients for sorption and desorption, as direct values are only reported as limit values.
Mean values from sorption and desorption have been used in this evaluation. The averagevalue from the three soils, 26.9, has been used for soil. The value for sediment has been usedfor both sediment and suspended sediments The single sludge value has been used torepresent the different types of sludge in the EUSES calculations. The Kcomp-water valuesderived from these measurements using the TGD methods are: sediment, 5.11; suspendedsediment, 3.08; soil, 40.6.
For comparison, a soil Kd value of 25, similar to that derived from the measurements, wouldbe estimated from a log Kow value of 3.7 using the default QSAR equation from theTechnical Guidance document. The corresponding estimated sediment and suspendedsediment values would be 62.6 and 125 respectively, which are somewhat larger than thevalue from the measurements. For sludge, the estimated values would be 375 and 413, whichare of a similar order but a little lower than that from the measurements.
It is recognised that these measured values are not necessarily representative of theenvironment. They also do not give any indication of the environmental factors which mayaffect the sorption of PFOS. As there is no reliable value for log Kow, no comments can bemade on whether the sorption behaviour is different from that normally assumed, relating toorganic carbon, or whether other processes are significant. However, they are considered togive at least an indication of the probable sorptive behaviour of PFOS.
3.2.5.2 Volatilisation
PFOS is not expected to volatilise significantly. It has a low vapour pressure and a solubilityof ~500 mg/l. Attempts to measure the air-water partition coefficient using the potassium saltare reported in 3M (2003). The substance did not volatilise to any measurable extent. On thebasis of the result, the value for the air-water partition coefficient was considered to be<2x10⁻⁶, and to be essentially zero. A value of 1.35x10⁻⁷ is used in this evaluation, derivedfrom the estimated Henry’s Law constant (Section 1.3.8). Note that some of the PFOS-substances have considerably higher vapour pressure and are more likely to be volatile tosome extent. This may allow the wider transport of potential PFOS-precursors through the airthan is possible for PFOS itself.
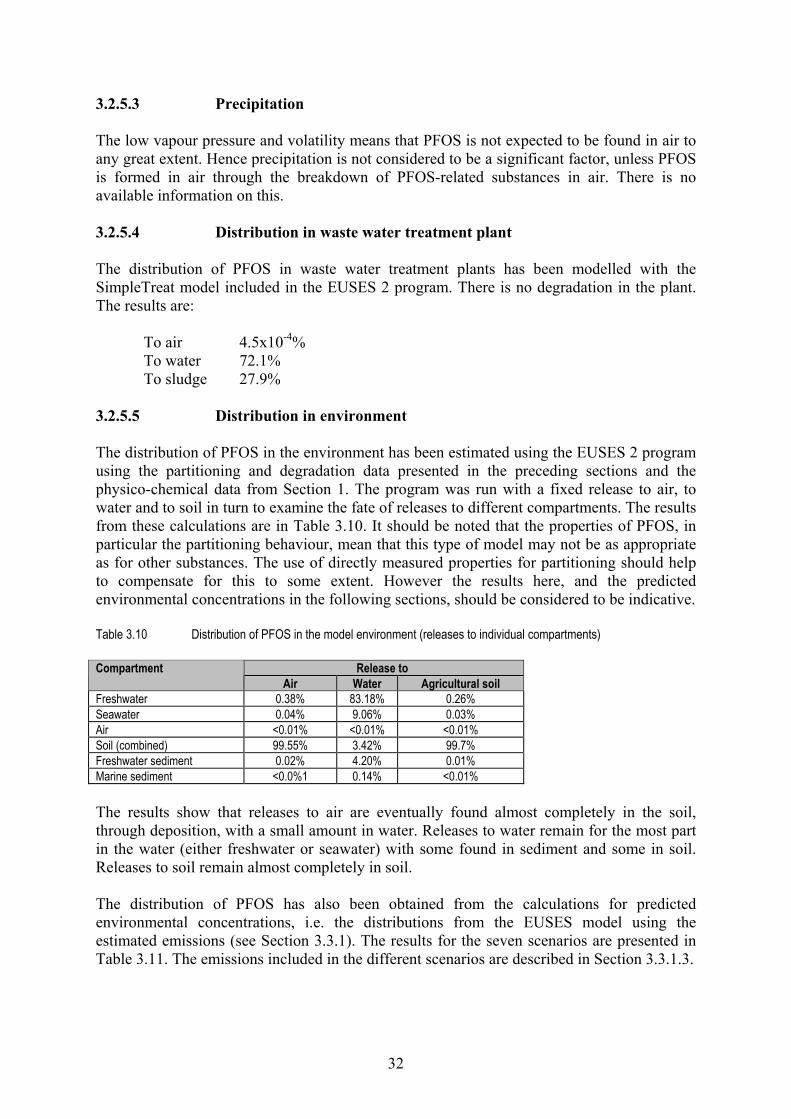
32
3.2.5.3 Precipitation
The low vapour pressure and volatility means that PFOS is not expected to be found in air toany great extent. Hence precipitation is not considered to be a significant factor, unless PFOSis formed in air through the breakdown of PFOS-related substances in air. There is noavailable information on this.
3.2.5.4 Distribution in waste water treatment plant
The distribution of PFOS in waste water treatment plants has been modelled with theSimpleTreat model included in the EUSES 2 program. There is no degradation in the plant.The results are:
To air 4.5x10⁻⁴%To water 72.1%To sludge 27.9%
3.2.5.5 Distribution in environment
The distribution of PFOS in the environment has been estimated using the EUSES 2 programusing the partitioning and degradation data presented in the preceding sections and thephysico-chemical data from Section 1. The program was run with a fixed release to air, towater and to soil in turn to examine the fate of releases to different compartments. The resultsfrom these calculations are in Table 3.10. It should be noted that the properties of PFOS, inparticular the partitioning behaviour, mean that this type of model may not be as appropriateas for other substances. The use of directly measured properties for partitioning should helpto compensate for this to some extent. However the results here, and the predictedenvironmental concentrations in the following sections, should be considered to be indicative.
Table 3.10 Distribution of PFOS in the model environment (releases to individual compartments)
Release to CompartmentAir Water Agricultural soil
Freshwater 0.38% 83.18% 0.26%Seawater 0.04% 9.06% 0.03%Air <0.01% <0.01% <0.01%Soil (combined) 99.55% 3.42% 99.7%Freshwater sediment 0.02% 4.20% 0.01%Marine sediment <0.0%1 0.14% <0.01%
The results show that releases to air are eventually found almost completely in the soil,through deposition, with a small amount in water. Releases to water remain for the most partin the water (either freshwater or seawater) with some found in sediment and some in soil.Releases to soil remain almost completely in soil.
The distribution of PFOS has also been obtained from the calculations for predictedenvironmental concentrations, i.e. the distributions from the EUSES model using theestimated emissions (see Section 3.3.1). The results for the seven scenarios are presented inTable 3.11. The emissions included in the different scenarios are described in Section 3.3.1.3.
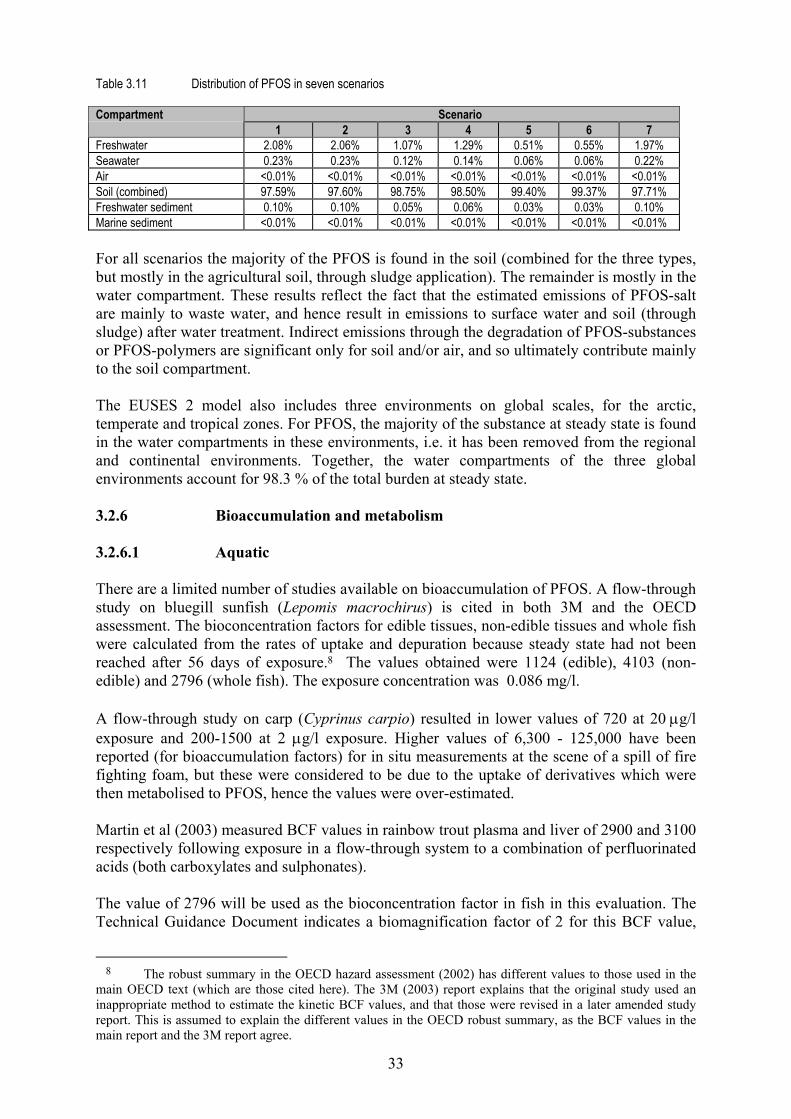
33
Table 3.11 Distribution of PFOS in seven scenarios
Scenario Compartment1 2 3 4 5 6 7
Freshwater 2.08% 2.06% 1.07% 1.29% 0.51% 0.55% 1.97%Seawater 0.23% 0.23% 0.12% 0.14% 0.06% 0.06% 0.22%Air <0.01% <0.01% <0.01% <0.01% <0.01% <0.01% <0.01%Soil (combined) 97.59% 97.60% 98.75% 98.50% 99.40% 99.37% 97.71%Freshwater sediment 0.10% 0.10% 0.05% 0.06% 0.03% 0.03% 0.10%Marine sediment <0.01% <0.01% <0.01% <0.01% <0.01% <0.01% <0.01%
For all scenarios the majority of the PFOS is found in the soil (combined for the three types,but mostly in the agricultural soil, through sludge application). The remainder is mostly in thewater compartment. These results reflect the fact that the estimated emissions of PFOS-saltare mainly to waste water, and hence result in emissions to surface water and soil (throughsludge) after water treatment. Indirect emissions through the degradation of PFOS-substancesor PFOS-polymers are significant only for soil and/or air, and so ultimately contribute mainlyto the soil compartment.
The EUSES 2 model also includes three environments on global scales, for the arctic,temperate and tropical zones. For PFOS, the majority of the substance at steady state is foundin the water compartments in these environments, i.e. it has been removed from the regionaland continental environments. Together, the water compartments of the three globalenvironments account for 98.3 % of the total burden at steady state.
3.2.6 Bioaccumulation and metabolism
3.2.6.1 Aquatic
There are a limited number of studies available on bioaccumulation of PFOS. A flow-throughstudy on bluegill sunfish (Lepomis macrochirus) is cited in both 3M and the OECDassessment. The bioconcentration factors for edible tissues, non-edible tissues and whole fishwere calculated from the rates of uptake and depuration because steady state had not beenreached after 56 days of exposure.8 The values obtained were 1124 (edible), 4103 (non-edible) and 2796 (whole fish). The exposure concentration was 0.086 mg/l.
A flow-through study on carp (Cyprinus carpio) resulted in lower values of 720 at 20 µg/lexposure and 200-1500 at 2 µg/l exposure. Higher values of 6,300 - 125,000 have beenreported (for bioaccumulation factors) for in situ measurements at the scene of a spill of firefighting foam, but these were considered to be due to the uptake of derivatives which werethen metabolised to PFOS, hence the values were over-estimated.
Martin et al (2003) measured BCF values in rainbow trout plasma and liver of 2900 and 3100respectively following exposure in a flow-through system to a combination of perfluorinatedacids (both carboxylates and sulphonates).
The value of 2796 will be used as the bioconcentration factor in fish in this evaluation. TheTechnical Guidance Document indicates a biomagnification factor of 2 for this BCF value,
8 The robust summary in the OECD hazard assessment (2002) has different values to those used in themain OECD text (which are those cited here). The 3M (2003) report explains that the original study used aninappropriate method to estimate the kinetic BCF values, and that those were revised in a later amended studyreport. This is assumed to explain the different values in the OECD robust summary, as the BCF values in themain report and the 3M report agree.

34
and this is also used in the calculation of levels in biota for the assessment of secondarypoisoning.
Martin et al (2003a) studied the uptake of PFOS from food in juvenile rainbow trout(Oncorhynchus mykiss). Fish were fed food spiked with a mixture of perfluorinatedsubstances - PFOS and its butyl and hexyl analogues, C5-C14 perfluoroalkanoic acids(excluding C13). The concentration of PFOS in the food was 0.54 µg/g. The exposure periodwas 34 days, and was followed by a depuration period of 41 days. Fish were fed in such away that the food was consumed rapidly after addition, to minimise the possible transfer ofsubstances from food to water. Water samples were taken before and after feeding on day 30to confirm that the water concentrations remained low. Fish were sampled at intervals duringthe uptake and depuration periods.
The measured concentrations in fish were corrected for the growth of the fish. Theassimilation efficiency for PFOS calculated from the results was 120±7.9%, the depurationhalf life was 13±1.8 days, the bioaccumulation factor (BAF) was 0.32±0.05 and the time tosteady state was estimated as 43 days. The results show that PFOS will not biomagnify fromfood in juvenile trout. The authors suggest caution in extrapolating these results to larger fish,e.g. mature trout, as the half lives of other substances have been shown to increase by up to afactor of 10 times in mature fish compared to juveniles. They also considered that theseresults did not mean that PFOS would not accumulate in higher organisms from food.Elimination through the gills is an important route for fish which is not available to birds forexample, and elimination from the lungs is expected to be much lower in view of the lowvapour pressure. In view of these comments the default BMF value from the TGD is used.
In the course of a study on the toxicity of PFOS to freshwater mussels (Unio complamatus)the concentration of PFOS in the mussel tissues was measured. The toxicity study wasreviewed for the OECD assessment, the results are included in this evaluation. The measuredconcentrations in water and in mussel tissues are in Table 3.12
Table 3.12 Accumulation of PFOS in mussel tissue
Mean measured exposureconcentration (mg/l)
% mortality at 96 hours Mean measured tissueconcentration (µg/g)
Calculated BCF
5.3 0 3.69 0.712 0 5.22 0.4420 0 7.33 0.3741 5 11.85 0.2979 90 88.8 1.12
As no mortality was seen in the lower concentrations over the exposure period, the results atthese concentrations can be considered suitable to determine bioconcentration factors. Theaverage of the three results is 0.5.
3.2.6.2 Terrestrial
A 14-day toxicity study with earthworms has been reported (3M, 2003, see Section 4.2.1).The concentrations in worms were measured at the end of the exposures. The worms wereallowed to clear soil from their guts before the concentrations were measured. These levelscan be used together with the concentrations in the soil to calculate bioaccumulation factors.The data are in Table 3.13.

35
Table 3.13 Bioaccumulation in worms
Soil concentration (mg/kg wwt) Worm concentration (mg/kg wwt) BCF77 195 2.5141 203 1.4289 252 0.87488 1105 2.3
Effects were seen on the earthworms in the test at all concentrations above 77 mg/kg, so thefactor used in this evaluation will be taken from the 77 mg/kg exposure.
The BCF for earthworms as used in the revised Technical Guidance is based on the porewater concentration. Using the Ksoil-water partition coefficient of 40.6, the pore waterconcentration at 77 mg/kg in soil is 3.22 mg/l. The BCF based on this concentration is60.5 l/kg wwt.
An alternative approach to a BCF value for worms could be to derive a surrogate log Kowfrom the fish bioconcentration value. Using the default QSAR equation from the TGD, thefish BCF value of 2796 would be predicted from a log Kow value of 4.88. Using thissurrogate log Kow value, a BCF for worms of 911 would be predicted. This is much higherthan the value obtained from the measured levels. The measured value will be used in theevaluation.
There are limited data for uptake into plants. As part of a study on the toxicity of PFOS(potassium salt) to seven plant species (Section 5.4.2.1), concentrations of PFOS in planttissues were measured. The concentrations in plant vegetative tissues were generally in therange of 1-2 times the concentration in soil. The values around twice the soil level werefound at lower exposure concentrations, where the plants were less likely to be affected bythe exposure. Concentrations in fruit were lower, less than 10% of the soil level. No specificdata were located on transfer to meat or milk, processes which are considered in theestimation of exposure to humans through the environment. There are limited measurementsof levels in food, which are discussed in Section 3.3.5. In the absence of specific data, uptakeand accumulation factors for these are usually estimated from the log Kow value. For thepurpose of this evaluation, the surrogate log Kow value estimated above from the fish datawill be used. This is a log Kow value of 4.88.
3.2.6.3 Absorption in mammals
PFOS appears to be well absorbed in mammals following ingestion. After a single oral dosein solution of 4.2 mg/kg bw to rats using labelled PFOS, at least 95% of the 14-C label wassystematically absorbed after 24 hours (Johnson et al (1979a), in OECD 2002).Approximately 86% of this dose was found in the carcass at 24-48 hours. There was someexcretion of total carbon-14 in urine, 1-2% per day. The half life for elimination from plasmawas estimated to be 7.5 days. The same authors (Johnson et al (1979b),in OECDE 2002) alsogave the same dose intravenously. After 89 days, the mean urinary excretion was ~30%, andthe mean faecal excretion was 12.6%.

36
3.3 ENVIRONMENTAL CONCENTRATIONS
3.3.1 Background to calculations
The calculation of predicted environmental concentrations for PFOS is complicated by anumber of factors. One is that some of the uses have effectively ceased, while others arebeing reduced, so that the use pattern is changing. This is addressed in this evaluation bydefining a number of scenarios to include or exclude various sources. The baseline situationis taken to be use as it was in the UK around 2000, so before the removal of products fromthe market.
A second factor is the possible contribution of PFOS-substances and PFOS-polymermaterials to the levels of PFOS in the environment. The rate and extent to which thesebreakdown and produce PFOS is not known. Therefore a number of calculations based onvarious assumptions about this degradation have been included.
The EUSES 2.0 model has been used for the calculations in this evaluation. It should benoted that the regional concentrations calculated in the model relate to the steady-statesituation. For a persistent substance such as PFOS, the steady state may take a considerabletime to be reached, and so to some extent the calculated concentrations may be projections ofthe concentrations expected in the future, assuming that the emissions in the calculationremain constant.
3.3.1.1 Substance properties for modelling
3.3.1.1.1 PFOS-salt
The physico-chemical properties of the potassium salt, as described in Section 1, are used forthis group. As noted in the relevant sections, it is not possible for this substance to predictproperties from the log Kow value, and measured values have been used where possible. Thefull set of values as used in the model is presented in Table 3.14.
There are a number of other factors related to uptake in plants, crops and cattle which areused in the estimation of exposure of humans through the environment. These are usuallyestimated from the log Kow value. For the purpose of this evaluation, the surrogate log Kowvalue of 4.88 has been used (for explanation, see Section 3.2.6.2). Table 3.14 Properties of PFOS-salt for modelling
Property Value SectionMolecular weight 538 Table 1.1Vapour pressure 3.31x10⁻⁴ Pa Table 1.1Water solubility 519 mg/l Table 1.1Henry’s law constant 3.19x10⁻⁴ Pa m3 mole-1 Table 1.1Ksed-water 5.16 Section 3.2.5.lKsusp-water 3.08 Section 3.2.5.1Ksoil-water 40.6 Section 3.2.5.1BCF fish 2,796 Section 3.2.6.1BCF worm 60.5 Section 3.2.6.2BMF1, BMF2 2 Section 3.2.6.2Biodegradation Not biodegradable Section 3.2.4Photodegradation in air 114 d half life Section 3.2.1Other abiotic processes EUSES defaults

37
3.3.1.1.2 PFOS-substances
Although there are a large number of substances which are included in this group, specificproperty values are not available for the majority. Some data are available for the mostwidely used, and of these N-EtFOSE (CAS 1691-99-2) has the most extensive data set. Thishas been used as the model compound for this group. The properties of this group are shownin Table 3.15 below.
Table 3.15: Summary of property values for PFOS-substances (RIKZ, 2002)
Property Value UsedMolecular weight 571.25Melting point 57°CSolubility 0.15 mg/lVapour pressure 0.5 PaLog Kow 4.4
A degradation half life in air of 16 hours was estimated in Section 3.2.1. For biodegradation,a rate constant of 0.0014 h-1 will be used (see Section 3.2.2.2.1). This rate will be used forwater, soil and aerobic sediment in the model. This is assumed to be the rate of disappearanceof the substance, and may therefore over-estimate the rate of formation of PFOS. Analternative half life of one year, to allow for the possible slower degradation of othersubstances, is also used in the same way. In all media the final product of degradation isassumed to be PFOS (see Section 3.3.1.2). Further consideration of the rate of degradationand the degree of production of PFOS is included in Appendices 3 and 5.
The fraction of N-EtFOSE adsorbed to particulates in air was measured as 65% in outdoor airsamples (see Section 3.3.4.2). This value is used in the calculations rather than estimating thispercentage from the log Kow value.
It is recognised that other substances considered in this group may have somewhat differentproperties. These calculations are intended to give a rough idea of possible behaviour. Itshould be noted that the possible accumulation and effects of the substances themselves arenot considered in this evaluation.
3.3.1.1.3 PFOS-polymers
There are no data on the properties of the polymeric substances. Therefore properties havebeen chosen to represent the expected behaviour, i.e. low volatility, low solubility, andtendency to be associated with solid phases as shown in Table 3.16 below. The effect ofhigher values for the log Kow value is considered in Appendix 6.
Table 3.16 Summary of values for PFOS-polymers
Property Value UsedMolecular weight 10000Melting point treated as a solid (100°C used)Solubility 10-6 mg/lVapour pressure 10-6 PaLog Kow 6Henry’s Lax constant 10-4 Pa m3 mole-1
There are no data on degradation rates for the polymers, or on the extent to which PFOS maybe produced, so again values have been selected to represent possible outcomes. The halflives for polymers are expected to be longer than those for the substances, so a half life of

38
30 years has been used. This is an arbitrary value. Note that the residual fluorocarbonspresent in the polymers have been treated as PFOS-substances and so this rate does not applyto them.
3.3.1.2 Releases of PFOS to environment
The emission estimates from Section 3.1.10 are used. The PFOS-salt emissions areconsidered as emissions of PFOS itself, and are entered directly. For the PFOS-substances,the approach depends on the assumptions made about the breakdown of the substances toPFOS. The first assumption is that the PFOS-substances effectively break down immediatelyto PFOS on release (or are converted to PFOS before release). In this case the emissions ofPFOS-substance are converted to PFOS-salt emissions. It is assumed that the degradationproceeds to PFOS with no by-products, so that the yield is 100%. The relative molecularweights for the chosen representative substances mean the yield is 0.94 kg for 1 kg of PFOS-substance. The resulting emissions are added to those of PFOS-salt direct.
Where the degradation of the PFOS-substances is assumed to take a longer time, theemissions of PFOS-substance are modelled using the properties for PFOS-substance above toallow for the effect of movement of air and water in the model. From the concentrationspredicted and the appropriate degradation half lives the rate of degradation of PFOS-substance in each environmental compartment at steady state can be calculated. As above,degradation is assumed to proceed to PFOS with no by-products, so that 1 kg/day degradationof PFOS-substance is assumed to give 0.94 kg/day PFOS. Hence the rates of degradation ofPFOS-substance are converted to rates of production of PFOS in each compartment, andthese are added to the direct releases of PFOS-salt. The results presented in the tables are forthe combined releases as appropriate to the particular scenario. This is done for both halflives chosen. The rates of production of PFOS from the breakdown of PFOS-substances forthese scenarios are included in Appendix 2.
It is recognised that the assumption of 100% production of PFOS from the PFOS-substancesis a worst case assumption (although Cahill and Mackay (2002) quote an estimated yield of92% from N-EtFOSE). Other possible assumptions are considered in Appendix 3.
The approach for PFOS-polymer is similar to that for the substances. From the informationon polymer composition provided for the Risk Reduction Strategy consultation, the PFOSmoiety makes up on average about 30% of the polymer by weight, so a yield of 30% byweight has been used. The production rates of PFOS from polymer degradation are includedin Appendix 2.
3.3.1.3 Scenarios
The baseline scenario is considered to be the situation in 2000. This includes all of the usesfor which emission estimates have been made in Section 3.1, including the service life oftreated fabrics. In order to consider the possible contributions of PFOS-substances and PFOS-polymers, calculations have been carried out with and without these included. Hence thereare five scenarios using the baseline emissions:
1 - PFOS-salt releases only2 - PFOS-salt plus PFOS-substances, assuming instant degradation to PFOS.3 - PFOS-salt plus PFOS-substances, assuming a 20 day half life for degradation to PFOS.4 - PFOS-salt plus PFOS-substances, assuming a 1 year half life for degradation to PFOS.

39
5 - PFOS-salt, PFOS-substances with 20 day half life, PFOS-polymer with 30 year half lifedegradation to PFOS.
There are no data for the breakdown of PFOS-polymers, and so the fifth scenario isconsidered to be much more speculative than the others. A 30 year half life is assumed, withcomplete release of the PFOS moiety from the polymer on this time scale. It should be notedthat all of these scenarios reflect the situation in the past as far as emissions are concerned.
Two further scenarios have been used to try to consider the ‘current’ situation and a possiblefuture. For the ‘current’ scenario (Scenario 6), continuing use in chromium plating,photolithography, photography and aviation has been assumed, with use of stocks of firefighting foam and continuing release from fabrics in use. These last two uses will onlycontinue for a number of years, whereas the calculations assume a continuous use to steadystate, and so will overestimate.
The future scenario (Scenario 7) is that where the use of stocks of PFOS foams has beencompleted and the fabrics have reached the end of their service lives.
Local concentrations have been calculated for all releases of PFOS-salt substances wherethere is a local source. Local concentrations have also been calculated for releases of thePFOS-substances where instant conversion to PFOS has been assumed (in Scenario 2). Forother scenarios, the breakdown of the PFOS-substances (or PFOS-polymer) occurs afterdispersion in the environment and so local scenarios are not appropriate. Appendix 7 showsthe contribution of each use area to the total regional emissions for each scenario.
3.3.2 Aquatic compartment (surface water, sediment and wastewatertreatment plant)
3.3.2.1 Estimated aquatic environmental concentrations
The predicted concentrations in the freshwater compartment and for sediment for the sevenscenarios are in Tables 3.17 and 3.18.
Table 3.17 Predicted environmental concentrations in freshwater (mg/l)
Scenario numberUse area1 2 3 4 5 6 7
Chromium plating 4.52x10⁻⁵ 8.1x10⁻⁵ 5.45x10⁻⁵ 5.16x10⁻⁵ 9.46x10⁻⁵ 8.63x10⁻⁵ 4.36x10⁻⁵
1.21x10⁻⁴ 1.56x10⁻⁴ 1.3x10⁻⁴ 1.27x10⁻⁴ 1.7x10⁻⁴ 1.62x10⁻⁴ 1.19x10⁻⁴Photography - formulation- processing NA 7.48x10⁻⁵ NA NA NA NA NA
Aviation 9.28x10⁻⁵ 1.29x10⁻⁴ 1.02x10⁻⁴ 9.91x10⁻⁵ 1.42x10⁻⁴ 1.34x10⁻⁴ 9.12x10⁻⁵
0.0973 0.0974 0.0973 0.0973 0.0974 NA NA0.0285 0.0286 0.0285 0.0285 0.0286 0.0286 NA
Fire fighting foams -formulation - use A - use B 0.0411 0.0412 0.0411 0.0411 0.0412 0.0412 NA
Photolithography NA 9.75x10⁻⁴ NA NA NA NA NAFabrics - application NA 5.32x10⁻⁴ NA NA NA NA NAPaper treatment NA 0.0613 NA NA NA NA NACoatings NA 1.6x10⁻³ NA NA NA NA NARegional 3.87x10⁻⁵ 7.45x10⁻⁵ 4.8x10⁻⁵ 4.51x10⁻⁵ 8.81x10⁻⁵ 7.98x10⁻⁵ 3.71x10⁻⁵

40
Table 3.18 Predicted environmental concentrations in sediment (mg/kg wwt)
Scenario numberUse area1 2 3 4 5 6 7
Chromium plating 1.21x10⁻⁴ 2.17x10⁻⁴ 1.46x10⁻⁴ 1.38x10⁻⁴ 2.53x10⁻⁴ 2.31x10⁻⁴ 1.17x10⁻⁴
3.23x10⁻⁴ 4.18x10⁻⁴ 3.47x10⁻⁴ 3.4x10⁻⁴ 4.55x10⁻⁴ 4.33x10⁻⁴ 3.18x10⁻⁴Photography - formulation- processing NA 2.0x10⁻⁴ NA NA NA NA NA
Aviation 2.48x10⁻⁴ 3.44x10⁻⁴ 2.73x10⁻⁴ 2.65x10⁻⁴ 3.8x10⁻⁴ 3.58x10⁻⁴ 2.44x10⁻⁴
0.26 0.261 0.261 0.261 0.261 NA NA0.0764 0.0765 0.0764 0.0764 0.0765 0.0765 NA
Fire fighting foams -formulation- use A- use B 0.11 0.11 0.11 0.11 0.11 0.11 NA
Photolithography NA 2.61x10⁻³ NA NA NA NA NAFabrics - application NA 1.42x0-3 NA NA NA NA NAPaper treatment NA 0.164 NA NA NA NA NACoatings NA 4.28x10⁻³ NA NA NA NA NARegional 1.7x10⁻⁴ 3.27x10⁻⁴ 2.1x10⁻⁴ 1.98x10⁻⁴ 3.86x10⁻⁴ 3.5x10⁻⁴ 1.63x10⁻⁴
The calculated concentrations in the effluent from waste water treatment do not depend onthe regional background and so are not affected by the differences between the scenarios. Theresulting concentrations are in Table 3.19.
Table 3.19 Predicted effluent concentrations
Use area Concentration (µg/l) NotesChromium plating 0.065 PFOS-saltPhotography (formulation) 0.82 PFOS-saltPhotography (processing) 0.003 PFOS-substance, assumed instant conversionAviation 0.54 PFOS-saltFire fighting foams (formulation) 973 PFOS-saltFire fighting foams (use B) 570 PFOS-saltPhotolithography 9.0 PFOS-substance, assumed instant conversionFabrics application 4.6 PFOS-substance, assumed instant conversionPaper treatment 613 PFOS-substance, assumed instant conversionCoatings 15.2 PFOS-substance, assumed instant conversion
3.3.2.2 Measured aquatic environmental concentrations
Studies have identified the presence of PFOS in surface water and sediment downstream of aproduction facility, as well as in wastewater treatment plant effluent, sewage sludge andlandfill leachate at a number of urban centres in the US (3M Multi City study, various reportsreviewed in OECD (2002) and 3M (2003)). Four of the cities (Decatur, Mobile, Columbus,Pensacola) were cities that have manufacturing or industrial use of fluorochemicals; two ofthe cities (Cleveland, Port St. Lucie) were control cities that do not have significantfluorochemical activities. The ranges of PFOS levels in these cities are provided in Table3.20.
The control cities’ samples generally inhabited the lower end of the above ranges, except forthe municipal wastewater treatment plant effluent and sludge findings for one of the controlcities (Cleveland), which were intermediate in their ranges, and the ‘quiet’ water samples atcontrol city (Port St. Lucie), which were the highest.
Hansen et al (2002) reported concentrations of PFOS measured from surface water samplestaken from the Tennessee River upstream and downstream of the outfall from thefluorochemical manufacturing facility of 3M at Decatur. Upstream of the facility the averageconcentration of PFOS was 32 ± 11 ng/L; the downstream concentrations were observed toincrease at a point approximately six miles below the outfall; the average PFOS concentrationfrom that point downstream was 114 ± 19 ng/L.

41
Table 3.20 Environmental Levels of PFOS in Six US Urban Centres in the US (from OECD, 2002)
Medium Range of PFOS levelsMunicipal wastewater treatment plant effluent 0.041 - 5.29 ppbMunicipal wastewater treatment plant sludge 0.2 - 3,120 ppb (dry weight)Drinking water ND - 0.063 ppbSediment ND - 53.1 ppb (dry weight)Surface water ND - 0.138 ppb‘Quiet’ water ND - 2.93 ppb
Source: OECD, 2002 Note: ND: not detected
3M (2003) included measured levels from the vicinity of the facility outfall at Decatur for2001. The mean concentration in water for seven sites (one sample from each) was 61 µg/l.The corresponding sediment concentration was 2,740 µg/kg dwt.
The first environmental survey of PFOS and related substances in Japan (which followed aJapanese study that showed measurable levels of PFOS in human blood) found the highestconcentration in surface water in Tokyo Bay at 59 ng/L (mean: 26 ng/L). The concentrationsof PFOS in surface water were similar to those of polyaromatic hydrocarbons (PAHs) andmuch higher than those of PCBs, dioxins and furans (Taniyasu et al, 2002).
Saito et al (2003) determined the PFOS concentrations in surface water samples from 142locations in Japan (single samples from each location). The geometric mean concentration forriver waters (126 samples) was 2.37 ng/l (geometric standard deviation 4.13), the median was1.68 ng/l, the range 0.3 - 157 ng/l. For coastal water samples, the geometric meanconcentration was 1.52 ng/l (SD 4.14), median 1.21 ng/l and range 0.2 - 25.2 ng/l. Theauthors comment that the levels are much lower than those reported for the US, with theexception of two rivers where 135 and 157 ng/l were measured.
Samples of effluent from fifteen representative industrial branches were analysed for PFOS,perfluoroalkyl carboxylates and perfluoroalkyl sulphonates (Hohenblum et al, 2003). Theindustry branches were printing (1 site), electronics (3), leather, metals, paper (6),photographic, textiles (2). The PFOS levels found ranged from below the detection limit(25 ng/l) to 2,500 ng/l (2,500 ng/l for leather, 120 ng/l for metal, 140-1200 ng/l at four papersites, 1,200 ng/l for photographic, not found in textiles or electronic).
Groundwater from below the Wurtsmith Air Force Base in Michigan, US was sampled(Moody et al, 2003). Fire fighting foams containing PFOS had been used there in trainingexercises from the 1950s to 1993 when the base was decommissioned. The groundwaterswere found to contain PFOS, at levels from 4 to 110 µg/l. The C6 (hexyl) analogue of PFOSwas also found, as was PFOA and its C6 analogue.
3.3.2.3 Comparison of measured and estimated aquatic concentrations
There are limited measured data available to compare with the predicted concentrations, andin a number of cases it is not possible to allocate the measured data to the relevant scale,local, regional or continental. Hansen et al (2002) reported a concentration of 32 ng/l in anarea upstream of a discharge and not considered to be affected by specific sources. Thecalculated regional background concentrations are in the range 40 – 90 ng/l.

42
Saito et al (2003) found lower levels in Japan in general, with a median value of 1.2 ng/l.They remarked that the levels were much lower than those found in the United States. Thismay reflect different patterns of use. Taniyasu et al (2002) found the highest level of PFOSin Tokyo Bay, at 59 ng/l, which is similar to the freshwater background levels but higher byabout an order of magnitude than the regional marine concentration (see Section 5.5.2.1).(The value is similar to some of the local concentrations for the marine environment.)
Values up to 2.93 µg/l (ppb) were reported from the 3M Multi-City study. The calculatedlocal values (apart from those for fire fighting foams) are around 0.1 µg/l and so are lowerthan the highest value. The calculated values are closer to those measured some distancedownstream of the production site. The highest calculated concentration is for theformulation of foams, at up to 0.1 mg/l depending on the scenario. This is of a similar orderto the levels measured in the vicinity of the production facility outfall, but these arepresumably different processes.
The effluent concentrations calculated for chromium plating (65 ng/l) and photography(820 ng/l) agree well with the measured values in effluents reported by Hohenblum et al(2002). The predicted value for paper, 0.6 mg/l, is much higher then the 1200 ng/l reported asthe highest measured value. The calculated value is based on the release of PFOS-substanceand assumes instant conversion to PFOS before the treatment plant, and so may be expectedto over-estimate the concentration of PFOS. Similarly, a concentration of 4.6 µg/l wascalculated for fabric treatment, while PFOS was not detected in textile effluents – again thecalculated value is based on PFOS-substance release and instant conversion to PFOS. Themeasurements may indicate a lower presence of PFOS in the effluents from these areas at thepoint of release. There may have been PFOS-substances present in the effluents, but only one(n-ethylperfluorooctanesulphonamide) was analysed for in the samples – it was not detectedin any. The calculated and measured values are therefore not on the same basis and aredifficult to compare.
For some of the use areas the calculated effluent concentrations are in reasonable agreementwith the range of values reported from the 3M Multi-City study. Higher values are calculatedfor uses where the PFOS-substances are assumed to be converted instantly to PFOS. Highervalues are also calculated for the formulation of PFOS-containing foams (which is a defaultestimate) and for Use B, which is a use pattern not likely to have been included in the 3Mstudy (use of foams in a fire).
3.3.3 Terrestrial compartment
3.3.3.1 Estimated soil concentrations
The predicted concentrations in the terrestrial compartment for the seven scenarios are inTable 3.21 (concentrations in soil at 30 days after application of sludge) and Table 3.22(concentrations in groundwater under agricultural soil at 180 days after application ofsludge).

43
Table 3.21 Predicted concentrations in soil (mg/kg wwt, agricultural soil, after 30 days)
Scenario numberUse area1 2 3 4 5 6 7
Chromium plating 8.52x10⁻⁴ 8.57x10⁻⁴ 1.37x10⁻³ 1.45x10⁻³ 1.41x10⁻³ 9.8x10⁻⁴ 8.47x10⁻⁴
0.0107 0.0107 0.0112 0.0113 0.0112 0.0108 0.0107Photography - formulation- processing NA 4.92x10⁻⁵ NA NA NA NA NA
Aviation 7.06x10⁻³ 7.07x10⁻³ 7.59x10⁻³ 7.66x10⁻³ 7.62x10⁻³ 7.19x10⁻³ 7.08x10⁻³
12.7 12.7 12.7 12.7 12.7 NA NA5.05x10-6 1.01x10⁻⁵ 5.26x10⁻⁴ 6.03x10⁻⁴ 5.61x10⁻⁴ 1.32x10⁻⁴ NA
Fire fighting foams - formulation- use A- use B 5.36 5.36 5.37 5.37 5.37 5.36 NA
Photolithography NA 0.118 NA NA NA NA NAFabrics - application NA 0.0598 NA NA NA NA NAPaper treatment NA 8.0 NA NA NA NA NACoatings NA 0.199 NA NA NA NA NARegional (natural) 5.05x10⁻⁶ 1.01x10⁻⁵ 5.26x10⁻⁴ 6.03x10⁻⁴ 5.61x10⁻⁴ 1.32x10⁻⁴ 1.77x10⁻⁵
Table 3.22 Predicted concentrations in groundwater under agricultural soil (mg/l, after 180 days)
Scenario numberUse area1 2 3 4 5 6 7
Chromium plating 3.56x10⁻⁵ 3.58x10⁻⁵ 5.74x10⁻⁵ 6.07x10⁻⁵ 5.89x10⁻⁵ 4.09x10⁻⁵ 3.61x10⁻⁵
4.48x10⁻⁴ 4.46x10⁻⁴ 4.68x10⁻⁴ 4.71x10⁻⁴ 4.69x10⁻⁴ 4.51x10⁻⁴ 4.47x10⁻⁴Photography - formulation- processing NA 2.05x10⁻⁶ NA NA NA NA NA
Aviation 2.95x10⁻⁴ 2.45x10⁻⁴ 3.17x10⁻⁴ 3.2x10⁻⁴ 3.18x10⁻⁴ 3.0x10⁻⁴ 2.95x10⁻⁴
0.53 0.53 0.53 0.53 0.53 NA NA2.12x10-7 4.24x10⁻⁷ 2.31x10⁻⁵ 2.53x10⁻⁵ 2.35x10⁻⁵ 5.56x10⁻⁶ NA
Fire fighting foams - formulation- use A- use B 0.224 0.224 0.224 0.224 0.224 0.224 NA
Photolithography NA 4.91x10⁻³ NA NA NA NA NAFabrics - application NA 2.49x10⁻³ NA NA NA NA NAPaper treatment NA 0.334 NA NA NA NA NACoatings NA 8.31x10⁻³ NA NA NA NA NARegional 3.28x10⁻⁵ 6.27x10⁻⁵ 7.66x10⁻⁵ 5.91x10⁻⁵ 2.93x10⁻⁴ 2.49x10⁻⁴ 3.4x10⁻⁵
3.3.3.2 Measured soil environmental concentrations
No measurements of concentrations of PFOS in soils have been located. Concentrations ofPFOS in groundwater under a US Air Force Base are included in Section 3.3.2.2, and rangefrom 4 – 110 µg/l. These are of the same order as those calculated for the use of fire fightingfoams in Use B, and for the formulation of foams (default calculation). All other calculatedconcentrations are much lower than these measurements.
3.3.4 Atmospheric compartment
3.3.4.1 Estimated air concentrations
The predicted concentrations in the atmospheric compartment for the seven scenarios are inTable 3.23.

44
Table 3.23 Predicted concentrations in air (mg/m3)
Scenario numberUse area1 2 3 4 5 6 7
Chromium plating 1.1x10⁻¹¹ 8.13x10⁻¹¹ 1.09x10⁻⁹ 1.25x10⁻⁹ 1.16x10⁻⁹ 2.75x10⁻¹⁰ 3.71x10⁻¹¹
2.51x10⁻⁸ 2.52x10⁻⁸ 2.62x10⁻⁸ 2.64x10⁻⁸ 2.63x10⁻⁸ 2.54x10⁻⁸ 2.52x10⁻⁸Photography - formulation- processing NA 2.09x10⁻¹¹ NA NA NA NA NA
Aviation 1.22x10⁻¹¹ 2.26x10⁻¹¹ 1.09x10⁻⁹ 1.25x10⁻⁹ 1.16x10⁻⁹ 2.76x10⁻¹⁰ 3.84x10⁻¹¹
2.97x10⁻⁵ 3.04x10⁻⁵ 2.97x10⁻⁵ 2.97x10⁻⁵ 2.97x10⁻⁵ NA NA1.05x10-11 2.09x10⁻¹¹ 1.09x10⁻⁹ 1.25x10⁻⁹ 1.16x10⁻⁹ 2.74x10⁻¹⁰ NA
Fire fighting foams - formulation- use A- use B 1.43x10⁻¹¹ 2.51x10⁻¹¹ 1.09x10⁻⁹ 1.25x10⁻⁹ 1.17x10⁻⁹ 2.78x10⁻¹⁰ NA
Photolithography NA 5.39x10⁻¹¹ NA NA NA NA NAFabrics - application NA 3.14x10⁻¹¹ NA NA NA NA NAPaper treatment NA 1.89x10⁻⁹ NA NA NA NA NACoatings NA 6.74x10⁻¹¹ NA NA NA NA NARegional 1.05x10⁻¹¹ 2.09x10⁻¹¹ 1.09x10⁻⁹ 1.25x10⁻⁹ 1.16x10⁻⁹ 2.74x10⁻¹⁰ 3.66x10⁻¹¹
3.3.4.2 Measured air concentrations
Sasaki et al (2003) measured the levels of PFOS in dust samples from two locations in Japan,monthly samples taken over a 12 month period. The PFOS concentration expressed as aconcentration in air ranged from zero to 2.12 pg/m3 at one location (geometric mean level0.6 pg/m3) and from 2.32 to 21.8 pg/m3 (geometric mean 5.3 pg/m3) at the other. Theamounts of dust in the air were measured. The mean concentrations of PFOS in dust at thetwo locations were 19.2 ng/g and 97.4 ng/g.
Moriwaki et al (2003) measured the concentration of PFOS in vacuum cleaner dust in Japan.One sample contained 2,500 ng/g, the other 15 samples were below 140 ng/g.
Shoeib et al (2004) measured the total concentration of the PFOS-substances N-EtFOSE andN-MeFOSE in outdoor air from locations described as semi-urban. They found levels of 31.7and 16 pg/m3 for N-MeFOSE, and 9.79 and 8.47 pg/m3 for N-EtFOSE. They also separatedthe contributions from the vapour and particulate phases. They found 75% of N-MeFOSEassociated with particulates and ~65% of N-EtFOSE. These values are much higher thanwould be expected from the measured octanol-air partition coefficients or from the sub-cooled liquid vapour pressure values, both of which give reasonable predictions for manyorganic substances.
3.3.4.3 Comparison of measured and estimated atmospheric concentrations
The highest calculated concentration in air is around 1 pg/m3, which is similar to some of themeasured values. However, the number of measurements is limited and their relation tosources is unknown. Hence a comparison is not particularly meaningful.
3.3.5 Food chain exposure
3.3.5.1 Estimated environmental concentrations
Four different situations for food chain exposure are considered in the evaluation. These are:predator feeding on freshwater fish; marine predator feeding on fish; marine top predator; andterrestrial food chain (feeding on worms). The concentrations in the food organisms in eachcase are derived from combinations of the local and regional exposures of the organisms toPFOS according to the methods in the Technical Guidance Document. In addition,concentrations have been calculated for food organisms assuming that they are exposed onlyto the regional background concentration (so without any local contribution). These are

45
included in the tables as regional concentrations. The calculated concentrations in freshwaterfish, marine fish, marine predator and worms are presented in Tables 3.24 to 3.27. (Themarine concentrations have been included here to allow comparison with the measuredlevels.)
Table 3.24 Predicted concentrations in freshwater fish (mg/kg wwt)
Scenario numberUse area1 2 3 4 5 6 7
Chromium plating 0.217 0.428 0.268 0.252 0.493 0.446 0.2080.405 0.604 0.456 0.44 0.681 0.634 0.396Photography - formulation
- processing NA 0.417 NA NA NA NA NAAviation 0.361 0.541 0.413 0.397 0.638 0.591 0.353
224 224 224 224 224 NA NA0.435 0.635 0.487 0.47 0.711 0.665 NA
Fire fighting foams -formulation- use A- use B 0.531 0.731 0.583 0.567 0.807 0.761 NA
Photolithography NA 2.9 NA NA NA NA NAFabrics - application NA 1.21 NA NA NA NA NAPaper treatment NA 141 NA NA NA NA NACoatings NA 3.92 NA NA NA NA NARegional 0.214 0.411 0.265 0.249 0.486 0.440 0.205
Table 3.25 Predicted concentrations in marine fish (mg/kg wwt)
Scenario numberUse area1 2 3 4 5 6 7
Chromium plating 0.0216 0.0432 0.0267 0.0251 0.0484 0.0439 0.02070.0477 0.0676 0.0528 0.0512 0.0745 0.07 0.0468Photography - formulation
- processing NA 0.0416 NA NA NA NA NAAviation 0.0417 0.0588 0.0468 0.0452 0.0685 0.064 0.0408
31 31 31 31 31 NA NA0.0434 0.0634 0.0485 0.047 0.0702 0.0657 NA
Fire fighting foams -formulation- use A- use B 0.0653 0.0852 0.0703 0.0688 0.0921 0.0875 NA
Photolithography NA 0.386 NA NA NA NA NAFabrics - application NA 0.151 NA NA NA NA NAPaper treatment NA 19.6 NA NA NA NA NACoatings NA 0.528 NA NA NA NA NARegional 0.021 0.041 0.026 0.025 0.048 0.043 0.020
Table 3.26 Predicted concentrations in marine predators (mg/kg wwt)
Scenario numberUse area1 2 3 4 5 6 7
Chromium plating 0.0432 0.0838 0.0533 0.0502 0.0968 0.0878 0.04140.0536 0.0935 0.0638 0.0607 0.107 0.0982 0.0518Photography - formulation
- processing NA 0.0831 NA NA NA NA NAAviation 0.0513 0.090 0.0614 0.0583 0.105 0.0958 0.0495
12.5 12.5 12.5 12.5 12.5 NA NA0.0519 0.0918 0.0621 0.059 0.106 0.0965 NA
Fire fighting foams -formulation- use A- use B 0.0607 0.101 0.0708 0.0677 0.114 0.105 NA
Photolithography NA 0.221 NA NA NA NA NAFabrics - application NA 0.127 NA NA NA NA NAPaper treatment NA 7.9 NA NA NA NA NACoatings NA 0.277 NA NA NA NA NARegional 0.043 0.082 0.052 0.050 0.096 0.086 0.041

46
Table 3.27 Predicted concentrations in terrestrial biota (worms) (mg/kg wwt)
Scenario numberUse area1 2 3 4 5 6 7
Chromium plating 1.94x10⁻³ 2.8x10⁻³ 3.8x10⁻³ 3.4x10⁻³ 9.99x10⁻³ 8.22x10⁻³ 1.99x10⁻³
0.0136 0.0144 0.0155 0.0151 0.0216 0.0199 0.0136Photography - formulation- processing NA 1.84x10⁻³ NA NA NA NA NA
Aviation 9.3x10⁻³ 0.0102 0.112 0.0108 0.0173 0.0156 9.35x10⁻³
15.1 15.1 15.1 15.1 15.1 NA NA9.38x10-4 1.79x10⁻³ 2.8x10⁻³ 2.4x10⁻³ 8.99x10⁻³ 7.21x10⁻³ NA
Fire fighting foams -formulation- use A- use B 6.36 6.36 6.36 6.36 6.36 6.36 NA
Photolithography NA 0.141 NA NA NA NA NAFabrics - application NA 0.0726 NA NA NA NA NAPaper treatment NA 9.48 NA NA NA NA NACoatings NA 0.238 NA NA NA NA NARegionala 1.86x10⁻³ 3.56x10⁻³ 4.25x10⁻³ 3.36x10⁻³ 0.0166 0.0141 1.93x10⁻³
Note: the calculation of local soil PECs (from which the local contributions to levels in biota are estimated) use theconcentration in natural soil (arising from deposition only) as the regional background. The regional contribution to thebiota concentrations is estimated from the concentrations in agricultural soil, which are generally higher than thenatural soil levels through sludge application. Hence where the local input is small. The regional contribution to thebiota concentration dominates and the purely regional biota concentration can be higher than the local concentrations.
In addition to the above concentrations, EUSES also calculates concentrations in plants (leafand root), in meat (cattle) and in milk. Rather than present the complete results here, theranges of values calculated for each use area and for the regional background are presentedin Table 3.28. It should be noted that the calculations for these concentrations all involve theuse of the log Kow value. A surrogate value has been estimated for PFOS as the actual valuecannot be determined for this substance. In this situation the suitability of the methods used isuncertain, and hence the results should be treated as having a high degree of uncertainty.
3.3.5.2 Measured environmental concentrations in biota
PFOS and related fluorochemicals have been traced in animals in a number of studies. Thesestudies (a selection of which are outlined in Table 3.29) have taken place in a variety oflocations around the globe and have shown concentrations exceeding 2 ppm in birds and4 ppm in minks.
Some of the following studies relate to studies already included in part in the OECD hazardassessment (OECD, 2002).
Kannan and Giesy (2002) summarised the results of the analyses on archived samplesreferred to in the first item in Table 3.29 The tissues analysed came from marine mammals,birds, fish, reptiles and amphibians from around the world, including the Arctic and AntarcticOceans. Samples collected in the 1990s were used. Around 1,700 samples were analysed,with concentrations in liver, egg yolk, muscle or blood plasma determined. The detectionlimit varied from 1 to 35 ppb wet weight. A summary of the results is in Table 3.30.
PFOS was detectable in most of the samples, including those from remote marine locations,at concentrations >1 ng/g. The authors compared the results from remote areas with thosefrom more industrial locations. They comment that PFOS is distributed in remote regions,including the polar regions, but that the levels found in more urban and industrial areas (e.g.the Baltic, Great Lakes) are several times higher. The tissues of fish-eating birds in Canada,Italy, Japan and Korea all contained detectable levels of PFOS, suggesting that they areexposed through the fish they consume. The sulphonamide compound, FOSA, was onlydetected in ~10-15% of samples.

47
Table 3.28 Calculated concentrations in plants, meat and milk (mg/kg)
Use areaFire-fighting foamsRegional Chromium
platingPhotography –formulation
Photography –processing
AviationFormulation Use A Use B
Photo-lithography
Fabrics –application
Papertreatment
Coatings
Plantroot
0.02-0.18 0.022-0.038 0.28-0.29 1.3x10⁻³ 0.18-0.20 328 1.3x10⁻⁴ – 0.016 139 3.04 1.54 207 5.1
Plantleaf
(2.5-24)x10-5 (2.8-54)x10-5 (5.6-6)x10-4 1.8x10⁻⁶ (2.3-2.6)x10-4 0.67 (0.26-31)x10-6 0.17 3.8x10⁻³ 1.9x10⁻³ 0.26 6.4x10⁻³
Meat (7.4-67)x10-6 (5.3-12)x10-6 (0.95-1.0)x10-4 4.1x10⁻⁶ (4.4-5.1)x10-5 0.11 (0.62-1.3)x10-5 0.033 7.3x10⁻⁴ 3.7x10⁻⁴ 0.05 1.2x10⁻³
Milk (2.3-21)x10-6 (1.7-3.9)x10-6 (3-3.2)x10-5 1.3x10⁻⁶ (1.4-1.6)x10-5 0.034-0.036
(2.0-4.1)x10-6 0.011 2.3x10⁻⁴ 1.2x10⁻⁴ 0.011 3.9x10⁻⁴

48
Table 3.29 Monitored Levels of PFOS in Animals (data from selected studies, based on OECD, 2002)
Description Ref Highest Reported ConcentrationLocation ofHighestConcentration
Bottlenose dolphin: 1,520 ng/g wet wt (liver) FloridaGlobal monitoring survey of marinemammals (Florida, California, Alaska,northern Baltic Sea, Mediterranean Sea,Arctic, Sable Island (Canada))
OECD,2002 Ringed seal: 475 ng/mL (blood) Northern Baltic
Sea
Bald eagle: 1,047 ppb (plasma) USUS Fish & Wildlife Service survey ofpiscivorous fish A
Six bird species: 2,055 ppb (liver) USFish: 923 ng/g wet wt. (muscle) Belgian estuarySurvey of fish-eating water birds (US,
Europe, North Pacific Ocean, Antarctic) BCarp: 296 ng/g wet wt. (muscle) US Great LakesBald eagle: 2,200 ng/mL (plasma) Midwest USSurvey of fish-eating birds (US, Baltic Sea,
Mediterranean Sea, Japanese coast,Korean coast)
CBrandts cormorant: 1,780 ng/g wet wt. (liver) US
Mink: 4,800 ng/g wet wt. (liver) USSurvey of mink and river otter in the US D
River otter: 994 ng/g wet wt. (liver) USSurvey of oysters in the US (ChesapeakeBay & Gulf of Mexico) E Oysters: 1,225 ng/g dry wt. US
Fish: 59.1 µg/kg wet wt. (whole body -upstream)Fish: 1,332 µg/kg wet wt. (whole body -downstream)
Decatur, USClam and fish samples upstream anddownstream of 3M facility in Decatur,Alabama, US
F
Clam: 15.6 µg/kg wet wt. (upstream)Fish: 14.1 µg/kg wet wt. (downstream) Decatur, US
First Environmental Survey of PFOS inJapan G Fish: 345 ng/mL (average blood levels) Lake Biwa, Japan
Swedish urban and background fishsamples H
Perch: 3 - 8 ng/g (urban sites in the vicinity ofmunicipal STPs); 20-44 ng/g in Lake Malarenand near Stockholm
Sweden (LakeMalaren)
Sources: A: 3M (2000); B: Giesy and Kannan (2001a); C: Giesy and Kannan (2001b); D: Giesy and Kannan (2001c); E:Giesy and Kannan (2001d); F: Giesy and Kannan (2001e); G: Taniyasu et al (2002); H: Jarnberg and Holmstrom (2003)
Table 3.30 Summary of global archive sample analysis
Species Maximum concentration ng/g wwt Frequency of detectionMarine mammals 1520 77%Mink and otter 4900 100%Birds 2570 60%Fish 1000 38%
Martin et al (2004) measured the levels of PFOS in liver samples from biota in the CanadianArctic. PFOS was found in the vast majority of the samples (all except the black guillemot).The highest levels were found in polar bear, with a mean level of 3,100 ng/g from sevenanimals (maximum value >4,000 ng/g). Generally, higher levels were found in animalshigher up the food chain. The sulphonamide FOSA was also found in most of the samples. Itwas associated with PFOS to some extent. The concentration of FOSA was higher than thatof PFOS in fish, but not in mammals. The pattern may be the result of both exposure andmetabolism.
A recent conference presentation (personal communication, KEMI, Sweden) reported that theconcentration of PFOS in guillemot (Uria aalge) eggs collected from the Baltic Sea hasincreased by more than 30-fold since 1968, with annual average increases of 7-11%.
Van de Vijver et al (2003) measured the concentrations of PFOS in aquatic invertebratesfrom the Western Scheldt estuary, in starfish (Asterias rubens), crab (Carcinus mainas) and

49
shrimp (Crangon crangon). Eight locations were sampled. Mean whole body concentrationswere 16±3 - 93±34 ng/g in starfish, 40±13 - 319±70 for shrimp and 93±38 - 292±45 ng/g forcrab. There were indications of a concentration gradient, with possible sources of PFOSincluding a fluorochemical manufacturing site and industrial regions drained by a canalentering the estuary.
Hoff et al (2003) sampled fish (bib, Trisopterus luscus, and plaice, Pleuronectes platessa)from the Western Scheldt and the Belgian North Sea, with four separate locations for eachfish. Some of the locations were similar to those in the Van de Vijver et al (2003) studyabove. PFOS was found in the livers of all of the plaice collected (detection limit 10 ng/gwwt); levels up to 7,760 ng/g were found at estuarine sites, the values at marine sites werelower. In plaice muscle, PFOS was detected in 20-30% of the marine samples and 75% of theestuarine samples (maximum concentration 87 ng/g). For bib, again all liver samples hadconcentration above the detection limit, though the highest concentration were lower thanthose found in plaice, at ~200 ng/g. In bib muscle, marine sites had 50% of samples above10 ng/g, while the two innermost estuarine sites had all samples above the detection limit.The maximum concentration measured was 111 ng/g.
The first environmental survey of PFOS and related substances in Japan (which followed aJapanese study that showed measurable levels of PFOS in human blood) suggests that PFOSis present in the blood and livers of all fish in surface waters in Japan (Taniyasu et al, 2002).
In the 3M Multi City study (see Section 3.3.3.2), measurable quantities of PFOS (up to0.852 ng/g) were found in four milk samples and one ground beef sample. One of the fourmilk samples was from a control city, although cities with fluorochemical substancesproduction or use tended to give measurable PFOS levels. The testing included produce suchas green beans, apples, pork muscle, cow’s milk, chicken muscle, chicken eggs, bread, hotdogs, catfish and ground beef.
3.3.5.3 Comparison of predicted and measured environmental concentrations
The information on measured levels in biota has been largely presented as summaries andranges, and so the predicted concentrations are also considered as ranges. These are:
Freshwater fish 200 – 800 µg/kg (ng/g)Salt water fish 20 – 100 µg/kg (ng/g)Marine predators 40 – 120 µg/kg (ng/g)Soil organisms 1 – 20 µg/kg (ng/g)
The concentrations predicted in fish appear to agree reasonably well with the summarisedmeasured values in Tables 3.27 and 3.28. If anything the calculated values are generallylower than the upper ends of the ranges, particularly if the predicted concentrations related tothe formulation and use of foams are excluded. However, the measured values relate in manycases to specific tissues, whereas the calculated values are whole body concentrations and sowould be expected to be lower than tissue concentrations in most cases. Many of themeasurements on levels in biota from the environment have been performed on samplestaken from relatively remote areas. As such these cannot easily be compared to the calculatedlevels, which relate to locations closer to sources.
50
The majority of the calculated concentrations in milk are of the same order or are below thehighest reported concentration of 0.852 ng/g (8.5x10⁻⁴ mg/kg), but data for comparison arelimited. The concentrations calculated for three of the use areas are very much higher.
Concentrations in vegetation and fruits were measured as part of the plant toxicity studydiscussed in Sections 4.2.1 and 3.2.6.2. The actual concentrations are not appropriate forcomparison with the calculated levels, as the measurements are not from environmentalsamples. It is of interest to compare the plant:soil concentration ratios for the measured andcalculated concentrations. As described in Section 3.2.6.2, the measured levels in vegetativetissues were 1-2 times those in the soil; for the calculated concentrations, the calculated levelsin plant leaf are 0.01-0.05 tmes those calculated for the soil. The plant root calculatedconcentrations are not really comparable with the fruit measurements, as most of the fruitswere above ground, but the calculated values are 26 times those in soil, while the measuredfruit values were less than 10% of those in soil. It thus appears that using the model andvalues selected, the model may under-estimate the levels in plant leaves but over-estimatethose in root crops.

51
4 EFFECTS ASSESSMENT: HAZARD IDENTIFICATIONAND DOSE (CONCENTRATION) - RESPONSE (EFFECTASSESSMENT)
The ecotoxicity data relating to PFOS were reviewed for the OECD Hazard Assessment(OECD, 2002). The studies reviewed in the OECD report have not been re-examined for thisevaluation. A comparison has been made against the updated 3M report (3M, 2003) to checkfor any corrections or for new tests. A literature search for studies from 2002 onwards hasalso been conducted.
4.1 AQUATIC COMPARTMENT (INCLUDING SEDIMENT)
4.1.1 Aquatic studies
4.1.1.1 Fish
The results from the studies on fish toxicity reviewed by the OECD and considered to be of agood or acceptable standard are presented in Tables 4.1 and 4.2. Results are expressed interms of the potassium salt of PFOS. Where a different salt was used in the study, the resulthas been converted for this evaluation (and noted in the tables). For further details of thestudies see the OECD assessment (OECD, 2002).
Table 4.1 Acute toxicity data for fish (after OECD, 2002)
Species Protocol Result (mg/l) Study standardFreshwaterFathead minnow (Pimephalespromelas)
OECD 203 & OPPTS 850.1075 (static) 96-h LC60 = 9.5 Good
Not noted (static) 96-h LC50 = 5.0 Acceptablea
OECD 203 (static) 96-h LL50 = 133 Acceptableb
Bluegill sunfish (Lepomismacrochirus)
OECD 203 & OPPTS 850.1075 (static) 96-h LC50 = 6.9 Acceptablec
Rainbow trout (Oncorhynchusmykiss)
Standard procedures for testing acute lethality ofliquid effluents (Environment Canada)
96-h LC50 = 7.8 Acceptable
OECD 203 & OPPTS 850.1075 (static) 96-h LC50 = 22 AcceptableSeawaterSheepshead minnow(Cyprinodon variegatus)
OECD 203 & OPPTS 850.1075 (semi-static,24 h renewal))
96-h LC50 > 15 Acceptable
Rainbow trout (Oncorhynchusmykiss)
Standard procedures for testing acute lethality ofliquid effluents (Environment Canada)
96-h LC50 = 13.7 Acceptable
Notes: a – original value 4.7 mg/l, for lithium saltb – original value 200 mg/l, for didecyldimethylammonium saltc – original value 7.8 mg/l, for DEA salt
Table 4.2 Long-term toxicity data for fish (after OECD 2002)
Species Protocol Result (mg/l) Study standardFreshwater
OECD 210 & OPPTS 850.1400(flow-through)
42-d NOECsurv = 0.3042-d NOECgrowth = 0.305-d NOEChatch = ≥ 4.6
GoodFathead minnow (Pimephalespromelas)
Non-standard (flow-through) 30-d NOECels = 1 AcceptableBluegill sunfish (Lepomismacrochirus)
OECD 305 & OPPTS 850.1731 62-d NOECmortality = >0.086, <0.87 Good
The long-term study with bluegill sunfish was a bioconcentration study (discussed as such inSection 3.2.6.1). All fish exposed to 0.87 mg/l died by the 35th day of the exposure. At

52
0.086 mg/l, two fish of the ninety exposed died (2.2%). There were no deaths in the controls.As there were no repeat exposures it is not considered suitable for the determination of aNOEC value. However, the observations in this study are not in contradiction to those in theother long term studies. Hoff et al (2003) administered a single intraperitoneal injection of PFOS into carp (sixconcentrations over two experiments) and monitored selected biochemical endpoints. Levelsof PFOS in fish liver were measured after one and five days. No mortality was seen, norinflammation of the liver, peroxisome proliferation, or any effect on serum anti-oxidantlevels. The levels of liver enzymes in serum were elevated, indicating a disruption of the livermembrane. In terms of the concentration in the fish, the EC10 values for this effect weredetermined as 164 ng/g in wet tissue or 258 ng/g in wet liver respectively (concentrationsafter five days).
4.1.1.2 Invertebrates
The results from the studies on fish toxicity reviewed by the OECD and considered to be of agood or acceptable standard are presented in Tables 4.3 and 4.4. Results are expressed interms of the potassium salt of PFOS. Where a different salt was used in the study, the resulthas been converted for this evaluation (and noted in the tables). For further details of thestudies see the OECD assessment (OECD, 2002). Results from a more recent publication(Boudreau et al, 2003a) are also included in the tables. These used ASTM methods, and areconsidered valid for use in the evaluation. As specific details of the tests have not been seen,they have been graded as acceptable in the tables.
Table 4.3 Acute toxicity for invertebrates
Species Protocol Result (mg/l) Study standardFreshwater
OECD 202 & OPPTS850.1010 (static)
48-h EC50 = 61 Good
ASTM 1981 & OECD 1981(static)
48-h EC50 = 27 Acceptable
Not noted (static) 48-h EC50 = 223 Acceptableb
OECD 202 (static) 48-h EL50 = 2.66 Acceptablec
ISO, 1982 48-h EC50 = 58 Acceptable
Water flea (Daphnia magna)
ASTM 48-h EC50 = 67.2 Acceptablea
W\ater flea (Daphniapulicaria)
ASTM 48-h EC50 = 134 Acceptablea
Freshwater mussel (Uniocomplamatus)
OECD 203, OPPTS 850.1075& ASTM-E-729-88a (semi-static)
96-h LC50 = 59 Good
SaltwaterMysid shrimp (Mysidopsisbahia)
OPPTS 850.1035 (static) 96-h LC50 = 3.6 Good
Eastern oyster (Crassostreavirginica)
OPPTS 850.1025 (static) 96-h EC50 = >3.0 Good
Brine shrimp (Artemia sp.) Draft ISO, 1981 48-h LC50 = 8.9 AcceptableNote: information taken from OECD (2000) except for those marked “a” which are from Boudreau et al (2003a).b – original value 210 mg/l, for lithium saltc – original value 4.0 mg/l, for didecyldimethylammonium salt

53
Table 4.4 Chronic toxicity to invertebrates
Species Protocol Result (mg/l) Study standardFreshwater
OECD 211, OPPTS850.1300 & ASTM 1193-87E(semi-static)
21-d NOECrepro = 1221-d NOECsurv = 1221-d NOECgrowth = 12
Good
ASTM 1981 & OECD 1981(semi-static)
28-d NOECrepro = 7 Acceptable
Water flea (Daphnia magna)
ASTM 21-d NOECsurv = 5.3 Acceptablea
SeawaterMysid shrimp (Mysidopsisbahia)
OPPTS 850.1350 (flow-through)
35-d NOECrepro = 0.2535-d NOECsurv = 0.5535-d NOECgrowth = 0.25
Good
Note: information taken from OECD (2000) except for those marked “a” which are from Boudreau et al (2003a)
4.1.1.3 Aquatic plants
Toxicity data for aquatic plants are presented in Table 4.5. As for invertebrates, these arelargely from OECD (2002), with some additional results from Boudreau et al (2003a).
Table 4.5 Toxicity to aquatic plants
Species Protocol Result (mg/l) Study standardFreshwater
OECD 201, OPPTS850.5400 & ASTM 1218-90E (static)
96-h EC50 = 71 (cell density)96-h EC50 = 126 (growth rate)96-h NOEC = 44 (cell density, growth rate)
Good
OECD 201, US EAP 600/9-78-018 & ASTM-E-35.23(static)
96-h EC50 = 82 (cell density)96-h EC10 = 10 (cell density)
Acceptable
Selenastrum capricornutum(algae)
ASTM 96-h IC50 = 48.2 (cell density) Acceptablea
Anabaena flos-aquae(algae)
OPPTS 850.5400 96-h EC50 = 176 (growth rate)96-h NOEC = 94 (growth rate)
Good
Navicula pelliculosa (algae) OPPTS 850.5400 96-h EC50 = 305 (growth rate)96-h NOEC = 206 (growth rate)
Good
Chlorella vulgaris (algae) ASTM 96-h IC50 = 81.6 (cell density) Acceptablea
Lemna gibba (duckweed) ASTM 7-d IC50 = 31.1 Acceptablea
SeawaterSkeletonema costatum(algae)
OPPTS 850.5400 96-h EC50 >3.2 (growth rate)96-h NOEC >3.2 (growth rate)
Good
Note: information taken from OECD (2000) except for those marked “a” which are from Boudreau et al (2003a)
4.1.1.4 Microcosms
Two microcosm studies have been conducted with PFOS. In the first, indoor microcosmscontaining zooplankton were exposed to PFOS (potassium salt) for 35 days at threeconcentrations - 1, 10 and 30 mg/l. The endpoints used were zooplankton species andabundance. Phytoplankton were added as a supplementary food supply at intervals(Sanderson et al, 2002).
Concentrations in the microcosms were measured on days 1, 8 and 35 of the study. Littlechange in the concentrations was observed, the greatest percentage change being found at thelowest concentration with a 19% reduction over the 35 days. The exposures showed asignificant influence of PFOS on the zooplankton community at 10 mg/l after 14 days, withseveral species markedly reduced or eliminated. The relative susceptibility, assuming alleffects due to PFOS exposure, was Copepoda > Cladocera > Roifera. The statistical power ofthe study was insufficient to allow a conclusion of no effect at 1 mg/l to be reached.

54
In the second microcosm study, the effects of PFOS were studied on the zooplanktoncommunity and on the floating macrophyte Lemna gibba in outdoor microcosms (Boudreauet al, 2003b). The studies were run in triplicate, with PFOS concentrations of 0.3, 3, 10 and30 mg/l. The potassium salt was used. Concentrations were monitored through the study, andno significant decrease in concentration was noted. The results were based on the nominalconcentrations. The zooplankton community was significantly altered from that in thecontrols at 10 mg/l and 30 mg/l. The NOEC for community effects was 3 mg/l for days 4-28,and 0.3 mg/l for day 35. For Lemna, growth was only significantly reduced at 30 mg/l.
4.1.2 Sediment toxicity
No test results on sediment-dwelling organisms have been located.
4.1.3 Wastewater treatment plant (WWTP) micro-organisms
Only one study on activated sludge micro-organisms was considered valid in the OECDassessment. In a 3 hour respiration inhibition test (OECD 209), the highest exposureconcentration of 905 mg/l (nominal) resulted in 39% inhibition. The IC50 is therefore>905 mg/l.
4.1.4 Predicted No Effect Concentrations (PNECs) for the aquaticcompartment
4.1.4.1 Calculation of a PNEC for surface water
The lowest acute and chronic aquatic toxicity studies from the discussion above aresummarised briefly in Table 4.6 The table includes freshwater and marine species.
Table 4.6 Summary of aquatic toxicity data
Fish Fathead minnow (Pimephales promelas) (96-h): LC50 = 4.7 mg/LRainbow trout (Oncorhynchus mykiss - saltwater) (96-h): LC50=13.7 mg/l
Invertebrates Daphnia magna (48-h): EC50 = 27 mg/LMysid shrimp (Mysidopsis bahia - saltwater) (96-h): LC50 = 3.6 mg/L
Acute Algae Selenastrum capricornutum (96-h): EC50=126 mg/l
Skeletonema costatum (saltwater) (96-h): EC50 > 3.2 mg/LFish Fathead minnow (Pimephales promelas) (42-day): NOECsurvival = 0.3 mg/L
Invertebrates Daphnia magna (28-day): NOECreproduction = 7 mg/LMysid shrimp (Mysidopsis bahia - saltwater) (35-day): NOECreproduction = 0.25 mg/L
Long
-term
AlgaeSelenastrum capricornutum (96-h): NOEC=44 mg/l.Skeletonema costatum (saltwater) (96-h): NOEC>3.2 mg/l Duckweed (Lemna gibba) (7-day): NOEC = 15.1 mg/L
Acute toxicity data are available for fish, invertebrates and algae in freshwater and inseawater. The values for freshwater and saltwater fish are close together, those frominvertebrates have a greater difference with the salt water value lower. The algal valuescannot be compared as the lower, marine, value is a limit value with no effect at the highestconcentration achievable in the test medium.
Results from long term tests with species in three taxonomic groups (fish, invertebrates,algae) are available for the freshwater environment. There are also long term results with asalt water invertebrate and a salt water algae (again a limit value). The results of themicrocosm tests are similar to the lowest NOEC values obtained in single species tests.

55
The lowest NOEC from the whole data set is 0.25 mg/l, for Mysid shrimp This will be usedfor the PNEC derivation. The next lowest value is 0.3 mg/l, for fathead minnow (and for partof a microcosm test) so a PNEC based on freshwater data alone would be similar. As threetaxonomic groups are represented a factor of 10 is used, giving a PNEC for freshwater of25 µg/l.
For the marine environment, there are three taxonomic groups represented. Although thereare saltwater species for two of these, there are no additional marine taxonomic groups in thedata set. The TGD indicates a factor of 100 in this situation, giving a PNEC of 2.5 µg/l.
There are some intermittent release scenarios. For these, the PNEC is based on the acute data.The lowest acute value is 3.6 mg/l, again for Mysid shrimp (the saltwater algal value is lower,at 3.2 mg/l, but this is a limit value and no effects were seen at this level). A factor of 100 isused, giving a PNEC of 36 µg/l.
4.1.4.2 Sediment PNEC
In the absence of any toxicity data for sediment organisms, the usual approach would be touse the equilibrium partitioning method. The use of this method may be questioned forsubstances with the properties of PFOS. However, the log Kow value does not have to beused as a measured value for Kd with sediment is available (8.7 l/kg, see Section 3.2.5.1).Using this gives a freshwater sediment PNEC of 67 µg/kg wwt and a marine sediment PNECof 6.7 µg/kg wwt.
4.1.4.3 Calculation of PNEC for WWTP micro-organisms
The IC50 for activated sludge respiration inhibition was determined as >905 mg/l (Section4.1.3) The appropriate assessment factor for this test is 100, giving a PNEC of >9.05 mg/l.
4.2 TERRESTRIAL COMPARTMENT
4.2.1 Terrestrial toxicity data
No terrestrial toxicity data were available at the time the OECD assessment was produced. Astudy on earthworms was referred to in the assessment as being planned; this is included inthe 3M revised assessment (3M, 2003). The OECD assessment also mentions a planned studyon plant toxicity, but this has not been seen.
A 14-day earthworm toxicity test is reported by 3M (2003). A robust study summary for thistest is included in the 3M assessment, and only the main points relating to the test areincluded here. The test protocol was based on OECD Guideline 207. The test was conductedin an artificial soil substrate, at five exposure concentrations (ranging from 78 - 1250 mg/kgnominal) plus control. Concentrations of PFOS in the soil were measured on days 0 and 14,and were found to be within 80% of the nominal concentrations. The results are based on theconcentrations at day 0. The contents of the test chambers were removed at 7 days forobservations and returned to the chambers without the addition of further substance. Theendpoints observed were mortality, burrowing behaviour, body weight and clinical signs oftoxicity. The results of the test are in Table 4.7.

56
Table 4.7 Toxicity results for earthworms (3M, 2003)
Endpoint Time Value (mg/kg dwt) 95% CILC50 7 days 398 289 - 488
14 days 373 316 - 440NOEC 7 days 289
14 days 77
The toxicity of PFOS to plants through soil exposure has been investigated using a methodbased on the OECD 21-day test guideline (3M, 2004). The endpoints examined wereemergence, survival, shoot height and shoot weight. These endpoints were measured after 21days of exposure. Where possible, the plants were allowed to continue growing after this timeuntil they produced fruit or sufficient leaf for analysis. The results of these later analyses areincluded in Section 3.2.6.2.
The seven plant species included in the study were: lettuce (Lactuca sativa); ryegrass (Loliumperenne); tomato (Lycopersicon esculentum); onion (Allium cepa); alfalfa (Medicago sativa);flax (Linum usitatissimum); and soybean (Glycine max). The nominal concentrations used inthe tests were 3.91, 15.6, 62.5, 250 and 1000 mg/kg. Concentrations measured in the soil atthe beginning of the exposures were all within 70% of the nominal values. Concentrationswere also measured at the final termination of the study after 205 days, when theconcentrations ranged from 22.8% to 62.8% of nominal. Samples were taken at 21 days, butthe results were considered to be artefacts due to the irrigation and sampling methods used.The results presented are based on the nominal concentrations. The lowest no effectconcentrations for each endpoint were as follows:
Emergence 62.5 mg/kg onion, ryegrassSurvival 15.6 mg/kg onion, tomatoShoot height <3.91 mg/kg lettuce (23% reduced compared to control)Shoot weight <3.91 mg/kg lettuce (35% reduced compared to control)
4.2.2 Calculation of PNEC for the soil compartment
One short term test result is available for earthworms. A factor of 1000 is applied to the LC50
from this test, 373 mg/kg dwt, giving a PNEC of 373 µg/kg dwt.
The plant test available can be considered to be a chronic study. As there is only one suchstudy, an assessment factor of 100 is indicated according to the TGD. Effects were seen onlettuce at the lowest exposure concentration, so that the PNEC is <39 µg/kg wwt.
When terrestrial toxicity data are limited, the Technical Guidance document recommends thata PNEC be calculated from the aquatic PNEC using the equilibrium partitioning method. Thismethod may not be appropriate for a substance with the properties of PFOS, but a measuredKd value is available for soil. A value of 26.9 is used in this evaluation (see Section 3.2.5.1),which corresponds to a Ksoil-wter of 40.6. Using this method gives a PNEC of 597 µg/kg wwt,or 680 µg/kg dwt.
The values obtained from the worm toxicity test and the partitioning method are similar, butthe value from the plant test is much lower.. The value derived from the toxicity test forplants, <39 µg/kg wwt (or 46 µg/kg dwt based on 15% moisture in the soil) will be used inthe evaluation, recognising that a PNEC derived from the actual effect level is expected to bebelow this.

57
4.3 ATMOSPHERIC COMPARTMENT
No data on effects of PFOS through exposure via the atmosphere were located, either forbiotic or abiotic effects. The low volatility of the substance suggests that significant exposurethrough the vapour phase would not be expected.
4.4 NON-COMPARTMENT SPECIFIC EFFECTS RELEVANT TOTHE FOOD CHAIN (SECONDARY POISONING)
4.4.1 Mammalian toxicity data
Mammalian toxicity data were reviewed for the OECD assessment (OECD, 2002). Resultsfrom acute, sub-chronic and chronic exposures to rats, sub-chronic exposures to monkeys,and a two-generation study on rats are available. Details of these studies are not includedhere, they can be found in the OECD assessment.
In a two year carcinogenicity assay using rats, effects on the liver were monitored. From thisstudy the NOAEL for PFOS was considered to be 0.5 ppm in food in male rats and 2 ppm infood in female rats. The corresponding LOAELs were 2 ppm for males and 5 ppm forfemales. These values are taken from the main text of the OECD assessment. In the summaryof the OECD assessment the LOAEL for male rats is said to be 0.5 ppm, with no NOAELestablished. The main text indicates that the effects seen on male rats at 0.5 ppm wereconsidered to be due to old age and were not treatment related. For comparison, a level infood of 0.5 ppm is equivalent to a dose of 0.025 mg/kg bw/day using the conversion factorsin the Technical Guidance document. The range of doses estimated from the study was 0.015to 0.057 mg/kg bw/day, so this fits into the observed range. The value required for the riskevaluation is the concentration in food.
Doses of 4.5 mg/kg bw/day were lethal to Rhesus monkeys over a seven week exposure.
In the two generation study on rats, the NOAEL for reductions in pup weights in the secondgeneration was 0.1 mg/kg bw/day, with a LOAEL of 0.4 mg/kg bw/day.
Adult female Sprague-Dawley rats were injected intraperitonealy daily for 14 days (Austin etal, 2003). The doses were 1 and 10 mg/kg bw/day. Food intake and body weight weremonitored daily. The oestrus cycle of the rats was also monitored. At the end of theexposures, the levels of leptin and corticosterone in the serum were measured, as weremonoamines in the hypothalamus. PFOS levels were measured in a range of tissues at the endof the exposures.
PFOS was found in all of the tissues sampled after exposure, including blood, liver, serum,kidneys, heart, ovaries, adrenal, brain and spleen. Levels in liver were 26,627 ng/g at the lowdose and 97,358 ng/g at the high dose. There were marked changes in body weight and fooduptake at the higher dose. There was a significant decrease in serum leptin levels by the endof two weeks exposure at the higher dose, and also a significant increase in serumcorticosterone levels. All of the animals in the control groups had regular oestrus cycles,compared to 66% in the lower dose group and 42% in the higher dose group.

58
4.4.2 Avian toxicity
Two studies on the acute toxicity of PFOS to birds are included in the OECD assessment(2002) and the 3M (2003) assessment. Both were 5-day studies, followed by 3 or 17 daysobservation. The concentration of the PFOS potassium salt was measured in the food. TheLC50 values derived from the studies were 628 mg/kg food for mallard duck (Anasplatyrhynchos) and 220 mg/kg food for northern bobtail quail (Colinus virginianus).
The effects of PFOS administered in the diet on mallard ducks (Anas platyrhynchos) andnorthern bobwhite quail (Colinus virginianus) have been investigated in 21-week dietaryreproduction studies (3M, 2004). Adult birds were brought into the reproductive phase atweek 11 (mallard) or week 7 (quail). After hatching, the chicks were fed an untreated diet for14 days. The exposure levels for both species were 0, 10, 50 and 150 ppm in food. In bothcases, overt toxicity at the two highest dose levels led to early termination of these exposures.
For mallard, a NOAEC of 10 ppm was established for mortality, body weight, liver weight,and reproduction in adults, and for survivability, bodyweight and liver weight in offspring.Gross pathology in females also had a NOAEL of 10 ppm. In males, there was an increase inthe incidence of small testis size and decreased spermatogenesis at 10 ppm. Although theseeffects are normal in the early post-reproductive phase, PFOS may have accelerated theprocess compared to untreated birds. Based on these effects the LOAEC was determined tobe 10 ppm.
The results for northern bobwhite were similar. The NOAEC was 10 ppm for mortality, bodyweight, food consumption, liver weight (males) and gross pathology (females). Effects wereseen on liver weight in females at 10 ppm, and similar effects on the testes and sperm inmales as for mallard. Again, the exposure to PFOS appeared to accelerate the post-reproductive phase regression, and a LOAEC of 10 ppm was determined for this endpoint. Astatistically significant reduction in offspring survival was seen at 10 ppm, together withslight, not statistically significant, reductions in fertility and hatchability. A LOAEC of 10ppm was determined for offspring survival.
4.4.3 Derivation of PNECoral
The lowest no effect level is 0.5 ppm, for liver effects in male rats. This is from a chronicstudy, so an assessment factor of 30 is appropriate. This gives a PNEC of 0.0167 mg/kg infood.
In comments from the consultation on the draft evaluation report, it was suggested that theabove may be an over-conservative choice of endpoint for the assessment of secondarypoisoning. Alternatives proposed were the 2 ppm LOAEC from the same study, or theNOEAL of 0.1 mg/kg bw/day from the reproduction study. The 2 ppm level from thecarcinogenicity study gies a PNEC of 0.067 mg/kg using the same assessment factor of 30 asabove. For the NOEAL of 0.1 mg/kg bw/day, the conversion factor from dose toconcentration in food is 20 from the Technical Guidance Document, so that the NOEC fromthis study is 2 mg/kg. With an assessment factor of 30 for a chronic study this also gives aPNEC of 0.067 mg/kg. This value will also be considered in the risk evaluation.
The chronic studies on birds show an NOAEC of 10 ppm for most of the endpoints, but aLOAEC for effects on males and on survival of offspring. A PNEC derived from this figure

59
would be 0.33 mg/kg using an assessment factor of 30. Although the no effect level is notfully defined, this result suggests that the PNECs derived from the mammalian data can beconsidered to cover the risk to birds as well.
4.5 CLASSIFICATION FOR ENVIRONMENTAL HAZARD
PFOS is not listed as a substance on EINECS and has no classification. The acid form ofPFOS is not classified on Annex I of Directive 67/548/EEC, and neither are any of the usualsalts (potassium, ammonium, lithium).
From Section 4.1.1, there are a number of species for which the L(E)C50 values are in therange 1 – 10 mg/l for the potassium salt. This substance is not readily biodegradable. On thebasis of this information the substance should be classified as dangerous to the environment,N R51-53 (toxic to aquatic organisms, may cause long term adverse effects in the aquaticenvironment
There are also invertebrate test results for the lithium salt, DEA salt anddidecyldiemthylammonium salt below 10 mg/l. Although these substances have not beenspecifically tested for biodegradation, on the basis of the evidence it is unlikely that the PFOSmoiety will be degraded. Hence these should also be classified as N R51-53.

60
5 RISK EVALUATION
The exposure estimates in Section 3.3 considered seven possible scenarios for combinationsof releases from different uses and with different degradation rates for PFOS-substances. Thescenarios were:
1 - PFOS-salt releases only (all relevant uses in Table 3.8)2 - PFOS-salt plus PFOS-substances, assuming instant degradation to PFOS (all relevant
uses in Table 3.8).3 - PFOS-salt plus PFOS-substances, assuming a 20 day half life for degradation to PFOS
(all relevant uses in Table 3.8).4 - PFOS-salt plus PFOS-substances, assuming a 1 year half life for degradation to PFOS
(all relevant uses in Table 3.8).5 - PFOS-salt, PFOS-substances with 20 day half life, PFOS-polymer with 30 year half life
degradation to PFOS (all uses in Table 3.8).6 - PFOS-salt, PFOS-substances with 20 day half life, PFOS-polymer with 30 year half life
degradation to PFOS (uses in Table 3.8 excluding foam formulation, fabric treatment,paper treatment and coatings).
7 - PFOS-salt, PFOS-substances with 20 day half life degradation to PFOS (chromiumplating, photographic, aviation, photolithography only)
As well as calculating the risk characterisation ratios, back-calculations have been performedto estimate the amount of PFOS which if released into waste water would result in aconcentration equal to the PNEC value. The standard assumptions for water flows, dilutions,sludge applications etc have been used in the calculations. For the aquatic and terrestrialcompartments, these calculations assume that there is no regional background contribution,this seems a reasonable assumption as the background concentrations calculated in thisevaluation are low compared to the PNECs for these end points (see below). The same is nottrue for the secondary poisoning endpoints, where the regional background concentrations aresignificant and the exposure concentrations depend on both the local and the regionalcontributions. For these, a range of concentrations is presented. The upper value is the releasewhich would lead to a risk with no regional contribution, the lower value would give a risk ifthe regional contribution were the same as the local contribution.
5.1 AQUATIC COMPARTMENT
5.1.1 Surface water and sediment
The risk characterisation is based on the predicted environmental concentrations from Section3.3.2.1. The predicted no effect concentration (PNEC) is 25 µg/l, from Section 4.1.4.1.
Table 5.1 shows the risk characterisation ratios for freshwater for the seven scenarios and thevarious uses. As both the exposure and effect concentrations for sediment are derived by theequilibrium partition method, and the sorption coefficient is below the threshold for the extrafactor of 10, the ratios for sediment are the same as for water, and are not presentedseparately.
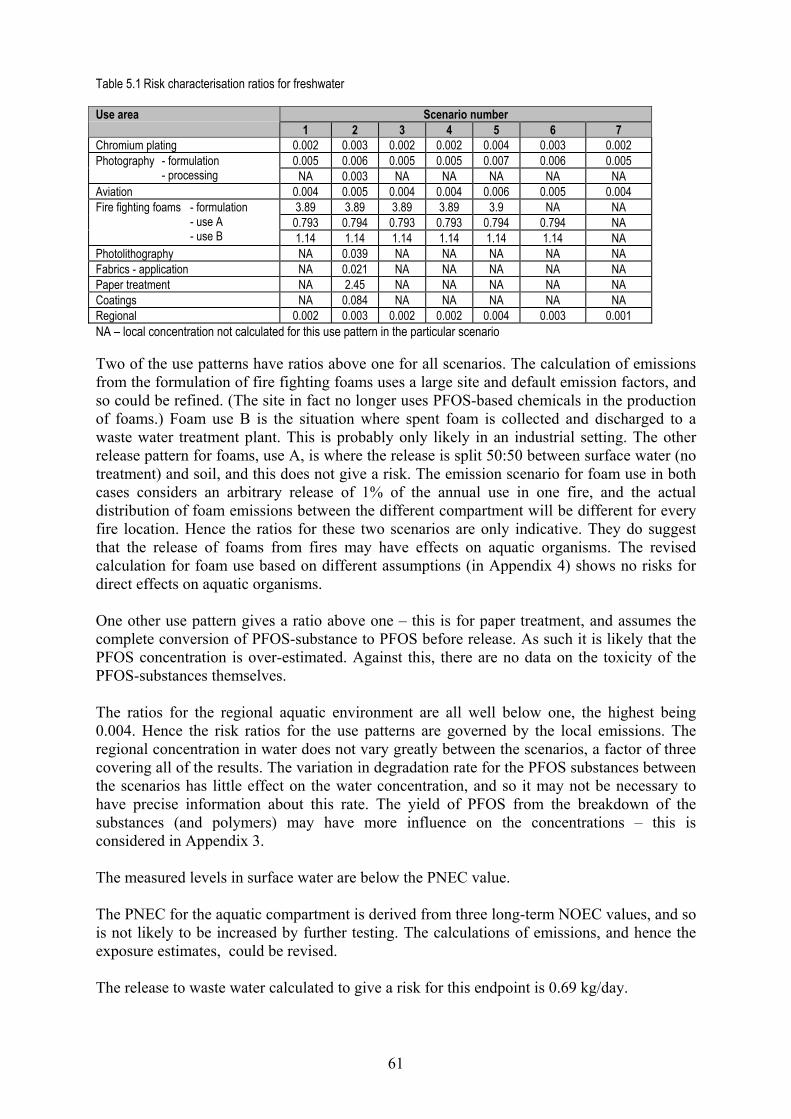
61
Table 5.1 Risk characterisation ratios for freshwater
Scenario numberUse area1 2 3 4 5 6 7
Chromium plating 0.002 0.003 0.002 0.002 0.004 0.003 0.0020.005 0.006 0.005 0.005 0.007 0.006 0.005Photography - formulation
- processing NA 0.003 NA NA NA NA NAAviation 0.004 0.005 0.004 0.004 0.006 0.005 0.004
3.89 3.89 3.89 3.89 3.9 NA NA0.793 0.794 0.793 0.793 0.794 0.794 NA
Fire fighting foams - formulation- use A- use B 1.14 1.14 1.14 1.14 1.14 1.14 NA
Photolithography NA 0.039 NA NA NA NA NAFabrics - application NA 0.021 NA NA NA NA NAPaper treatment NA 2.45 NA NA NA NA NACoatings NA 0.084 NA NA NA NA NARegional 0.002 0.003 0.002 0.002 0.004 0.003 0.001NA – local concentration not calculated for this use pattern in the particular scenario
Two of the use patterns have ratios above one for all scenarios. The calculation of emissionsfrom the formulation of fire fighting foams uses a large site and default emission factors, andso could be refined. (The site in fact no longer uses PFOS-based chemicals in the productionof foams.) Foam use B is the situation where spent foam is collected and discharged to awaste water treatment plant. This is probably only likely in an industrial setting. The otherrelease pattern for foams, use A, is where the release is split 50:50 between surface water (notreatment) and soil, and this does not give a risk. The emission scenario for foam use in bothcases considers an arbitrary release of 1% of the annual use in one fire, and the actualdistribution of foam emissions between the different compartment will be different for everyfire location. Hence the ratios for these two scenarios are only indicative. They do suggestthat the release of foams from fires may have effects on aquatic organisms. The revisedcalculation for foam use based on different assumptions (in Appendix 4) shows no risks fordirect effects on aquatic organisms.
One other use pattern gives a ratio above one – this is for paper treatment, and assumes thecomplete conversion of PFOS-substance to PFOS before release. As such it is likely that thePFOS concentration is over-estimated. Against this, there are no data on the toxicity of thePFOS-substances themselves.
The ratios for the regional aquatic environment are all well below one, the highest being0.004. Hence the risk ratios for the use patterns are governed by the local emissions. Theregional concentration in water does not vary greatly between the scenarios, a factor of threecovering all of the results. The variation in degradation rate for the PFOS substances betweenthe scenarios has little effect on the water concentration, and so it may not be necessary tohave precise information about this rate. The yield of PFOS from the breakdown of thesubstances (and polymers) may have more influence on the concentrations – this isconsidered in Appendix 3.
The measured levels in surface water are below the PNEC value.
The PNEC for the aquatic compartment is derived from three long-term NOEC values, and sois not likely to be increased by further testing. The calculations of emissions, and hence theexposure estimates, could be revised.
The release to waste water calculated to give a risk for this endpoint is 0.69 kg/day.

62
5.1.2 Wastewater treatment plant (WWTP) micro-organisms
The estimated effluent concentrations are included in Section 3.3.2.1, with the highest valuebeing 0.97 mg/l. The PNEC for micro-organisms is >9.05 mg/l (Section 4.1.4.3). Hence allratios are below one, and no risks are indicated.
5.2 TERRESTRIAL COMPARTMENT
The risk characterisation is based on the predicted environmental concentrations from Section3.3.3.1. The predicted no effect concentration (PNEC) is 25 µg/l, from Section 4.2.2.
Table 5.2 shows the risk characterisation ratios for the terrestrial compartment for the sevenscenarios and the various uses.
Table 5.2 Risk characterisation ratios for terrestrial compartment
Scenario numberUse area1 2 3 4 5 6 7
Chromium plating 0.022 0.022 0.035 0.037 0.036 0.025 0.0220.274 0.274 .0287 0.290 .0287 0.277 0.274Photography - formulation
- processing NA 0.001 NA NA NA NA NAAviation 0.181 0.181 0.195 0.196 0.195 0.184 0.182
326 326 326 326 326 326 326<0.001 <0.001 0.013 0.015 0.014 0.003 NA
Fire fighting foams - formulation- use A- use B 137 137 138 138 138 137 NA
Photolithography NA 3.03 NA NA NA NA NAFabrics - application NA 1.53 NA NA NA NA NAPaper treatment NA 205 NA NA NA NA NACoatings NA 5.1 NA NA NA NA NARegional 0.017 0.042 0.05 0.033 0.17 0.15 0.017NA – local concentration not calculated for this use pattern in the particular scenario
The risk characterisation ratios for soil follow a similar pattern to those for the aquaticcompartment. The formulation of fire-fighting foams gives ratios above one for all scenarios.As noted above, the emissions estimates use default emission factors and are based on a largesite which no longer uses PFOS-based substances. The foam use pattern B also indicates arisk. This use pattern has release via a waste water treatment plant, and sludge from the plantafter treatment of the foam is applied to soil. The calculation assumes that sludge is appliedonce a year, containing the same level of PFOS from the release. As the release is consideredto be intermittent, it is unlikely that the same waste water treatment plant will receive thesame foam release each year and the sludge be applied to the same soil. Hence this is notconsidered to be a realistic scenario. However, the soil concentration following a singleapplication of sludge for this scenario would be enough to give a risk characterisation ratio of36.
Risks are also indicated for the use areas of photolithography, fabrics, paper treatment andcoatings in Scenario 2. In this scenario, instant transformation of PFOS-substance to PFOS isassumed. In addition, default emission factors are used for some of these areas (mainly papertreatment), so the emission estimates for these use patterns could be revised.
The highest ratio for the regional environment is 0.17, so there are no risks at this scale. Notethat the concentrations used for this risk characterisation are the regional concentrations inagricultural soil, not the natural soil values included in Section 3.3.3.1. The regional soilconcentrations are affected much more by the differences between the scenarios, the naturalsoil concentrations varying over two orders of magnitude. The risk characterisation ratios

63
show the influence of the release from polymers, with the two highest ratios being those forScenarios 5 and 6 which include the polymer emissions.
The PNEC for the terrestrial compartment is derived from one long-term toxicity test resultand so could be refined. As noted above the emission estimates could also be revised.
The calculated emission to waste water which would give rise to a risk for the terrestrialcompartment is 7.4 g/day. This is for applications of sludge over 10 years, the emissionwhich would give rise to a risk following a single application is 0.67 kg/day.
5.3 ATMOSPHERIC COMPARTMENT
No data on effects on organisms from exposure through the air were located. The estimatedconcentrations are very low, so PFOS is not expected to contribute significantly to abioticeffects in the atmosphere. No assessment is carried out.
5.4 NON-COMPARTMENT SPECIFIC EFFECTS RELEVANT TOTHE FOOD CHAIN (SECONDARY POISONING)
5.4.1 Freshwater food chain
The concentrations for exposure through the freshwater food chain are in Section 3.3.5.1. ThePNEC for secondary poisoning is 0.0167 mg/kg wwt in food, from Section 4.4.3.
The risk characterisation ratios for the aquatic food chain are presented in Table 5.3.
Table 5.3 Risk characterisation ratios for freshwater food chain exposure
Scenario numberUse area1 2 3 4 5 6 7
Chromium plating 13 25.7 16.1 15.1 29.6 26.8 12.524.3 36.3 27.4 26.4 40.8 38.1 23.7Photography - formulation
- processing NA 25 NA NA NA NA NAAviation 21.7 32.4 24.8 23.8 38.3 35.5 21.2
13400 13400 13400 13400 13400 NA NA26.1 38.1 29.2 28.2 42.7 39.9 NA
Fire fighting foams - formulation- use A- use B 31.9 43.9 35 34 48.4 45.7 NA
Photolithography NA 174 NA NA NA NA NAFabrics - application NA 72.3 NA NA NA NA NAPaper treatment NA 8470 NA NA NA NA NACoatings NA 235 NA NA NA NA NARegional 12.8 24.6 15.9 14.9 29.1 26.3 12.2NA – local concentration not calculated for this use pattern in the particular scenario
For the freshwater food chain all of the use areas indicate a risk for all of the scenarios forwhich they are relevant. Consumption of prey exposed only to the regional backgroundconcentrations is also indicated as a risk for all scenarios. As noted above the regional waterconcentrations are only affected a little by the different release patterns in the scenarios.However, in most cases the specific uses also make a significant contribution to the exposurethrough this route, similar to or greater than that from the regional concentration. Theexceptions to this are chromium plating and the processing life stage for photography.
None of the emission estimates are based on specific information about the releases of PFOSfrom the specific industry area. Hence they could all be refined. Considering only the

64
possible continuing uses (those included in Scenario 7), for chrome plating the localcalculation is based on a scenario for the industry, but the overall emissions assume completerelease of the amount used each year in the absence of information on its fate. Assumptionshave been made on the nature of the substances released in the production of film and itsdeveloping. Data on the releases from photolithography come from the industry, but theremay be more specific treatment of waste waters than assumed here. The aviation emissionsare based on an emission scenario for hydraulic fluids, but do not relate specifically to theaviation industry.
The PNEC value is based on the results of a 2-year study with rats, so it is unlikely that thePNEC would be changed significantly in the light of further tests. An alternative PNEC of0.067 mg/kg was also derived in Section 4.4.3. If this PNEC were used, all of the ratioswould still be above one.
A comparison of the PNEC value with measured concentrations for freshwater fish showsthat the highest measured concentrations reported exceed the PNEC of 0.0167 mg/kg. Anumber of values also exceed the alternative PNEC value of 0.067 mg/kg. It should be notedthat this comparison is based on the highest values. In some cases these relate to specifictissues rather than whole body levels. Also, from the global archive sample analysis, PFOSwas only detected in 38% of the samples. Nevertheless, measurements such as those in theScheldt Estuary may indicate the presence of PFOS in aquatic biota at levels expected to haveeffects.
The emissions to waste water giving rise to a risk for this food chain are estimated to be 83 –166 mg/day. Assuming a similar pattern of releases to air, water and soil, the regionalemissions would need to be reduced by a factor of over twelve times (for the alternativePNEC, by three times) to remove the risk at the regional level.
5.4.2 Terrestrial food chain
The concentrations for exposure through the terrestrial food chain are in Section 3.3.5.1. ThePNEC for secondary poisoning is 0.0167 mg/kg wwt in food, from Section 4.4.3.
The risk characterisation ratios for the terrestrial food chain are presented in Table 5.4.
Table 5.4 Risk characterisation ratios for exposure through the terrestrial food chain
Scenario numberUse area1 2 3 4 5 6 7
Chromium plating 0.117 0.168 0.228 0.204 0.599 0.493 0.1190.816 0.867 0.927 0.903 1.3 1.19 0.818Photography - formulation
- processing NA 0.11 NA NA NA NA NAAviation 0.558 0.609 0.67 0.646 1.04 0.934 0.561Fire fighting foams - formulation 9.03 9.03 9.03 9.03 9.04 NA NA
- use A 0.056 0.108 0.168 0.144 0.539 0.433 NA- use B 381 381 382 381 382 382 NA
Photolithography NA 8.47 NA NA NA NA NAFabrics - application NA 4.36 NA NA NA NA NAPaper treatment NA 569 NA NA NA NA NACoatings NA 14.3 NA NA NA NA NARegional 0.11 0.21 0.26 0.20 0.99 0.84 0.12NA – local concentration not calculated for this use pattern in the particular scenario
Most use patterns indicate a risk in one or more of the scenarios for the terrestrial food chain.Exceptions are chromium plating, and the fire fighting foams use pattern Use A. No risks

65
through regional exposure are indicated, although one scenario has a ratio just below one.This is the scenario involving the greatest uncertainty, as it includes releases from thebreakdown of polymeric material, about which there is no specific information. The scenarioassumes eventual breakdown of polymer to PFOS in the environment, which is a worst caseassumption; it is therefore considered unlikely that this scenario will actually lead to a risk.The comments on these uses in the section above on the freshwater food chain are relevanthere, as the route to the terrestrial environment is through sludge application and hencedepends on the emissions to water treatment. As above, the PNEC is unlikely to be changedby new tests. Using the alternative PNEC value of 0.067 mg/kg, photography and aviationwould not show a risk.
The emissions to waste water giving rise to a risk for the terrestrial food chain are estimatedto be 1.65 – 3.30 g/day. These are for 10 years of application; the emissions giving a riskfrom a single application of sludge are estimated to be 15 – 30 g/day.
5.5 MARINE ENVIRONMENT
5.5.1 PBT assessment
The PBT assessment included here relates to PFOS itself, and uses data from tests on PFOSsalts. It does not apply directly to PFOS-substances. However, the potential for the substancesto degrade to PFOS in the environment makes this assessment relevant to the generalconsideration of the group of substances.
5.5.1.1 Persistence
PFOS (as the potassium salt) has been tested for biodegradability in a series of testscommissioned by 3M and reported in the risk assessment of PFOS (3M, 2003). The followingtests were conducted:
• activated sludge; • acclimated activated sludge (including added soil and sediment materials) in both
aerobic and closed vial exposures;• aerobic soil and sediment cultures;• anaerobic sludge from sludge digester; and• pure microbial cultures.
None of these studies showed any evidence for the biodegradation of PFOS. 3M also reportedthe results of standard studies on hydrolysis (at 50°C and a range of pHs) and photolysis.Neither study showed any evidence for degradation of PFOS. The OECD hazard assessment(OECD, 2002) includes the results of a MITI-I study (ready biodegradability) which showedno evidence for ultimate or primary degradation (removal of the parent compound). Theconclusion is that PFOS meets the screening criteria for P (Persistent) or vP9 (very Persistent)criteria.
5.5.1.2 Bioaccumulation
There are a limited number of studies available on bioaccumulation of PFOS. A flow-throughstudy on bluegill sunfish (Lepomis macrochirus) is cited in both 3M and the OECD
9 Classification as a vP is on the basis that no degradation has been observed in any study to date, whichmakes it likely that the substance would meet this criterion.

66
assessment. The bioconcentration factors for edible tissues, non-edible tissues and whole fishwere calculated from the rates of uptake and depuration because steady state had not beenreached after 56 days of exposure.10 The values obtained were 1124 (edible), 4103 (non-edible) and 2796 (whole fish). The exposure concentration was 0.086 mg/l.
A flow-through study on carp (Cyprinus carpio) resulted in lower values of 720 at 20 µg/lexposure and 200-1500 at 2 µg/l exposure. Higher values of 6,300 - 125,000 have beenreported (for bioaccumulation factors) for in situ measurements at the scene of a spill of firefighting foam, but these were considered to be due to the uptake of derivatives which werethen metabolised to PFOS, hence the values were over-estimated.
In summary, BCF values up to 2800 have been measured in laboratory studies, and this meetsthe B or ‘Bioacumulative’ criterion.
The occurrence in a range of biota supports this; PFOS has been found in a wide range ofhigher organisms in Europe, including seals, dolphins, whales, cormorants, eagles, swordfish,tuna and salmon. The Global Biophase Monitoring Programme found PFOS in livers, bloodand other tissues of animals, especially in fish-eating animals.
5.5.1.3 Toxicity
According to the assessment criteria laid out in the EU TGD, toxicity criteria is based oneither aquatic toxicity or on classification.
The lowest aquatic NOEC value (from the OECD and 3M reports) is 0.25 mg/l, which isabove the criterion level of 0.01 mg/l for the T criterion. On this basis, PFOS does not meetthe T criterion. The NOAEC from chronic bird studies is 10 ppm for most endpoints, which isbelow the criterion value of <30 mg/kg in food. The level of 10 ppm was also considered aLOAEC for some effects in the same studies. Hence PFOS meets the T criterion on this basis.
PFOS is not listed as a substance on EINECS and has no classification. The acid form ofPFOS is not classified on Annex I of Directive 67/548/EEC, and neither are any of the usualsalts (potassium, ammonium, lithium). The mammalian toxicity data included in the OECDand 3M assessments has thus been used to consider what classification would be appropriatefor PFOS.
Various toxicity studies have been conducted (as highlighted in earlier sections) to determinethe toxicity of PFOS related substances, with the tests conducted in:
• a 90-day repeat dose toxicity study on rats showing that all rats died when fed ondiets containing 300ppm PFOS and above (equivalent to 18 mg/kg bw/day andabove). Some deaths (5 out of 10 animals) were also noted in rats fed diets containing100 ppm PFOS (6 mg/kg bw/day)11. All rats receiving diets containing 30 ppm PFOS
10 The robust summary in the OECD hazard assessment has different values to those used in the mainOECD text (which are those cited here). The 3M (2003) report explains that the original study used aninappropriate method to estimate the kinetic BCF values, and that those were revised in a later amended studyreport. This is assumed to explain the different values in the OECD robust summary, as the BCF values in themain report and the 3M report agree. 11 The criteria for the classification of a substance as ‘Toxic’ with a risk phrase R48 are based onobservations of serious damage to health at concentrations ≤5.0 mg/kg bw/day in a 90-day study, while the

67
(2.0 mg/kg/day) survived until the end of the study, but small changes in body andorgan weights were reported. The effects seen in rats receiving 6.0 mg/kg/day suggestthat PFOS fulfils the criteria for classification as Toxic, with the risk phrase R48, andhence meets the PBT criteria for T;
• a two year carcinogenicity study showing significant increases in hepatocellularadenomas observed in both male and female rats at 1 mg/kg bw/day. In view of thelack of effects in a number of genotoxicity test systems, the 3M report concluded thatthe carcinogenic effect was due to a threshold mediated non-genotoxic mechanism.This test could result in a Category 3 classification for carcinogenicity or could evenprovide insufficient evidence to warrant classification as a carcinogen, and thus maynot fulfill the PBT criteria for T;
• a two generation rat study with PFOS showing significant reductions in the viabilityof pups in the F1 generation at exposure levels of 1.6 and 3.2 mg/kg bw/day. Asubsequent study determined a NOAEL for pup mortality and growth of1.2 mg/kg bw/day. No effects on mortality were observed over the whole study at0.4 mg/kg bw/day. This may not fulfill the criteria for classification as “Toxic forReproduction”, and hence not meet the T criterion for PBT. The view of Sweden intheir comments on the draft RER is that the data fulfill the criteria for reproductivetoxicity as category 3, and possibly also for category 2. Comments from theNorwegian Institute of Public Health also support classification as a reproductivetoxicant category 3;
• developmental and reproductive toxicity studies on rabbits showing effects on thedevelopment of the foetus at doses of 5 and 10 mg/kg bw/day. These are largelymaturational delays and reduced foetal body weight. A NOAEL of 1 mg/kg bw/dayhas been determined for most of these effects in rats. Signs of maternal toxicity arealso observed at similar levels, and in some cases the NOAEL for maternal effects islower than that for developmental effects. The 3M RAR concluded that there was noindication of specific teratogenic effects. These may not meet the requirements forclassification as “Toxic for Reproduction” and hence not meet the T criterion forPBT; and
• tests on rhesus monkeys showing that all animals died at 10 mg/kg bw/day, the lowestdose tested, with a follow up study showing deaths at 4.5 mg/kg bw/day. There wereno deaths at 1.5 mg/kg bw/day, but there were signs of gastrointestinal toxicity. Theresults of this test show that PFOS fulfils the criteria for classification as Toxic, withthe risk phrase R48, and hence meets the T criterion for PBT.
PFOS has been shown to cause death in both rats and monkeys at doses of 6.0 and4.5 mg/kg/day respectively in repeat-dose 90-day toxicity studies, although significant signsof toxicity were not seen in groups of rats or monkeys receiving lower doses of PFOS.Despite this apparent steep dose-response relationship in its toxicity, the severity of theeffects seen at doses around 5.0 mg/kg/day warrant classification as “Toxic” and assigned theRisk Phrase R48.
It is therefore concluded that PFOS should be classified as ‘Toxic’ and carry the Risk PhraseR48. There is also support for classification as toxic for reproduction, category 3. It therefore
classification of a substance as ‘Harmful’ with a risk phrase R48 is based on observations of serious damage tohealth at concentrations of the order of ≤50 mg/kg bw/day in a 90-day study.

68
meets the T or ‘Toxicity’ criterion on this basis , as well as on the basis of the bird feedingstudies.
5.5.1.4 PBT conclusion
PFOS meets the vP, B and T criteria and hence is considered as a PBT substance. It should benoted that this conclusion does not apply directly to PFOS-substances, but the potential forthe substances to be degraded to PFOS means that it is of relevance in the consideration ofthe substances.
5.5.2 Marine risk evaluation
As PFOS meets the PBT criteria, there is strictly no requirement for a risk evaluation.However the relevant results are generated as part of the modelling and so are included here.
5.5.2.1 Marine water
The concentrations of PFOS in marine waters have been calculated as part of the modellingdescribed in Section 3. The values are presented in Table 5.5.
The risk characterisation ratios for the marine aquatic compartment are presented in Table5.6. The PNEC is 2.5µg/l. As for freshwater, the exposure and effect concentrations arederived from the aquatic values by equilibrium partitioning, and so the ratios are the same asthose for the aquatic compartment.
Table 5.5 Predicted environmental concentrations in marine water
Scenario numberUse area1 2 3 4 5 6 7
Chromium plating 4.76x10⁻⁶ 8.33x10⁻⁶ 5.67x10⁻⁶ 5.39x10⁻⁶ 9.56x10⁻⁶ 8.75x10⁻⁶ 4.6x10⁻⁶
1.52x10⁻⁵ 1.88x10⁻⁵ 1.61x10⁻⁵ 1.58x10⁻⁵ 2.0x10⁻⁵ 1.92x10⁻⁵ 1.51x10⁻⁵Photography - formulation- processing NA 7.47x10⁻⁶ NA NA NA NA NA
Aviation 1.14x10⁻⁵ 1.49x10⁻⁵ 1.23x10⁻⁵ 1.2x10⁻⁵ 1.62x10⁻⁵ 1.53x10⁻⁵ 1.12x10⁻⁵
0.0135 0.0135 0.0135 0.135 0.135 NA NA2.85x10-3 2.86x10⁻³ 2.85x10⁻³ 2.85x10⁻³ 2.86x10⁻³ 2.86x10⁻³ NA
Fire fighting foams - formulation- Use A- Use B 5.7x10⁻³ 5.71x10⁻³ 5.7x10⁻³ 5.7x10⁻³ 5.71x10⁻³ 5.71x10⁻³ NA
Photolithography NA 1.32x10⁻⁴ NA NA NA NA NAFabrics - application NA 7.09x10⁻⁵ NA NA NA NA NAPaper treatment NA 8.51x10⁻³ NA NA NA NA NACoatings NA 2.19x10⁻⁴ NA NA NA NA NARegional 3.86x10⁻⁶ 7.43x10⁻⁶ 4.77x10⁻⁶ 4.51x10⁻⁶ 8.68x10⁻⁶ 7.87x10⁻⁶ 3.71x10⁻⁶
NA – local concentration not calculated for this use pattern in the particular scenario
The pattern of the risk characterisation ratios for the marine aquatic compartment is similar tothat for freshwater (Section 5.1.1) and the same comments and conclusions apply. In additionto the freshwater areas indicting risks, the other use of foam (Use A) also shows a risk for themarine compartment. This use is also discussed in Section 5.1.1. The scenarios for the use offoams could be considered to be relevant for the offshore use of foams in the first instance.
The emission to waste water calculated to give rise to a risk for the marine aquaticcompartment is 0.5 kg/day.

69
Table 5.6 Risk characterisation ratios for the marine aquatic compartment
Scenario numberUse area1 2 3 4 5 6 7
Chromium plating 0.002 0.003 0.002 0.002 0.004 0.004 0.0020.006 0.008 0.006 0.006 0.008 0.008 0.006Photography - formulation
- processing NA 0.003 NA NA NA NA NAAviation 0.005 0.006 0.005 0.005 0.006 0.006 0.004
5.4 5.4 5.4 5.4 5.4 NA NA1.14 1.14 1.14 1.14 1.14 1.14 NA
Fire fighting foams - formulation- Use A- Use B 2.28 2.28 2.28 2.28 2.28 2.28 NA
Photolithography NA 0.053 NA NA NA NA NAFabrics - application NA 0.028 NA NA NA NA NAPaper treatment NA 3.4 NA NA NA NA NACoatings NA 0.088 NA NA NA NA NARegional 0.002 0.003 0.002 0.002 0.004 0.003 0.002NA – local concentration not calculated for this use pattern in the particular scenario
5.5.2.2 Secondary poisoning in the marine environment
There are two calculations for secondary poisoning in the marine environment, to include twolevels of predator. These are a fish-eating bird or mammal, similar to that in the freshwaterenvironment, and a top predator. The concentrations in the food organisms for theseendpoints were included in Section 3.3.5.1. The risk characterisation ratios for these two arepresented in Tables 5.7 and 5.8.
Table 5.7 Risk characterisation ratios for fish-eating bird or mammal (marine)
Scenario numberUse area1 2 3 4 5 6 7
Chromium plating 1.3 2.59 1.6 1.51 2.91 2.63 1.242.86 4.06 3.17 3.07 4.47 4.2 2.81Photography - formulation
- processing NA 2.5 NA NA NA NA NAAviation 2.5 3.53 2.81 2.71 4.11 3.84 2.45
1860 1860 1860 1860 1860 NA NA2.61 3.8 2.91 2.82 4.21 3.94 NA
Fire fighting foams - formulation- Use A- Use B 3.92 5.11 4.22 4.13 5.52 5.25 NA
Photolithography NA 23.2 NA NA NA NA NAFabrics - application NA 9.08 NA NA NA NA NAPaper treatment NA 1170 NA NA NA NA NACoatings NA 31.7 NA NA NA NA NARegional 1.26 2.46 1.56 1.50 2.87 2.57 1.20NA – local concentration not calculated for this use pattern in the particular scenario

70
Table 5.8 Risk characterisation ratios for marine top predator
Scenario numberUse area1 2 3 4 5 6 7
Chromium plating 2.59 5.03 3.2 3.01 5.81 5.27 2.483.22 5.61 3.83 3.64 6.44 5.89 3.11Photography - formulation
- processing NA 4.99 NA NA NA NA NAAviation 3.08 5.4 3.68 3.5 6.29 5.75 2.97
747 749 748 747 750 NA NA3.12 5.51 3.72 3.54 6.33 5.79 NA
Fire fighting foams - formulation- Use A- Use B 3.64 6.03 4.25 4.06 6.86 6.31 NA
Photolithography NA 13.3 NA NA NA NA NAFabrics - application NA 7.61 NA NA NA NA NAPaper treatment NA 474 NA NA NA NA NACoatings NA 16.6 NA NA NA NA NARegional 2.57 4.91 3.11 2.99 5.75 5.15 2.46NA – local concentration not calculated for this use pattern in the particular scenario
The ratios for the marine food chain exposures are lower than those from the freshwater foodchain, but are all above one. Risks are also indicated at the regional level for all scenarios.The same comments as for the freshwater food chain (Section 5.4) are relevant here. Usingthe alternative PNEC, most of the use areas would have a ratio above one for at least one ofthe scenarios, although there would be no ratios above one for the marine food chains forScenario 7.
The emissions to waste water estimated to give rise to a risk for these endpoints are 0.6 –1.2 g/d for the fish-eating predator, and 0.3 – 3.0 g/day for the marine predator.
5.6 UNCERTAINTIES
It is to be expected in a risk evaluation that there will be some areas of uncertainty due to alack of sufficiently detailed information in some areas. In the case of PFOS, the nature of thesubstance and the use of a large number of derivatives or related substances add further to theusual types of uncertainty. These areas have been indicated in the evaluation as they havearisen, but are discussed again here, with in some cases additional consideration of the effectof the uncertainty on the outcome of the evaluation.
5.6.1 PFOS-salt properties
The unusual properties of PFOS mean that the usual approach of estimating a number ofproperties from the log Kow value cannot be taken here. To circumvent this, the values forproperties such as soil-water partition have been taken as far as possible from directmeasurements. It is recognised that these properties are likely to depend to some extent on thecharacteristics of the environment. There is no information on this dependence, and thereforeno calculations have been carried out to examine this variation. As the values used come frommeasurements on particular soils, sediment or sludge then they can be considered to relate atleast to these materials. The standard approach assumes a fixed composition for thesematerials, and so in that sense the current approach is not very different.
The effect of considering the range of solubility values determined for PFOS salts, and theuncertainty in the air-water partition coefficient, have been considered in Appendix 8. Thesechanges have no impact on the levels or distribution calculated in the model.

71
For one specific use area, hydraulic fluids in aircraft, the substance used is not PFOS but arelated substance. This evaluation has assumed that the properties of this substance aresimilar to those of PFOS, which is a further area of uncertainty with regard to this use.
5.6.2 PFOS releases
These comments relate to the releases of PFOS-substance as well as PFOS-salt. The emissionestimates made in the risk evaluation are based on the most specific information available.There are no specific measurements of the releases of PFOS at specific locations and relatingto particular processes. Information on the amounts used in each area is available, and insome cases there are estimates of the total amounts released on an EU basis. Where possible,information has been taken from emission scenarios related to the particular use area,although it is not possible in all cases to find information related to the specific use of thePFOS-related substance. There is only one area in which the Technical Guidance Documentdefault values have been used, and that is for fire-fighting foams. Here the formulation step isbased on defaults. The nature of the use of such foams means that complete release to theenvironment is possible. Alternative estimates for the amount used at a single incident havebeen made in Appendix 4. For other areas, it is recognised that better information could allowthe assessment of emission (and hence the calculation of environmental concentrations) to berefined. No extra calculations have been performed in the absence of more specificinformation, with the exception of photolithography, where the cessation of use for a specificpurpose has been considered (Appendix 3).
5.6.3 PFOS-substance properties
The property values used in the evaluation are those for N-EtFOSE. There are a large numberof substances which come under this grouping, and clearly some will have properties whichdiffer from those of the chosen substance. However, it is felt that having selected onesubstance to represent the group it is better to use data only for this substance rather than varythe values to try to cover the possible range within the group. There is one exception to this,which is the degradation of the substances, and this is considered below.
5.6.4 PFOS-substance degradation
This is one of the key areas of uncertainty in the evaluation. Information on the breakdown ofPFOS-substances was discussed in Sections 3.2.2.2.1 and 3.3.1.1.2. The data available arelimited, but they do appear to show that N-EtFOSE can be broken down by aerobicbiodegradation in a series of steps, the eventual products from which appear to be PFOS andPFOA. At least one estimate of the yield of PFOS from this process has been presented in theliterature, but both the yields and the rates of the steps are uncertain.
The main calculations in the evaluation include scenarios in which the PFOS-substances aredegraded to PFOS on or before release, and scenarios where the half life for degradation toPFOS is 20.5 days or 1 year. Comments from the consultation argued that the overall ratemay be much longer than this. Appendix 5 considers a longer half life of 10 years as well asthe two shorter half lives. These calculations show a reduction in the amount degraded in theregion at steady state as the half lives in water and soil increase. It should be noted that mostof the PFOS-substance released in the model is removed from the regional model and thecontinental mode by water flow and air movement before it can be degraded. This has thepotential to degrade in more remote areas, and so contribute to the overall global burden. Thelonger the half lives used for the regional model, the greater the proportion of releases whichare moved to more remote areas. It should also be borne in mind that the biodegradation half

72
lives used here are for the overall process, from PFOS-substance to PFOS. There will beintermediate products along this process, some of which may have significant lifetimes in theenvironment. As such they may behave differently to the example PFOS-substance used inthe calculations. There is at present no way to address this aspect.
The second aspect is the degree to which the degradation of PFOS-substances leads to PFOSitself. The effect of a lower yield of PFOS from this degradation is investigated in Appendix3, using the scenario for photolithography in isolation. Where the assumptions relate to thefraction of PFOS-substance released as PFOS from waste water treatment, the effect onconcentration is essentially linear. Hence the assumption of a 20% yield leads to localconcentrations which are 20% of those when complete conversion to PFOS is assumed.
The calculations on the behaviour of PFOS-substance show that degradation in air is alsoimportant in terms of the production of PFOS from PFOS-substance. The value for the halflife of this process is calculated from the structure of the PFOS-substance, and strictly relatesto the initial reaction of the substance with hydroxyl radicals, rather than the formation ofPFOS. There is no real information on the products of the reactions of PFOS-substances inair. Appendix 5 considers the effect of a longer overall lifetime for degradation in air, butwith the process leading to PFOS. The calculations are performed on the emissions estimatedfor Scenario 7. The appendix also includes the situation where the degradation does not leadto PFOS.
The effect of a longer half life is a reduced contribution to the overall production of PFOSfrom the air compartment. The concentration of PFOS calculated for a scenario will also bereduced where the degradation in air made a significant contribution to the inputs of PFOS.For the Scenario 7 emissions (considering the PFOS-substance emissions only), the regionalconcentration in surface water is reduced by ~4 times when the half life in air is increased bytwo orders of magnitude. The same effect would be seen if only a proportion of thedegradation of PFOS-substance in air lead to PFOS.
The key areas which affect the predicted concentrations appear to be: the degree to whichPFOS-salt is produced from PFOS-substances in waste water treatment, and to a lesser extentthe degree to which this occurs in the environment; and the production of PFOS-salts fromPFOS-substances through degradation in air, and the rate of this process. Nevertheless, evenwhen a number of less conservative assumptions are made, risks are still indicated from thereleases of very low concentrations of PFOS-substances.
5.7 SUMMARY OF CONCLUSIONS
The major area of concern is for secondary poisoning, in particular for water. All of the usepatterns considered in the evaluation lead to a risk for secondary poisoning in the relevantscenarios, for the freshwater, marine predator and marine top predator endpoints. This is trueof the uses releasing only small amounts overall, such as photography and aviation, as well asfor the uses with larger emissions. Calculations for each of the uses considered to becontinuing, carried out individually and not shown in this evaluation, indicate that four(chromium plating, photography (formulation), aviation and photolithography) could lead toa risk based on the assumptions made in this evaluation (and assuming instant conversion ofPFOS-substance to PFOS where relevant). The only use pattern not leading to a risk is theuse in photography (developing). Risks are indicated at the regional level for secondarypoisoning through the freshwater and marine food chains for all scenarios considered. Somemeasured values in aquatic biota are above the PNEC for secondary poisoning. For

73
freshwater, the regional emissions would need to be reduced to less than one twelfth of theestimated values in order to remove the risk at the regional level (assuming a similardistribution of emissions). In the case of the alternative PNEC, the reduction would need tobe by over two-thirds.
The PNEC value for secondary is derived from a two-year feeding study, and is not likely tobe changed by further tests. The alternative PNEC also comes from long term testing. Thebioconcentration factor for fish comes from valid measurements, and PFOS has beenmeasured in fish. The biomagnification factor used in the calculations, a value of two, is thedefault value from the Technical Guidance Document, and so could be revised throughmeasurement, but reducing this to a factor of one would not remove the concerns in mostcases. The main scope for revising the evaluation would appear to be through better estimatesof emissions.
There are also indications of risk for the aquatic and terrestrial compartments for directeffects on organisms. These relate mostly to the fire-fighting foams, where releases on usemay be sufficient to cause concern. These calculations are very dependent on the assumptionsabout how much foam is used at an individual fire. The calculation for the formulation of thefoams also shows a risk, but the exposure estimate is based on defaults and on a site which nolonger uses PFOS-related substances.
N.B. No assessment of risk to humans has been carried out.
74
6 REFERENCES
3M (1999). Reports “The Science of Organic Fluorochemistry” and “PerfluorooctaneSulfonate: Current Summary of Human Sera, Health and Toxicology Data”, dated February 51999. Cited in OECD (2002).
3M (2000). Sulfonated perfluorochemicals in the environment: sources, dispersion, fate andeffects (AR226-0545). 3M Company, St Paul, MN. (In OECD 2002).
3M (2001) 3M Fluorochemical EPA Submissions. CD No. 4, created 28 June 2001.
3M (2003) Environmental and Health Assessment of Perfluorooctane Sulfonic Acid and itsSalts. Prepared by 3M Company, with J Moore (Hollyhouse Inc.), J Rodericks and DTurnbull (Environ Corp.) and W Warren-Hicks and Colleagues (The Cadmus Group, Inc.).August 2003.
3M (2004) 3M Fluorochemical EPA Submissions. CD No. 6, created 24 June 2004.
Austin, ME, Kasturi, SB, Barber, M, Kannan, K, MohanKumar, PS and MohanKumar, SMJ(2003). Neuroendocrine effects of perfluorooctane sulfonate in rats. Environ. Health Persp.,111 (12), 1485-1489.
Boudreau, TM, Sibley, PK, Mabury, SA, Muir, DCG and Solomon, KR (2003a). Laboratoryevaluation of the toxicity of perfluorooctane sulfonate (PFOS) on Selenastrumcapricornutum, Chlorella vulgaris, Lemna gibba, Daphnia magna and Daphnia pulicaria.Arch. Environ. Contam. Toxicol., 44, 307-313.
Boudreau, TM, Wilson, CJ, Cheong, WJ, Sibley, PK, Mabury, SA, Muir, DCG and Solomon,KR (2003b). Response of the zooplankton community and environmental fate ofperfluorooctane sulfonic acid in aquatic microcosms. Environ. Toxicol. Chem., 22 (11),2739-2745.
Cahill, TM and Mackay, D (2002). Development of a multiple chemical speciesenvironmental fate model and its application to pentachlorophenol and perfluorooctanesulfonate. Pre-prints of extended abstracts, American Chemical Society, Division ofEnvironmental Chemistry, 42 (2), 5-81.
EC (2002). European Union Risk Assessment Report, Bis(pentabromodiphenyl) ether.European Commission, Joint Research Centre, EUR 20402 EN.
Environment Agency (1997). Use Category Document – Metal Finishing. L Brown, R Readand P Quarterman. Prepared for Chemicals Assessment Unit, National Centre forEcotoxicology and Hazardous Substances, Environment Agency.
Environment Agency (1997a). Use Category Document – Lubricants and LubricantAdditives. D J Margaroni, C W Lea, D J Neadle and M Gavin. Prepared for ChemicalsAssessment Unit, National Centre for Ecotoxicology and Hazardous Substances,Environment Agency.
Environment Agency (2001). Review of Occurrence and Hazards of PerfluoroalkylatedSubstances in the UK. National Centre for Ecotoxicology and Hazardous Substances,Environment Agency.

75
Giesy, JP and Kannan, K (2001a). Accumulation of perfluorooctanesulfonate and relatedfluorochemicals in marine mammals. Prepared for 3M, St Paul, MN. In US EPAAdministrative Record AR226-1030A. (In OECD 2002).
Giesy, JP and Kannan, K (2001b). Perfluorooctanesulfonate and related fluorochemicals infish-eating water birds. Prepared for 3M, St Paul, MN. In US EPA Administrative RecordAR226-1030A. (In OECD 2002).
Giesy, JP and Kannan, K (2001c). Accumulation of perfluorooctanesulfonate and relatedfluorochemicals in fish tissues. Prepared for 3M, St Paul, MN. In US EPA AdministrativeRecord AR226-1030A. (In OECD 2002).
Giesy, JP and Kannan, K (2001d). Accumulation of perfluorooctanesulfonate and relatedfluorochemicals in mink and river otters. Prepared for 3M, St Paul, MN. In US EPAAdministrative Record AR226-1030A. (In OECD 2002).
Giesy, JP and Kannan, K (2001e). Perfluorooctanesulfonate and related fluorochemicals inoyster, Crassostrea virginica, from the Gulf of Mexico and Chesapeake Bay. Prepared for3M, St Paul, MN. In US EPA Administrative Record AR226-1030A. (In OECD 2002).
Hansen, KJ, Johnson, HO, Eldridge, JS, Butenhoff, JL and Dick, LA (2002). Quantitativecharacterisation of trace levls of PFOS and PFOA in the Tennessee River. Environ. Sci.Technol., 36, 1681-1685.
Hoff, PT, Van de Vijver, K, Van Dongen, W, Esmans, EL, Blust, R and De Coen, WM(2003). Perfluorooctane sulfonic acid in bib (Trisopterus luscus) and plaice (Pleuronectesplatessa) from the Western Scheldt and the Belgian North Sea: distribution and biochemicaleffects. Environ. Toxicol. Chem., 22 (3), 608-614.
Hoff, PT, Van Dongen, W, Esmans, EL, Blust, R and De Coen, WM (2003). Evaluation ofthe toxicological effects of perfluorooctane sulfonic acid in the common carp (Cyprinuscarpio). Aquatic Toxicol., 62, 349-359.
Hohenblum, P, Scharf, S and Sitka, A (2003). Perfluorinated anionic surfactants in Austrianindustrial effluents. Vom Wasser, 101, 155-164.
Kannan, K and Giesy, JP (2002). Global distribution and bioaccumulation of perfluorinatedhydrocarbons. Organohalogen Compounds, 59, 267-270.
Jamberg, U. and Holmstrom, K. (2003). Perfluorooctane sulphonate concentrations inSwedish urban and background fish samples (WEP/18). Paper presented at Society forEnvironmental Toxicology and Chemistry Europe 13th Annual Meeting, 27 April – 1 May2003, Hamburg.
Johnson, JD, Gibson, SJ and Ober, RF (1979a). Absorption of FC-95-14C in rats after asingle oral dose. Riker Laboratories Inc., subsidiary of 3M, St Paul, MN. Project No.890310200. (In OECD 2002).
Johnson, JD, Gibson, SJ and Ober, RF (1979b). Extent and route of excretion and tissuedistribution of total carbon-14 in rats after a single intravenous dose of FC-95-14C. RikerLaboratories Inc., subsidiary of 3M, St Paul, MN. (In OECD 2002).

76
Kirk-Othmer (1996). Encyclopedia of Chemical Technology, Fourth Edition, Volume 18.Wiled Interscience.
Kurume Laboratory (2002). Final report, biodegradation test of salt (Na, K, Li) ofperfluoroalkyl (C=4-12) sulphonic acid, test substance number K-1520 (test number 21520).Kurume Laboratory, Chemicals Evaluation and Research Institute, Japan. (In OECD 2002).
Martin, JW, Mabury, SA, Solomon, KR and Muir, DCG (2003). Dietary accumulation ofperfluorinated acids in juvenile rainbow trout (Oncorhynchus mykiss). Environ. Toxicol.Chem., 22 (1), 189-195.
Martin, JW, Mabury, SA, Solomon, KR and Muir, DCG (2003a). Bioconcentration and tissuedistribution of perfluorinated acids in rainbow trout (Oncorhynchus mykiss). Environ.Toxicol. Chem., 22 (1), 196-204.
Martin, JW, Smithwick, MM, Braune, BM, Hoekstra, PF, Muir, DCG and Mabury, SA(2004). Identification of long chain perfluorinated acids in biota from the Canadian arctic.Environ. Sci. Technol., 38, 373-380.
Moody, CA, Hebert, GN, Strauss, SH and Field, JA (2003). Occurrence and persistence ofperfluorooctanesulfonate and other perfluorinated surfactants in groundwater at a fire-trainingarea at Wurtsmith Air Force Base, Michigan, USA. J Environ. Monit., 5, 341-345.
Moriwaki, H, Takata, Y and Arakawa, R (2003). Concentrations of perfluorooctane sulfonate(PFOS) and perfluorooctanoic acid (PFOA) in vacuum cleaner dust collected in Japanesehomes. J Environ. Monit., 5, 753-757.
OECD (2002). Hazard Assessment of Perfluorooctane Sulfonate (PFOS) and its Salts.ENV/JM/RD(2002)17/FINAL.
RIKZ (2002). Perfluoroalkylated Substances - Aquatic Environmental Assessment. RIKZand University of Amsterdam. Report RIKZ/2002.043.
Risk Reduction Strategy (report). Perfluorooctane Sulphonate. Risk Reduction Strategy andAnalysis of Advantages and Drawbacks & Review of Environmental Risks. RPA and BREEnvironment, prepared for Department for Environment, Food and Rural Affairs, UK.
Saito, N, Sasaki, K, Nakatome, K, Harada, K, Yoshinga, T and Koizumi, A (2003).Perfluorooctane sulfonate concentrations in surface water in Japan. Arch. Environ. Contam.Toxicol., 45, 149-158.
Sanderson, H, Boudreau, TM, Mabury, SA, Cheong, W-J and Solomon, KR (2002).Ecological impact ond environmental fate of perfluorooctane sulfonate on the zooplanktoncommunity in indoor microcosms. Environ. Toxicol. Chem., 21 (7), 1490-1496.
Sasaki, K, Harada, K, Saito, N, Tsutsui, T, Nakanishi, S, Tsuzuki, H and Koizumi, A (2003).Impact of airborne perfluorooctane sulfonate on the human body burden and the ecologicalsystem. Bull. Environ. Contam. Toxicol., 71, 408-413.

77
Shoeib, M, Harner, T, Ikonomou, M and Kannan, K (2004). Indoor and outdoor airconcentrations and phase partitioning of perfluoroalkyl sulfonamides and polybrominateddiphenyl ethers. Environ. Sci. Technol., 38, 1313-1320.
Taniyasu, S, Kannan, K, Horii, Y and Yamashita, N (2002). The first environmental surveyof perfluorooctane sulphonate (PFOS) and related compounds in Japan. OrganohalogenCompounds, 59, 311-314.
TGD. Technical Guidance Document, (First edition), Part I-V, ISBN 92-827-801[1234] andSecond Edition, Parts I-IV, EUR 20418 EN/1-4
Van de Vijver, KI, Hoff, PT, Van Dongen, W, Esmans, EL, Blust, R and de Coen, WM(2003). Exposure patterns of perfluorooctane sulfonate in aquatic invertebrates from theWestern Scheldt estuary and the southern North Sea. Environ. Toxicol. Chem., 22 (9), 2037-2041.

78
ABBREVIATIONS
ASTM American Society for Testing and MaterialsB Bioaccumulative, within the meaning of the PBT criteriaBCF Bioconcentration Factorbw body weight / Bw, b.w.CAS Chemical Abstract ServicesEC European CommunitiesEC10 Effect Concentration measured as 10% effectEC50 median Effect Concentration ECB European Chemicals BureauEINECS European Inventory of Existing Commercial Chemical SubstancesEPA Environmental Protection Agency (USA)EPCI European Photographic Chemicals IndustryESD Emission Scenario DocumentESIA European Semi-Conductor Industry AssociationESR Existing Substances RegulationEU European UnionEUSES European Union System for the Evaluation of Substances [software tool
in support of the Technical Guidance Document on risk assessment]FOSA PerfluorooctanesulphonamideIC50 median Immobilisation Concentration or median Inhibitory ConcentrationISO International Organisation for StandardisationKow octanol/water partition coefficientKd solids-water partition coefficientL(E)C50 median Lethal (Effect) Concentration LC50 median Lethal Concentration LOAEL Lowest Observed Adverse Effect LevelMITI Ministry of International Trade and Industry, JapanN Dangerous for the environment (Symbols and indications of danger for
dangerous substances and preparations according to Annex III ofDirective 67/548/EEC
N-EtFOSE N-ethylperfluorooctanesulphonamidoethanol (structure in Section 1.1)N-MeFOSE N-methylperfluorooctanesulphonamidoethanolNOAEL No Observed Adverse Effect LevelNOEC No Observed Effect Concentrationnt. Normal, Temperature and PressureOECD Organisation for Economic Cooperation and DevelopmentOSPAR Oslo and Paris Convention for the protection of the marine environment
of the Northeast AtlanticP Persistent, within the meaning of the PBT criteriaPBT Persistent, Bioaccumulative and ToxicPEC Predicted Environmental ConcentrationPFOA Perfluorooctane carboxylic acidPFOS Perfluorooctane sulphonate (used to refer to the anion, or the moiety in
other substances) (structure in Section 1.1)PNEC Predicted No Effect ConcentrationQSAR (Quantitative) Structure-Activity RelationshipRAR Risk Assessment ReportSEMI Semiconductors Equipment and Materials InternationalSIDS Screening Information Data Set, OECDSNUR Significant New Use Rule (US EPA)

79
STP Sewage Treatment PlantT Toxic, within the meaning of the PBT criteriaTG Test GuidelineTGD Technical Guidance DocumentUS EPA Environmental Protection Agency, USAvP very Persistent, within the meaning of the PBT criteriaw/w weight per weight ratioWWTP Waste Water Treatment Plant

80
Appendix 1 - Draft List of Compounds Potentially Degrading to PFOS in theEnvironment

81
Table A1.1: Draft List of Compounds Potentially Degrading to PFOS in the EnvironmentRefNo.
CASNumber PFOS related substance
1 307-35-7 1-Octanesulphonyl fluoride, 1,1,2,2,3,3,4,4,5,5,6,6,7,7,8,8,8-heptadecafluoro-2 376-14-7 2-Propenoic acid, 2-methyl-, 2-[ethyl[(heptadecafluorooctyl)sulphonyl]amino]ethyl ester3 383-07-3 2-Propenoic acid, 2-[butyl[(heptadecafluorooctyl)sulphonyl]amino]ethyl ester4 423-82-5 2-Propenoic acid, 2-[ethyl[(heptadecafluorooctyl)sulphonyl]amino]ethyl ester5 423-86-9 1-Octanesulphonamide, 1,1,2,2,3,3,4,4,5,5,6,6,7,7,8,8,8-heptadecafluoro-N-2-propenyl-6 754-91-6 1-Octanesulphonamide, 1,1,2,2,3,3,4,4,5,5,6,6,7,7,8,8,8-heptadecafluoro-7 1652-63-7 1-Propanaminium, 3-[[(heptadecafluorooctyl)sulphonyl]amino]-N,N,N-trimethyl-, iodide8 1691-99-2 1-Octanesulphonamide, N-ethyl-1,1,2,2,3,3,4,4,5,5,6,6,7,7,8,8,8-heptadecafluoro-N-(2-hydroxyethyl)-9 1763-23-1 1-Octanesulphonic acid, 1,1,2,2,3,3,4,4,5,5,6,6,7,7,8,8,8-heptadecafluoro-
10 1869-77-8 Glycine, N-ethyl-N-[(heptadecafluorooctyl)sulphonyl]-, ethyl ester11 2250-98-8 1-Octanesulphonamide, N,N',N''- [phosphinylidynetris(oxy-2,1-ethanediyl)]tris[N-ethyl-1,1,2,2,3,3,4,4,5,5,6,6,7,7,8,8,8-heptadecafluoro-12 2263-09-4 1-Octanesulphonamide, N-butyl-1,1,2,2,3,3,4,4,5,5,6,6,7,7,8,8,8-heptadecafluoro-N-(2-hydroxyethyl)-13 2795-39-3 1-Octanesulphonic acid, 1,1,2,2,3,3,4,4,5,5,6,6,7,7,8,8,8-heptadecafluoro-, potassium salt14 2991-50-6 Glycine, N-ethyl-N-[(heptadecafluorooctyl)sulphonyl]-15 2991-51-7 Glycine, N-ethyl-N-[(heptadecafluorooctyl)sulphonyl]-, potassium salt16 3820-83-5 1-Octanesulphonamide, N-ethyl-1,1,2,2,3,3,4,4,5,5,6,6,7,7,8,8,8-heptadecafluoro-N-[2-(phosphonooxy)ethyl]-17 3871-50-9 Glycine, N-ethyl-N-[(heptadecafluorooctyl)sulphonyl]-, sodium salt18 4151-50-2 1-Octanesulphonamide, N-ethyl-1,1,2,2,3,3,4,4,5,5,6,6,7,7,8,8,8-heptadecafluoro-19 13417-01-1 1-Octanesulphonamide, N-[3-(dimethylamino)propyl]-1,1,2,2,3,3,4,4,5,5,6,6,7,7,8,8,8-heptadecafluoro-20 14650-24-9 2-Propenoic acid, 2-methyl-, 2- [[(heptadecafluorooctyl)sulphonyl]methylamino]ethyl ester21 24448-09-7 1-Octanesulphonamide, 1,1,2,2,3,3,4,4,5,5,6,6,7,7,8,8,8-heptadecafluoro-N-(2-hydroxyethyl)-N-methyl-22 24924-36-5 1-Octanesulphonamide, N-ethyl-1,1,2,2,3,3,4,4,5,5,6,6,7,7,8,8,8-heptadecafluoro-N-2-propenyl-23 25268-77-3 2-Propenoic acid, 2-[[(heptadecafluorooctyl)sulphonyl]methylamino]ethyl ester24 29081-56-9 1-Octanesulphonic acid, 1,1,2,2,3,3,4,4,5,5,6,6,7,7,8,8,8-heptadecafluoro-, ammonium salt25 29117-08-6 Poly(oxy-1,2-ethanediyl), .alpha.-[2-[ethyl[(heptadecafluorooctyl)sulphonyl]amino]ethyl]-.omega.-hydroxy-

82
Table A1.1: Draft List of Compounds Potentially Degrading to PFOS in the EnvironmentRefNo.
CASNumber PFOS related substance
26 29457-72-5 1-Octanesulphonic acid, 1,1,2,2,3,3,4,4,5,5,6,6,7,7,8,8,8-heptadecafluoro-, lithium salt27 30295-51-3 1-Octanesulphonamide, N-[3-(dimethyloxidoamino)propyl]-1,1,2,2,3,3,4,4,5,5,6,6,7,7,8,8,8-heptadecafluoro-28 30381-98-7 1-Octanesulphonamide, N,N'-[phosphinicobis(oxy-2,1-ethanediyl)]bis[N-ethyl-1,1,2,2,3,3,4,4,5,5,6,6,7,7,8,8,8-heptadecafluoro-, ammonium salt29 31506-32-8 1-Octanesulphonamide, 1,1,2,2,3,3,4,4,5,5,6,6,7,7,8,8,8-heptadecafluoro-N-methyl-30 38006-74-5 1-Propanaminium, 3-[[(heptadecafluorooctyl)sulphonyl]amino]-N,N’,N’’-trimethyl-, chloride31 50598-29-3 1-Octanesulphonamide, 1,1,2,2,3,3,4,4,5,5,6,6,7,7,8,8,8-heptadecafluoro-N-(phenylmethyl)-32 52550-45-5 Poly(oxy-1,2-ethanediyl), α-[2-[[(heptadecafluorooctyl)sulphonyl]propylamino]ethyl]-ω -hydroxy-33 56773-42-3 Ethanaminium, N,N’,N’’-triethyl-, salt with 1,1,2,2,3,3,4,4,5,5,6,6,7,7,8,8,8-heptadecafluoro-1-octanesulphonic acid (1:1)34 57589-85-2 Benzoic acid, 2,3,4,5-tetrachloro-6-[[[3- [[(heptadecafluorooctyl)sulphonyl]oxy]phenyl]amino]carbonyl]-, monopotassium salt35 58920-31-3 2-Propenoic acid, 4-[[(heptadecafluorooctyl)sulphonyl]methylamino]butyl ester36 61577-14-8 2-Propenoic acid, 2-methyl-, 4-[[(heptadecafluorooctyl)sulphonyl]methylamino]butyl ester37 61660-12-6 1-Octanesulphonamide, N-ethyl-1,1,2,2,3,3,4,4,5,5,6,6,7,7,8,8,8-heptadecafluoro-N-[3-(trimethoxysilyl)propyl]-38 67939-42-8 1-Octanesulphonamide, N-ethyl-1,1,2,2,3,3,4,4,5,5,6,6,7,7,8,8,8-heptadecafluoro-N-[3-(trichlorosilyl)propyl]-39 67969-69-1 1-Octanesulphonamide, N-ethyl-1,1,2,2,3,3,4,4,5,5,6,6,7,7,8,8,8-heptadecafluoro-N-[2-(phosphonooxy)ethyl]-, diammonium salt
40 67939-88-2 1-Octanesulphonamide, N-[3-(dimethylamino)propyl]- 1,1,2,2,3,3,4,4,5,5,6,6,7,7,8,8,8-heptadecafluoro-, monohydrochloride
41 68081-83-4 Carbamic acid, (4-methyl-1,3-phenylene)bis-, bis[2-[ethyl[(perfluoro-C4-8-alkyl)sulphonyl]amino]ethyl] ester
42 68298-11-3 1-Propanaminium, 3-[[(heptadecafluorooctyl)sulphonyl](3-sulphopropyl)amino]-N-(2-hydroxyethyl)-N,N-dimethyl-, hydroxide, inner salt
43 68329-56-62-Propenoic acid, eicosyl ester, polymer with 2-[[(heptadecafluorooctyl)sulphonyl] methylamino]ethyl 2-propenoate, hexadecyl 2-propenoate, 2-[methyl[(nonafluorobutyl)sulphonyl]amino]ethyl 2-propenoate, 2-[methyl[(pentadecafluoroheptyl)sulphonyl]amino]ethyl 2-propenoate, 2-[methyl[(tridecafluorohexyl)sulphonyl]amino]ethyl 2-propenoate, 2-[methyl[(undecafluoropentyl)sulphonyl]amino]ethyl 2-propenoate and octadecyl 2-propenoate
44 68239-73-6 1-Octanesulphonamide, 1,1,2,2,3,3,4,4,5,5,6,6,7,7,8,8,8-heptadecafluoro-N-(4-hydroxybutyl)-N-methyl-45 68310-75-8 1-Propanaminium, 3-[[(heptadecafluorooctyl)sulphonyl]amino]-N,N’,N’’-trimethyl-, iodide, ammonium salt46 68541-80-0 2-Propenoic acid, polymer with 2-[ethyl[(heptadecafluorooctyl)sulphonyl]amino]ethyl 2-methyl-2-propenoate and octadecyl 2-propenoate
47 68555-90-82-Propenoic acid, butyl ester,polymer with 2-[[(heptadecafluorooctyl)sulphonyl]methylamino]ethyl 2-propenoate, 2-[methyl[(nonafluorobutyl)sulphonyl]amino]ethyl 2-propenoate, 2-[methyl[(pentadecafluoroheptyl)sulphonyl]amino]ethyl 2-propenoate, 2-[methyl[(tridecafluorohexyl)sulphonyl]amino]ethyl 2-propenoate and 2-[methyl[(undecafluoropentyl)sulphonyl]amino]ethyl 2-propenoate

83
Table A1.1: Draft List of Compounds Potentially Degrading to PFOS in the EnvironmentRefNo.
CASNumber PFOS related substance
48 68555-91-92-Propenoic acid, 2-methyl-, 2-[ethyl[(heptadecafluorooctyl)sulphonyl]amino]ethyl ester, polymer with 2-[ethyl[(nonafluorobutyl)sulphonyl]amino] ethyl 2-methyl-2-propenoate, 2-[ethyl[(pentadecafluoroheptyl)sulphonyl]amino]ethyl 2-methyl-2-propenoate, 2-[ethyl[(tridecafluorohexyl)sulphonyl]amino]ethyl 2-methyl-2-propenoate, 2- [ethyl[(undecafluoropentyl)sulphonyl]amino]ethyl 2-methyl-2-propenoate and octadecyl 2-methyl-2-propenoate
49 68555-92-02-Propenoic acid, 2-methyl-, 2-[[(heptadecafluorooctyl)sulphonyl]methylamino]ethyl ester, polymer with 2- [methyl[(nonafluorobutyl)sulphonyl]amino]ethyl 2-methyl-2-propenoate, 2- [methyl[(pentadecafluoroheptyl)sulphonyl]amino]ethyl 2-methyl-2-propenoate, 2- [methyl[(tridecafluorohexyl)sulphonyl]amino]ethyl 2-methyl-2-propenoate, 2- [methyl[(undecafluoropentyl)sulphonyl]amino]ethyl 2-methyl-2-propenoate and octadecyl 2-methyl-2-propenoate
50 68608-14-0 Sulphonamides, C4-8-alkane, perfluoro, N-ethyl-N-(hydroxyethyl), reaction products with 1,1'-methylenebis[4-isocyanatobenzene]
51 68649-26-3
1-Octanesulphonamide, N-ethyl-1,1,2,2,3,3,4,4,5,5,6,6,7,7,8,8,8-heptadecafluoro-N-(2-hydroxyethyl)-, reaction products with N-ethyl-1,1,2,2,3,3,4,4,4-nonafluoro-N-(2-hydroxyethyl)-1-butanesulphonamide, N-ethyl-1,1,2,2,3,3,4,4,5,5,6,6,7,7,7-pentadecafluoro-N-(2-hydroxyethyl)- 1-heptanesulphonamide, N-ethyl-1,1,2,2,3,3,4,4,5,5,6,6,6-tridecafluoro-N-(2-hydroxyethyl)-1-hexanesulphonamide, N-ethyl-1,1,2,2,3,3,4,4,5,5,5-undecafluoro-N-(2-hydroxyethyl)-1-pentanesulphonamide, polymethylenepolyphenyleneisocyanate and stearyl alc.
52 68867-60-72-Propenoic acid, 2-[[(heptadecafluorooctyl)sulphonyl]methylamino]ethyl ester, polymer with 2-[methyl[(nonafluorobutyl)sulphonyl]amino]ethyl 2-propenoate, 2-[methyl[(pentadecafluoroheptyl)sulphonyl]amino]ethyl 2-propenoate, 2- [methyl[(tridecafluorohexyl)sulphonyl]amino]ethyl 2-propenoate, 2-[methyl[(undecafluoropentyl)sulphonyl]amino]ethyl 2-propenoate and.alpha.-(1-oxo-2-propenyl)-.omega.-methoxypoly(oxy-1,2-ethanediyl)
53 68877-32-7
2-Propenoic acid, 2-methyl-, 2-[ethyl[(heptadecafluorooctyl)sulphonyl]amino]ethyl ester, polymer with 2-[ethyl[(nonafluorobutyl)sulphonyl]amino]ethyl 2-methyl-2-propenoate,2-[ethyl[(pentadecafluoroheptyl)sulphonyl]amino]ethyl 2-methyl-2-propenoate, 2-[ethyl[(tridecafluoro-hexyl)sulphonyl]amino]ethyl 2-methyl-2-propenoate, 2-[ethyl[(undecafluoro-pentyl)sulphonyl]amino]ethyl 2-methyl-2-propenoate and 2-methyl-1,3-butadiene
54 68891-96-3 Chromium, diaquatetrachloro[.mu.-[N-ethyl-N- [(heptadecafluorooctyl)sulphonyl] glycinato-.kappa.O:.kappa.O']]-.mu.-hydroxybis(2-methylpropanol)di-
55 68909-15-9
2-Propenoic acid, eicosyl ester, polymers with branched octylacrylate, 2- [[(heptadecafluorooctyl)sulphonyl]methylamino]ethyl acrylate, 2-[methyl[(nonafluorobutyl)sulphonyl]amino]ethyl acrylate, 2- [methyl[(pentadecafluoroheptyl)sulphonyl]amino]ethyl acrylate, 2-[methyl[(tridecafluorohexyl)sulphonyl]amino]ethyl acrylate, 2- [methyl[(undecafluoropentyl)sulphonyl]amino]ethyl acrylate, polyethylene glycol acrylate Me etherand stearyl acrylate
56 68958-61-2 Poly(oxy-1,2-ethanediyl), .alpha.-[2-[ethyl[(heptadecafluorooctyl)sulphonyl]amino]ethyl]-.omega.-methoxy-57 70225-14-8 1-Octanesulphonic acid, 1,1,2,2,3,3,4,4,5,5,6,6,7,7,8,8,8-heptadecafluoro-, compd. with 2,2'-iminobis[ethanol] (1:1)
58 70776-36-22-Propenoic acid, 2-methyl-, octadecyl ester, polymer with 1,1-dichloroethene, 2-[[(heptadecafluorooctyl)sulphonyl]methylamino]ethyl 2-propenoate, N-(hydroxymethyl)-2-propenamide, 2-[methyl[(nonafluorobutyl)sulphonyl]amino]ethyl 2-propenoate, 2-[methyl[(pentadecafluoroheptyl)sulphonyl]amino]ethyl 2-propenoate, 2-[methyl[(tridecafluorohexyl)sulphonyl]amino]ethyl 2-propenoate and 2-[methyl[(undecafluoropentyl)sulphonyl]amino]ethyl 2-propenoate
59 71463-78-0 Phosphonic acid, [3-[ethyl[(heptadecafluorooctyl)sulphonyl]amino]propyl]-60 71463-80-4 Phosphonic acid, [3-[ethyl[(heptadecafluorooctyl)sulphonyl]amino]propyl]-, diethyl ester
61 71487-20-22-Propenoic acid, 2-methyl-, methyl ester, polymer with ethenylbenzene, 2-[[(heptadecafluorooctyl)sulphonyl]methylamino]ethyl 2-propenoate, 2-[methyl[(nonafluorobutyl)sulphonyl]amino]ethyl 2-propenoate, 2- [methyl[(pentadecafluoroheptyl)sulphonyl]amino]ethyl 2-propenoate, 2-[methyl[(tridecafluorohexyl)sulphonyl]amino]ethyl 2-propenoate, 2- [methyl[(undecafluoropentyl)sulphonyl]amino]ethyl 2-propenoate and 2-propenoic acid
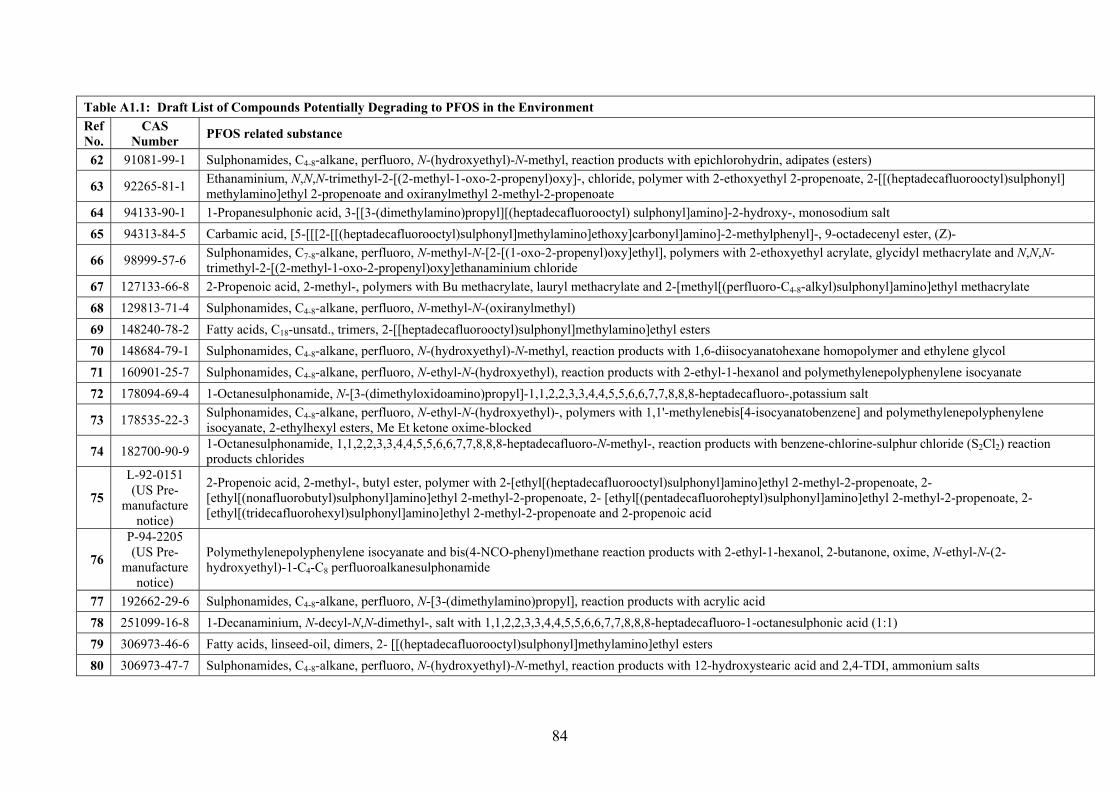
84
Table A1.1: Draft List of Compounds Potentially Degrading to PFOS in the EnvironmentRefNo.
CASNumber PFOS related substance
62 91081-99-1 Sulphonamides, C4-8-alkane, perfluoro, N-(hydroxyethyl)-N-methyl, reaction products with epichlorohydrin, adipates (esters)
63 92265-81-1 Ethanaminium, N,N,N-trimethyl-2-[(2-methyl-1-oxo-2-propenyl)oxy]-, chloride, polymer with 2-ethoxyethyl 2-propenoate, 2-[[(heptadecafluorooctyl)sulphonyl]methylamino]ethyl 2-propenoate and oxiranylmethyl 2-methyl-2-propenoate
64 94133-90-1 1-Propanesulphonic acid, 3-[[3-(dimethylamino)propyl][(heptadecafluorooctyl) sulphonyl]amino]-2-hydroxy-, monosodium salt65 94313-84-5 Carbamic acid, [5-[[[2-[[(heptadecafluorooctyl)sulphonyl]methylamino]ethoxy]carbonyl]amino]-2-methylphenyl]-, 9-octadecenyl ester, (Z)-
66 98999-57-6 Sulphonamides, C7-8-alkane, perfluoro, N-methyl-N-[2-[(1-oxo-2-propenyl)oxy]ethyl], polymers with 2-ethoxyethyl acrylate, glycidyl methacrylate and N,N,N-trimethyl-2-[(2-methyl-1-oxo-2-propenyl)oxy]ethanaminium chloride
67 127133-66-8 2-Propenoic acid, 2-methyl-, polymers with Bu methacrylate, lauryl methacrylate and 2-[methyl[(perfluoro-C4-8-alkyl)sulphonyl]amino]ethyl methacrylate68 129813-71-4 Sulphonamides, C4-8-alkane, perfluoro, N-methyl-N-(oxiranylmethyl)69 148240-78-2 Fatty acids, C18-unsatd., trimers, 2-[[heptadecafluorooctyl)sulphonyl]methylamino]ethyl esters70 148684-79-1 Sulphonamides, C4-8-alkane, perfluoro, N-(hydroxyethyl)-N-methyl, reaction products with 1,6-diisocyanatohexane homopolymer and ethylene glycol71 160901-25-7 Sulphonamides, C4-8-alkane, perfluoro, N-ethyl-N-(hydroxyethyl), reaction products with 2-ethyl-1-hexanol and polymethylenepolyphenylene isocyanate72 178094-69-4 1-Octanesulphonamide, N-[3-(dimethyloxidoamino)propyl]-1,1,2,2,3,3,4,4,5,5,6,6,7,7,8,8,8-heptadecafluoro-,potassium salt
73 178535-22-3 Sulphonamides, C4-8-alkane, perfluoro, N-ethyl-N-(hydroxyethyl)-, polymers with 1,1'-methylenebis[4-isocyanatobenzene] and polymethylenepolyphenyleneisocyanate, 2-ethylhexyl esters, Me Et ketone oxime-blocked
74 182700-90-9 1-Octanesulphonamide, 1,1,2,2,3,3,4,4,5,5,6,6,7,7,8,8,8-heptadecafluoro-N-methyl-, reaction products with benzene-chlorine-sulphur chloride (S2Cl2) reactionproducts chlorides
75
L-92-0151(US Pre-
manufacturenotice)
2-Propenoic acid, 2-methyl-, butyl ester, polymer with 2-[ethyl[(heptadecafluorooctyl)sulphonyl]amino]ethyl 2-methyl-2-propenoate, 2-[ethyl[(nonafluorobutyl)sulphonyl]amino]ethyl 2-methyl-2-propenoate, 2- [ethyl[(pentadecafluoroheptyl)sulphonyl]amino]ethyl 2-methyl-2-propenoate, 2-[ethyl[(tridecafluorohexyl)sulphonyl]amino]ethyl 2-methyl-2-propenoate and 2-propenoic acid
76
P-94-2205(US Pre-
manufacturenotice)
Polymethylenepolyphenylene isocyanate and bis(4-NCO-phenyl)methane reaction products with 2-ethyl-1-hexanol, 2-butanone, oxime, N-ethyl-N-(2-hydroxyethyl)-1-C4-C8 perfluoroalkanesulphonamide
77 192662-29-6 Sulphonamides, C4-8-alkane, perfluoro, N-[3-(dimethylamino)propyl], reaction products with acrylic acid78 251099-16-8 1-Decanaminium, N-decyl-N,N-dimethyl-, salt with 1,1,2,2,3,3,4,4,5,5,6,6,7,7,8,8,8-heptadecafluoro-1-octanesulphonic acid (1:1)79 306973-46-6 Fatty acids, linseed-oil, dimers, 2- [[(heptadecafluorooctyl)sulphonyl]methylamino]ethyl esters80 306973-47-7 Sulphonamides, C4-8-alkane, perfluoro, N-(hydroxyethyl)-N-methyl, reaction products with 12-hydroxystearic acid and 2,4-TDI, ammonium salts

85
Table A1.1: Draft List of Compounds Potentially Degrading to PFOS in the EnvironmentRefNo.
CASNumber PFOS related substance
81 306974-19-6 Sulphonamides, C4-8-alkane, perfluoro, N-methyl-N-[(3-octadecyl-2-oxo-5-oxazolidinyl)methyl]
82 306974-28-7 Siloxanes and Silicones, di-Me, mono[3-[(2-methyl-1-oxo-2-propenyl)oxy]propylgroup] -terminated, polymers with 2-[methyl[(perfluoro-C4-8-alkyl)sulphonyl]amino]ethyl acrylate and stearyl methacrylate
83 306974-45-8 Sulphonic acids, C6-8-alkane, perfluoro, compounds with polyethylene-polypropylene glycol bis(2-aminopropyl) ether84 306974-63-0 Fatty acids, C18-unsatd.,dimers, 2-[methyl[(perfluoro-C4-8-alkyl)sulphonyl]amino] ethyl esters
85 306975-56-4Propanoic acid, 3-hydroxy-2- (hydroxymethyl)-2-methyl-, polymer with 2-ethyl-2-(hydroxymethyl)-1,3-propanediol and N,N',2-tris(6-isocyanatohexyl)imidodicarbonic diamide, reaction products with N-ethyl-1,1,2,2,3,3,4,4,5,5,6,6,7,7,8,8,8-heptadecafluoro-N-(2-hydroxyethyl)-1-octanesulphonamide and N-ethyl-1,1,2,2,3,3,4,4,5,5,6,6,7,7,7-pentadecafluoro-N-(2-hydroxyethyl)-1-heptanesulphonamide, compounds with triethylamine
86 306975-57-5Propanoic acid, 3-hydroxy-2-(hydroxymethyl)-2-methyl-, polymer with 1,1'-methylenebis[4- isocyanatobenzene] and 1,2,3-propanetriol, reaction products with N-ethyl-1,1,2,2,3,3,4,4,5,5,6,6,7,7,8,8,8-heptadecafluoro-N-(2-hydroxyethyl)-1-octanesulphonamide and N-ethyl-1,1,2,2,3,3,4,4,5,5,6,6,7,7,7-pentadecafluoro-N-(2-hydroxyethyl)-1-heptanesulphonamide, compounds with morpholine
87 306975-62-2 2-Propenoic acid, 2-methyl-, dodecyl ester, polymers with 2- [methyl[(perfluoro-C4-8-alkyl)sulphonyl]amino]ethyl acrylate and vinylidene chloride
88 306975-84-8 Poly(oxy-1,2-ethanediyl), .alpha.-hydro-.omega.-hydroxy-, polymer with 1,6-diisocyanatohexane, N-(hydroxyethyl)-N-methyl perfluoro C4-8-alkane sulphonamides-blocked
89 306975-85-9 2-Propenoic acid, 2-methyl-, dodecyl ester, polymers with N-(hydroxymethyl)-2-propenamide, 2-[methyl[(perfluoro-C4-8-alkyl)sulphonyl]amino]ethyl methacrylate,stearyl methacrylate and vinylidene chloride
90 306976-25-0 1-Hexadecanaminium, N,N-dimethyl-N-[2-[(2-methyl-1-oxo-2-propenyl)oxy]ethyl]-, bromide, polymers with Bu acrylate, Bu methacrylate and 2-[methyl[(perfluoro-C4-8-alkyl)sulphonyl]amino]ethyl acrylate
91 306976-55-6 2-Propenoic acid, 2-methyl-, 2-methylpropyl ester, polymer with 2,4-diisocyanato-1-methylbenzene, 2-ethyl-2-(hydroxymethyl)-1,3-propanediol and 2-propenoicacid, N-ethyl-N-(hydroxyethyl)perfluoro-C4-8-alkanesulphonamides-blocked
92 306977-58-2 2-Propenoic acid, 2-methyl-, 3-(trimethoxysilyl)propyl ester, polymers with acrylic acid, 2-[methyl[(perfluoro-C4-8-alkyl)sulphonyl]amino]ethyl acrylate andpropylene glycol monoacrylate, hydrolysed, compounds with 2,2'-(methylimino)bis[ethanol]
93 306978-04-1 2-Propenoic acid, butyl ester, polymers with acrylamide, 2-[methyl[(perfluoro-C4-8-alkyl)sulphonyl]amino]ethyl acrylate and vinylidene chloride94 306978-65-4 Hexane, 1,6-diisocyanato-, homopolymer, N-(hydroxyethyl)-N-methyl perfluoro-C4-8-alkane sulphonamides- and stearyl alc.-blocked95 306979-40-8 Poly(oxy-1,2-ethanediyl), .alpha.-[2-(methylamino)ethyl]-.omega.-[(1,1,3,3-tetramethylbutyl)phenoxy]-, N-[(perfluoro-C4-8-alkyl)sulphonyl]96 306980-27-8 Sulphonamides, C4-8-alkane, perfluoro, N,N'-[1,6-hexanediylbis[(2-oxo-3,5-oxazolidinediyl)methylene]]bis[N-methyl-
Sources: US EPA (2002a); US EPA (2002b); Environment Agency (2001); Consultation with Environment Canada (note that RPA reviewed a confidential draft list of PFOS precursorsthat was provided by Environment Canada. This was developed from the 182 PFAS that were listed in a June 2000 survey to Canadian industry (Environment Canada, 2000). The draftlist will be available as an appendix in the draft screening assessment report on PFOS and its Precursors that the Departments of Environment and Health Canada will release for publiccomment in early 2004 (Windle, 2003)).

86
Appendix 2 – Indirect emissions of PFOS from PFOS-substances and PFOS-polymers
The emissions in the tables below are used in Scenarios 3 to 7 to allow for the production ofPFOS in the environment through the degradation of PFOS-substances or PFOS-polymers.For each scenario the EUSES model was run with the properties of PFOS-substance orPFOS-polymer from Section 3.3.1.1 of the evaluation and the relevant emissions of thesubstance or polymer for that scenario (emissions in Table 3.8). From the results of thismodelling for the regional scale, the rate of degradation of PFOS-substance or polymer ineach compartment was determined - these values are in the columns labelled “Degradationrate” in the tables. These rates were then converted into formation rates for PFOS (as 94% inthe case of PFOS-substance, 30% for polymers). These values are in the columns labelled“PFOS formation”. These rates were added to the direct emissions of PFOS-salt for thescenario to give the total emissions.
Scenario 2 is not included, because in this case the PFOS-substance emissions wereconverted directly to PFOS before release to the environment, and added directly to thePFOS-salt releases.
Scenario 3 - PFOS-substance, half life 20.5 days.
PFOS-substanceCompartment Degradation rate
(kg/year)PFOS formation
(kg/year)Direct release ofPFOS (kg/year)
Total (kg/year)
Air 353 332 0.034 332Waste water - - 1000 1000Surface water 15.9 14.9 28.5 43.4Agricultural soil 200 188 - 188Industrial soil 32 30 29.5 59.5
Scenario 4 - PFOS-substance, half life 1 year.
PFOS-substanceCompartment Degradation rate
(kg/year)PFOS formation
(kg/year)Direct release ofPFOS (kg/year)
Total (kg/year)
Air 406 382 0.034 383Waste water - - 1000 1000Surface water 1.16 1.09 28.5 29.6Agricultural soil 11.8 11.1 - 11.1Industrial soil 11.8 11.1 29.5 40.6
Scenario 5 - PFOS-substance, half life 20.5 days plus PFOS-polymer, half life 30 years.
PolymerCompartment Degradation rate
(kg/year)PFOS formation
(kg/year)Combined release
of PFOS fromScenario 3(kg/year)
Total (kg/year)
Air - - 332 332Waste water - - 1000 1000Surface water 4.66 1.4 43.4 44.8Agricultural soil 6130 1840 188 2028Industrial soil 2020 606 59.5 665.5

87
Scenario 6 - PFOS-substance, half life 20.5 days, PFOS-polymer, half life 30 years, from selected use areas.
PFOS-substanceCompartment Degradation rate
(kg/year)PFOS formation
(kg/year)Direct release ofPFOS (kg/year)
Total (kg/year)
Air 63.2 59.4 0.034 59.4Waste water - - 1000 1000Surface water 6.08 5.72 28.5 34.2Agricultural soil 25 23.5 - 23.5Industrial soil 32 30.1 29.5 59.6
PolymerCompartment Degradation rate
(kg/year)PFOS formation
(kg/year)Combined
releases of PFOSfrom above
(kg/year)
Total (kg/year)
Air - - 59.4 59.4Waste water - - 1000 1000Surface water 4.59 1.38 34.2 35.6Agricultural soil 5920 1776 23.5 1800Industrial soil 2020 606 59.6 666
Scenario 7 - PFOS-substance, half life 20.5 days, from selected use areas.
PFOS-substanceCompartment Degradation rate
(kg/year)PFOS formation
(kg/year)Direct release ofPFOS (kg/year)
Total (kg/year)
Air 8.84 8.31 0.034 8.34Waste water - - 1000 1000Surface water 0.302 0.284 - 0.28Agricultural soil 5.35 5.03 - 5.03Industrial soil - - 1.02 1.02

88
Appendix 3 - Alternative calculation for releases from photolithography
The calculation of releases from photolithography in the main evaluation report includes theuse of PFOS-related substances in developers in this industry. SEMI and ESIA havecommented that this is not a critical use, and that such use could b phased out within the nextfive years. The calculations below reflect the emissions expected if this use were phased out,with no concomitant increase in the use in resists. These revised emission estimates are alsoused to explore the possible effect of different assumptions about the degree to which PFOS-substances degrade to PFOS-salts in the environment.
Emissions
ESIA-SEMI provided a mass balance for the use of PFOS-related substances in this area inOctober 2003. The key steps in this for this alternative calculation are as follows. Allquantities relate to annual use in the EU.
Resist materials – 7% of substance used (46 kg) remains on wafer = 3.2 kg.TARC materials – 40% of substance used (136 kg) remains on wafer = 54.4 kg.BARC materials – 7% of substance used (8 kg) remains on wafer = 0.56 kg.
The wafers are then treated with developer, which for this calculation is assumed to no longercontain any PFOS-related substance. Removal of PFOS-related substance by the developer isas follows:
100% of TARC material is removed, hence 54.4 kg.50% of resist material is removed, hence 1.6 kg.No removal of BARC material by developer.
The revised estimate of releases to waste water is therefore 56 kg per year.
The calculation in Section 3.1.3 of the main report assumes the use of 13 kg of PFOS-relatedsubstance per year at a representative site; this amount is 4.7% of the total EU usage of 276kg in this area (this total excludes developer). Taking the same percentage the annual releasefor a site would be 2.63 kg, and for 360 days operation the release would be 7.3 g/day. Theregional emissions would be 10% of the total, or 5.6 kg/year, and the continental emission50.4 kg/year. These are in terms of PFOS-substance.
Predicted environmental concentrations
The worst case assumption for the local situation is that the PFOS-substances are convertedto PFOS-salt before release. The above emissions of PFOS-substances correspond toemissions of PFOS-salt as follows: local, 6.9 g/day; regional 5.3 kg/year; continental,47.4 kg/year.
These revised emission figures have been used to examine the effect of different assumptionsabout the extent to which PFOS-substances break down to give PFOS. (The effects ofconsidering different rates for the breakdown process are considered elsewhere).
Two different assumptions have been made. The first is as in the main evaluation report, sothat the PFOS-substance breaks down to PFOS-salt on release. This is recognised as likely to

89
be an over-estimation, but provides a worst case estimate. For the second case, it is assumedthat 20% of the PFOS-substance is degraded to PFOS under aerobic biodegradationtreatment. The remaining 80% is released as PFOS-substance and is distributed in theenvironment according to the properties in Section 3.3.1.1.2. The half life in water, sedimentsand soil is assumed to be one year. At steady state, it is assumed that 50% of the PFOS-substance is converted to PFOS. This production of PFOS is added to the 20% emitteddirectly.
The results of these calculations are presented in Table A3.1. As the main area of potentialconcern from the main assessment is for secondary poisoning, only the concentrationsrelevant to this endpoint have been included here. Also included in the table are theequivalent concentrations calculated using the full releases estimated for this use area inScenario 7 of the main report, assuming instant conversion to PFOS, but without any inputfrom other uses.
Table A3.1 Calculated concentrations for secondary poisoning from photolithography (mg/kg)
Main reportreleases, instant
conversion
Reduced releases,instant conversion
Reduced releases,20% instant, 80%
indirectLocalFreshwater fish 2.53 0.687 0.14Marine fish 0.35 0.095 0.019Marine predator 0.14 0.038 7.8x10⁻³
Earthworms 0.14 0.039 7.8x10⁻³
RegionalFreshwater fish 4.9x10⁻³ 1.1x10⁻³ 3.1x10⁻⁴
Marine fish 4.8x10⁻⁴ 1.1x10⁻⁴ 3.1x10⁻⁵
Marine predator 9.6x10⁻⁴ 2.2x10⁻⁴ 6.2x10⁻⁵
Earthworms 4.4x10⁻⁵ 9.7x10⁻⁶ 6.3x10⁻⁶
The assumption of reduced emissions reduces the predicted concentrations as expected. Thealternative assumptions regarding the degradation of PFOS-substance to PFOS-salt also resultin reduced concentrations. The calculated concentrations in freshwater and marine fish areabove the PNEC of 0.0167 mg/kg in all three cases. Those for marine predators andearthworms are below the PNEC for the less conservative assumptions. All of the regionalconcentrations are below the PNEC.
If the less conservative PNEC of 0.067 mg/kg is used, the concentration in freshwater fish isabove the PNEC for the local scenario.

90
Appendix 4 – Alternative calculations for fire fighting foam use
The estimation of emissions to the environment from the use of PFOS-containing firefighting foams in the main evaluation assumes that 15% of the amount stockpiled is used inone year. This is in line with the overall level of use of foams in the UK for 2002. However,the level of use of PFOS-containing foams for this period was only 0.5%. The higher valuewas used for a number of reasons. It was felt that the low use may be due to holders trying tominimise the use of this type of foam, or due to a limited occurrence of the type of firerequiring their use. If the level of use was only 0.5%, then for a 20-year shelf life around 90%of the foam would be disposed of at the end of its life without being used, which seemedhigh. However, a calculation has been performed assuming the lower rate of use to apply.
For the UK stockpile of 76,000 litres of PFOS-containing foam concentrates, use of 0.5% peryear is 380 litres of foam, or 380 kg assuming a density of 1 kg/l. At a content of 1% in theconcentrate, this contains 3.8 kg of PFOS-salt. The main report considers the use of 1% of theannual total at a single fire. In this calculation that would be only 3.8 litres of foam, whichseems too small. Therefore in this case use of 10% at one (worst case) fire is assumed, givinga release of 0.38 kg. As in the main report, this is assumed to go either to drain and to soil(50% each, so 0.19 kg each), or to waste water treatment (100%, so 0.38 kg) for calculationof local concentrations.
Assuming the UK emissions to be 20% of those in the EU, the total EU emissions are 19 kg.The regional emission is 0.95 kg/year, with half to surface water and half to soil. Thecontinental emissions are 8.55 kg/year, again split equally between surface water and soil.
These revised emissions have been used to replace those from fire fighting foams in Scenario1 and the calculations of concentration repeated. The resulting concentrations are included inTable A4.1 Only the local and regional concentrations in surface water and freshwater fishfor secondary poisoning have been included as the most significant for the evaluation. Therelevant PEC/PNEC ratios are also included.
Table A4.1 Revised concentrations for fire fighting foam use
Use area Freshwater (mg/l) PEC/PNEC Fish (mg/kg) PEC/PNECUse A 9.54x10⁻³ 0.38 0.279 16.8Use B 0.0137 0.55 0.312 18.7Regional 3.7x10⁻⁵ 0.001 0.207 12.4
The revised scenario has no risks to the freshwater environment from direct effects for eitheruse pattern. However, both use patterns and the regional concentration indicate a possible riskthrough secondary poisoning. The regional concentration in water is reduced by less than 1%from that in the main report.

91
Appendix 5 - Effects of the half life for PFOS-substance degradation
Scenarios 3 and 4 in the main report explore the effect of differing degradation rates forPFOS-substances. The degradation rates used in these scenarios are 20.5 days and 1 yearrespectively. The effect of the change is masked to some degree in the main report as thereare also direct releases of PFOS-salts in these scenarios, although Appendix 2 shows thecontribution from PFOS-substance degradation for the two scenarios. To make the effectclearer and to consider other aspects of degradation, calculations have been performed on theemission estimates for Scenario 7 with different values for the degradation rates in thevarious compartments.
For water, sediment and soil, half lives of 20.5 days and 1 year, as in the main assessment,and 10 years have been used. As in the main report, the model has been run using theproperties for PFOS-substances in Section 3.3.1.1.2, and the PFOS-substance emissionsrelevant for Scenario 7 from Table 3.8. From the results of the modelling, the degradationrates for PFOS-substance (as kg/year) have been calculated. In this case they have not beenconverted to the equivalent production rate of PFOS. The results are in Table A5.1 .
Table A5.1 Degradation rates for PFOS-substances assuming different half lives in water, sediment and soil.
Half lifeCompartment 20.5 days 1 year 10 yearsAir 8.84 9.92 10.7Surface water 0.3 0.02 0.002Soil 5.35 3.14 1.4Total 16.5 13.1 12.1
As the half life in the three compartments increases, the amount degraded in the aircompartment increases, that in water decreases significantly, and that ion soil decreases moreslowly. The overall total input is reduced, but only by ~25% over the range of half lives.
From the above, degradation in the air compartment is a significant route for PFOS-substancein the model, and if conversion to PFOS is assumed then it is a significant source of PFOS interms of indirect production. The half-life used above is 16 hours, calculated using the AOPprogram. This half-life is strictly for the initial reaction of the substance with OH radicalsrather than for the production of PFOS or other species. To investigate the effect of variationin this half-life, calculations were performed with values of 160 and 1600 hours in addition tothe original 16 hour value. These were performed with the half-life of 1 year for water,sediment and soil and the other values the same as above. The results are in Table A5.2 .
Table A5.2 Degradation rates for PFOS-substances assuming different half lives in air (kg/year)
Half lifeCompartment 16 hours 160 hours 1600 hoursAir 9.92 2.08 0.30Surface water 0.02 0.02 0.02Soil 3.14 3.14 3.14Total 13.08 5.24 3.46
In this case, the increasing half-life in air results in a lower amount being degraded in air butno change in the amounts in other compartments. Overall the amount degraded in the system(and potentially producing PFOS) decreases.
The amounts degraded were assumed to be converted into PFOS on a 1:1 basis. Taking theseas the only emissions the resulting regional concentrations in freshwater were 0.21, 0.085 and

92
0.057 ng/l for 16, 160 and 1600 hours respectively. Hence a change of two orders ofmagnitude in the half life results in a decrease of ~4 times in the concentration.

93
Appendix 6 - Effect of choice of log Kow value for polymer
Calculations were performed with EUSES using the releases of polymer for Scenario 6 fromthe main report. The data from the main report (Table 3.16) were used, but the value for thelog Kow was 6, 8 or 10. The concentrations in the compartments for the regional scale arepresented in Table A6.1.
Table A6.1 Concentrations of PFOS-polymer in regional model
Compartment (units) Log Kow = 6 Log Kow = 8 Log Kow = 10Surface water (mg/l) 5.4x10⁻⁵ 2.45x10⁻⁵ 2.26x10⁻⁵
Sea water (mg/l) 5.4x10⁻⁶ 2.22x10⁻⁶ 1.89x10⁻⁶
Air (mg/m3) 4.5x10⁻⁷ 1.24x10⁻⁷ 4.33x10⁻⁹
Agricultural soil (mg/kg) 0.0314 0.0421 0.044Natural soil (mg/kg) 0.0112 7.29x10⁻³ 3.55x10⁻⁴
Industrial soil (mg/kg) 0.257 0.59 0.815Freshwater sediment (mg/kg) 0.187 0.603 0.649Marine sediment (mg/kg) 0.0199 0.125 0.161
The calculated rates of PFOS-salt formation from the degradation of the polymer are in TableA6.2.
Table A6.2 Production of PFOS-salt from PFOS-polymer (in kg/year):
Compartment Log Kow = 6 Log Kow = 8 Log Kow = 10Surface water 1.38 0.62 0.58Agricultural soil 1776 2382 2490Industrial soil 606 1389 1920
The regional concentrations of PFOS-salt resulting from the polymer emissions forScenario 6 and log Kow values of 6 or 10 are shown in Table A6.3.
Table A6.3 Regional PFOS-salt concentrations from polymer emissions
Compartment (units) Log Kow = 6 Log Kow = 10Surface water (mg/l) 7.98x10⁻⁵ 1.13x10⁻⁴
Sea water (mg/l) 7.87x10⁻⁶ 1.11x10⁻⁵
Air (mg/m3) 2.74x10⁻¹⁰ 3.74x10⁻¹⁰
Natural soil (mg/kg) 1.32x10⁻⁴ 1.61x10⁻⁴
Soil pore water (mg/l) 2.49x10⁻⁴ 3.33x10⁻⁴
The change in concentration in all compartments is less than a factor of two for the four orderof magnitude change in the log Kow value.

94
Appendix 7 – Contribution of use areas to overall emissions
Table A7.1 presents the estimated emissions to the regional model from each of the use areasaccording to the various scenarios. All emissions in the table are total emissions, i.e. thecombined value for all compartments. For PFOS-salts these are the direct emissions. ForPFOS-substances, these are the emissions estimated based on the various assumptions aboutthe rate of degradation to PFOS-salt. The same is true for the PFOS-polymer contributionswhere relevant. The percentage which each source contributes to the total emission is alsogiven.
Table A7.1 Summary of Emissions based on Scenarios
Use Regional release(kg/year) Percentage
Scenario 1 – PFOS-saltChrome plating 1000 94.4Photography (film production) 0.71 0.07Aviation 1.46 0.14Fire fighting foams 57 5.4Scenario 2 – PFOS-salt plus instant release of PFOS-substanceChrome plating 1000 48.8Photography (film production) 0.71 0.03Aviation 1.46 0.05Fire fighting foams 57 2.8PFOS-substances (total) of which: 991 48.3
Photolithography 23.5 1.2Photography (developing) 0.71 0.03Textiles (treatment) 3.2 0.16Textiles (service life) 169.5 8.3Paper treatment 753 36.7Coatings 42.5 2.1
Scenario 3 – PFOS-salt plus PFOS-substance with 20.5 day half lifeChrome plating 1000 61.5Photography (film production) 0.71 0.04Aviation 1.46 0.09Fire fighting foams 57 3.5PFOS-substances (total) of which: 568 34.9
Photolithography 13.6 0.84Photography (developing) 0.4 0.02Textiles (treatment) 1.8 0.11Textiles (service life) 97.1 6.0Paper treatment 431 26.5Coatings 24.4 1.5
Scenario 4 – PFOS-salt plus PFOS-substance with 1 yr half lifeChrome plating 1000 67.1Photography (film production) 0.71 0.05Aviation 1.46 0.10Fire fighting foams 57 3.8PFOS-substances (total) of which: 431 28.9
Photolithography 10.3 0.7Photography (developing) 0.3 0.02Textiles (treatment) 1.38 0.09Textiles (service life) 73.7 5.0Paper treatment 327 21.9Coatings 18.5 1.2

95
Scenario 5 - PFOS-salt plus PFOS-substance with 20.5 day half life plus PFOS-polymerChrome plating 1000 24.1Photography (film production) 0.71 0.02Aviation 1.46 0.04Fire fighting foams 57 1.4PFOS-substances (total) of which: 568 13.7
Photolithography 13.6 0.33Photography (developing) 0.4 0.01Textiles (treatment) 1.8 0.04Textiles (service life) 97.1 2.3Paper treatment 431 10.4Coatings 24.4 0.6
PFOS-polymer (total) of which: 2517 60.7Textile (treatment) 46 1.1Textiles (service life) 2471 59.6
Scenario 6 – PFOS-salt plus PFOS-substances with 20.5 day half life plus PFOS-polymers for current usesChrome plating 1000 27.5Photography (film production) 0.71 0.02Aviation 1.46 0.04Fire fighting foams 57 1.6PFOS-substances (total) of which: 119 3.3
Photolithography 14.5 0.4Photography (developing) 0.43 0.01Textiles (treatment) 104 2.9
PFOS-polymer (textile service life) 2454 67.6Scenario 7 – PFOS-salts plus PFOS-substances with 20.5 day half life for continuing usesChrome plating 1000 98.4Photography (film production) 0.71 0.07Aviation 1.46 0.14PFOS-substances (total) of which: 14.5 1.4
Photolithography 14.1 1.4Photography (developing) 0.4 0.04

96
Appendix 8 - Effect of varying solubility and air-water partitioning values for PFOS-salt
The following calculations were performed using the emissions from Scenario 1, i.e.emissions of PFOS-salt only. The property values from Table 3.14 were used for allproperties except solubility, where the two values of 519 mg/l (as in Table 3.14) and 680 mg/lwere used. For these two calculations the air-water partition coefficient was3.19x10-4 Pa m3 mole-1 (1.35x10⁻⁷ dimensionless). A further calculation using a Henry’s lawconstant of 2x10⁻⁶ (dimensionless) and the solubility of 680 mg/l was carried out. Theresulting concentrations in water are presented in the table.
Concentration in water (mg/l)Use area sol = 519 mg/l sol = 680 mg/l Ka-w = 2x10⁻⁶
Chromium plating 4.52x10⁻⁵ 4.52x10⁻⁵ 4.52x10⁻⁵
Photography - formulation 1.21x10⁻⁴ 1.21x10⁻⁴ 1.21x10⁻⁴
Aviation 9.28x10⁻⁵ 9.28x10⁻⁵ 9.28x10⁻⁵
Fire fighting foams - formulation 0.0973 0.0973 0.0973- use A 0.0285 0.0285 0.0285- use B 0.0411 0.0411 0.0411
Regional 3.87x10⁻⁵ 3.87x10⁻⁵ 3.87x10⁻⁵
Variation in the values of these properties over these ranges has no impact on the predictedconcentrations.