standardized ileal digestible threonine requirement for
TRANSCRIPT
1
Standardized ileal digestible threonine requirement for broilers
J.W. Spek
Wageningen Livestock Research
CVB Documentation report nr. 64 June 2018
https://doi.org/10.18174/455514
Wageningen Livestock Research P.O. Box 338 6700 AH Wageningen The Netherlands
2
Federatie Nederlandse Diervoederketen 2017 No part of this edition may be copied, photocopied, reproduced, translated or reduced to any electronic medium or machine-readable form, in whole or in part, without specific written permission of the Federatie Nederlandse Diervoederketen ([email protected]). All copyrights and database rights with respect to this publication are expressly reserved. Nothing in this publication may be reproduced, copied, retrieved, made public or re-used or made available in any way whatsoever to third parties by way of printing, photocopying, microfilm or in any other way unless the Federatie Nederlandse Diervoederketen has given express written permission to do so. This publication has been compiled with great care; however, the Federatie Nederlandse Diervoederketen and Wageningen Livestock Research cannot be held liable in any way for the consequences of using the information in this publication.
3
Preface In 2017 a new Table has been introduced called; Table ‘Standardized ileal digestibility of amino acids in feedstuffs for poultry’ and has been described in the CVB Documentation report nr. 61. As a feed evaluation system has two pillars – the supply of nutrients by the diet on the one hand and the requirement for these nutrients by the animals on the other hand (both expressed in the same units) – it was also necessary to also update and express the amino acid requirements on a standardized ileal digestibility (SID) basis. Therefore a large meta-analysis dataset was constructed from studies in which amino acid requirements in broilers were estimated. The SID amino acid concentrations of the diets used in the studies were recalculated based on the new CVB SID amino acid Table (CVB Documentation report nr. 61) and requirements of SID amino acids were subsequently estimated. The results of this meta-analysis for standardized ileal digestible threonine (SID-THR) are presented in the present CVB Documentation report. Compared to the former CVB apparent faecal digestible THR recommendation for broilers described in CVB Documentation report nr. 18 and published in 1996 the present established SID-THR amino acid recommendations for broilers are:
1. Based on a substantial larger dataset of requirement studies 2. Based on studies with modern broiler types in the period 1990 – 2017 3. Based on standardized ileal digestible amino acid values in feedstuffs instead of
apparent faecal digestible amino acid values. The in this report estimated requirement of SID-THR will be incorporated in the Dutch CVB Tabellenboek Veevoeding Pluimvee 2018 and in the English version CVB Table Poultry Nutrition 2018. This study was guided and assessed by the Technical Committee of CVB Wageningen, June 2018 J.W. Spek
4
Members of the Technical Committee of the CVB M. Rijnen (chair) Nederlandse Vereniging Diervoederindustrie (Nevedi) J. Fledderus Nederlandse Vereniging Diervoederindustrie (Nevedi) B. Boswerger Nederlandse Vereniging Diervoederindustrie (Nevedi) A. Dijkslag Nederlandse Vereniging Diervoederindustrie (Nevedi) H. van Laar Nederlandse Vereniging Diervoederindustrie (Nevedi) K. Geerse Nederlandse Vereniging Diervoederindustrie (Nevedi) D. van Manen Overleggroep Producenten Natte Veevoeders (OPNV) J. van der Staak Land- en Tuinbouworganisatie Nederland (LTO) H. Korterink Nederlandse Vereniging van Handelaren in Stro, Fourages en Aanverwante Producten (HISFA) A. van de Ven Nederlandse Vereniging Diervoederindustrie (Nevedi) C. van Vuure MVO, ketenorganisatie voor oliën en vetten G. van Duinkerken Wageningen Livestock Research, Dept. Animal Nutrition, Wageningen J.W. Spek Wageningen Livestock Research, Dept. Animal Nutrition, Wageningen
5
Contents
Table of Contents Page Preface ..................................................................................................................... 3 Members of the Technical Committee of the CVB ................................................................. 4 Contents ..................................................................................................................... 5 Abbreviations ..................................................................................................................... 6 1 Introduction ..................................................................................................... 7 2 Materials and Methods ................................................................................... 8 3 Results and Discussion .................................................................................. 9 4 Conclusions ...................................................................................................14 List of studies included in the meta-analysis .........................................................................15 References ....................................................................................................................15 Appendix A. Relationship between dietary SID-THR supply and performance parameters
FCR and BWG for the various titration trials. .................................................16 Appendix B. SID-THR model estimates using the quadratic broken-line model for minimum
FCR and maximum BWG ..............................................................................29
6
Abbreviations AA Amino acids AFD Apparent faecal digestible ARG Arginine BWG Body weight gain CP Crude protein FCR Feed conversion ratio ILE Isoleucine LYS Lysine ME Metabolic energy MET Methionine M+C Methionine plus Cysteine N Number R2 Coefficient of determination Req Requirement SID Standardized ileal tract digestible Std. Dev. Standard deviation Std. Err. Standard error THR Threonine TRP Tryptophan VAL Valine
7
1 Introduction In 2012 a large meta-analysis was carried out by Veldkamp and others in order to determine the dietary requirements for standardized ileal tract digestible (SID) amino acids (AA) for broilers. This study resulted in a report published by Veldkamp et al. (2016). Before the start of this meta-analysis by Veldkamp et al. another large meta-analysis was carried out in order to determine the SID-AA levels for the various feed ingredients. This meta-analysis resulted in a CVB table with SID-AA concentrations for the various feed ingredients and this Table was used by Veldkamp et al. (2016) in order to recalculate the dietary SID-AA levels for the individual AA titration studies in order to estimate AA requirements. However, in 2017 this CVB Table has been updated with new data published in the years between 2012 and 2017 as there were questions about the SID cysteine digestibility value for soybean meal. As a result, not only the SID-AA values for soybean meal have been updated but also for other feedstuffs. As a consequence it was necessary to recalculate all the diets used in the AA titration studies that Veldkamp et al. (2016) used to determine AA requirements. In this CVB documentation report the results of estimated dietary SID threonine (SID-THR; %) requirements are presented that are based on the new Table values as presented in CVB documentation report nr. 61. Furthermore, the dataset used by Veldkamp et al. has been extended with new studies that were not included in the study of Veldkamp et al.. This resulted in a dataset that is substantially larger than the dataset used by Veldkamp. The SID-THR requirements of the individual titration trials were estimated using a quadratic broken line model. This model was also used in estimation of SID-lysine requirements in the individual lysine titration trials as described in CVB documentation report nr. 62.
8
2 Materials and Methods Threonine titration studies were selected from literature (1989 – 2017) in which only the dietary THR content was varied by means of addition of graded levels of dietary synthetic threonine. Furthermore, only those titration studies were selected in which non-test apparent digestible amino acid levels of the basal diet (diet with the lowest THR content) did not come below 10% of the recommended CVB (2012) levels and where dietary digestible THR levels of the basal diets where at least 20% below the recommended CVB (2012) level. Furthermore, performance characteristics such as body weight gain (BWG: g/d) and feed conversion ratio (FCR; g feed : g BWG) had to be recorded and information with respect to dietary composition, sex, age of the broilers and duration of the experiment had to be provided in the studies. Requirements were estimated using a quadratic broken-line model. The quadratic broken line model is as follows: If (SID-THR (%) < R) then BWG or FCR = L + U × (R – SID-THR)^2; Else BWG or FCR = L + U × 0; Where: L = plateau value for BWG or FCR R = break-point value for SID-THR (%) U = slope value, representing the increase in BWG or decrease in FCR per unit increase in dietary SID-THR. As THR requirements are normally expressed as a percentage of lysine (LYS) requirement the estimated SID-THR requirements of the individual THR titration trials were expressed as a percentage of SID-LYS level. The SID-LYS level was in a number of cases the SID-LYS level used in the THR titration studies. However, in a number of cases the SID-LYS levels used in the THR titration studies were larger than the SID-LYS requirements as predicted from the factors mean age of the birds and the dietary ME value as described in the prediction formulas F.5. and F.9. in CVB documentation report nr. 62. In those cases where the SID-LYS levels used in the THR titration studies were larger than the SID-LYS requirements as predicted from the prediction formula for SID-LYS requirements in CVB documentation report nr. 62 the predicted SID-LYS requirement levels using formulas F.5. (for BWG) and F.9. (for FCR) were used for the calculation of the SID-THR : SID-LYS ratios (SID-THR:LYS) of the individual experiments. Via the PROC MIXED procedure of SAS the estimated SID-THR:LYS requirements for BWG and FCR were regressed against factors such as age, sex and the dietary factors CP, ME and CP : ME ratio with study effect included as a random factor. Furthermore, non-test SID-AA : SID-LYS ratios were calculated and it was checked whether some of the non-test SID AA negatively affected the estimated SID-THR:LYS levels.
9
3 Results and Discussion In Table 1 a summary of the total dataset is given. The dataset consisted of 13 studies with in total 25 titration trials and 140 observations. Table 1. Summary of the total dataset
N Mean Std. Dev.
Minimum Maximum
ME Recalculated (kcal/kg) 140 3110 131.1 2620 3238 ME Publication (kcal/kg) 140 3148 61.9 2945 3201 CP Recalculated (%) 140 20 1.7 17 22 CP Publication (%) 140 20 2.3 17 24 Year 140 2005 4.8 1996 2015 Starting age (d) 140 12 10.1 1 30 Duration (d) 140 18 3.7 6 21 finishing age (d) 140 30 11.9 7 42 BWG (g/d) 140 52.5 23.17 17.8 91.7 FCR 140 1.681 0.4026 1.060 4.160
In Appendix A for each titration trial the relationship between dietary SID-THR supply and FCR between dietary SID-THR and BWG is presented graphically together with the estimated SID-THR requirements. In Appendix B the estimated quadratic broken-line model parameters for each titration trial is given. For a number of titration trials (5 titration trials for FCR and 3 titration trials for BWG) it was not possible to estimate reliable or unique SID-THR requirements. The estimated SID-THR:LYS requirement ratios for BWG and FCR were not significantly related to sex, age, dietary protein concentration, and dietary ME. The average estimated SID-THR:LYS ratios for the remaining 20 SID-THR:LYS requirement observations for FCR and the 22 SID-THR:LYS requirement observations for BWG were: SID-THR:LYS for BWG = 62.9±8.20 % (average ± Std. dev.) SID-THR:LYS for FCR = 60.6±8.64 % (average ± Std. dev.) Furthermore, there was one outlier SID-THR requirement estimate value that deviated more than two standard deviations from the average estimated SID-THR requirement estimate for both BWG and FCR. This was an observation from the study of Corzo et al. (2009). When removing this outlier value the average estimated SID-THR:LYS requirement ratios for the remaining 19 FCR trials and 21 BWG trials were: SID-THR:LYS for BWG = 61.8±6.65 % (average ± St. dev.) SID-THR:LYS for FCR = 59.6±7.38 % (average ± St. dev.) There were some studies that contained a large number of titration trials whereas some studies contained only one titration trial. This results in average calculated SID-THR:LYS requirement ratios for BWG and FCR that are strongly influenced by the studies containing a large number of titration trials. In order to weigh the estimated SID-THR:LYS ratios from each study equally it is possible to take into account the effect of study. When this is done (using the PROC MIXED procedure of SAS and by including study as a random effect in the model) the estimated SID-THR:LYS ratios for BWG and FCR became: SID-THR:LYS for BWG = 66.5±3.17% (estimate ± St. error) SID-THR:LYS for FCR = 63.7±3.01 % (estimate ± St. error)
10
The exercise of estimating SID-THR:LYS requirement ratios for BWG and FCR in which each study is equally weighted was now repeated but in this case the outlier observation from the study of Corzo et al. (2009) was excluded. When this was done (by using the PROC MIXED procedure of SAS and including study as a random effect in the model) the estimated SID-THR:LYS requirement ratios for BWG and FCR became: SID-THR:LYS for BWG = 64.4±2.67% (estimate ± St. error) SID-THR:LYS for FCR = 62.0±2.72 % (estimate ± St. error) In Table 2 the dietary non-test SID-AA : estimated SID-LYS requirements ratios using the quadratic broken-line procedure for FCR and BWG are given together with the recommended CVB apparent faecal digestible (AFD) ratios. Results in Table 2 show that on average the estimated SID-THR requirement estimates were not negatively impacted by limiting non-test AA levels although in a number of trials some non-test AA levels could have had a negative impact on estimated SID-THR levels as a comparison between recommended CVB ratios and minimal ratios for both FCR and BWG observed in this study show. However, a visual inspection of graphs in which the various AA:LYS ratios were plotted against estimated SID-THR:LYS requirement did not show that the low non-test SID-AA levels negatively impacted the estimated SID-THR:LYS requirements. Table 2. Dietary non-test SID-AA : SID-LYS ratios.
Rec. CVB AFD ratio
FCR
BWG
Ratio Mean St.dev Min Max
Mean St.dev Min Max
M+C:LYS 65 78 5.6 71 95
80 5.3 75 100
TRP:LYS 16 18 1.6 16 20
18 1.5 16 21
ILE:LYS 66 69 3.8 64 77
70 4.1 64 79
ARG:LYS 105 134 28.3 99 184
140 30.0 99 184
VAL:LYS 80 79 5.2 68 95
81 5.2 68 100
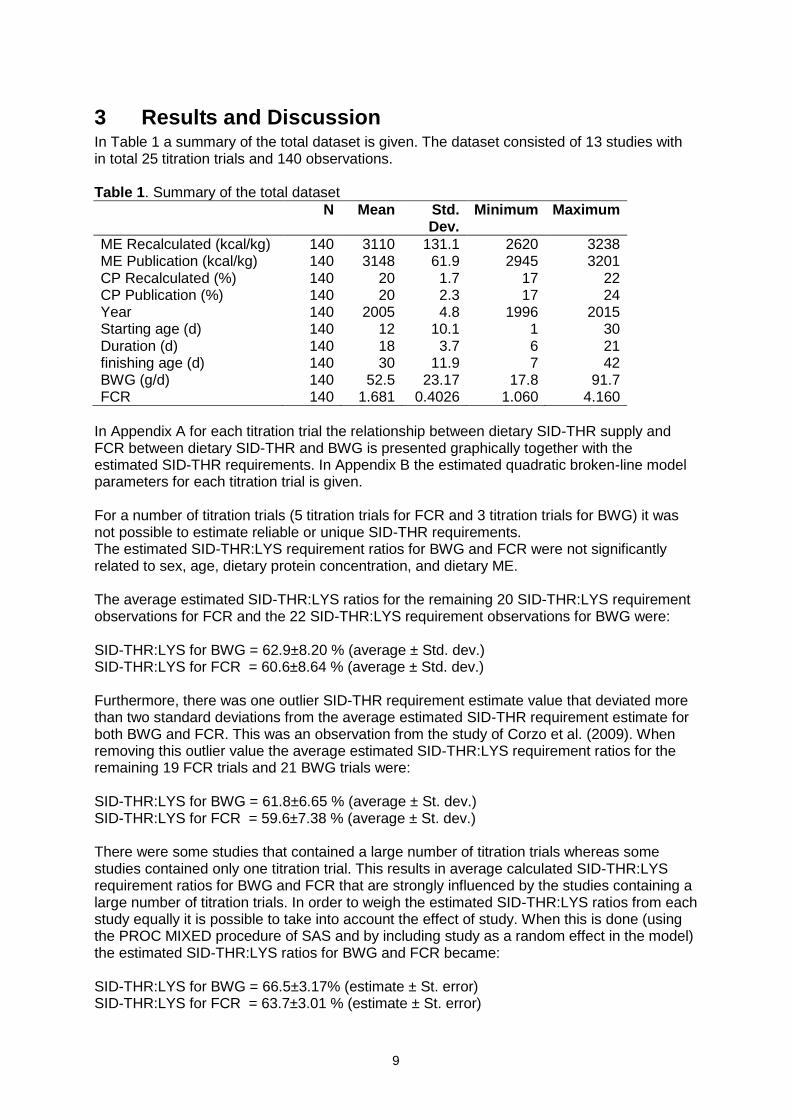
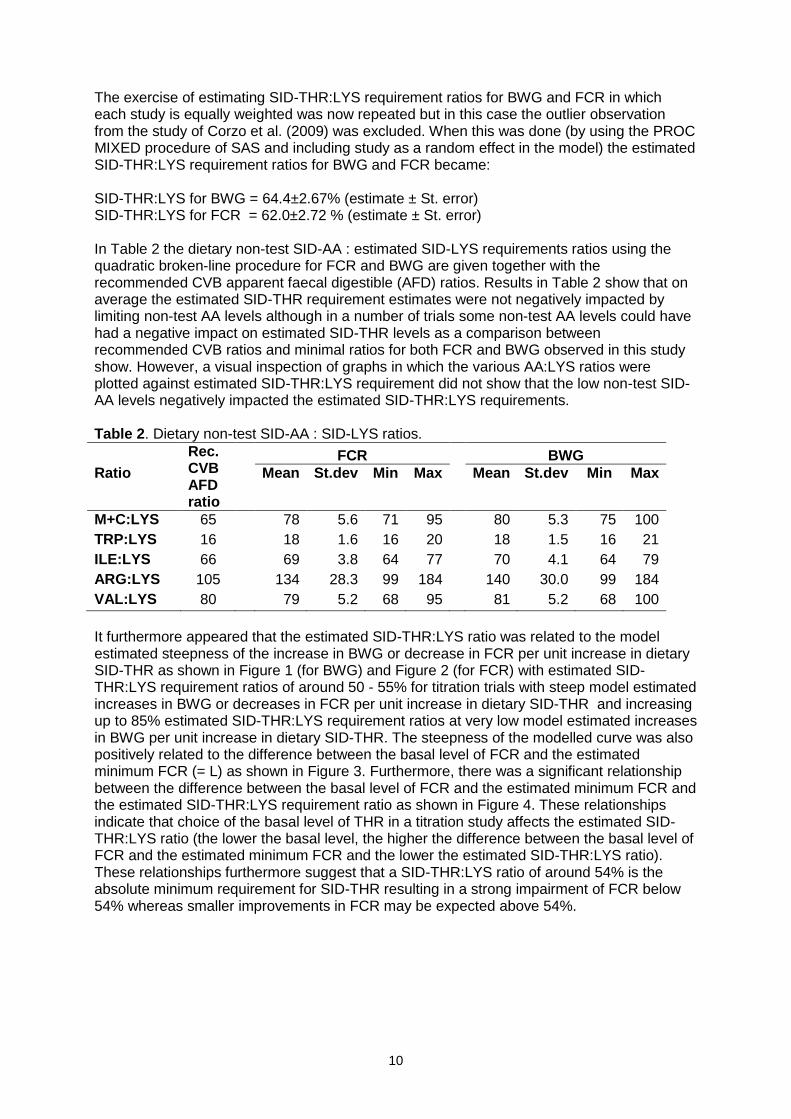
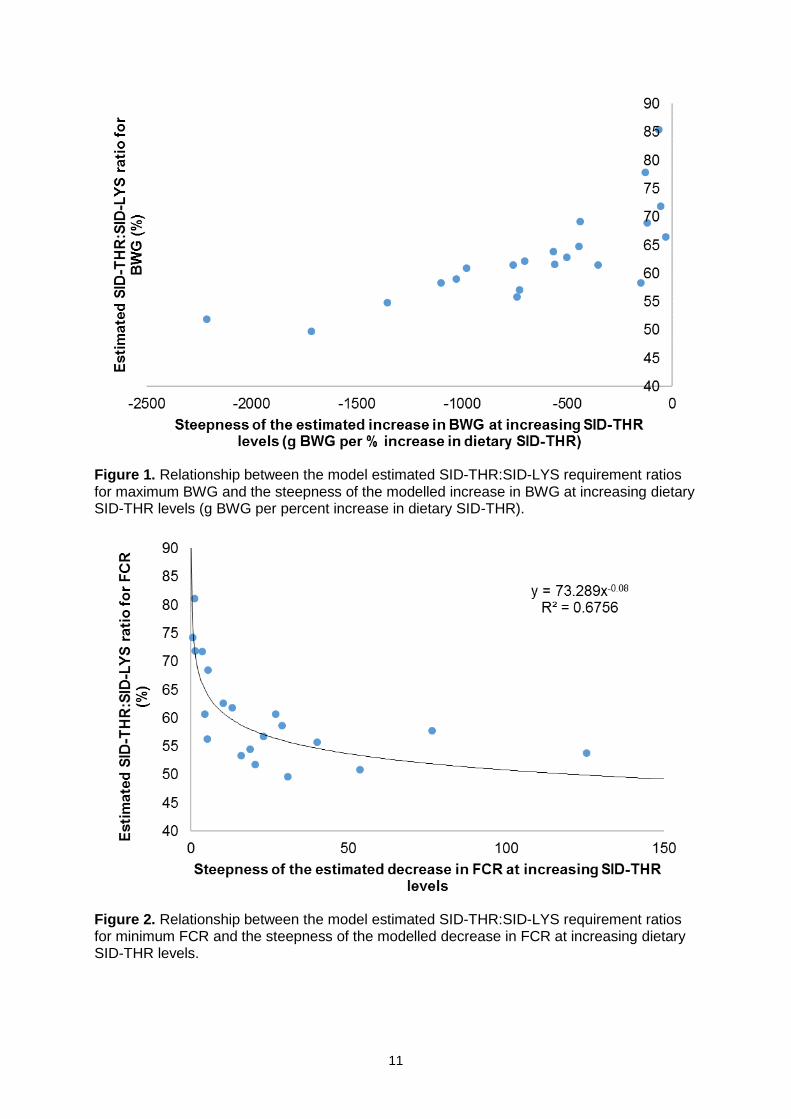
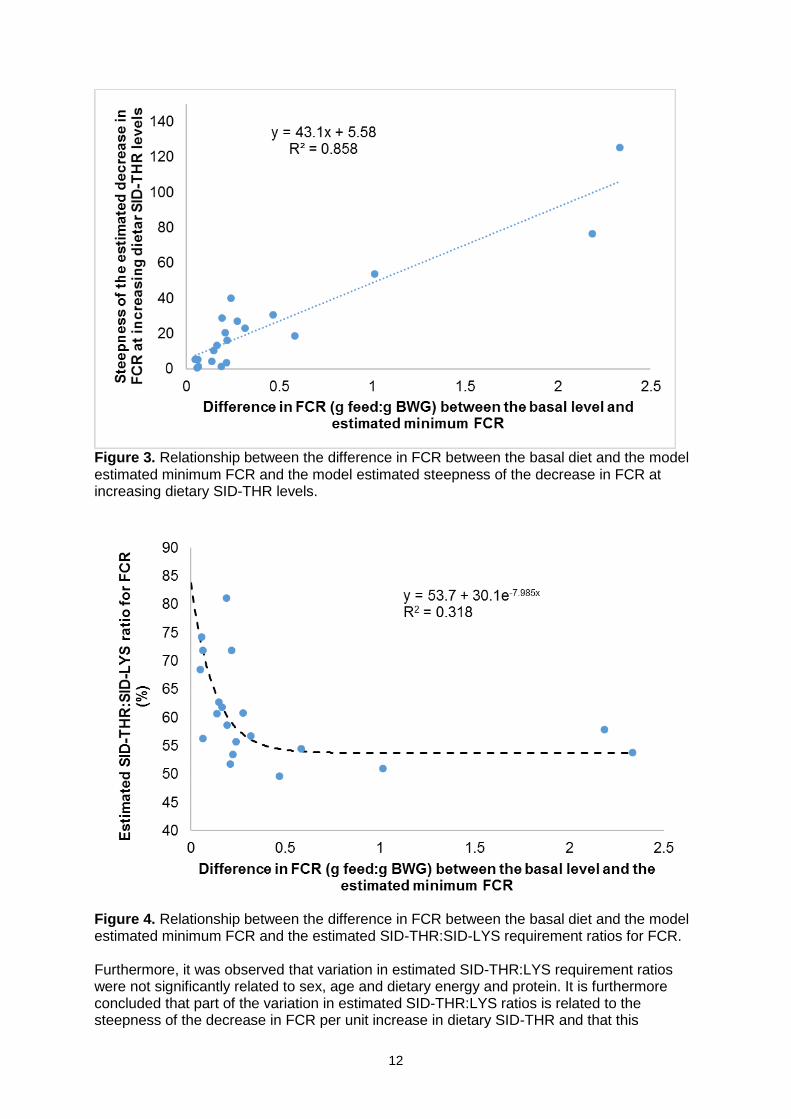
It furthermore appeared that the estimated SID-THR:LYS ratio was related to the model estimated steepness of the increase in BWG or decrease in FCR per unit increase in dietary SID-THR as shown in Figure 1 (for BWG) and Figure 2 (for FCR) with estimated SID-THR:LYS requirement ratios of around 50 - 55% for titration trials with steep model estimated increases in BWG or decreases in FCR per unit increase in dietary SID-THR and increasing up to 85% estimated SID-THR:LYS requirement ratios at very low model estimated increases in BWG per unit increase in dietary SID-THR. The steepness of the modelled curve was also positively related to the difference between the basal level of FCR and the estimated minimum FCR (= L) as shown in Figure 3. Furthermore, there was a significant relationship between the difference between the basal level of FCR and the estimated minimum FCR and the estimated SID-THR:LYS requirement ratio as shown in Figure 4. These relationships indicate that choice of the basal level of THR in a titration study affects the estimated SID-THR:LYS ratio (the lower the basal level, the higher the difference between the basal level of FCR and the estimated minimum FCR and the lower the estimated SID-THR:LYS ratio). These relationships furthermore suggest that a SID-THR:LYS ratio of around 54% is the absolute minimum requirement for SID-THR resulting in a strong impairment of FCR below 54% whereas smaller improvements in FCR may be expected above 54%.
11
Figure 1. Relationship between the model estimated SID-THR:SID-LYS requirement ratios for maximum BWG and the steepness of the modelled increase in BWG at increasing dietary SID-THR levels (g BWG per percent increase in dietary SID-THR).
Figure 2. Relationship between the model estimated SID-THR:SID-LYS requirement ratios for minimum FCR and the steepness of the modelled decrease in FCR at increasing dietary SID-THR levels.
12
Figure 3. Relationship between the difference in FCR between the basal diet and the model estimated minimum FCR and the model estimated steepness of the decrease in FCR at increasing dietary SID-THR levels.
Figure 4. Relationship between the difference in FCR between the basal diet and the model estimated minimum FCR and the estimated SID-THR:SID-LYS requirement ratios for FCR. Furthermore, it was observed that variation in estimated SID-THR:LYS requirement ratios were not significantly related to sex, age and dietary energy and protein. It is furthermore concluded that part of the variation in estimated SID-THR:LYS ratios is related to the steepness of the decrease in FCR per unit increase in dietary SID-THR and that this
13
steepness is affected by the choice of the basal level of SID-THR in the diet (the lower the basal level, the higher the difference between FCR at the basal level and the estimated plateau level, the steeper the decrease in in FCR per unit increase in dietary SID-THR, and the lower the estimated SID-THR:LYS requirement ratio). It is therefore difficult to decide what the optimal dietary SID-THR:LYS ratio is. Because of this difficulty it might be most prudent to base the dietary SID-THR:LYS ratio recommendation on the complete dataset of SID-THR trials and correct for a (random) study effect. This results in the following recommendations: SID-THR:LYS for BWG = 64.4±2.67% (estimate ± St. error) SID-THR:LYS for FCR = 62.0±2.72 % (estimate ± St. error)
14
4 Conclusions Based on the results of this study it is concluded that it is most prudent to base dietary SID-THR:LYS requirement ratios on the complete dataset of SID-THR trials and correct for a (random) study effect. This results in the following SID-THR:LYS requirements: SID-THR:LYS for BWG = 64% SID-THR:LYS for FCR = 62%
15
List of studies included in the meta-analysis Ayasan, T., F. Okan, and H. Hizli. 2009. Threonine requirement of broiler from 22-42 days.
International Journal of Poultry Science 8(9):862-865. Çiftci, I. and N. Ceylan. 2004. Effects of dietary threonine and crude protein on growth
performance, carcase and meat composition of broiler chickens. British Poultry Science 45(2):280-289.
Corzo, A., W. A. Dozier Iii, R. E. Loar Ii, M. T. Kidd, and P. B. Tillman. 2009. Assessing the threonine-to-lysine ratio of female broilers from 14 to 28 days of age. Journal of Applied Poultry Research 18(2):237-243.
Corzo, A., M. T. Kidd, W. A. Dozier Iii, G. T. Pharr, and E. A. Koutsos. 2007. Dietary threonine needs for growth and immunity of broilers raised under different litter conditions. Journal of Applied Poultry Research 16(4):574-582.
Corzo, A., M. T. Kidd, and B. J. Kerr. 2003. Threonine need of growing female broilers. International Journal of Poultry Science 2(6):367-371.
Dozier, W. A., K. J. Meloche, P. B. Tillman, and Z. Jiang. 2015. Growth performance of male broilers fed diets varying in digestible threonine to lysine ratio from 1 to 14 days of age1. Journal of Applied Poultry Research 24(4):457-462.
Duarte, K. F., O. M. Junqueira, R. S. Filardi, J. C. de Siqueira, E. A. Garcia, and A. C. de Laurentiz. 2012. Threonine requirements of 22 to 42-day-old broilers. Revista Brasileira de Zootecnia 41(1):72-79.
Kidd, M. T., A. Corzo, D. Hoehler, B. J. Kerr, S. J. Barber, and S. L. Branton. 2004. Threonine needs of broiler chickens with different growth rates. Poultry Science 83(8):1368-1375.
Kidd, M. T., B. J. Kerr, J. D. Firman, and S. D. Boling. 1996. Growth and carcass characteristics of broilers fed low-protein, threonine-supplemented diets. Journal of Applied Poultry Research 5(2):180-190.
Mack, S., D. Bercovici, G. De Groote, B. Leclercq, M. Lippens, M. Pack, J. B. Schutte, and S. Van Cauwenberghe. 1999. Ideal amino acid profile and dietary lysine specification for broiler chickens of 20 to 40 days of age. British Poultry Science 40(2):257-265.
Mehri, M., H. Nassiri-Moghaddam, H. Kermanshahi, and M. Danesh-Mesgaran. 2010. Digestible threonine needs of straight-run broiler during the growing period. Journal of Animal and Veterinary Advances 9(16):2190-2193.
Neto, R. C. L., F. G. P. Costa, R. L. Furlan, P. E. N. Givisiez, C. C. Goulart, C. F. S. Oliveira, S. A. N. Morais, R. M. Bezerra, and M. R. Lima. 2012. Levels of digestible threonine for male broilers from 1 to 7 days of age. Journal of Applied Poultry Research 21(4):757-763.
Rosa, A. P., G. M. Pesti, H. M. Edwards Jr, and R. I. Bakalli. 2001. Threonine requirements of different broiler genotypes. Poultry Science 80(12):1710-1717.
References Blok and Dekker. 2017. Table ‘Standardized ileal digestibility of amino acids in feedstuffs for
poultry’. CVB Documentation report nr. 61. Spek, J.W. 2018. Standardized ileal digestible lysine requirement for broilers. CVB
Documentation report n. 62. Veldkamp, T., J.W. van Riel, R.A. Dekker, S. Khalaji, V. Khaksar, H. Hashemipour, M.M. van
Krimpen, and M.C. Blok. 2016. Estimating requirement values for apparent faecal digestible and standardised ileal digestible threonine in broilers by a meta-analysis approach.
16
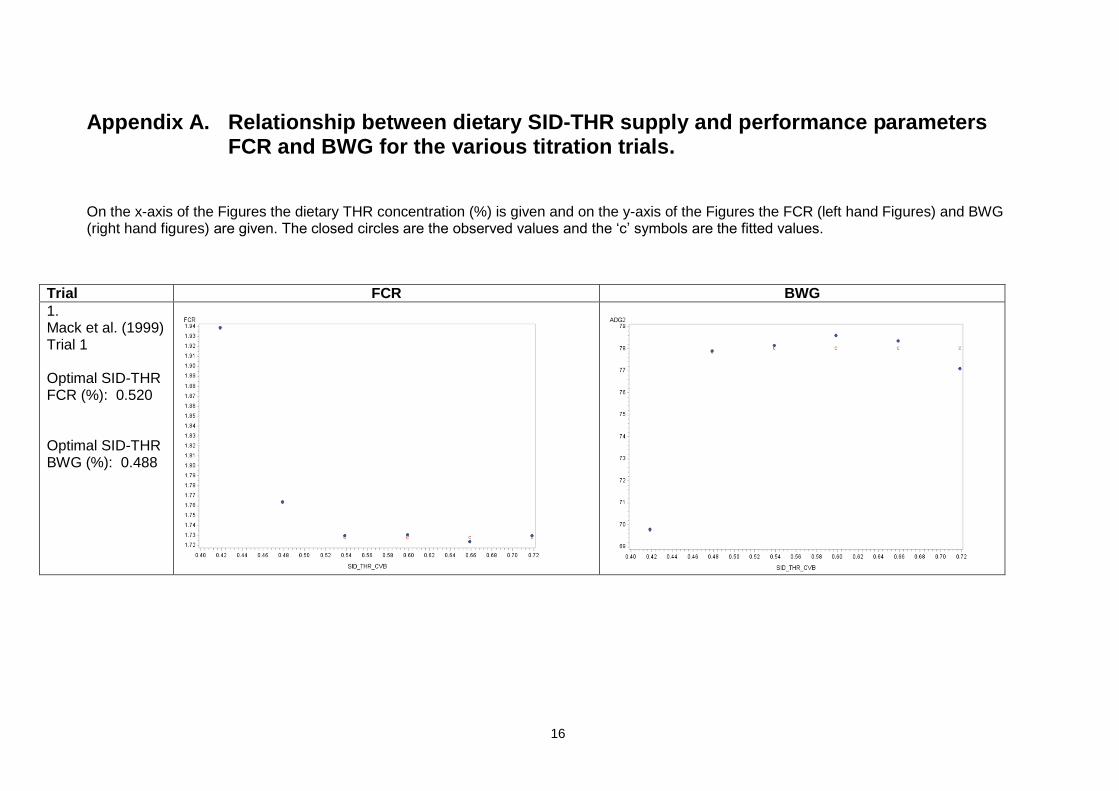
Appendix A. Relationship between dietary SID-THR supply and performance parameters FCR and BWG for the various titration trials.
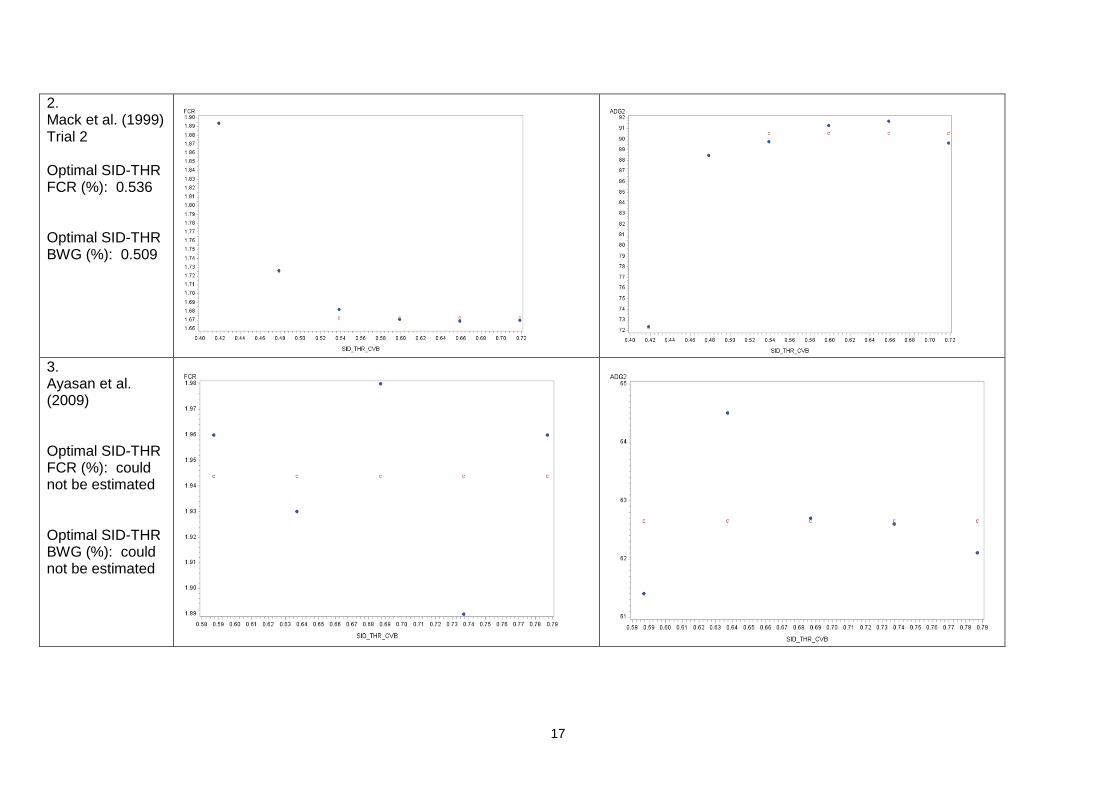
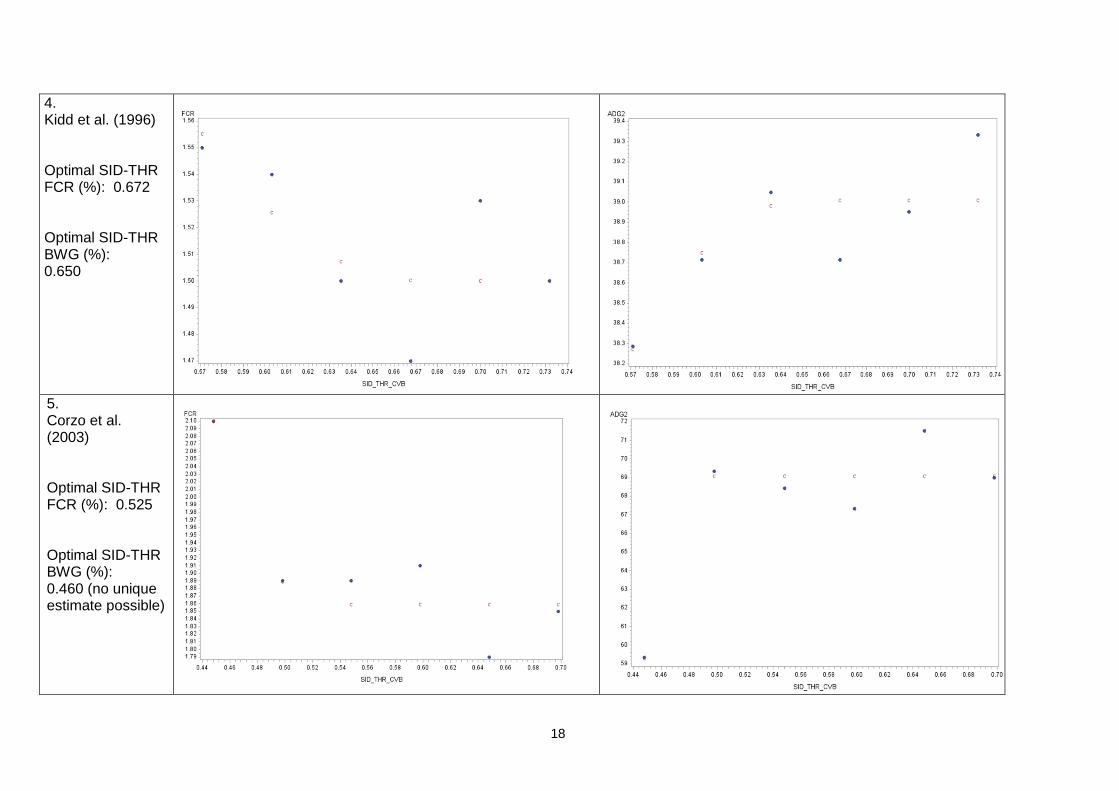
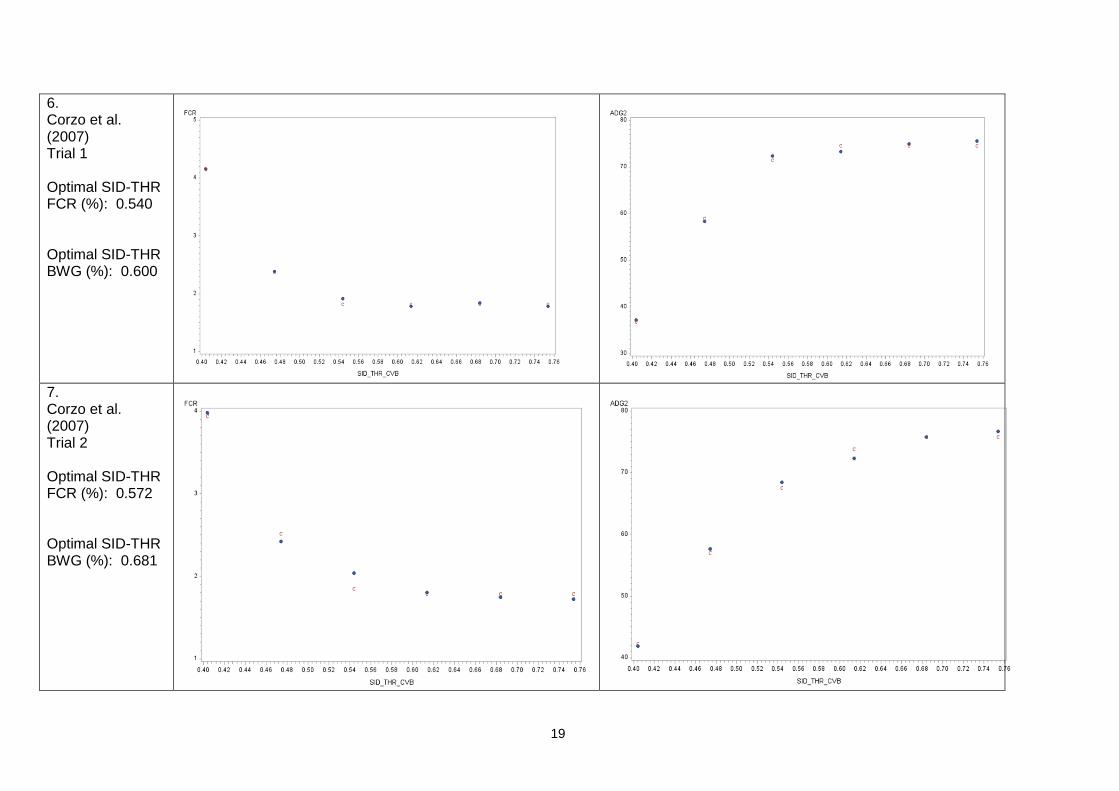
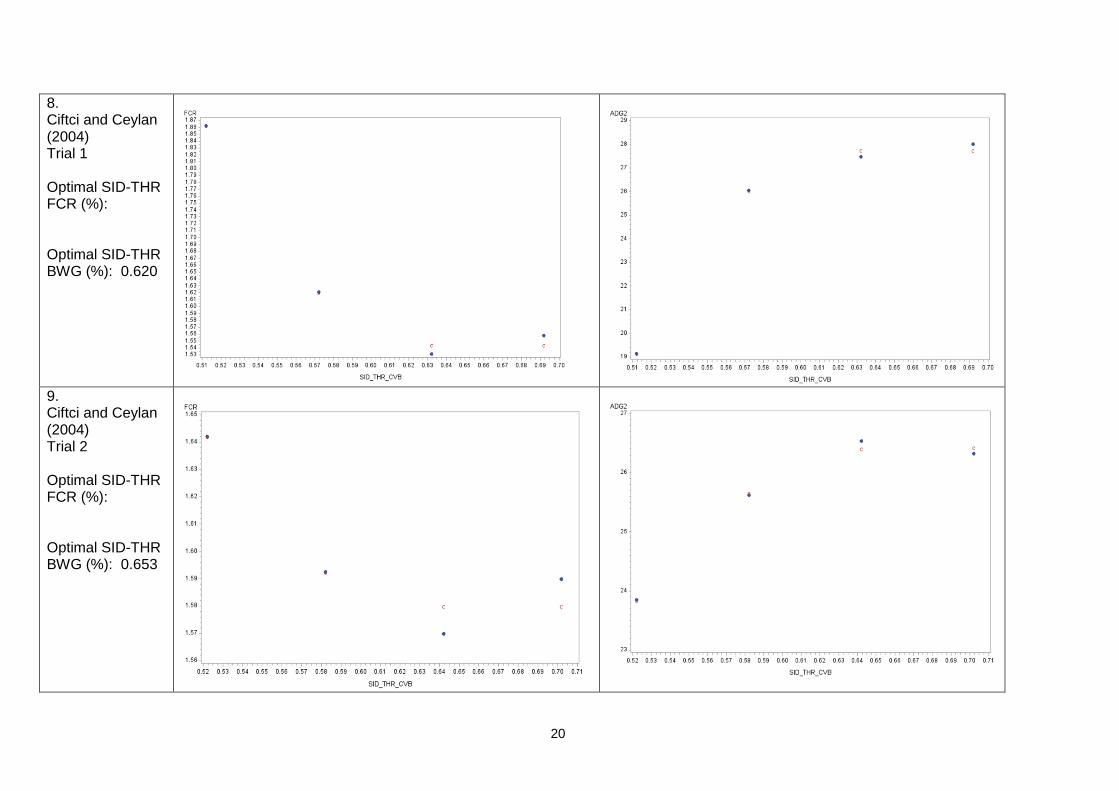
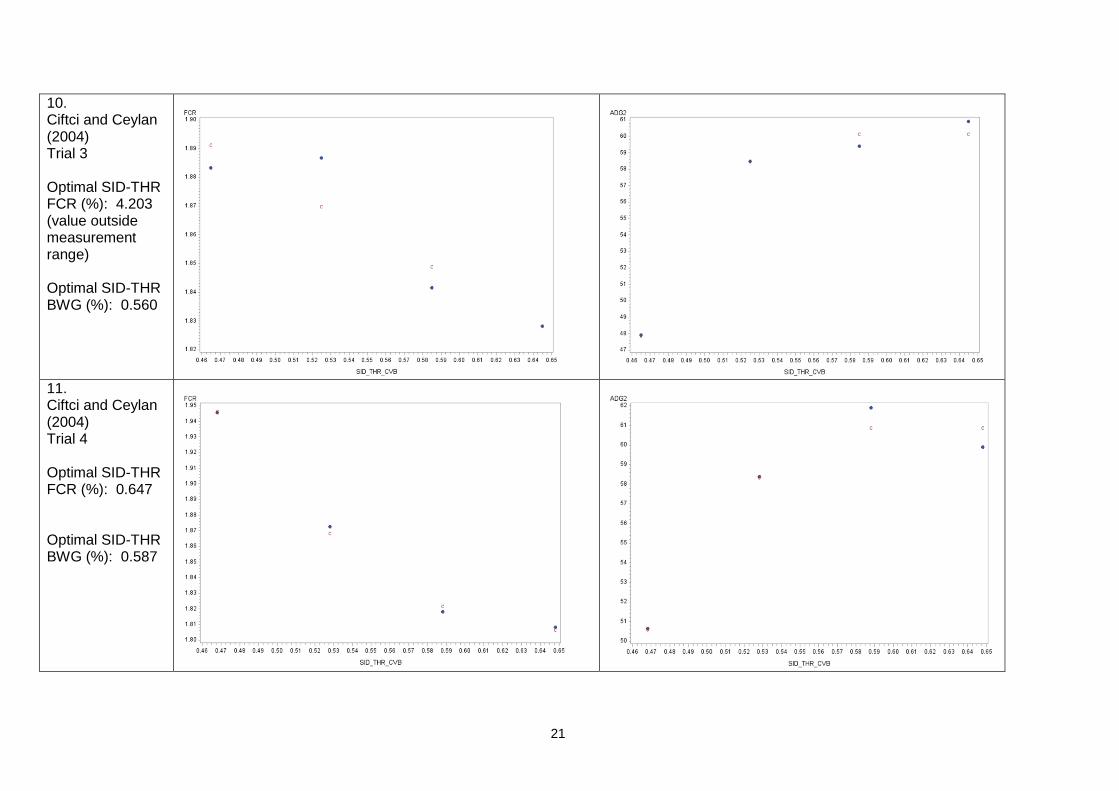
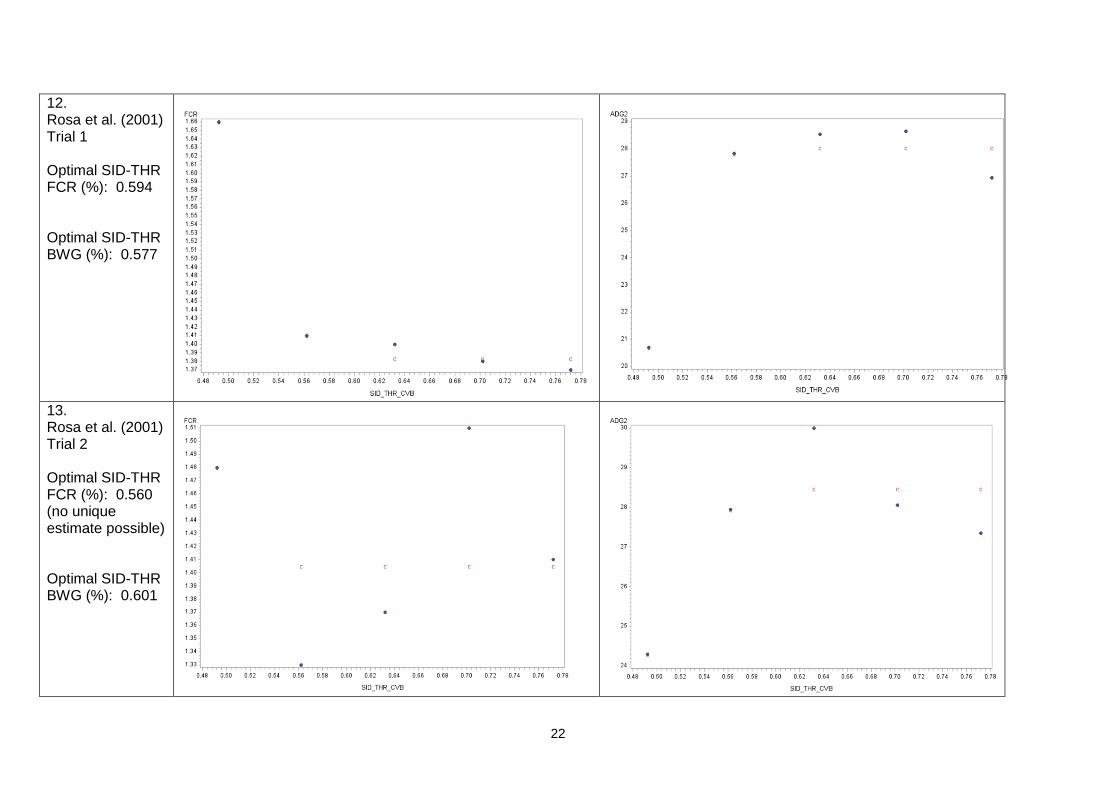
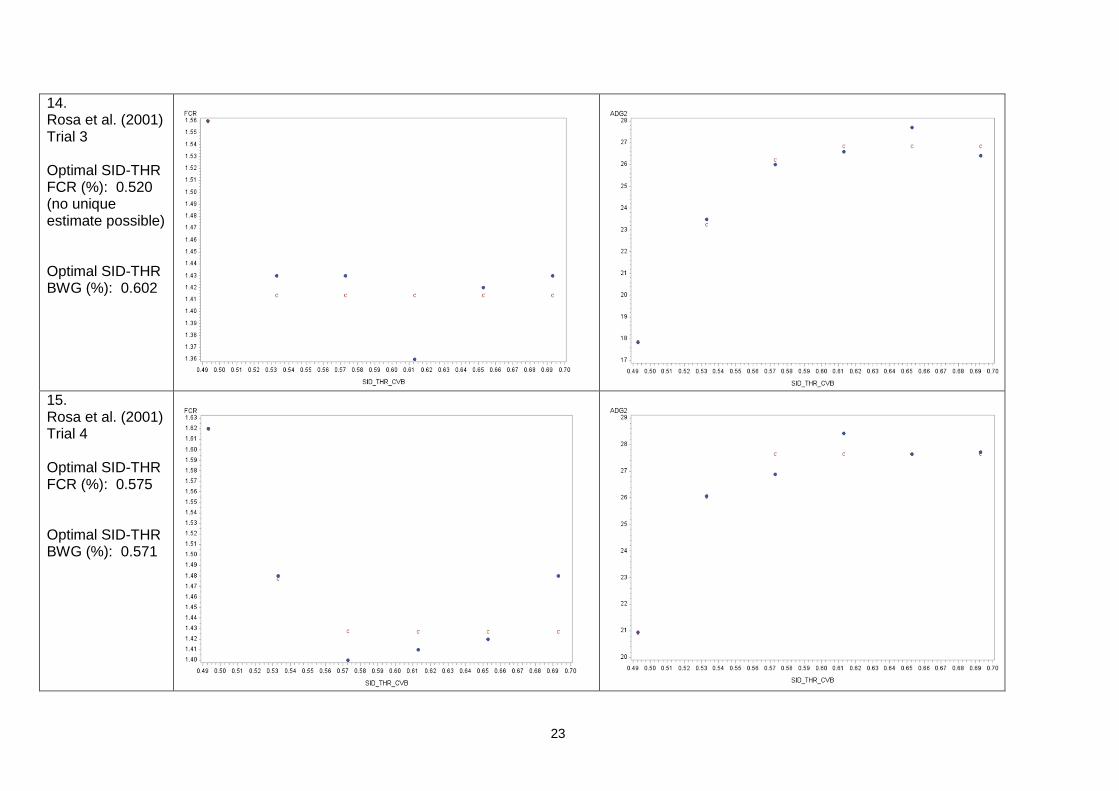
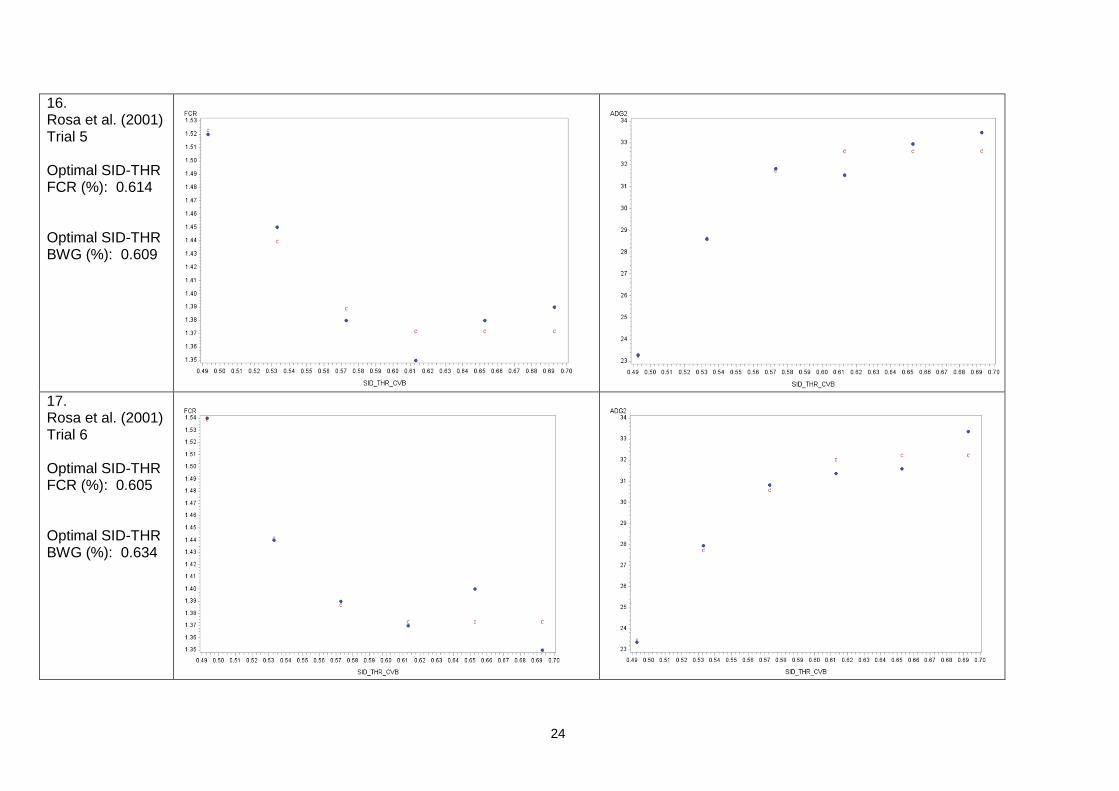
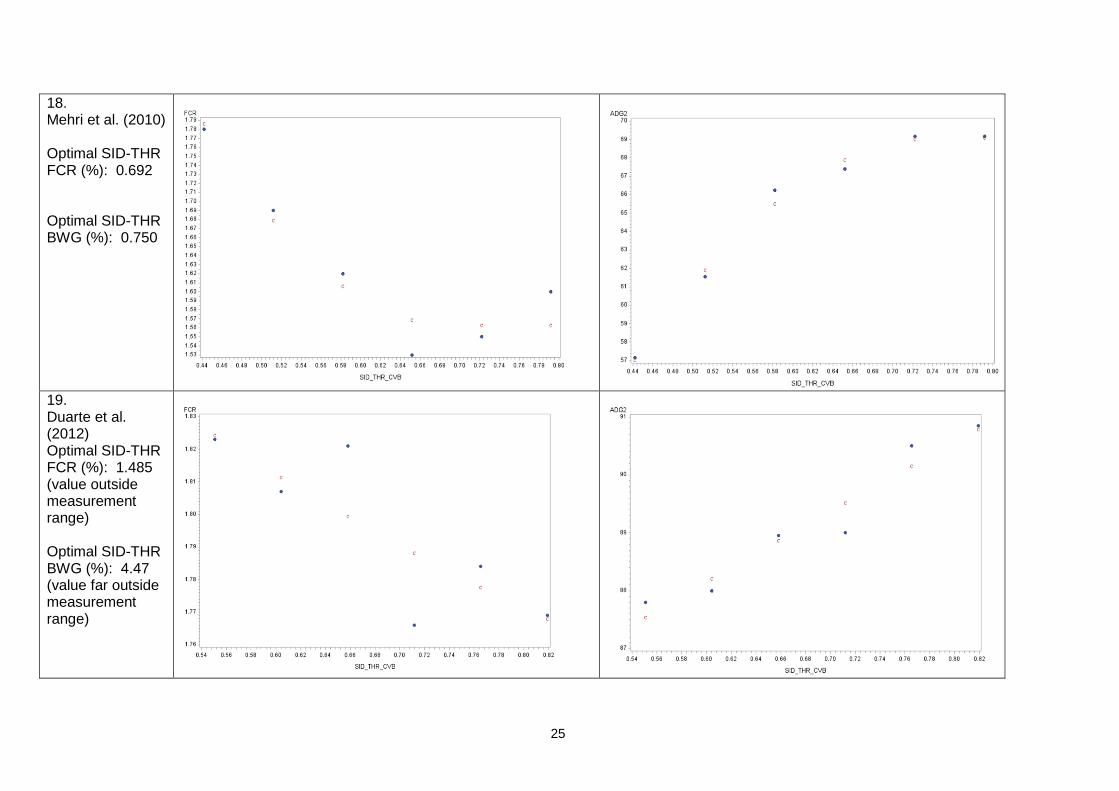
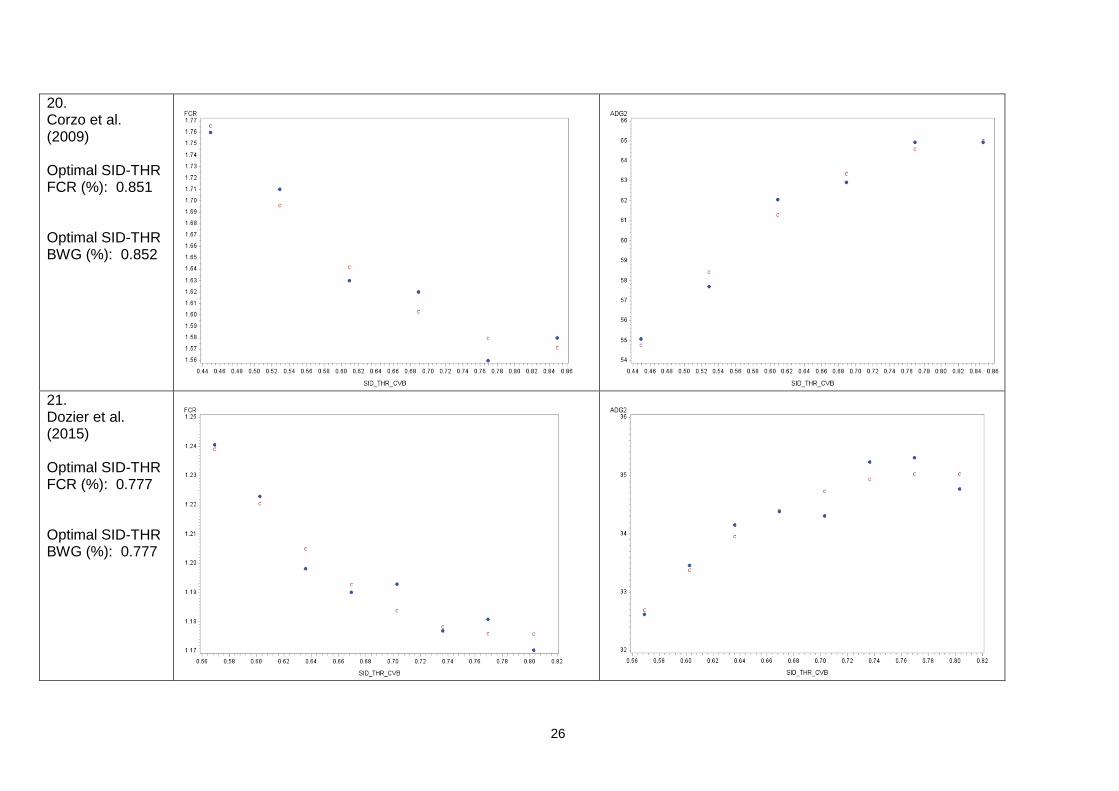
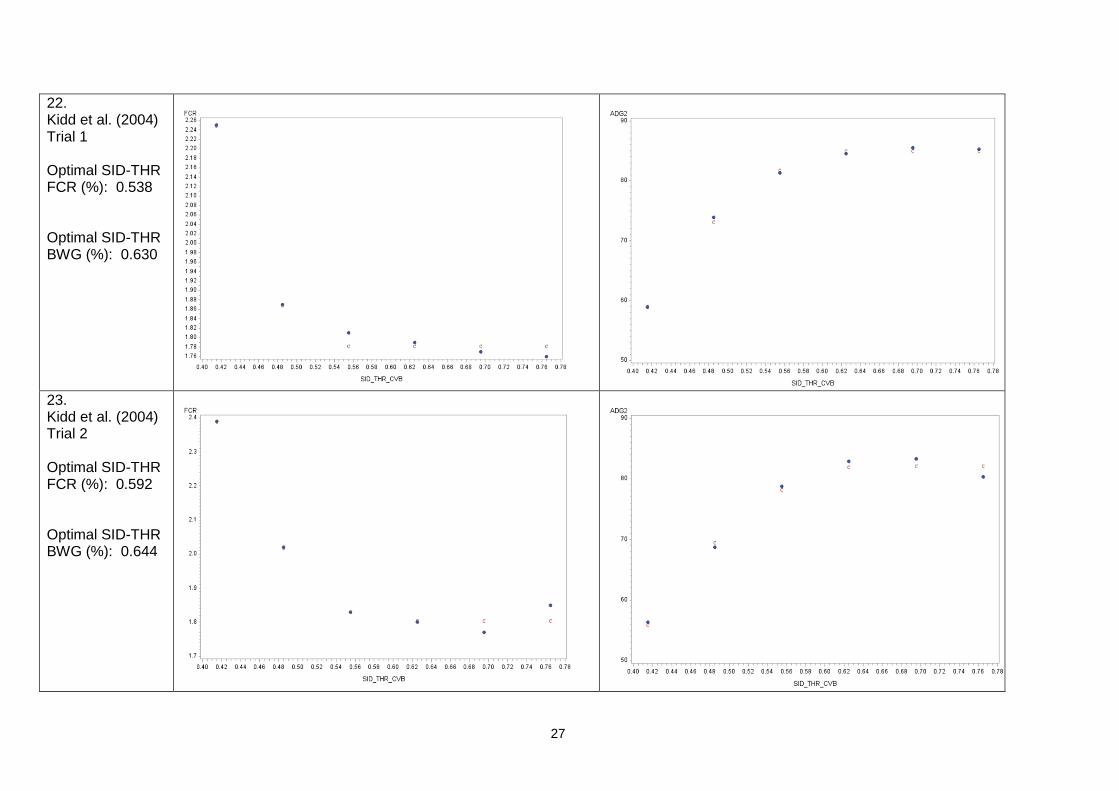
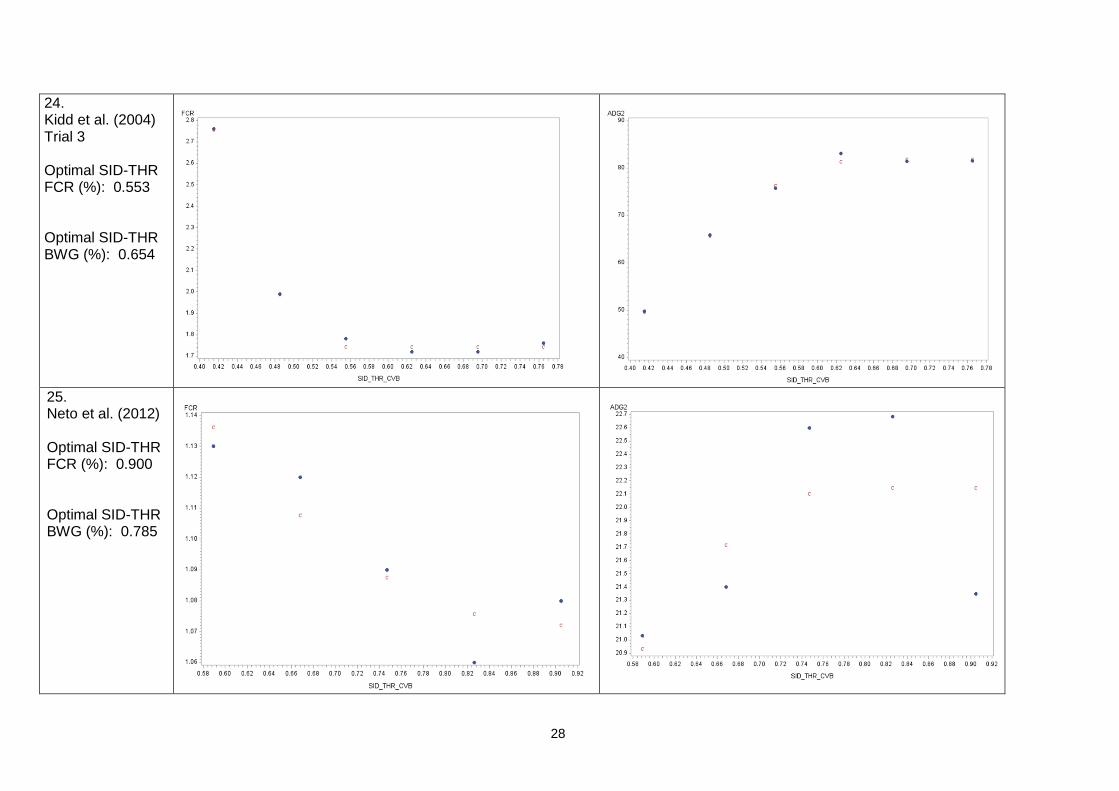
On the x-axis of the Figures the dietary THR concentration (%) is given and on the y-axis of the Figures the FCR (left hand Figures) and BWG (right hand figures) are given. The closed circles are the observed values and the ‘c’ symbols are the fitted values.
Trial FCR BWG
1. Mack et al. (1999) Trial 1 Optimal SID-THR FCR (%): 0.520 Optimal SID-THR BWG (%): 0.488
17
2. Mack et al. (1999) Trial 2 Optimal SID-THR FCR (%): 0.536 Optimal SID-THR BWG (%): 0.509
3. Ayasan et al. (2009) Optimal SID-THR FCR (%): could not be estimated Optimal SID-THR BWG (%): could not be estimated
18
4. Kidd et al. (1996) Optimal SID-THR FCR (%): 0.672 Optimal SID-THR BWG (%): 0.650
5. Corzo et al. (2003) Optimal SID-THR FCR (%): 0.525 Optimal SID-THR BWG (%): 0.460 (no unique estimate possible)
19
6. Corzo et al. (2007) Trial 1 Optimal SID-THR FCR (%): 0.540 Optimal SID-THR BWG (%): 0.600
7. Corzo et al. (2007) Trial 2 Optimal SID-THR FCR (%): 0.572 Optimal SID-THR BWG (%): 0.681
20
8. Ciftci and Ceylan (2004) Trial 1 Optimal SID-THR FCR (%): Optimal SID-THR BWG (%): 0.620
9. Ciftci and Ceylan (2004) Trial 2 Optimal SID-THR FCR (%): Optimal SID-THR BWG (%): 0.653
21
10. Ciftci and Ceylan (2004) Trial 3 Optimal SID-THR FCR (%): 4.203 (value outside measurement range) Optimal SID-THR BWG (%): 0.560
11. Ciftci and Ceylan (2004) Trial 4 Optimal SID-THR FCR (%): 0.647 Optimal SID-THR BWG (%): 0.587
22
12. Rosa et al. (2001) Trial 1 Optimal SID-THR FCR (%): 0.594 Optimal SID-THR BWG (%): 0.577
13. Rosa et al. (2001) Trial 2 Optimal SID-THR FCR (%): 0.560 (no unique estimate possible) Optimal SID-THR BWG (%): 0.601
23
14. Rosa et al. (2001) Trial 3 Optimal SID-THR FCR (%): 0.520 (no unique estimate possible) Optimal SID-THR BWG (%): 0.602
15. Rosa et al. (2001) Trial 4 Optimal SID-THR FCR (%): 0.575 Optimal SID-THR BWG (%): 0.571
24
16. Rosa et al. (2001) Trial 5 Optimal SID-THR FCR (%): 0.614 Optimal SID-THR BWG (%): 0.609
17. Rosa et al. (2001) Trial 6 Optimal SID-THR FCR (%): 0.605 Optimal SID-THR BWG (%): 0.634
25
18. Mehri et al. (2010) Optimal SID-THR FCR (%): 0.692 Optimal SID-THR BWG (%): 0.750
19. Duarte et al. (2012) Optimal SID-THR FCR (%): 1.485 (value outside measurement range) Optimal SID-THR BWG (%): 4.47 (value far outside measurement range)
26
20. Corzo et al. (2009) Optimal SID-THR FCR (%): 0.851 Optimal SID-THR BWG (%): 0.852
21. Dozier et al. (2015) Optimal SID-THR FCR (%): 0.777 Optimal SID-THR BWG (%): 0.777
27
22. Kidd et al. (2004) Trial 1 Optimal SID-THR FCR (%): 0.538 Optimal SID-THR BWG (%): 0.630
23. Kidd et al. (2004) Trial 2 Optimal SID-THR FCR (%): 0.592 Optimal SID-THR BWG (%): 0.644
28
24. Kidd et al. (2004) Trial 3 Optimal SID-THR FCR (%): 0.553 Optimal SID-THR BWG (%): 0.654
25. Neto et al. (2012) Optimal SID-THR FCR (%): 0.900 Optimal SID-THR BWG (%): 0.785
29
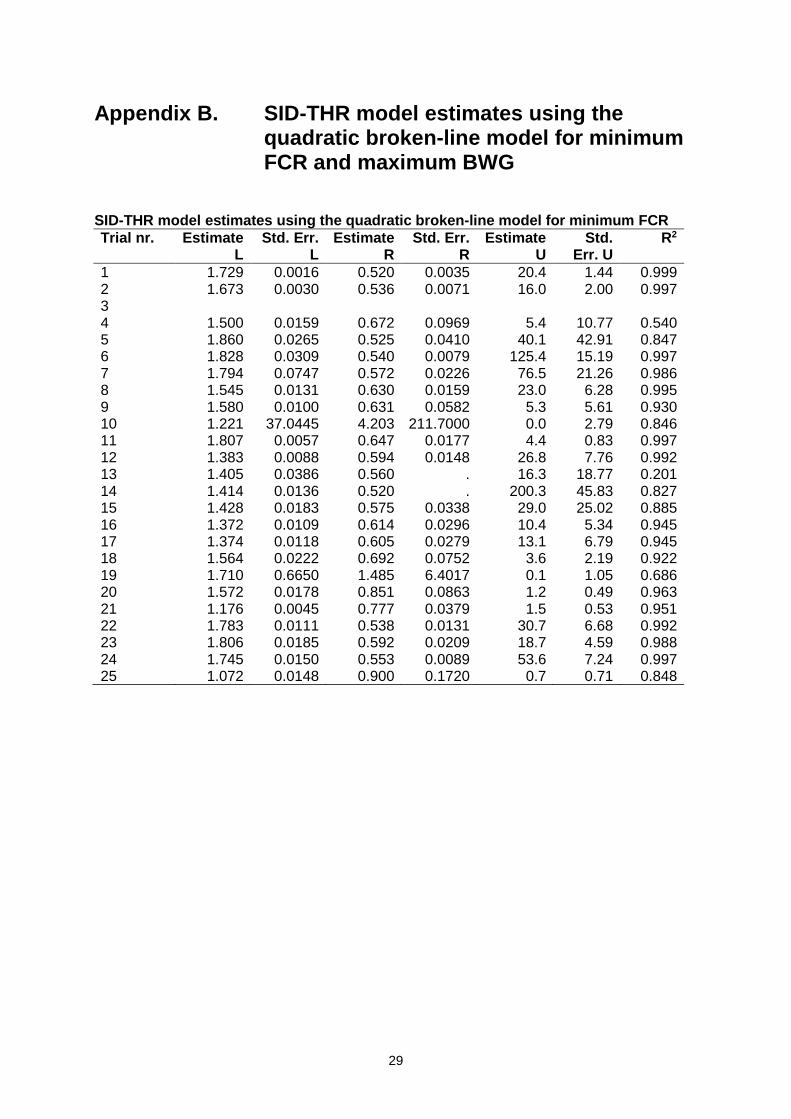
Appendix B. SID-THR model estimates using the quadratic broken-line model for minimum FCR and maximum BWG
SID-THR model estimates using the quadratic broken-line model for minimum FCR
Trial nr. Estimate L
Std. Err. L
Estimate R
Std. Err. R
Estimate U
Std. Err. U
R2
1 1.729 0.0016 0.520 0.0035 20.4 1.44 0.999 2 1.673 0.0030 0.536 0.0071 16.0 2.00 0.997 3 4 1.500 0.0159 0.672 0.0969 5.4 10.77 0.540 5 1.860 0.0265 0.525 0.0410 40.1 42.91 0.847 6 1.828 0.0309 0.540 0.0079 125.4 15.19 0.997 7 1.794 0.0747 0.572 0.0226 76.5 21.26 0.986 8 1.545 0.0131 0.630 0.0159 23.0 6.28 0.995 9 1.580 0.0100 0.631 0.0582 5.3 5.61 0.930 10 1.221 37.0445 4.203 211.7000 0.0 2.79 0.846 11 1.807 0.0057 0.647 0.0177 4.4 0.83 0.997 12 1.383 0.0088 0.594 0.0148 26.8 7.76 0.992 13 1.405 0.0386 0.560 . 16.3 18.77 0.201 14 1.414 0.0136 0.520 . 200.3 45.83 0.827 15 1.428 0.0183 0.575 0.0338 29.0 25.02 0.885 16 1.372 0.0109 0.614 0.0296 10.4 5.34 0.945 17 1.374 0.0118 0.605 0.0279 13.1 6.79 0.945 18 1.564 0.0222 0.692 0.0752 3.6 2.19 0.922 19 1.710 0.6650 1.485 6.4017 0.1 1.05 0.686 20 1.572 0.0178 0.851 0.0863 1.2 0.49 0.963 21 1.176 0.0045 0.777 0.0379 1.5 0.53 0.951 22 1.783 0.0111 0.538 0.0131 30.7 6.68 0.992 23 1.806 0.0185 0.592 0.0209 18.7 4.59 0.988 24 1.745 0.0150 0.553 0.0089 53.6 7.24 0.997 25 1.072 0.0148 0.900 0.1720 0.7 0.71 0.848
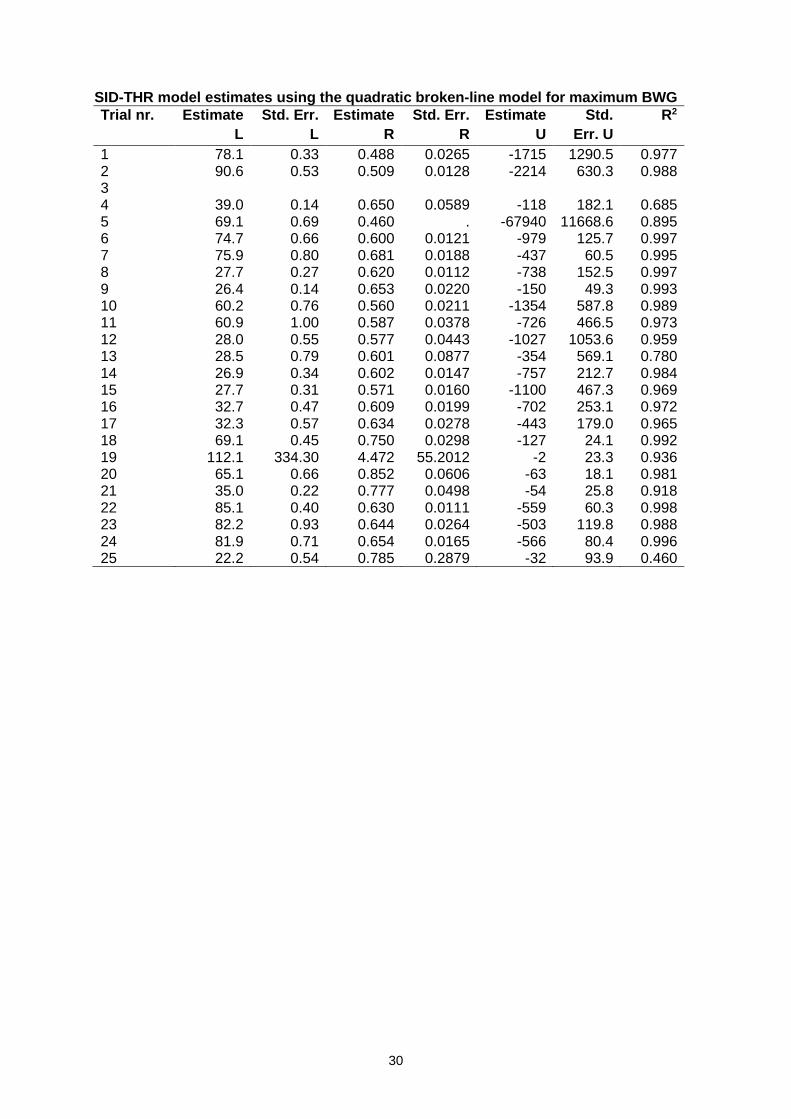
30
SID-THR model estimates using the quadratic broken-line model for maximum BWG
Trial nr. Estimate
L
Std. Err.
L
Estimate
R
Std. Err.
R
Estimate
U
Std.
Err. U
R2
1 78.1 0.33 0.488 0.0265 -1715 1290.5 0.977 2 90.6 0.53 0.509 0.0128 -2214 630.3 0.988 3 4 39.0 0.14 0.650 0.0589 -118 182.1 0.685 5 69.1 0.69 0.460 . -67940 11668.6 0.895 6 74.7 0.66 0.600 0.0121 -979 125.7 0.997 7 75.9 0.80 0.681 0.0188 -437 60.5 0.995 8 27.7 0.27 0.620 0.0112 -738 152.5 0.997 9 26.4 0.14 0.653 0.0220 -150 49.3 0.993 10 60.2 0.76 0.560 0.0211 -1354 587.8 0.989 11 60.9 1.00 0.587 0.0378 -726 466.5 0.973 12 28.0 0.55 0.577 0.0443 -1027 1053.6 0.959 13 28.5 0.79 0.601 0.0877 -354 569.1 0.780 14 26.9 0.34 0.602 0.0147 -757 212.7 0.984 15 27.7 0.31 0.571 0.0160 -1100 467.3 0.969 16 32.7 0.47 0.609 0.0199 -702 253.1 0.972 17 32.3 0.57 0.634 0.0278 -443 179.0 0.965 18 69.1 0.45 0.750 0.0298 -127 24.1 0.992 19 112.1 334.30 4.472 55.2012 -2 23.3 0.936 20 65.1 0.66 0.852 0.0606 -63 18.1 0.981 21 35.0 0.22 0.777 0.0498 -54 25.8 0.918 22 85.1 0.40 0.630 0.0111 -559 60.3 0.998 23 82.2 0.93 0.644 0.0264 -503 119.8 0.988 24 81.9 0.71 0.654 0.0165 -566 80.4 0.996 25 22.2 0.54 0.785 0.2879 -32 93.9 0.460