standardization of multiparametric prostate mr … of multiparametric prostate mr imaging using...
TRANSCRIPT

Review ArticleStandardization of Multiparametric Prostate MR ImagingUsing PI-RADS
Joyce G. R. Bomers and Jelle O. Barentsz
Department of Radiology and Nuclear Medicine (766), Radboud University Medical Center, P.O. Box 9101,6500 HB Nijmegen, The Netherlands
Correspondence should be addressed to Joyce G. R. Bomers; [email protected]
Received 19 March 2014; Accepted 29 April 2014; Published 9 June 2014
Academic Editor: Barıs Turkbey
Copyright © 2014 J. G. R. Bomers and J. O. Barentsz. This is an open access article distributed under the Creative CommonsAttribution License, which permits unrestricted use, distribution, and reproduction in any medium, provided the original work isproperly cited.
The purpose of this paper is to introduce and describe the Prostate Imaging and Reporting Archiving Data System (PI-RADS). Forevery single parameter the PI-RADS scoring system will be explained and magnetic resonance imaging (MRI) examples will begiven. In the end two patient cases are presented to explain the overall interpretation score in multiparametric imaging.
1. Introduction
At present, multiparametric magnetic resonance imaging(MRI) is the most sensitive and specific imaging techniquefor localizing prostate cancer (PCa) [1]. According to a groupof prostate MRI experts from the European Society of Uro-genital Radiology (ESUR) multiparametric MRI should atleast consist of high-resolution T2-weighted imaging (T2WI)in combination with two functional techniques, such asdynamic contrast-enhanced (DCE) MRI, diffusion-weightedimaging (DWI) or proton spectroscopy imaging (MRSI) [2].The most important reason for this is that T2WI is themain important parameter to picture the prostate anatomy,and DCE-MRI adds sensitivity [3, 4] in PCa detection andDWI [5–7] and MRSI [8, 9] improve the specificity of PCacharacterization.
Nevertheless, interpretation of multiparametric MRimages is still subjective. For other organs, for example, thebreast, liver, and thyroid gland, standardized interpretationschemes including risk stratification criteria have beendeveloped to determine the presence of malignancy. Themost developed and eminent system is the Breast ImagingReporting and Data System (BI-RADS).
Inspired by BI-RADS and to improve the diagnosticsof PCa, the same group of prostate MR imaging expertspublished in 2012 a set of clinical guidelines with theaim to standardize the interpretation and to report the
different parametric MR-techniques: the Prostate Imagingand Reporting Archiving Data System (PI-RADS) [2]. Majorgoals of this system are to allow comparison of interobserverinterpretation variability; to reduce this variability by dis-cussing the individual scores; to enhance communicationwith clinicians in a uniform way; to facilitate quality assur-ance and research; and to improve patient outcome.
The purpose of this paper is to introduce and describe thePI-RADS system by means of MR imaging examples.
2. PI-RADS Scoring System
In the next sections the PI-RADS scoring criteria areexplained for all parameters except MRSI. MRSI is, incontrast to T2WI, DWI, and DCE, considered as an optionalparameter by the ESUR guidelines and is therefore notdiscussed in this report. Every parameter, T2WI, DWI, andDCE, is scored independently on a 5-point scale, where score1 means that clinically significant disease is highly unlikely;score 2 means that clinically significant disease is unlikely tobe present; score 3 indicates that the presence of clinicallysignificant cancer is equivocal; score 4 means that clinicallysignificant cancer is likely to be present; score 5 indicates thatclinically significant cancer is highly likely to be present. Sincethe different parameters are not always unanimous in theirscoring, the overall interpretation of each lesion is clarified in
Hindawi Publishing CorporationBioMed Research InternationalVolume 2014, Article ID 431680, 9 pageshttp://dx.doi.org/10.1155/2014/431680

2 BioMed Research International
(a) (b) (c)
(d) (e)
Figure 1: Examples of PI-RADS scoring for T2WI in the peripheral zone. (a) PI-RADS 1. (b) PI-RADS 2. (c) PI-RADS 3. (d) PI-RADS 4. (e)PI-RADS 5.
the end and a final score is given to predict its chance of beinga significant cancer.
3. T2-Weighted Imaging
Overall, high-resolution T2-weighted imaging (T2WI) pro-vides the best images to assess the anatomy of the prostateand its adjacent structures as the bladder, seminal vesicles,and rectal wall. In diagnosing prostate cancer it is a sensitivetechnique; however, it is not very specific.
From a radiological point of view the prostate consistsout of two different zones: the peripheral zone, locatedposteriorly and inferiorly, and the central gland, locatedanteriorly and superiorly [10]. Anatomically, the central glandcan be divided into the transition zone and the central zone.With increasing age, the composition of the central glandchanges. In young men it is mainly composed of the centralzone, but in older men it is mainly composed of transitionzone, due to the development of benign hyperplasia (BPH),which leads to the formation of adenomatous nodules.
Given the distinct anatomical appearance of both zoneson T2WI, two different sets of PI-RADS criteria are devel-oped: one for the peripheral zone and another for the tran-sition zone.
3.1. Peripheral Zone. In Table 1 the PI-RADS criteria for theperipheral zone are shown. A healthy normal peripheral zone(PI-RADS 1) has a uniformhigh signal intensity as depicted inFigure 1(a). Linear, wedge-shaped, geographic areas of lowersignal intensity with no clear delineation and no mass effect
Table 1: PI-RADS scoring system for T2WI—peripheral zone.
PI-RADSscore Criteria
1 Uniform high signal intensity
2 Linear, wedge-shaped, or geographic areas of lowersignal intensity, usually not well demarcated
3 Intermediate appearances not in categories 1/2 or 4/5
4 Discrete, homogeneous low signal focus/massconfined to the prostate
5
Discrete, homogeneous low signal intensity focuswith extracapsular extension/invasive behavior ormass effect on the capsule (bulging), or broad(>1.5 cm) contact with the surface
usually indicate nonmalignant conditions such as prostatitis,atrophy, scar tissue, hematomas, postradiation changes, orhormonal effects [11–13]. These lesions can be scored as PI-RADS 2. Figure 1(b) shows a typical PI-RADS 2 lesion in theleft peripheral zone because it is wedge-shaped and shows nomass effect.
Prostate cancer can appear as a focal area of low signalintensity, with decreasing signal intensity when the Gleasongrade increases. A discrete, homogenous focus or mass withlow signal intensity and still confined to the prostate is scoredas PI-RADS 4 and is shown in the right peripheral zone inFigure 1(d). When this focus shows extracapsular extensionor invasive behavior, mass effect on the capsule (bulging),or more than 1.5 cm capsule contact, it is highly likely to beclinically significant prostate cancer and should therefore be

BioMed Research International 3
(a) (b) (c)
(d) (e)
Figure 2: Examples of PI-RADS scoring for T2WI in the transition zone. (a) PI-RADS 1. (b) PI-RADS 2. (c) PI-RADS 3. (d) PI-RADS 4. (e)PI-RADS 5.
scored as PI-RADS 5. In Figure 1(e) a lesion with mass effecton the capsule and probable extracapsular extension is seenin the right peripheral zone.
A PI-RADS 3 score should be given when the lesion doesnot appear as described in the other categories. An exampleis given in Figure 1(c): the area in the left anterior horn ofthe peripheral zone is a PI-RADS 3 lesion because it is welldemarcated and therefore cannot be scored as a PI-RADS 2,and as it does not show homogenous low signal intensity itcannot be scored as PI-RADS 4 as well.
3.2. Transition Zone. The PI-RADS criteria for scoring alesion in the transition zone on T2WI are shown in Table 2.On T2WI a normal transition zone can be described as areasof low signal intensity alternated with round, well-definedBPH nodules with an inhomogeneous signal intensity, ina pattern described as “organized chaos” as depicted inFigure 2(a). The presence of clinical significant cancer ishighly unlikely here; for this reason this can be scored asPI-RADS 1. When one or more of these areas show well-marginated homogenous signal intensity, for example, theindicated nodule on the right side in Figure 2(b), this shouldbe scored as PI-RADS 2.
A focal, ill-defined area showing homogenous low signalintensity, also described as “erased charcoal drawing sign,”visible in Figure 2(d) in the ventral left part of the prostate,should be scored as PI-RADS 4. When this area involvesthe anterior fibromuscular stroma, extends into the anteriorhorn of the peripheral zone, and is lenticular or water-drop-shaped, it should be scored as PI-RADS 5. In Figure 2(e)the large lesion with erased charcoal drawing sign and
Table 2: PI-RADS scoring system for T2WI—transition zone.
PI-RADSscore Criteria
1 Heterogeneous transition zone adenoma withwell-defined margins: “organized chaos”
2Areas of more homogeneous low signal intensity,however well-marginated, originating from thetransition zone/BPH
3 Intermediate appearances not in categories 1/2 or 4/5
4 Areas of homogeneous low signal intensity, illdefined: “erased charcoal drawing sign”
5
Same as 4, but involving the anterior fibromuscularstroma sometimes extending into the anterior hornof the peripheral zone, usually lenticular orwater-drop- shaped
involving the anterior fibromuscular stroma ventrally is atypical example of a PI-RADS 5 lesion. If the lesion doesnot fit in the criteria described above, it should be scored asPI-RADS 3. An example is given in Figure 2(c). This lesionin the left side of the prostate has a well-defined marginand could be scored as PI-RADS 2; however some erasedcharcoal effect is present, indicating PI-RADS 4. Because ofthe aforementioned reasons, it is neither a clear PI-RADS 2nor a PI-RADS 4 lesion, and therefore scored as PI-RADS 3.
4. DWI
Diffusion-weighted imaging shows the randommovement ofwater molecules in tissue. In tissues with high cellular density

4 BioMed Research International
and intact cell membranes, for example, cancer or fibrosis,water molecules can hardly move. Then, the diffusion-weighted images will show diffusion restriction representedby a high signal intensity on the high 𝑏-value images and lowsignal intensity on the apparent diffusion coefficient (ADC)maps. ADC maps correlates well with tumor aggressivenessand therefore improves specificity in examining prostate MRimages [5]. More technical details about diffusion-weightedimaging can be read in the report of Qayyum [14].
Normal glandular prostate tissue (PI-RADS 1)will give nosignal reduction on the ADC map and no increase in signalintensity on the high 𝑏-value images. An example is shownin Figure 3(a). On the left side the ADC-map is shown withparticular in the peripheral zone high signal intensity and onthe right side the calculated 𝑏1400 image shows equal signalintensity in the entire prostate.
A typical PI-RADS 2 lesion is represented by diffusehypersignal intensity on high 𝑏-value images. Low ADC val-ues; no focal features, however, linear, triangular or geograph-ical elements are allowed.This is depicted in Figure 3(b), boththe left and right peripheral zones show hypointense signalon the ADC map and diffuse high signal intensity on thecalculated 𝑏1400 image.
When the ADC-map shows focal area(s) of reduced ADCtogether with isointense signal intensity on high 𝑏-valueimages, as depicted in the right transition zone in Figure 3(d),PI-RADS score 4 should be reported. A focal mass or areashowing reduced ADC as well as hyperintense signal on thehigh 𝑏-value images is characteristic for PI-RADS 5. A typicalexample of a lesion with these characteristics is given in theleft transition zone of the prostate in Figure 3(e).
If the diffusion-weighted images show intermediateappearances andno characteristics of categories 1/2 or 4/5, PI-RADS score 3 should be reported. In Figure 3(c) a PI-RADS3 lesion is shown. On the ADCmap no clear signal reductionis seen, whereas on the calculated 𝑏1400 image a focal lesionwith high signal intensity is represented on the right dorsalside of the prostate. Based on the ADCmap this lesion shouldbe scored as PI-RADS 1; however based on the high 𝑏-valueimage the lesion should be scored as PI-RADS 5. Because itis neither a clear PI-RADS 1 lesion nor a clear PI-RADS 5lesion, it was scored as PI-RADS 3.Anoverviewof the scoringcriteria is shown in Table 3.
5. DCE
Dynamic contrast-enhanced (DCE)MRI is based on the per-meability of blood vessels and extravasation of contrast agentinto the adjacent tissue. Leaky endothelia with an increasedpermeability and therefore fast contrast enhancement are atypical feature for PCa.
The PI-RADS scoring system for DCE imaging worksdifferent from the other parameters. These criteria are cur-rently under discussion because according to some studiesDCE-MRI does not seem to add significant value to thediagnosis of PCa [15, 16]. Other studies state that DCE-MRIcan detect PCa with both high sensitivity and specificityand helps in tumor staging [17, 18]. Because of this debate,
Table 3: PI-RADS scoring system for DWI.
PI-RADSscore Criteria
1No reduction in ADC compared to normal glandulartissue. No increase in signal intensity on any high𝑏-value images∗
2Diffuse hypersignal intensity on high 𝑏-valueimages∗ with low ADC; no focal features, linear,triangular, or geographical features, allowed
3 Intermediate appearances not in categories 1/2 or 4/5
4 Focal area(s) of reduced ADC but isointense signalintensity on high 𝑏-value images∗
5 Focal area/mass of hypersignal intensity on the high𝑏-value images∗ with reduced ADC
∗(≥b800).
Table 4: PI-RADS scoring system for DCE.
PI-RADSscore Criteria
1 Type 1 enhancement curve2 Type 2 enhancement curve3 Type 3 enhancement curve+1 For focal enhancing lesion with curve types 2-3
+1 For asymmetric lesion or lesion at an unusual placewith curve types 2-3
criteriawill bemodified almost certainly in the next PI-RADSversion. Nevertheless, the current criteria for DCE-scoringare described in Table 4.
The first step is to determine which signal-intensity-over-time curve type fits the enhancement pattern of the lesion.Typical examples of the different curve types (1, 2, and 3)are shown in Figure 4. If the curve type is known, theaccompanying PI-RADS score should be given.
Curve type 1 can be described as slowly increasingenhancement over time, curve type 2 is characterized byenhancement reaching a plateau phase, and curve type 3shows fast enhancement with washout effect afterwards.
When a curve type 2 or 3 is present, the second step is toverify whether the specific lesion is a focal enhancing lesion.If yes, one point should be added to the PI-RADS score. Thethird step is to determine whether the lesion is asymmetric oris located at an unusual place. If yes, again add another pointto the PI-RADS score. In this way a maximum score of PI-RADS 5 can be achieved.
In Figure 5(a) aDCE-imagewith the typical enhancementpattern of BPH is shown. The enhancement has a curve type3, is not focal and not asymmetric, and is therefore scoredas PI-RADS 3. In Figure 5(b) a prostate with an enhancinglesion in the ventral part of the prostate is shown. Again, atype 3 enhancement curve is shown. One point can be addedto the PI-RADS score because it is a focal enhancing lesion,ending up with a final PI-RADS score of 4. Figure 5(c) showsa focal, asymmetric enhancing lesion in the right peripheral

BioMed Research International 5
(a)
(b)
(c)
(d)
(e)
Figure 3: Examples of PI-RADS scoring for DWI. Left: axial ADC map. Right: axial DWI with calculated 𝑏 = 1400. (a) PI-RADS 1. (b)PI-RADS 2. (c) PI-RADS 3. (d) PI-RADS 4. (e) PI-RADS 5.

6 BioMed Research International
0
0
50 100
200
400
600
(a)
0
0
50 100
200
400
600
(b)
0
0
50 100
200
400
600
(c)
Figure 4: Examples of PI-RADS scoring for DCE. (a) Curve type 1. (b) Curve type 2. (c) Curve type 3.
0
0
50 100
200
400
600
(a)
0
0
50 100
200
400
600
(b)
0
0
50 100
200
400
600
(c)
Figure 5: Examples of PI-RADS scoring for DCE. (a) PI-RADS 3. (b) PI-RADS 4. (c) PI-RADS 5.
BioMed Research International 7
(a) (b) (c)
(d)0
0
10050
200
400
600
(e)
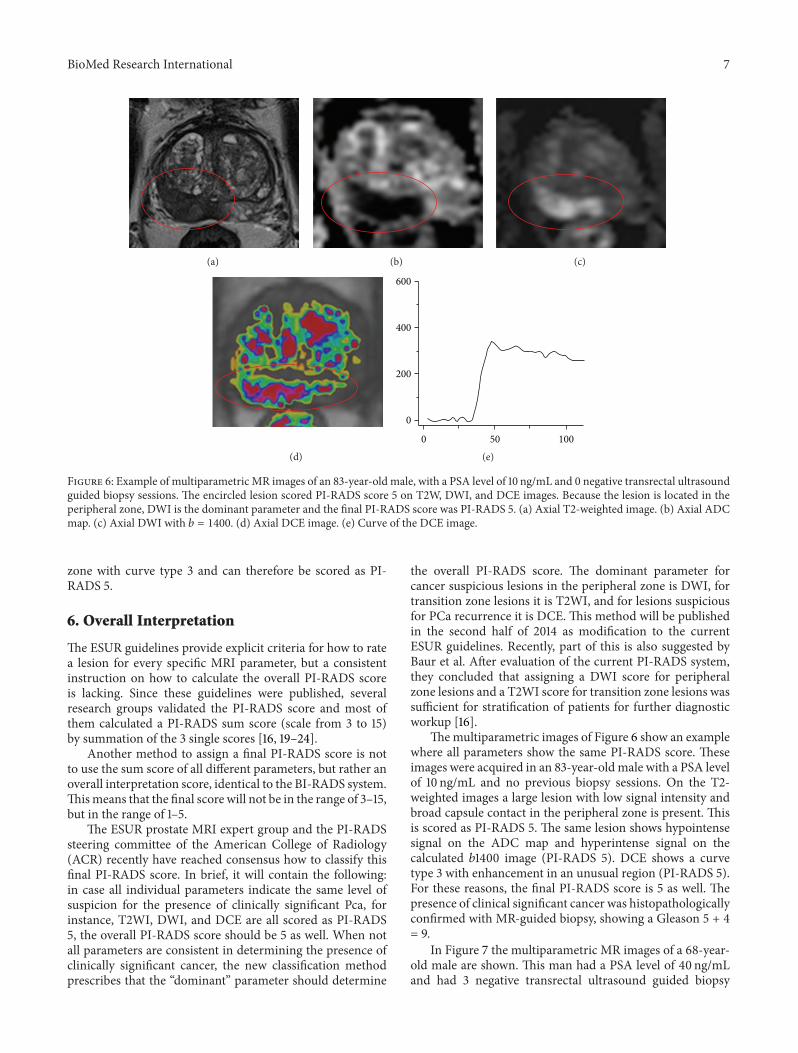
Figure 6: Example of multiparametric MR images of an 83-year-old male, with a PSA level of 10 ng/mL and 0 negative transrectal ultrasoundguided biopsy sessions. The encircled lesion scored PI-RADS score 5 on T2W, DWI, and DCE images. Because the lesion is located in theperipheral zone, DWI is the dominant parameter and the final PI-RADS score was PI-RADS 5. (a) Axial T2-weighted image. (b) Axial ADCmap. (c) Axial DWI with 𝑏 = 1400. (d) Axial DCE image. (e) Curve of the DCE image.
zone with curve type 3 and can therefore be scored as PI-RADS 5.
6. Overall Interpretation
The ESUR guidelines provide explicit criteria for how to ratea lesion for every specific MRI parameter, but a consistentinstruction on how to calculate the overall PI-RADS scoreis lacking. Since these guidelines were published, severalresearch groups validated the PI-RADS score and most ofthem calculated a PI-RADS sum score (scale from 3 to 15)by summation of the 3 single scores [16, 19–24].
Another method to assign a final PI-RADS score is notto use the sum score of all different parameters, but rather anoverall interpretation score, identical to the BI-RADS system.Thismeans that the final score will not be in the range of 3–15,but in the range of 1–5.
The ESUR prostate MRI expert group and the PI-RADSsteering committee of the American College of Radiology(ACR) recently have reached consensus how to classify thisfinal PI-RADS score. In brief, it will contain the following:in case all individual parameters indicate the same level ofsuspicion for the presence of clinically significant Pca, forinstance, T2WI, DWI, and DCE are all scored as PI-RADS5, the overall PI-RADS score should be 5 as well. When notall parameters are consistent in determining the presence ofclinically significant cancer, the new classification methodprescribes that the “dominant” parameter should determine
the overall PI-RADS score. The dominant parameter forcancer suspicious lesions in the peripheral zone is DWI, fortransition zone lesions it is T2WI, and for lesions suspiciousfor PCa recurrence it is DCE. This method will be publishedin the second half of 2014 as modification to the currentESUR guidelines. Recently, part of this is also suggested byBaur et al. After evaluation of the current PI-RADS system,they concluded that assigning a DWI score for peripheralzone lesions and a T2WI score for transition zone lesions wassufficient for stratification of patients for further diagnosticworkup [16].
Themultiparametric images of Figure 6 show an examplewhere all parameters show the same PI-RADS score. Theseimages were acquired in an 83-year-old male with a PSA levelof 10 ng/mL and no previous biopsy sessions. On the T2-weighted images a large lesion with low signal intensity andbroad capsule contact in the peripheral zone is present. Thisis scored as PI-RADS 5. The same lesion shows hypointensesignal on the ADC map and hyperintense signal on thecalculated 𝑏1400 image (PI-RADS 5). DCE shows a curvetype 3 with enhancement in an unusual region (PI-RADS 5).For these reasons, the final PI-RADS score is 5 as well. Thepresence of clinical significant cancer was histopathologicallyconfirmed with MR-guided biopsy, showing a Gleason 5 + 4= 9.
In Figure 7 the multiparametric MR images of a 68-year-old male are shown. This man had a PSA level of 40 ng/mLand had 3 negative transrectal ultrasound guided biopsy

8 BioMed Research International
(a) (b) (c)
(d)0
0
500 1000
200
400
600
(e)
Figure 7: Example of multiparametric MR images of a 68-year-old male, with a PSA level of 40 ng/mL and 3 negative transrectal ultrasoundguided biopsy sessions. The encircled lesion scored PI-RADS 2 on T2W image, PI-RADS 5 on DWI, and PI-RADS 4 on DCE. Because thelesion is in the transition zone, T2W is the dominant parameter, and the final PI-RADS score was PI-RADS 2. (a) Axial T2-weighted image.(b) Axial ADC map. (c) Axial DWI with 𝑏 = 1400. (d) Axial DCE image. (e) Curve of the DCE image.
sessions. On these images a lesion is seen in the left transitionzone. On the T2-weighted images it is scored as PI-RADS 2because it is a well-marginated area with homogenous lowsignal intensity originating from a BPH nodule. On the DWIit is scored as PI-RADS 5 because it is a focal area with lowsignal intensity on the ADCmap and high signal intensity onthe calculated 𝑏1400 image. Furthermore, the lesion showsa type 3 enhancement curve, with some focal, however notasymmetric, enhancement.Therefore, it is scored as PI-RADS4 on theDCE images. Because the individual PI-RADS scoresare not concordant, the dominant parameter determinesthe final PI-RADS score. Since the lesion is located in thetransition zone, the dominant parameter is the T2WI andtherefore the final PI-RADS score for this lesion is PI-RADS2. Nevertheless, this patient had a high clinical suspicionfor PCa because of his high PSA level and for that reasonMR-guided biopsy was performed of this PI-RADS 2 lesion.Histopathological analysis of the biopsy cores confirmed thatthere was no malignancy but BPH.
In conclusion, the PI-RADS classification is still work inprogress and will have further improvement in the future.Furthermore, more studies have to be done to validate theaccuracy and interobserver variability.
Conflict of Interests
The authors declare that there is no conflict of interestsregarding the publication of this paper.
References
[1] A. Sciarra, J. Barentsz, A. Bjartell et al., “Advances in magneticresonance imaging: how they are changing the management ofprostate cancer,” European Urology, vol. 59, no. 6, pp. 962–977,2011.
[2] J. O. Barentsz, J. Richenberg, R. Clements et al., “ESUR prostateMRguidelines 2012,”EuropeanRadiology, vol. 22, no. 4, pp. 746–757, 2012.
[3] N. Girouin, F. Mege-Lechevallier, A. Tonina Senes et al.,“Prostate dynamic contrast-enhanced MRI with simple visualdiagnostic criteria: is it reasonable?” European Radiology, vol.17, no. 6, pp. 1498–1509, 2007.
[4] A. Tanimoto, J. Nakashima, H. Kohno, H. Shinmoto, andS. Kuribayashi, “Prostate cancer screening: the clinical valueof diffusion-weighted imaging and dynamic MR imaging incombination with T2-weighted imaging,” Journal of MagneticResonance Imaging, vol. 25, no. 1, pp. 146–152, 2007.
[5] K. N. Nagel, M. G. Schouten, T. Hambrock et al., “Differen-tiation of prostatitis and prostate cancer by using diffusion-weightedMR imaging andMR-guided biopsy at 3 T,”Radiology,vol. 267, no. 1, pp. 164–172, 2013.
[6] T. Tamada, T. Sone, Y. Jo et al., “Apparent diffusion coefficientvalues in peripheral and transition zones of the prostate:comparison between normal and malignant prostatic tissuesand correlation with histologic grade,” Journal of MagneticResonance Imaging, vol. 28, no. 3, pp. 720–726, 2008.
[7] T.Hambrock,D.M. Somford,H. J.Huisman et al., “Relationshipbetween apparent diffusion coefficients at 3.0-Tmr imaging and

BioMed Research International 9
gleason grade in peripheral zone prostate cancer,” Radiology,vol. 259, no. 2, pp. 453–461, 2011.
[8] T. Kobus, P. C. Vos, T. Hambrock et al., “Prostate canceraggressiveness: in vivo assessment of MR spectroscopy anddiffusion-weighted imaging at 3 T,” Radiology, vol. 265, no. 2,pp. 457–467, 2012.
[9] G. M. Villeirs, W. Oosterlinck, E. Vanherreweghe, and G. O. deMeerleer, “A qualitative approach to combined magnetic res-onance imaging and spectroscopy in the diagnosis of prostatecancer,” European Journal of Radiology, vol. 73, no. 2, pp. 352–356, 2010.
[10] F. V. Coakley and H. Hricak, “Radiologic anatomy of theprostate gland: a clinical approach,” Radiologic Clinics of NorthAmerica, vol. 38, no. 1, pp. 15–30, 2000.
[11] L. E. Quint, J. S. Van Erp, P. H. Bland et al., “Prostatecancer: correlation of MR images with tissue optical density atpathologic examination,” Radiology, vol. 179, no. 3, pp. 837–842,1991.
[12] A. Shukla-Dave, H. Hricak, C. Moskowitz et al., “Detection ofprostate cancer with MR spectroscopic imaging: an expandedparadigm incorporating polyamines,” Radiology, vol. 245, no. 2,pp. 499–506, 2007.
[13] M. Cruz, K. Tsuda, Y. Narumi et al., “Characterization of low-intensity lesions in the peripheral zone of prostate on pre-biopsyendorectal coil MR imaging,” European Radiology, vol. 12, no. 2,pp. 357–365, 2002.
[14] A. Qayyum, “Diffusion-weighted imaging in the abdomen andpelvis: concepts and applications,” Radiographics, vol. 29, no. 6,pp. 1797–1810, 2009.
[15] T. H. Kuru, M. C. Roethke, P. Rieker et al., “Histology core-specific evaluation of the European Society of Urogenital Radi-ology (ESUR) standardised scoring system of multiparametricmagnetic resonance imaging (mpMRI) of the prostate,” BJUInternational, vol. 112, no. 8, pp. 1080–1087, 2013.
[16] A. D. Baur, A. Maxeiner, T. Franiel et al., “Evaluation of theprostate imaging reporting and data system for the detection ofprostate cancer by the results of targeted biopsy of the prostate,”Investigative Radiology, vol. 49, no. 6, pp. 411–420, 2014.
[17] T. Franiel, L. Ludemann, B. Rudolph et al., “Evaluationof normal prostate tissue, chronic prostatitis, and prostatecancer by quantitative perfusion analysis using a dynamiccontrast-enhanced inversion-prepared dual-contrast gradientecho sequence,” Investigative Radiology, vol. 43, no. 7, pp. 481–487, 2008.
[18] P. Kozlowski, S. D. Chang, E. C. Jones, K. W. Berean, H.Chen, and S. L. Goldenberg, “Combined diffusion-weightedand dynamic contrast-enhanced MRI for prostate cancerdiagnosis—correlationwith biopsy andhistopathology,” Journalof Magnetic Resonance Imaging, vol. 24, no. 1, pp. 108–113, 2006.
[19] D. Junker, G. Schafer, M. Edlinger et al., “Evaluation of the PI-RADS scoring system for classifying mpMRI findings in menwith suspicion of prostate cancer,” BioMed Research Interna-tional, vol. 2013, Article ID 252939, 9 pages, 2013.
[20] A. B. Rosenkrantz, S. Kim, R. P. Lim et al., “Prostate cancerlocalization usingmultiparametric MR imaging: comparison ofProstate Imaging Reporting and Data System (PI-RADS) andLikert scales,” Radiology, vol. 269, no. 2, pp. 482–492, 2013.
[21] M. C. Roethke, T. H. Kuru, S. Schultze et al., “Evaluation ofthe ESUR PI-RADS scoring system for multiparametric MRI ofthe prostate with targeted MR/TRUS fusion-guided biopsy at3.0 Tesla,” European Radiology, vol. 24, no. 2, pp. 344–352, 2014.
[22] J. E. Thompson, D. Moses, R. Shnier et al., “Multiparametricmagnetic resonance imaging guiding diagnostic biopsy detectssignificant prostate cancer, and could reduce unnecessary biop-sies and over-detection: a prospective study,” The Journal ofUrology, 2014.
[23] L. Schimmoller, M. Quentin, C. Arsov et al., “Inter-readeragreement of the ESUR score for prostate MRI using in-bore MRI-guided biopsies as the reference standard,” EuropeanRadiology, vol. 23, no. 11, pp. 3185–3190, 2013.
[24] D. Portalez, P. Mozer, F. Cornud et al., “Validation of theEuropean Society of Urogenital Radiology scoring system forprostate cancer diagnosis on multiparametric magnetic reso-nance imaging in a cohort of repeat biopsy patients,” EuropeanUrology, vol. 62, no. 6, pp. 986–996, 2012.

Submit your manuscripts athttp://www.hindawi.com
Stem CellsInternational
Hindawi Publishing Corporationhttp://www.hindawi.com Volume 2014
Hindawi Publishing Corporationhttp://www.hindawi.com Volume 2014
MEDIATORSINFLAMMATION
of
Hindawi Publishing Corporationhttp://www.hindawi.com Volume 2014
Behavioural Neurology
EndocrinologyInternational Journal of
Hindawi Publishing Corporationhttp://www.hindawi.com Volume 2014
Hindawi Publishing Corporationhttp://www.hindawi.com Volume 2014
Disease Markers
Hindawi Publishing Corporationhttp://www.hindawi.com Volume 2014
BioMed Research International
OncologyJournal of
Hindawi Publishing Corporationhttp://www.hindawi.com Volume 2014
Hindawi Publishing Corporationhttp://www.hindawi.com Volume 2014
Oxidative Medicine and Cellular Longevity
Hindawi Publishing Corporationhttp://www.hindawi.com Volume 2014
PPAR Research
The Scientific World JournalHindawi Publishing Corporation http://www.hindawi.com Volume 2014
Immunology ResearchHindawi Publishing Corporationhttp://www.hindawi.com Volume 2014
Journal of
ObesityJournal of
Hindawi Publishing Corporationhttp://www.hindawi.com Volume 2014
Hindawi Publishing Corporationhttp://www.hindawi.com Volume 2014
Computational and Mathematical Methods in Medicine
OphthalmologyJournal of
Hindawi Publishing Corporationhttp://www.hindawi.com Volume 2014
Diabetes ResearchJournal of
Hindawi Publishing Corporationhttp://www.hindawi.com Volume 2014
Hindawi Publishing Corporationhttp://www.hindawi.com Volume 2014
Research and TreatmentAIDS
Hindawi Publishing Corporationhttp://www.hindawi.com Volume 2014
Gastroenterology Research and Practice
Hindawi Publishing Corporationhttp://www.hindawi.com Volume 2014
Parkinson’s Disease
Evidence-Based Complementary and Alternative Medicine
Volume 2014Hindawi Publishing Corporationhttp://www.hindawi.com