staff pay levels for selected positions in senators ... · staff pay levels for selected positions...
TRANSCRIPT

Staff Pay Levels for Selected Positions in Senators’ Offices, FY2009-FY2013
R. Eric Petersen Specialist in American National Government
Lara E. Chausow Research Assistant
Amber Hope Wilhelm Visual Information Specialist
November 3, 2014
Congressional Research Service
7-5700 www.crs.gov
R43774

Staff Pay Levels for Selected Positions in Senators’ Offices, FY2009-FY2013
Congressional Research Service
Summary This report provides pay data for 16 staff position titles that are typically deployed in Senators’ offices. The positions include the following: Administrative Director; Casework Supervisor; Caseworker; Chief of Staff; Communications Director; Counsel; Executive Assistant; Field Representative; Legislative Assistant; Legislative Correspondent; Legislative Director; Press Secretary; Scheduler; “Specials Director,” a combined category that includes the job titles Director of Projects, Director of Special Projects, Director of Federal Projects, Director of Grants, Projects Director, or Grants Director; Staff Assistant; and State Director. Senators’ staff pay data for the years FY2009-FY2013 were derived from a random sampling of Senators’ offices in which at least one staff member worked in a position in each year.
Data tables provide tabular pay data for each staff position. A graphic for each position is also included. The graphics display representations of pay from three perspectives, including the following:
• change in pay, FY2009-FY2013, in nominal (current) and constant, 2014 dollars;
• a comparison of the cumulative percentage change for that position to changes in pay, in constant dollars, for Members of Congress and federal civilian workers paid under the General Schedule in Washington, DC, and surrounding areas in northern Virginia, Maryland, West Virginia and Pennsylvania (DC), and Rest of the U.S. (RUS) from FY2009-FY2013; and
• distributions of FY2013 pay in 2014 dollars, in $10,000 increments.
Between FY2009 and FY2013, the median change in pay, in constant, 2014 dollars for all 16 staff positions working in Senators’ offices declined. The smallest, -0.13%, was found among administrative directors. Schedulers were affected by the greatest change, -20.56%. This may be compared to changes over approximately the same period (calendar years 2009-2013) to Members of Congress, -7.91%; General Schedule, DC, -5.67%; and General Schedule, RUS,-6.28%.
Pay data for staff working in House Member offices are available in CRS Report R43775, Staff Pay Levels for Selected Positions in House Member Offices, 2009-2013, by R. Eric Petersen, Lara E. Chausow, and Amber Hope Wilhelm.

Staff Pay Levels for Selected Positions in Senators’ Offices, FY2009-FY2013
Congressional Research Service
Contents Introduction ...................................................................................................................................... 1 Data Concerns .................................................................................................................................. 3 Data Tables and Visualizations ........................................................................................................ 3
Tables Table 1. Administrative Director...................................................................................................... 5 Table 2. Casework Supervisor ......................................................................................................... 6 Table 3. Caseworker ........................................................................................................................ 7 Table 4. Chief of Staff ...................................................................................................................... 8 Table 5. Communications Director .................................................................................................. 9 Table 6. Counsel ............................................................................................................................ 10 Table 7. Executive Assistant .......................................................................................................... 11 Table 8. Field Representative ......................................................................................................... 12 Table 9. Legislative Assistant ........................................................................................................ 13 Table 10. Legislative Correspondent ............................................................................................. 14 Table 11. Legislative Director ........................................................................................................ 15 Table 12. Press Secretary ............................................................................................................... 16 Table 13. Scheduler ........................................................................................................................ 17 Table 14. Specials Director ............................................................................................................ 18 Table 15. Staff Assistant ................................................................................................................ 19 Table 16. State Director ................................................................................................................. 20
Contacts Author Contact Information........................................................................................................... 21 Acknowledgments ......................................................................................................................... 21

Staff Pay Levels for Selected Positions in Senators’ Offices, FY2009-FY2013
Congressional Research Service 1
Introduction Levels of pay for congressional staff are a source of recurring questions among Members of Congress, congressional staff, and the public. Senators set the terms and conditions of employment for staff in their offices. This includes job titles and descriptions, rates of pay, subject to minimum and maximum levels,1 and resources available to them to carry out their official duties.2 There may be interest in congressional pay data from multiple perspectives, including assessment of the costs of congressional operations; guidance in setting pay levels for staff in Member offices; or comparison of congressional staff pay levels with those of other federal government pay systems.
Publicly available information sources do not provide aggregated congressional staff pay data in a readily retrievable form. The most recent publicly available Senate staff compensation report was issued in 2006,3 and relied on anonymous, self-reported survey data. Data in this report are based on official Senate reports, which afford the opportunity to use consistently collected data. Pay4 information in this report is based on the Senate’s Report of the Secretary of the Senate, published semiannually, in periods from April 1 to September 30, and October 1 to March 31,5 as collated by LegiStorm, a private entity that provides some congressional data by subscription.6 Additionally, this report provides annual data, which allows for observations about the nature of Senators’ personal staff compensation over time.
This report provides pay data for 16 staff position titles that are typically used in Senators’ offices.7 The positions include the following:
• Administrative Director8
• Casework Supervisor9
• Caseworker10
1 Since 2009, the minimum level of gross pay has been $2,267, and the maximum annual pay for staff in a Senator’s personal office has been $169,459, 2 U.S.C. 4575. 2 For discussion of resources available to Members to carry out their official duties, see CRS Report RL30064, Congressional Salaries and Allowances, by Ida A. Brudnick. 3 U.S. Senate, Secretary of the Senate, 2006 U.S. Senate Employment, Compensation, Hiring and Benefits Study (Washington: 2006). 4 In this report, pay refers to monies paid by the Senate to staff, and excludes other components of total compensation, which might include paid leave or employer contributions to various insurance and retirement benefits. 5 The Report of the Secretary of the Senate since April, 2011, is available at https://www.senate.gov/legislative/common/generic/report_secsen.htm. 6 http://www.legistorm.com/. 7 For a discussion of staff roles in Members’ offices, see CRS Report RL34545, Congressional Staff: Duties and Functions of Selected Positions, by R. Eric Petersen. 8 Other job titles which may indicate similar duties, and for which pay data were collected, include Office Manager, Office Administrator, and Administrative Manager. 9 Other job titles which may indicate similar duties, and for which pay data were collected, include Casework Director, Casework Coordinator, and Director of Constituent Services. 10 Other job titles which may indicate similar duties, and for which pay data were collected, include Constituent Services Representative and Federal Caseworker.
Staff Pay Levels for Selected Positions in Senators’ Offices, FY2009-FY2013
Congressional Research Service 2
• Chief of Staff
• Communications Director
• Counsel11
• Executive Assistant
• Field Representative12
• Legislative Assistant
• Legislative Correspondent
• Legislative Director.
• Press Secretary
• Scheduler
• “Specials Director,” a combined category that includes the job titles Director of Projects, Director of Special Projects, Director of Federal Projects, Director of Grants, Projects Director, or Grants Director
• Staff Assistant
• State Director
Senators’ staff pay data for the years FY2009-FY2013 were derived from a random sampling of Senators’ offices in which at least one staff member worked in a position in each year. For each fiscal year, FY2009-FY2013, a random sample13 of 25 Senators’ offices was taken for each position. In order to be included, Senate staff had to hold a position with the same job title in the Senator’s office for the entire fiscal year examined. Every recorded payment ascribed in the LegiStorm data to those staff for the fiscal year is included. For some positions, it was not possible to identify 25 offices that employed staff for an entire year. Generally, each position has no more than one observation per Senator’s office each fiscal year.
Pay data for staff working in House Member offices are available in CRS Report R43775, Staff Pay Levels for Selected Positions in House Member Offices, 2009-2013, by R. Eric Petersen, Lara E. Chausow, and Amber Hope Wilhelm.
11 Other job titles which may indicate similar duties, and for which pay data were collected, include Legal Counsel, Legislative Counsel, Senior Counsel, Chief Counsel, and General Counsel. 12 Another job title which may indicate similar duties, and for which pay data were collected, was Regional Representative. 13 Obtaining the salaries of every congressional staff member from every Senator’s office listed in the Report of the Secretary of the Senate was beyond the capacity of available resources. Each year, a different, random sample of Senators’ offices was taken for each position. The large random samples of positions in Senators’ offices mean that a full accounting would be unlikely to yield significantly different results. At the same time, a study that examines pay data based on different job titles, or which combines pay data from positions of similar titles or duties (e.g., legislative assistant and senior legislative assistant, or executive assistants, schedulers and executive assistant/schedulers), could result in findings that are different from those provided here.

Staff Pay Levels for Selected Positions in Senators’ Offices, FY2009-FY2013
Congressional Research Service 3
Data Concerns There may be some advantages to relying on official salary expenditure data instead of survey findings, but data presented here are subject to some challenges that could affect findings or their interpretation. Some of the concerns include the following:
• Data are lacking for first-term Senators in the first session of a Congress. The periods of time covered by the Report of the Secretary of the Senate overlap the end of one Congress and convening of the next. This report provides no data for first-term Senators in the first nine months of their service.14
• Pay data provide no insight into the experience, tenure, full- or part-time status, demographics, or other potential explanations for levels of compensation.
• Staff could be based in Washington, DC, state offices, or both.
• Potential differences might exist in the job duties of positions with the same title. Aggregation of pay by job title rests on the assumption that staff with the same title carry out the same or similar tasks. Given the wide discretion congressional employing authorities have in setting the terms and conditions of employment, there may be differences in the duties of similarly titled staff that could have effects on their levels of pay. Acknowledging the imprecision inherent in congressional job titles, an older edition of the Senate Handbook states, “Throughout the Senate, individuals with the same job title perform vastly different duties.”15
Data Tables and Visualizations Data tables provide tabular pay data for each staff position. A graphic for each position is also included. The graphics display representations of pay from three perspectives, including the following:
• change in pay, FY2009-FY2013, in nominal (current) and constant, 2014 dollars;
• a comparison of the cumulative percentage change of that position to changes in pay, in constant dollars, of Members of Congress, and federal civilian workers paid under the General Schedule in Washington, DC, and surrounding areas in northern Virginia, Maryland, West Virginia and Pennsylvania (DC),16 and Rest of the U.S. (RUS)17 from FY2009-FY201318; and
14 For information on the number of first-term Members in each Congress, see CRS Report R41283, First-Term Members of the House of Representatives and Senate, 64th - 113th Congresses, by Jennifer E. Manning and R. Eric Petersen. 15 U.S. Senate, Committee on Rules and Administration, Senate Handbook (Washington: 1996), pp. I-13, available from the authors. 16 For a complete description of areas covered under the Washington-Baltimore-Northern Virginia, DC-MD-VA-WV-PA locality pay table, see http://www.opm.gov/policy-data-oversight/pay-leave/salaries-wages/2014/locality-pay-area-definitions/#w. 17 The RUS pay table includes those portions of the United States and its territories and possessions (nonforeign areas) not located within another locality pay area. For definitions of 2014 locality pay areas, see Office of Personnel (continued...)

Staff Pay Levels for Selected Positions in Senators’ Offices, FY2009-FY2013
Congressional Research Service 4
• distributions of FY2013 pay in 2014 dollars, in $10,000 increments.
Between 2009 and 2013, the median19 change in pay, in constant 2014 dollars, for all 16 staff positions working in Senators’ offices declined. The smallest change, -0.13%, was found among administrative directors. Schedulers were affected by the greatest change, -20.56%, between FY2009 and FY2013. This may be compared to changes over approximately the same period (calendar years 2009-2013) to Members of Congress, -7.91%; General Schedule, DC, -5.67%; and General Schedule, RUS, -6.28%.
(...continued) Management, “Pay & Leave, Salaries & Wages,” http://www.opm.gov/policy-data-oversight/pay-leave/salaries-wages/2014/locality-pay-area-definitions. For discussion of how locality pay is calculated, see CRS Report RL34463, Federal White-Collar Pay: FY2009 and FY2010 Salary Adjustments, by Barbara L. Schwemle. 18 Change in pay data for General Schedule and Members of Congress are based on calendar year 2009-2013 change; staff positions are based on median change, FY2009-FY2013. 19 The median is the midpoint at which half of the numbers in a list are higher and the other half lower.

Staff Pay Levels for Selected Positions in Senators’ Offices, FY2009-FY2013
Congressional Research Service 5
Table 1. Administrative Director
Duties may include: directing the administrative support staff; maintenance of office accounts; and procuring and maintaining equipment for office.
FY09 FY10 FY11 FY12 FY13
Nom
inal
$ Minimum $46,459 $64,772 $54,375 $58,000 $42,667
Median $95,164 $105,167 $107,000 $107,000 $103,200
Average $96,479 $102,624 $104,195 $104,323 $102,752
Maximum $140,250 $150,811 $153,506 $135,521 $169,000
Con
stan
t $
Minimum $51,190 $70,216 $57,141 $59,715 $43,294
Median $104,855 $114,006 $112,444 $110,164 $104,718
Average $106,303 $111,250 $109,496 $107,408 $104,263
Maximum $154,532 $163,487 $161,317 $139,529 $171,486
Cha
nge
Median – 8.73% -1.37% -2.03% -4.94%
Average – 4.65% -1.58% -1.91% -2.93%
Annual Average -0.44% Annual Median 0.10%
FY09-FY13 Average -1.92% FY09-FY13 Median -0.13%
Source: Report of the Secretary of the Senate, as collated by LegiStorm, various years, and CRS calculations. Visualizations provide information in constant 2014 dollars in thousands, except where indicated. Detailed information about data sources is available above in “Data Tables and Visualizations.”
Notes: Data are based on a sample of 25 observations per year from various Senators’ offices. Other job titles included in data for this position include Office Manager, Office Administrator, and Administrative Manager. In the Change section of the data table, Annual Average and Annual Median cells provide the average and median change per year, respectively, while the FY09-FY13 Average and FY09-FY13 Median provide the change over the entire five-year period, respectively. Change in pay data for General Schedule and Members of Congress are based on calendar year 2009-2013 change; staff position is based on median change, FY2009-FY2013. In the FY2013 Distribution of Pay visualization, percentages are rounded, and may not equal 100%.

Staff Pay Levels for Selected Positions in Senators’ Offices, FY2009-FY2013
Congressional Research Service 6
Table 2. Casework Supervisor Duties may include: managing caseworkers and casework workflows; and acting as a liaison for the Senator with federal, state, and local agencies on behalf of constituents.
FY09 FY10 FY11 FY12 FY13
Nom
inal
$ Minimum $55,750 $40,773 $40,773 $40,000 $34,187
Median $79,000 $81,416 $74,154 $76,000 $72,000
Average $79,269 $80,992 $76,233 $74,940 $68,184
Maximum $109,356 $120,697 $122,000 $127,000 $95,583
Con
stan
t $
Minimum $61,427 $44,200 $42,847 $41,183 $34,689
Median $87,045 $88,259 $77,927 $78,247 $73,059
Average $87,341 $87,799 $80,111 $77,157 $69,187
Maximum $120,493 $130,841 $128,207 $130,756 $96,989
Cha
nge
Median – 1.39% -11.71% 0.41% -6.63%
Average – 0.53% -8.76% -3.69% -10.33%
Annual Average -5.56% Annual Median -4.13%
FY09-FY13 Average -20.78% FY09-FY13 Median -16.07%
Source: Report of the Secretary of the Senate, as collated by LegiStorm, various years, and CRS calculations. Visualizations provide information in constant 2014 dollars in thousands, except where indicated. Detailed information about data sources is available above in “Data Tables and Visualizations.”
Notes: Data are based on a sample of 25 observations per year from various Senators’ offices. Other job titles included in data for this position include Casework Director, Casework Coordinator, and Director of Constituent Services. In the Change section of the data table, Annual Average and Annual Median cells provide the average and median change per year, respectively, while the FY09-FY13 Average and FY09-FY13 Median provide the change over the entire five-year period, respectively. Change in pay data for General Schedule and Members of Congress are based on calendar year 2009-2013 change; staff position is based on median change, FY2009-FY2013. In the FY2013 Distribution of Pay visualization, percentages are rounded, and may not equal 100%.

Staff Pay Levels for Selected Positions in Senators’ Offices, FY2009-FY2013
Congressional Research Service 7
Table 3. Caseworker Duties may include: responding to casework inquiries from constituents; acting as a grassroots representative for the Senator within assigned areas of responsibility; and monitoring and updating the Senator or relevant official in the office on casework issues.
FY09 FY10 FY11 FY12 FY13
Nom
inal
$ Minimum $19,583 $23,500 $28,237 $30,000 $30,000
Median $42,629 $41,745 $41,603 $43,365 $44,125
Average $44,897 $47,926 $44,809 $44,187 $46,201
Maximum $76,847 $90,800 $87,450 $87,465 $85,000
Con
stan
t $
Minimum $21,578 $25,475 $29,674 $30,887 $30,441
Median $46,970 $45,253 $43,720 $44,647 $44,774
Average $49,469 $51,954 $47,089 $45,494 $46,881
Maximum $84,673 $98,432 $91,899 $90,052 $86,250
Cha
nge
Median – -3.65% -3.39% 2.12% 0.28%
Average – 5.02% -9.36% -3.39% 3.05%
Annual Average -1.17% Annual Median -1.16%
FY09-FY13 Average -5.23% FY09-FY13 Median -4.68%
Source: Report of the Secretary of the Senate, as collated by LegiStorm, various years, and CRS calculations. Visualizations provide information in constant 2014 dollars in thousands, except where indicated. Detailed information about data sources is available above in “Data Tables and Visualizations.”
Notes: Data are based on a sample of 25 observations per year from various Senators’ offices. Other job titles included in data for this position include Constituent Services Representative and Federal Caseworker. In the Change section of the data table, Annual Average and Annual Median cells provide the average and median change per year, respectively, while the FY09-FY13 Average and FY09-FY13 Median provide the change over the entire five-year period, respectively. Change in pay data for General Schedule and Members of Congress are based on calendar year 2009-2013 change; staff position is based on median change, FY2009-FY2013. In the FY2013 Distribution of Pay visualization, percentages are rounded, and may not equal 100%.

Staff Pay Levels for Selected Positions in Senators’ Offices, FY2009-FY2013
Congressional Research Service 8
Table 4. Chief of Staff Duties may include: developing and implementing all policy objectives, strategies, and operating plans for a Senator’s office; managing and directing all activities and staff of the Senator's Washington, DC, and field offices; coordinating the activities of the Senator with the leadership of the appropriate chamber and committees; and overseeing the Senator's office budget.
FY09 FY10 FY11 FY12 FY13
Nom
inal
$ Minimum $147,960 $156,930 $138,500 $140,417 $128,844
Median $166,926 $169,428 $169,459 $169,459 $166,500
Average $164,532 $166,654 $166,692 $166,399 $161,550
Maximum $167,305 $169,459 $169,459 $169,459 $169,459
Con
stan
t $
Minimum $163,027 $170,121 $145,547 $144,569 $130,739
Median $183,925 $183,669 $178,081 $174,471 $168,949
Average $181,287 $180,662 $175,174 $171,320 $163,926
Maximum $184,342 $183,702 $178,081 $174,471 $171,952
Cha
nge
Median – -0.14% -3.04% -2.03% -3.16%
Average – -0.35% -3.04% -2.20% -4.32%
Annual Average -2.47% Annual Median -2.09%
FY09-FY13 Average -9.58% FY09-FY13 Median -8.14%
Source: Report of the Secretary of the Senate, as collated by LegiStorm, various years, and CRS calculations. Visualizations provide information in constant 2014 dollars in thousands, except where indicated. Detailed information about data sources is available above in “Data Tables and Visualizations.”
Notes: Data are based on a sample of 25 observations per year from various Senators’ offices. In the Change section of the data table, Annual Average and Annual Median cells provide the average and median change per year, respectively, while the FY09-FY13 Average and FY09-FY13 Median provide the change over the entire five-year period, respectively. Change in pay data for General Schedule and Members of Congress are based on calendar year 2009-2013 change; staff position is based on median change, FY2009-FY2013. In the FY2013 Distribution of Pay visualization, percentages are rounded, and may not equal 100%.

Staff Pay Levels for Selected Positions in Senators’ Offices, FY2009-FY2013
Congressional Research Service 9
Table 5. Communications Director Duties may include managing and coordination all messaging for the Senator and the office.
FY09 FY10 FY11 FY12 FY13
Nom
inal
$ Minimum $75,400 $90,875 $90,000 $91,855 $80,333
Median $109,296 $116,996 $108,562 $117,500 $115,575
Average $111,197 $115,873 $113,114 $115,597 $116,213
Maximum $156,687 $167,500 $168,547 $147,184 $164,568
Con
stan
t $ Minimum $83,078 $98,513 $94,579 $94,572 $81,515
Median $120,425 $126,829 $114,086 $120,975 $117,275
Average $122,521 $125,612 $118,869 $119,016 $117,922
Maximum $172,643 $181,579 $177,123 $151,537 $166,989
Cha
nge
Median – 5.32% -10.05% 6.04% -3.06%
Average – 2.52% -5.37% 0.12% -0.92%
Annual Average -0.91% Annual Median -0.44% FY09-FY13 Average -3.75% FY09-FY13 Median -2.62%
Source: Report of the Secretary of the Senate, as collated by LegiStorm, various years, and CRS calculations. Visualizations provide information in constant 2014 dollars in thousands, except where indicated. Detailed information about data sources is available above in “Data Tables and Visualizations.”
Notes: Data are based on a sample of 25 observations per year from various Senators’ offices. In the Change section of the data table, Annual Average and Annual Median cells provide the average and median change per year, respectively, while the FY09-FY13 Average and FY09-FY13 Median provide the change over the entire five-year period, respectively. Change in pay data for General Schedule and Members of Congress are based on calendar year 2009-2013 change; staff position is based on median change, FY2009-FY2013. In the FY2013 Distribution of Pay visualization, percentages are rounded, and may not equal 100%.

Staff Pay Levels for Selected Positions in Senators’ Offices, FY2009-FY2013
Congressional Research Service 10
Table 6. Counsel Duties may include: advising the Senator on legal issues; and ensuring compliance with chamber rules, the law, and ethics guidelines.
FY09 FY10 FY11 FY12 FY13
Nom
inal
$ Minimum $45,000 $45,000 $45,000 $49,750 $55,250
Median $89,000 $85,250 $81,663 $80,868 $83,200
Average $88,826 $86,043 $81,035 $87,312 $83,353
Maximum $129,788 $141,500 $138,000 $151,275 $109,000
Con
stan
t $ Minimum $49,582 $48,782 $47,290 $51,221 $56,063
Median $98,063 $92,415 $85,818 $83,260 $84,424
Average $97,871 $93,275 $85,158 $89,894 $84,579
Maximum $143,005 $153,393 $145,022 $155,749 $110,603
Cha
nge
Median – -5.76% -7.14% -2.98% 1.40%
Average – -4.70% -8.70% 5.56% -5.91%
Annual Average -3.44% Annual Median -3.62% FY09-FY13 Average -13.58% FY09-FY13 Median -13.91%
Source: Report of the Secretary of the Senate, as collated by LegiStorm, various years, and CRS calculations. Visualizations provide information in constant 2014 dollars in thousands, except where indicated. Detailed information about data sources is available above in “Data Tables and Visualizations.”
Notes: Data are based on a sample of 25 observations in FY10 and FY12; 23 in FY09; and 21 in FY11 and FY13 from various Senators’ offices. Other job titles included in data for this position include Legal Counsel, Legislative Counsel, Senior Counsel, Chief Counsel, and General Counsel. In the Change section of the data table, Annual Average and Annual Median cells provide the average and median change per year, respectively, while the FY09-FY13 Average and FY09-FY13 Median provide the change over the entire five-year period, respectively. Change in pay data for General Schedule and Members of Congress are based on calendar year 2009-2013 change; staff position is based on median change, FY2009-FY2013. In the FY2013 Distribution of Pay visualization, percentages are rounded, and may not equal 100%.

Staff Pay Levels for Selected Positions in Senators’ Offices, FY2009-FY2013
Congressional Research Service 11
Table 7. Executive Assistant Duties may include: maintaining the Senator's files, including notes, correspondence, and all information related to travel; logging and monitoring the Senator's incoming telephone calls; taking messages; and ensuring that the Senator is provided with briefing materials for various activities in which the Senator participates.
FY09 FY10 FY11 FY12 FY13
Nom
inal
$ Minimum $42,272 $33,458 $37,500 $37,500 $37,667
Median $86,817 $88,531 $77,000 $86,000 $81,372
Average $91,183 $90,428 $84,788 $87,805 $85,565
Maximum $167,305 $169,459 $169,459 $169,459 $169,459
Con
stan
t $ Minimum $46,577 $36,270 $39,408 $38,609 $38,221
Median $95,658 $95,972 $80,918 $88,543 $82,569
Average $100,469 $98,029 $89,102 $90,402 $86,824
Maximum $184,342 $183,702 $178,081 $174,471 $171,952
Cha
nge
Median – 0.33% -15.69% 9.42% -6.75%
Average – -2.43% -9.11% 1.46% -3.96%
Annual Average -3.51% Annual Median -3.17% FY09-FY13 Average -13.58% FY09-FY13 Median -13.68%
Source: Report of the Secretary of the Senate, as collated by LegiStorm, various years, and CRS calculations. Visualizations provide information in constant 2014 dollars in thousands, except where indicated. Detailed information about data sources is available above in “Data Tables and Visualizations.”
Notes: Data are based on a sample of 25 observations per year, FY09-FY12; and 22 in FY13, from various Senators’ offices. In the Change section of the data table, Annual Average and Annual Median cells provide the average and median change per year, respectively, while the FY09-FY13 Average and FY09-FY13 Median provide the change over the entire five-year period, respectively. Change in pay data for General Schedule and Members of Congress are based on calendar year 2009-2013 change; staff position is based on median change, FY2009-FY2013. In the FY2013 Distribution of Pay visualization, percentages are rounded, and may not equal 100%.

Staff Pay Levels for Selected Positions in Senators’ Offices, FY2009-FY2013
Congressional Research Service 12
Table 8. Field Representative Duties may include: acting as a liaison with federal, state, and local agencies for the Senator and constituents; and assessing casework for matters that might require legislative action.
FY09 FY10 FY11 FY12 FY13
Nom
inal
$ Minimum $29,495 $30,712 $32,250 $31,750 $33,500
Median $53,500 $58,750 $54,504 $53,768 $53,000
Average $55,405 $58,025 $54,968 $55,790 $55,482
Maximum $91,750 $102,500 $74,927 $79,670 $83,000
Con
stan
t $ Minimum $32,499 $33,294 $33,891 $32,689 $33,993
Median $58,948 $63,688 $57,277 $55,358 $53,780
Average $61,047 $62,902 $57,765 $57,440 $56,298
Maximum $101,093 $111,115 $78,739 $82,026 $84,221
Cha
nge
Median – 8.04% -10.07% -3.35% -2.85%
Average – 3.04% -8.17% -0.56% -1.99%
Annual Average -1.92% Annual Median -2.06% FY09-FY13 Average -7.78% FY09-FY13 Median -8.77%
Source: Report of the Secretary of the Senate, as collated by LegiStorm, various years, and CRS calculations. Visualizations provide information in constant 2014 dollars in thousands, except where indicated. Detailed information about data sources is available above in “Data Tables and Visualizations.”
Notes: Data are based on a sample of 25 observations per year from various Senators’ offices. Another job title included in data for this position is Regional Representative. In the Change section of the data table, Annual Average and Annual Median cells provide the average and median change per year, respectively, while the FY09-FY13 Average and FY09-FY13 Median provide the change over the entire five-year period, respectively. Change in pay data for General Schedule and Members of Congress are based on calendar year 2009-2013 change; staff position is based on median change, FY2009-FY2013. In the FY2013 Distribution of Pay visualization, percentages are rounded, and may not equal 100%.

Staff Pay Levels for Selected Positions in Senators’ Offices, FY2009-FY2013
Congressional Research Service 13
Table 9. Legislative Assistant Duties may include: developing legislative initiatives; advising the Senator on legislative issues; and monitoring legislative and policy developments within assigned substantive areas.
FY09 FY10 FY11 FY12 FY13
Nom
inal
$ Minimum $50,042 $55,021 $46,042 $46,667 $42,333
Median $66,125 $77,344 $70,396 $74,000 $65,640
Average $69,293 $75,900 $70,272 $73,228 $65,043
Maximum $106,916 $110,528 $112,078 $120,828 $87,750
Con
stan
t $ Minimum $55,138 $59,645 $48,384 $48,047 $42,956
Median $72,859 $83,845 $73,978 $76,188 $66,606
Average $76,349 $82,279 $73,847 $75,393 $66,000
Maximum $117,803 $119,818 $117,780 $124,401 $89,041
Cha
nge
Median – 15.08% -11.77% 2.99% -12.58%
Average – 7.77% -10.25% 2.09% -12.46%
Annual Average -3.21% Annual Median -1.57% FY09-FY13 Average -13.56% FY09-FY13 Median -8.58%
Source: Report of the Secretary of the Senate, as collated by LegiStorm, various years, and CRS calculations. Visualizations provide information in constant 2014 dollars in thousands, except where indicated. Detailed information about data sources is available above in “Data Tables and Visualizations.”
Notes: Data are based on a sample of 25 observations per year from various Senators’ offices. In the Change section of the data table, Annual Average and Annual Median cells provide the average and median change per year, respectively, while the FY09-FY13 Average and FY09-FY13 Median provide the change over the entire five-year period, respectively. Change in pay data for General Schedule and Members of Congress are based on calendar year 2009-2013 change; staff position is based on median change, FY2009-FY2013. In the FY2013 Distribution of Pay visualization, percentages are rounded, and may not equal 100%.

Staff Pay Levels for Selected Positions in Senators’ Offices, FY2009-FY2013
Congressional Research Service 14
Table 10. Legislative Correspondent Duties may include: providing research for response to constituents' correspondence; drafting, proofreading, and transmitting letters; and providing administrative support to legislative staff as needed.
FY09 FY10 FY11 FY12 FY13
Nom
inal
$ Minimum $30,156 $30,484 $31,500 $29,250 $34,000
Median $36,786 $39,850 $37,000 $35,786 $37,787
Average $38,093 $39,817 $37,460 $37,616 $39,396
Maximum $49,750 $50,500 $51,250 $53,417 $49,083
Con
stan
t $ Minimum $33,226 $33,046 $33,103 $30,115 $34,500
Median $40,532 $43,199 $38,883 $36,844 $38,343
Average $41,972 $43,164 $39,366 $38,729 $39,976
Maximum $54,816 $54,745 $53,858 $54,996 $49,805
Cha
nge
Median – 6.58% -9.99% -5.24% 4.07%
Average – 2.84% -8.80% -1.62% 3.22%
Annual Average -1.09% Annual Median -1.15% FY09-FY13 Average -4.76% FY09-FY13 Median -5.40%
Source: Report of the Secretary of the Senate, as collated by LegiStorm, various years, and CRS calculations. Visualizations provide information in constant 2014 dollars in thousands, except where indicated. Detailed information about data sources is available above in “Data Tables and Visualizations.”
Notes: Data are based on a sample of 25 observations per year from various Senators’ offices. In the Change section of the data table, Annual Average and Annual Median cells provide the average and median change per year, respectively, while the FY09-FY13 Average and FY09-FY13 Median provide the change over the entire five-year period, respectively. Change in pay data for General Schedule and Members of Congress are based on calendar year 2009-2013 change; staff position is based on median change, FY2009-FY2013. In the FY2013 Distribution of Pay visualization, percentages are rounded, and may not equal 100%.
Staff Pay Levels for Selected Positions in Senators’ Offices, FY2009-FY2013
Congressional Research Service 15
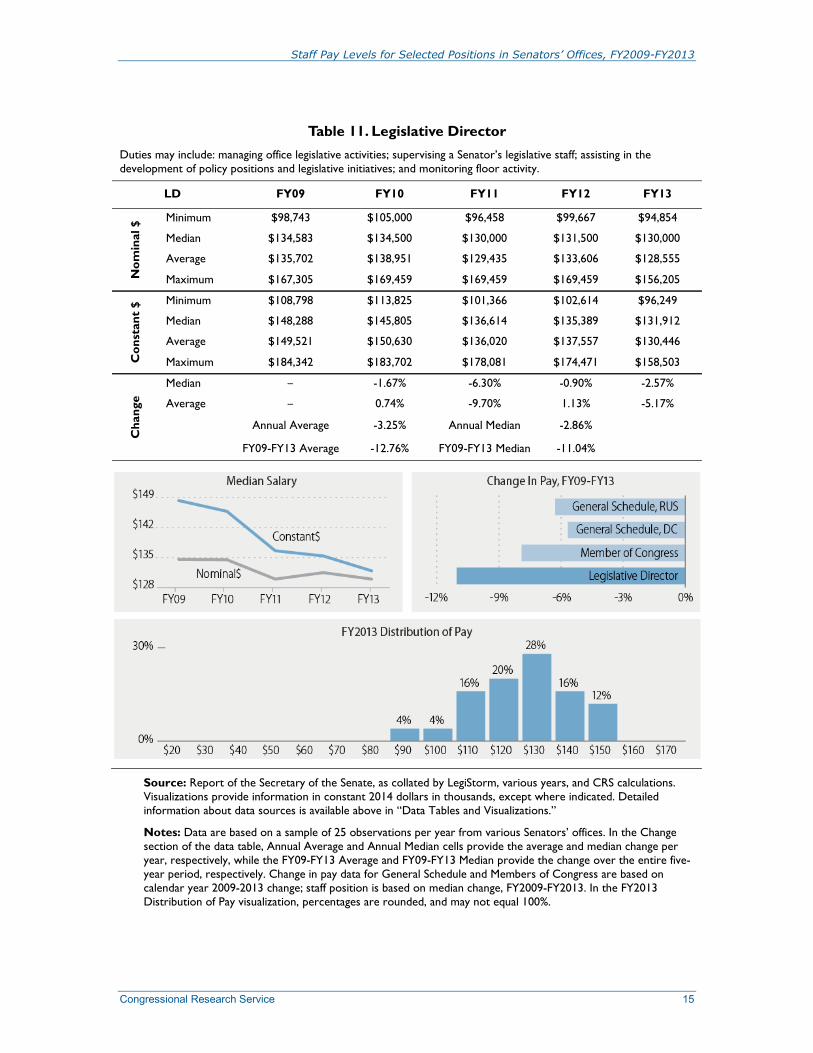
Table 11. Legislative Director Duties may include: managing office legislative activities; supervising a Senator’s legislative staff; assisting in the development of policy positions and legislative initiatives; and monitoring floor activity.
LD FY09 FY10 FY11 FY12 FY13
Nom
inal
$ Minimum $98,743 $105,000 $96,458 $99,667 $94,854
Median $134,583 $134,500 $130,000 $131,500 $130,000
Average $135,702 $138,951 $129,435 $133,606 $128,555
Maximum $167,305 $169,459 $169,459 $169,459 $156,205
Con
stan
t $ Minimum $108,798 $113,825 $101,366 $102,614 $96,249
Median $148,288 $145,805 $136,614 $135,389 $131,912
Average $149,521 $150,630 $136,020 $137,557 $130,446
Maximum $184,342 $183,702 $178,081 $174,471 $158,503
Cha
nge
Median – -1.67% -6.30% -0.90% -2.57%
Average – 0.74% -9.70% 1.13% -5.17%
Annual Average -3.25% Annual Median -2.86% FY09-FY13 Average -12.76% FY09-FY13 Median -11.04%
Source: Report of the Secretary of the Senate, as collated by LegiStorm, various years, and CRS calculations. Visualizations provide information in constant 2014 dollars in thousands, except where indicated. Detailed information about data sources is available above in “Data Tables and Visualizations.”
Notes: Data are based on a sample of 25 observations per year from various Senators’ offices. In the Change section of the data table, Annual Average and Annual Median cells provide the average and median change per year, respectively, while the FY09-FY13 Average and FY09-FY13 Median provide the change over the entire five-year period, respectively. Change in pay data for General Schedule and Members of Congress are based on calendar year 2009-2013 change; staff position is based on median change, FY2009-FY2013. In the FY2013 Distribution of Pay visualization, percentages are rounded, and may not equal 100%.

Staff Pay Levels for Selected Positions in Senators’ Offices, FY2009-FY2013
Congressional Research Service 16
Table 12. Press Secretary Duties may include: developing and implementing media and communications strategies for the Senator; acting as the formal spokesperson and media liaison for the Senator; and writing speeches for the Senator.
FY09 FY10 FY11 FY12 FY13
Nom
inal
$ Minimum $38,452 $41,000 $46,808 $40,000 $39,221
Median $67,453 $70,096 $61,896 $59,083 $59,500
Average $71,592 $73,021 $65,442 $64,934 $64,690
Maximum $131,000 $138,419 $110,591 $118,000 $127,500
Con
stan
t $ Minimum $42,368 $44,446 $49,190 $41,183 $39,798
Median $74,322 $75,987 $65,045 $60,831 $60,375
Average $78,883 $79,158 $68,772 $66,855 $65,642
Maximum $144,340 $150,053 $116,218 $121,490 $129,376
Cha
nge
Median – 2.24% -14.40% -6.48% -0.75%
Average – 0.35% -13.12% -2.79% -1.81%
Annual Average -4.34% Annual Median -4.85% FY09-FY13 Average -16.79% FY09-FY13 Median -18.77%
Source: Report of the Secretary of the Senate, as collated by LegiStorm, various years, and CRS calculations. Visualizations provide information in constant 2014 dollars in thousands, except where indicated. Detailed information about data sources is available above in “Data Tables and Visualizations.”
Notes: Data are based on a sample of 25 observations per year, FY09-FY10, and FY12-FY13; and 24, in FY11, from various Senators’ offices. In the Change section of the data table, Annual Average and Annual Median cells provide the average and median change per year, respectively, while the FY09-FY13 Average and FY09-FY13 Median provide the change over the entire five-year period, respectively. Change in pay data for General Schedule and Members of Congress are based on calendar year 2009-2013 change; staff position is based on median change, FY2009-FY2013. In the FY2013 Distribution of Pay visualization, percentages are rounded, and may not equal 100%.

Staff Pay Levels for Selected Positions in Senators’ Offices, FY2009-FY2013
Congressional Research Service 17
Table 13. Scheduler Duties may include: briefing the Senator on all scheduling activities; making recommendations on proposed meetings; scheduling staff meetings; and coordinating the scheduling of the Senator’s press and media interactions with the press secretary or communications director.
FY09 FY10 FY11 FY12 FY13
Nom
inal
$ Minimum $28,468 $34,916 $38,000 $38,792 $33,641
Median $78,250 $76,887 $72,500 $76,000 $67,500
Average $76,762 $78,105 $76,168 $77,970 $72,157
Maximum $162,986 $125,701 $159,333 $135,000 $130,000
Con
stan
t $ Minimum $31,367 $37,851 $39,933 $39,939 $34,136
Median $86,218 $83,350 $76,189 $78,248 $68,493
Average $84,579 $84,669 $80,043 $80,276 $73,219
Maximum $179,583 $136,266 $167,440 $138,992 $131,912
Cha
nge
Median – -3.33% -8.59% 2.70% -12.47%
Average – 0.11% -5.46% 0.29% -8.79%
Annual Average -3.46% Annual Median -5.42%
FY09-FY13 Average -13.43% FY09-FY13 Median -20.56%
Source: Report of the Secretary of the Senate, as collated by LegiStorm, various years, and CRS calculations. Visualizations provide information in constant 2014 dollars in thousands, except where indicated. Detailed information about data sources is available above in “Data Tables and Visualizations.”
Notes: Data are based on a sample of 25 observations per year from various Senators’ offices. In the Change section of the data table, Annual Average and Annual Median cells provide the average and median change per year, respectively, while the FY09-FY13 Average and FY09-FY13 Median provide the change over the entire five-year period, respectively. Change in pay data for General Schedule and Members of Congress are based on calendar year 2009-2013 change; staff position is based on median change, FY2009-FY2013. In the FY2013 Distribution of Pay visualization, percentages are rounded, and may not equal 100%.

Staff Pay Levels for Selected Positions in Senators’ Offices, FY2009-FY2013
Congressional Research Service 18
Table 14. Specials Director Duties may include: overseeing office activities or staff related to grants or projects designated by the Senator.
FY09 FY10 FY11 FY12 FY13
Nom
inal
$ Minimum $16,810 $25,088 $38,000 $33,825 $40,600
Median $59,246 $60,653 $68,017 $60,962 $55,000
Average $64,690 $63,544 $67,259 $65,481 $60,860
Maximum $134,557 $139,788 $96,655 $97,083 $105,083
Con
stan
t $ Minimum $18,522 $27,197 $39,933 $34,825 $41,197
Median $65,279 $65,751 $71,478 $62,765 $55,809
Average $71,278 $68,885 $70,681 $67,417 $61,756
Maximum $148,260 $151,538 $101,573 $99,954 $106,629
Cha
nge
Median – 0.72% 8.71% -12.19% -11.08%
Average – -3.36% 2.61% -4.62% -8.40%
Annual Average -3.44% Annual Median -3.46% FY09-FY13 Average -13.36% FY09-FY13 Median -14.51%
Source: Report of the Secretary of the Senate, as collated by LegiStorm, various years, and CRS calculations. Visualizations provide information in constant 2014 dollars in thousands, except where indicated. Detailed information about data sources is available above in “Data Tables and Visualizations.”
Notes: Data are based on a sample of 25 observations per year, FY09-FY10, 22, in FY11-FY12, and 15, in FY13, from various Senators’ offices. Job titles included in data for this combined category include Director of Projects, Director of Special Projects, Director of Federal Projects, Director of Grants, Projects Director, or Grants Director. In the Change section of the data table, Annual Average and Annual Median cells provide the average and median change per year, respectively, while the FY09-FY13 Average and FY09-FY13 Median provide the change over the entire five-year period, respectively. Change in pay data for General Schedule and Members of Congress are based on calendar year 2009-2013 change; staff position is based on median change, FY2009-FY2013. In the FY2013 Distribution of Pay visualization, percentages are rounded, and may not equal 100%.

Staff Pay Levels for Selected Positions in Senators’ Offices, FY2009-FY2013
Congressional Research Service 19
Table 15. Staff Assistant Duties may include: answering telephones and providing support services; greeting visitors; assisting with scheduling; responding to constituent requests for general information, tours and other non-legislative matters; and monitoring delivery and pickup of materials.
FY09 FY10 FY11 FY12 FY13
Nom
inal
$ Minimum $18,683 $18,781 $27,668 $22,000 $24,431
Median $35,216 $35,661 $35,083 $33,583 $35,062
Average $37,386 $36,566 $37,963 $37,968 $35,959
Maximum $56,500 $61,500 $59,300 $72,000 $60,300
Con
stan
t $ Minimum $20,585 $20,359 $29,076 $22,651 $24,791
Median $38,802 $38,659 $36,868 $34,577 $35,578
Average $41,193 $39,639 $39,894 $39,091 $36,488
Maximum $62,254 $66,669 $62,317 $74,129 $61,187
Cha
nge
Median – -0.37% -4.63% -6.22% 2.90%
Average – -3.77% 0.64% -2.01% -6.66%
Annual Average -2.95% Annual Median -2.08% FY09-FY13 Average -11.42% FY09-FY13 Median -8.31%
Source: Report of the Secretary of the Senate, as collated by LegiStorm, various years, and CRS calculations. Visualizations provide information in constant 2014 dollars in thousands, except where indicated. Detailed information about data sources is available above in “Data Tables and Visualizations.”
Notes: Data are based on a sample of 25 observations per year from various Senators’ offices. In the Change section of the data table, Annual Average and Annual Median cells provide the average and median change per year, respectively, while the FY09-FY13 Average and FY09-FY13 Median provide the change over the entire five-year period, respectively. Change in pay data for General Schedule and Members of Congress are based on calendar year 2009-2013 change; staff position is based on median change, FY2009-FY2013. In the FY2013 Distribution of Pay visualization, percentages are rounded, and may not equal 100%.

Staff Pay Levels for Selected Positions in Senators’ Offices, FY2009-FY2013
Congressional Research Service 20
Table 16. State Director Duties may include: managing the principal state office or other state offices of a Senator; and overseeing all state office operations.
FY09 FY10 FY11 FY12 FY13
Nom
inal
$ Minimum $81,132 $79,429 $81,500 $83,500 $56,167
Median $113,975 $116,496 $123,557 $116,500 $120,400
Average $118,890 $120,986 $126,386 $123,006 $125,491
Maximum $167,305 $169,459 $169,459 $169,459 $169,459
Con
stan
t $ Minimum $89,394 $86,106 $85,647 $85,969 $56,993
Median $125,581 $126,288 $129,844 $119,945 $122,171
Average $130,997 $131,155 $132,816 $126,643 $127,337
Maximum $184,342 $183,702 $178,081 $174,471 $171,952
Cha
nge
Median – 0.56% 2.82% -7.62% 1.86%
Average – 0.12% 1.27% -4.65% 0.55%
Annual Average -0.68% Annual Median -0.60% FY09-FY13 Average -2.79% FY09-FY13 Median -2.72%
Source: Report of the Secretary of the Senate, as collated by LegiStorm, various years, and CRS calculations. Visualizations provide information in constant 2014 dollars in thousands, except where indicated. Detailed information about data sources is available above in “Data Tables and Visualizations.”
Notes: Data are based on a sample of 25 observations per year from various Senators’ offices. In the Change section of the data table, Annual Average and Annual Median cells provide the average and median change per year, respectively, while the FY09-FY13 Average and FY09-FY13 Median provide the change over the entire five-year period, respectively. Change in pay data for General Schedule and Members of Congress are based on calendar year 2009-2013 change; staff position is based on median change, FY2009-FY2013. In the FY2013 Distribution of Pay visualization, percentages are rounded, and may not equal 100%.

Staff Pay Levels for Selected Positions in Senators’ Offices, FY2009-FY2013
Congressional Research Service 21
Author Contact Information R. Eric Petersen Specialist in American National Government [email protected], 7-0643
Amber Hope Wilhelm Visual Information Specialist [email protected], 7-2392
Lara E. Chausow Research Assistant [email protected], 7-2384
Acknowledgments Jose Wisniewski and Claire Laurence, former CRS interns, collected data for this report.