staff pay levels for selected positions in house member ... · staff pay levels for selected...
TRANSCRIPT

Staff Pay Levels for Selected Positions in House Member Offices, 2009-2013
R. Eric Petersen Specialist in American National Government
Lara E. Chausow Research Assistant
Amber Hope Wilhelm Visual Information Specialist
November 3, 2014
Congressional Research Service
7-5700 www.crs.gov
R43775

Staff Pay Levels for Selected Positions in House Member Offices, 2009-2013
Congressional Research Service
Summary This report provides pay data for 13 staff position titles that are typically deployed in the offices of Members of the House. The positions include the following: Caseworker; Chief of Staff; Counsel; District Director; Executive Assistant; Field Representative; Legislative Assistant; Legislative Correspondent; Legislative Director; Office Manager; Press Secretary; Scheduler; and Staff Assistant. House Member staff pay data for the years 2009-2013 were developed based on a random sampling of staff for each position in each year.
Data tables provide tabular pay data for each staff position. A graphic for each position is also included. The graphics display representations of pay from three perspectives:
• change in pay, 2009-2013, in nominal (current) and constant, 2014 dollars;
• a comparison of the cumulative percentage change for that position to changes in pay, in constant dollars, for Members of Congress and federal civilian workers paid under the General Schedule in Washington, DC, and surrounding areas in northern Virginia, Maryland, West Virginia and Pennsylvania (DC), and Rest of the U.S. (RUS) from 2009-2013; and
• distributions of 2013 pay in 2014 dollars, in $10,000 increments.
Between 2009 and 2013, the median change in pay, in constant, 2014 dollars, for House Member office staff ranged from 3.25% for caseworkers, to -20.51% for counsels. The pay for staff in the 12 positions other than caseworkers declined over the five-year period. This may be compared to changes over the same period to pay for Members of Congress, -7.91%; General Schedule, DC, -5.67%; and General Schedule, RUS, -6.28%.
Pay data for staff working in Senator’s offices are available in CRS Report R43774, Staff Pay Levels for Selected Positions in Senators’ Offices, FY2009-FY2013, by R. Eric Petersen, Lara E. Chausow, and Amber Hope Wilhelm.

Staff Pay Levels for Selected Positions in House Member Offices, 2009-2013
Congressional Research Service
Contents Introduction ...................................................................................................................................... 1 Data Concerns .................................................................................................................................. 3 Data Tables and Visualizations ........................................................................................................ 3
Tables Table 1. Caseworker ........................................................................................................................ 5 Table 2. Chief of Staff ...................................................................................................................... 6 Table 3. Counsel .............................................................................................................................. 7 Table 4. District Director ................................................................................................................. 8 Table 5. Executive Assistant ............................................................................................................ 9 Table 6. Field Representative ......................................................................................................... 10 Table 7. Legislative Assistant ........................................................................................................ 11 Table 8. Legislative Correspondent ............................................................................................... 12 Table 9. Legislative Director ......................................................................................................... 13 Table 10. Office Manager .............................................................................................................. 14 Table 11. Press Secretary ............................................................................................................... 15 Table 12. Scheduler ........................................................................................................................ 16 Table 13. Staff Assistant ................................................................................................................ 17
Contacts Author Contact Information........................................................................................................... 18 Acknowledgments ......................................................................................................................... 18

Staff Pay Levels for Selected Positions in House Member Offices, 2009-2013
Congressional Research Service 1
Introduction Levels of pay for congressional staff are a source of recurring questions among Members of Congress, congressional staff, and the public. Members of the House of Representatives typically set the terms and conditions of employment for staff in their offices. This includes job titles, duties, and rates of pay, subject to a maximum level,1 and resources available to them to carry out their official duties.2 There may be interest in congressional pay data from multiple perspectives, including assessment of the costs of congressional operations; guidance in setting pay levels for staff in Member offices; or comparison of congressional staff pay levels with those of other federal government pay systems.
Publicly available resources do not provide aggregated congressional staff pay data in a readily retrievable form. The most recent staff compensation report was issued in 2010,3 which, like previous compensation reports, relied on anonymous, self-reported survey data. Pay4 information in this report is based on the House Statement of Disbursements (SOD), published quarterly by the Chief Administrative Officer,5 as collated by LegiStorm, a private entity that provides some congressional data by subscription.6 Data in this report are based on official House reports, which afford the opportunity to use consistently collected data. Additionally, this report provides annual data, which allows for observations about the nature of House Member staff compensation over time.
This report provides pay data for 13 staff position titles that are typically used in House Members’ offices.7 The positions include the following:
• Caseworker8
• Chief of Staff
• Counsel9
• District Director
• Executive Assistant
1 Since 2009, the maximum annual pay for staff in House Member offices has been $168,411. See Order of the Speaker of the House of Representatives, January 9, 2009, set out as a note following 2 U.S.C. 4532. 2 For discussion of resources available to Members to carry out their official duties, see CRS Report RL30064, Congressional Salaries and Allowances, by Ida A. Brudnick. 3 ICF International, 2010 House Compensation Study: Guide for the 112th Congress, prepared for the Chief Administrative Officer, House of Representatives (Washington: 2010). 4 In this report, pay refers to monies paid by the House to staff, and excludes other components of total compensation, which might include paid leave or employer contributions to various insurance and retirement benefits. 5 Volumes of the Statement of Disbursements since July 2009 are available at http://disbursements.house.gov/. 6 http://www.legistorm.com/. 7 For a discussion of staff roles in Members’ offices, see CRS Report RL34545, Congressional Staff: Duties and Functions of Selected Positions, by R. Eric Petersen. 8 Other job titles which may indicate similar duties, and for which pay data were collected, include Constituent Services Representative and Federal Caseworker. 9 Another job title which may indicate similar duties, and for which pay data were collected, was Legislative Counsel.

Staff Pay Levels for Selected Positions in House Member Offices, 2009-2013
Congressional Research Service 2
• Field Representative
• Legislative Assistant
• Legislative Correspondent
• Legislative Director
• Office Manager
• Press Secretary10
• Scheduler
• Staff Assistant
House Member staff pay data for the years 2009-2013 were developed based on a random sampling of staff for each position in each year. In order to be included, House staff had to hold a position with the same job title in the Member’s office for the entire calendar year. For each year, the SOD reports pay data for five time periods: January 1 and 2;11 January 3-March 31; April 1-June 30; July 1-September 30; and October 1-Dember 31. The aggregate pay of those five periods equals the annual pay of a congressional staff member.
For each year, 2009-2013, a random sample12 of 45 staff for each position was taken. Every recorded payment ascribed to those staff for the calendar year is included. Data collected for this report may differ from an employee’s stated annual salary due the inclusion of overtime, bonuses, or other payments13 in addition to base salary paid in the course of a year. For some positions, it was not possible to identify 45 employees who held that title for the entire year. Generally, data provided in this report are based on no more than three observations per Member office per year, and only one per office per position each year.
Pay data for staff working in Senator’s offices are available in CRS Report R43774, Staff Pay Levels for Selected Positions in Senators’ Offices, FY2009-FY2013, by R. Eric Petersen, Lara E. Chausow, and Amber Hope Wilhelm.
10 Another job title which may indicate similar duties, and for which pay data were collected, was Communications Director. 11 The brief reporting period accommodates accounting of the Member Representational Allowance (MRA), which authorizes expenditures from January 3 to January 2 of the following year. For a discussion of MRA usage, see CRS Report R40962, Members’ Representational Allowance: History and Usage, by Ida A. Brudnick. 12 Obtaining the salaries of every congressional staff member listed in the SOD was beyond the capacity of available resources. Each year, a different, random sample of Members’ offices was taken for each position. The large random sample of each position means that a full accounting would be unlikely to yield significantly different results. At the same time, a study that examines pay data based on different job titles, or which combines pay data from positions of similar titles or duties (e.g., legislative assistant and senior legislative assistant, or executive assistants, schedulers and executive assistant/schedulers), could result in findings that are different from those provided here. 13 Other forms of payment do not appear to be recorded in a consistent manner. Sometimes overtime and other pay are listed as separate entries, and in other instances, significant one-time changes in a quarterly total may suggest payments in addition to regular salary.
Staff Pay Levels for Selected Positions in House Member Offices, 2009-2013
Congressional Research Service 3
Data Concerns There may be some advantages to relying on official salary expenditure data instead of survey findings, but data presented here are subject to some challenges that could affect the findings or their interpretation. Some of the concerns include the following:
• A lack of data for first-term Members in the first session of a Congress. Since authority to use the Member Representational Allowance (MRA) for the previous year expires January 2, and new Congresses begin on January 3 or later, this report provides no data for first-term Members of the House in the first session of a Congress.14
• Pay data provide no insight into the experience, tenure, full- or part-time status, demographics, or other potential explanations for levels of compensation.
• Staff could be based in Washington, DC, district offices, or both.
• Member offices that do not utilize any of the 13 job position titles or their variants, or whose pay data were not reported consistently,15 are excluded.
• Potential differences could exist in the job duties of positions with the same title. Aggregation of pay by job title rests on the assumption that staff with the same title carry out the same tasks. Given the wide discretion congressional employing authorities have in setting the terms and conditions of employment, there may be differences in the duties of similarly titled staff that could have effects on their levels of pay.
Data Tables and Visualizations Data tables provide tabular pay data for each staff position. A graphic for each position is also included. The graphics display representations of pay from three perspectives, including the following:
• change in pay, 2009-2013, in nominal (current) and constant, 2014 dollars;
• a comparison of the cumulative percentage change for that position to changes in pay, in constant dollars, for Members of Congress, and federal civilian workers paid under the General Schedule in Washington, DC, and surrounding areas in northern Virginia, Maryland, West Virginia and Pennsylvania (DC),16 and Rest of the U.S. (RUS)17 from 2009-2013; and
14 Staff of all Members who serve an entire calendar year may be included in the data. For information on the number of first-term Members in each Congress, see CRS Report R41283, First-Term Members of the House of Representatives and Senate, 64th - 113th Congresses, by Jennifer E. Manning and R. Eric Petersen. 15 Some offices reported pay data that excluded the January 1 and 2 period, or included those days in reports including the period from October 1 of the previous year. 16 For a complete description of areas covered under the Washington-Baltimore-Northern Virginia, DC-MD-VA-WV-PA locality pay table, see http://www.opm.gov/policy-data-oversight/pay-leave/salaries-wages/2014/locality-pay-area-definitions/#w. 17 The RUS pay table includes those portions of the United States and its territories and possessions (nonforeign areas) not located within another locality pay area. For definitions of 2014 locality pay areas, see Office of Personnel (continued...)
Staff Pay Levels for Selected Positions in House Member Offices, 2009-2013
Congressional Research Service 4
• distributions of FY2013 pay in 2014 dollars, in $10,000 increments.
Between 2009 and 2013, the median change in pay, in constant 2014 dollars, for House Member office staff ranged from 3.25% for caseworkers, to -20.51% for counsels. The pay for staff in the 12 positions other than caseworkers declined over the five-year period. This may be compared to changes over the same period for Members of Congress, -7.91%; General Schedule, DC, -5.67%; and General Schedule, RUS -6.28%.
(...continued) Management, “Pay & Leave, Salaries & Wages,” http://www.opm.gov/policy-data-oversight/pay-leave/salaries-wages/2014/locality-pay-area-definitions. For discussion of how locality pay is calculated, see CRS Report RL34463, Federal White-Collar Pay: FY2009 and FY2010 Salary Adjustments, by Barbara L. Schwemle.

Staff Pay Levels for Selected Positions in House Member Offices, 2009-2013
Congressional Research Service 5
Table 1. Caseworker Duties may include: responding to casework inquiries from constituents; acting as a grassroots representative for the Member within assigned areas of responsibility; and monitoring and updating the Member or relevant official in the office on casework issues.
2009 2010 2011 2012 2013
Nom
inal
$ Minimum $25,000 $28,405 $31,200 $30,135 $24,000
Median $44,598 $44,000 $49,000 $47,492 $50,000
Average $45,984 $47,592 $49,697 $50,182 $49,805
Maximum $86,210 $82,062 $83,155 $72,000 $84,353
Con
stan
t $ Minimum $27,546 $30,793 $32,787 $31,026 $24,353
Median $49,140 $47,698 $51,493 $48,897 $50,736
Average $50,667 $51,592 $52,225 $51,666 $50,538
Maximum $94,989 $88,959 $87,386 $74,129 $85,594
Cha
nge
Median — -2.93% 7.96% -5.04% 3.76%
Average — 1.83% 1.23% -1.07% -2.18%
Annual Average -0.05% Annual Median 0.94% 2009-2013 Average -0.26% 2009-2013 Median 3.25%
Source: Statement of Disbursements of the House, as collated by LegiStorm, various years, and CRS calculations. Visualizations provide information in constant 2014 dollars in thousands, except where indicated. Detailed information about data sources is available above in “Data Tables and Visualizations.”
Notes: Data are based on a sample of 45 observations per year from various Members’ offices. Other job titles for which pay data were collected include Constituent Services Representative and Federal Caseworker. In the Change section of the data table, Annual Average and Annual Median cells provide the average and median change per year, respectively, while the 2009-2013 Average and 2009-2013 Median provide the change over the entire five-year period, respectively. In the 2013 Distribution of Pay visualization, percentages are rounded, and may not equal 100%.
Staff Pay Levels for Selected Positions in House Member Offices, 2009-2013
Congressional Research Service 6
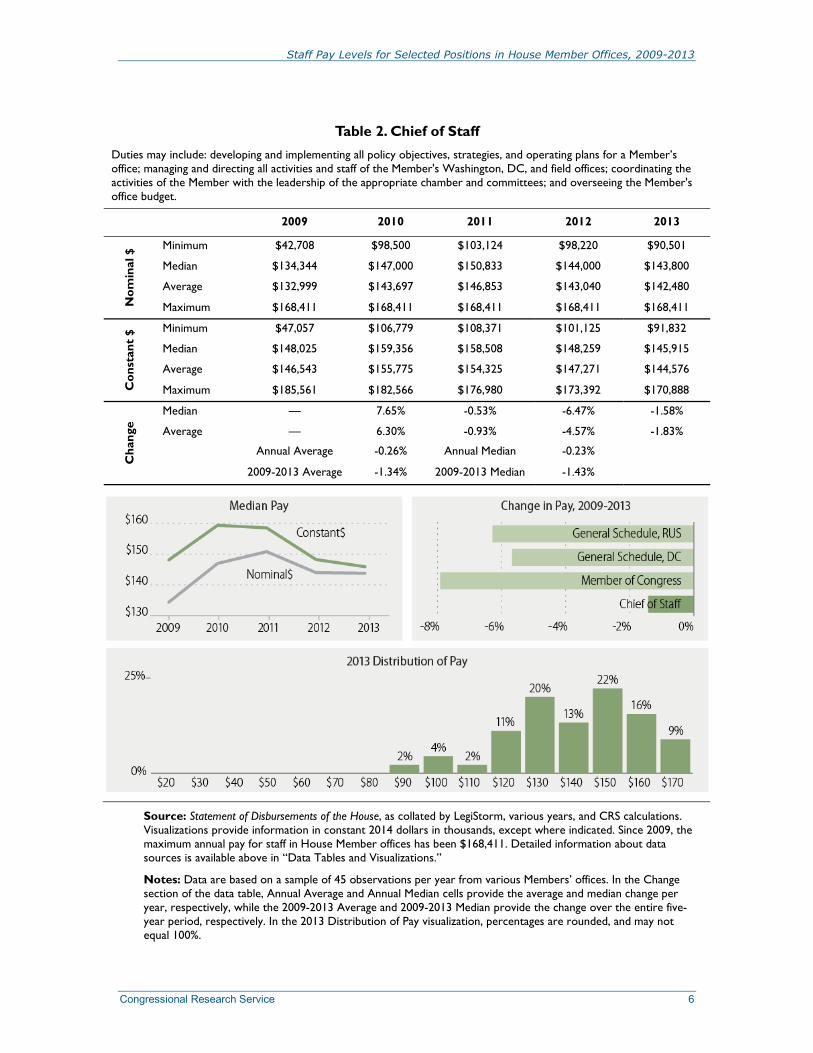
Table 2. Chief of Staff Duties may include: developing and implementing all policy objectives, strategies, and operating plans for a Member’s office; managing and directing all activities and staff of the Member's Washington, DC, and field offices; coordinating the activities of the Member with the leadership of the appropriate chamber and committees; and overseeing the Member's office budget.
2009 2010 2011 2012 2013
Nom
inal
$ Minimum $42,708 $98,500 $103,124 $98,220 $90,501
Median $134,344 $147,000 $150,833 $144,000 $143,800
Average $132,999 $143,697 $146,853 $143,040 $142,480
Maximum $168,411 $168,411 $168,411 $168,411 $168,411
Con
stan
t $ Minimum $47,057 $106,779 $108,371 $101,125 $91,832
Median $148,025 $159,356 $158,508 $148,259 $145,915
Average $146,543 $155,775 $154,325 $147,271 $144,576
Maximum $185,561 $182,566 $176,980 $173,392 $170,888
Cha
nge
Median — 7.65% -0.53% -6.47% -1.58%
Average — 6.30% -0.93% -4.57% -1.83%
Annual Average -0.26% Annual Median -0.23%
2009-2013 Average -1.34% 2009-2013 Median -1.43%
Source: Statement of Disbursements of the House, as collated by LegiStorm, various years, and CRS calculations. Visualizations provide information in constant 2014 dollars in thousands, except where indicated. Since 2009, the maximum annual pay for staff in House Member offices has been $168,411. Detailed information about data sources is available above in “Data Tables and Visualizations.”
Notes: Data are based on a sample of 45 observations per year from various Members’ offices. In the Change section of the data table, Annual Average and Annual Median cells provide the average and median change per year, respectively, while the 2009-2013 Average and 2009-2013 Median provide the change over the entire five-year period, respectively. In the 2013 Distribution of Pay visualization, percentages are rounded, and may not equal 100%.

Staff Pay Levels for Selected Positions in House Member Offices, 2009-2013
Congressional Research Service 7
Table 3. Counsel Duties may include: advising the Member on legal issues; and ensuring compliance with chamber rules, the law, and ethics guidelines.
2009 2010 2011 2012 2013
Nom
inal
$ Minimum $54,891 $45,250 $34,792 $49,236 $41,667
Median $68,000 $87,862 $74,417 $72,167 $58,692
Average $69,417 $98,513 $70,824 $73,390 $63,416
Maximum $84,100 $168,411 $100,375 $130,833 $126,546
Con
stan
t $ Minimum $60,480 $49,053 $36,562 $50,692 $42,280
Median $74,925 $95,247 $78,203 $74,301 $59,555
Average $76,486 $106,794 $74,428 $75,561 $64,348
Maximum $92,664 $182,566 $105,482 $134,702 $128,408
Cha
nge
Median — 27.12% -17.89% -4.99% -19.85%
Average — 39.63% -30.31% 1.52% -14.84%
Annual Average -1.00% Annual Median -3.90% 2009-2013 Average -15.87% 2009-2013 Median -20.51%
Source: Statement of Disbursements of the House, as collated by LegiStorm, various years, and CRS calculations. Visualizations provide information in constant 2014 dollars in thousands, except where indicated. Detailed information about data sources is available above in “Data Tables and Visualizations.”
Notes: Data are based on a sample of 13 observations in 2009, 30 in 2010, 23 in 2011, 20 in 2012, and 19 in 2013, from various Members’ offices. Another job title for which pay data were collected was Legislative Counsel. In the Change section of the data table, Annual Average and Annual Median cells provide the average and median change per year, respectively, while the 2009-2013 Average and 2009-2013 Median provide the change over the entire five-year period, respectively. In the 2013 Distribution of Pay visualization, percentages are rounded, and may not equal 100%.

Staff Pay Levels for Selected Positions in House Member Offices, 2009-2013
Congressional Research Service 8
Table 4. District Director Duties may include: managing the principal district office or other district offices of a Member; and overseeing all district office operations.
2009 2010 2011 2012 2013
Nom
inal
$ Minimum $60,000 $48,100 $68,000 $52,500 $48,333
Median $88,274 $92,545 $93,519 $88,795 $87,247
Average $90,238 $95,323 $99,733 $91,280 $90,637
Maximum $120,450 $136,003 $165,000 $163,564 $162,600
Con
stan
t $ Minimum $66,110 $52,143 $71,460 $54,053 $49,044
Median $97,263 $100,324 $98,278 $91,421 $88,531
Average $99,427 $103,335 $104,807 $93,979 $91,970
Maximum $132,716 $147,434 $173,395 $168,401 $164,992
Cha
nge
Median — 3.15% -2.04% -6.98% -3.16%
Average — 3.93% 1.42% -10.33% -2.14%
Annual Average -1.78% Annual Median -2.26% 2009-2013 Average -7.50% 2009-2013 Median -8.98%
Source: Statement of Disbursements of the House, as collated by LegiStorm, various years, and CRS calculations. Visualizations provide information in constant 2014 dollars in thousands, except where indicated. Detailed information about data sources is available above in “Data Tables and Visualizations.”
Notes: Data are based on a sample of 45 observations per year from various Members’ offices. In the Change section of the data table, Annual Average and Annual Median cells provide the average and median change per year, respectively, while the 2009-2013 Average and 2009-2013 Median provide the change over the entire five-year period, respectively. In the 2013 Distribution of Pay visualization, percentages are rounded, and may not equal 100%.

Staff Pay Levels for Selected Positions in House Member Offices, 2009-2013
Congressional Research Service 9
Table 5. Executive Assistant Duties may include: maintaining the Member’s files, including notes, correspondence, and all information related to travel; logging and monitoring the Member’s incoming telephone calls; taking messages; and ensuring that the Member is provided with briefing materials for various activities in which the Member participates.
2009 2010 2011 2012 2013
Nom
inal
$ Minimum $30,000 $20,500 $27,000 $28,000 $33,750
Median $57,500 $64,500 $69,750 $58,500 $53,500
Average $58,062 $67,102 $67,839 $61,871 $61,167
Maximum $108,047 $134,278 $138,000 $122,609 $121,109
Con
stan
t $ Minimum $33,055 $22,223 $28,374 $28,828 $34,247
Median $63,355 $69,921 $73,299 $60,230 $54,287
Average $63,974 $72,742 $71,291 $63,701 $62,067
Maximum $119,049 $145,564 $145,022 $126,235 $122,891
Cha
nge
Median — 10.36% 4.83% -17.83% -9.87%
Average — 13.71% -2.00% -10.65% -2.56%
Annual Average -0.38% Annual Median -3.13% 2009-2013 Average -2.98% 2009-2013 Median -14.31%
Source: Statement of Disbursements of the House, as collated by LegiStorm, various years, and CRS calculations. Visualizations provide information in constant 2014 dollars in thousands, except where indicated. Detailed information about data sources is available above in “Data Tables and Visualizations.”
Notes: Data are based on a sample of 45 observations per year in 2009 and 2010, 37 in 2011, 39 in 2012, and 21 in 2013, from various Members’ offices. In the Change section of the data table, Annual Average and Annual Median cells provide the average and median change per year, respectively, while the 2009-2013 Average and 2009-2013 Median provide the change over the entire five-year period, respectively. In the 2013 Distribution of Pay visualization, percentages are rounded, and may not equal 100%.

Staff Pay Levels for Selected Positions in House Member Offices, 2009-2013
Congressional Research Service 10
Table 6. Field Representative Duties may include: acting as a liaison with federal, state, and local agencies for the Member and constituents, and assessing casework for matters that might require legislative action.
2009 2010 2011 2012 2013
Nom
inal
$ Minimum $34,033 $28,917 $21,000 $30,167 $32,125
Median $45,000 $48,033 $45,450 $46,920 $48,783
Average $47,299 $48,932 $46,732 $47,153 $47,466
Maximum $81,917 $77,311 $72,992 $79,159 $77,988
Con
stan
t $ Minimum $37,499 $31,347 $22,068 $31,059 $32,598
Median $49,582 $52,071 $47,762 $48,308 $49,500
Average $52,116 $53,044 $49,110 $48,548 $48,165
Maximum $90,259 $83,809 $76,705 $81,500 $79,135
Cha
nge
Median — 5.02% -8.27% 1.14% 2.47%
Average — 1.78% -7.42% -1.15% -0.79%
Annual Average -1.89% Annual Median 0.09% 2009-2013 Average -7.58% 2009-2013 Median -0.17%
Source: Statement of Disbursements of the House, as collated by LegiStorm, various years, and CRS calculations. Visualizations provide information in constant 2014 dollars in thousands, except where indicated. Detailed information about data sources is available above in “Data Tables and Visualizations.”
Notes: Data are based on a sample of 45 observations per year from various Members’ offices. In the Change section of the data table, Annual Average and Annual Median cells provide the average and median change per year, respectively, while the 2009-2013 Average and 2009-2013 Median provide the change over the entire five-year period, respectively. In the 2013 Distribution of Pay visualization, percentages are rounded, and may not equal 100%.

Staff Pay Levels for Selected Positions in House Member Offices, 2009-2013
Congressional Research Service 11
Table 7. Legislative Assistant Duties may include: developing legislative initiatives; advising the Member on legislative issues; and monitoring legislative and policy developments within assigned substantive areas.
2009 2010 2011 2012 2013
Nom
inal
$ Minimum $34,000 $37,637 $32,500 $29,000 $29,500
Median $50,500 $51,427 $48,863 $49,250 $47,917
Average $49,982 $54,346 $50,506 $49,916 $48,395
Maximum $63,500 $114,814 $96,400 $78,833 $72,802
Con
stan
t $ Minimum $37,462 $40,800 $34,154 $29,858 $29,934
Median $55,643 $55,749 $51,349 $50,707 $48,622
Average $55,071 $58,913 $53,076 $51,393 $49,107
Maximum $69,966 $124,465 $101,305 $81,165 $73,873
Cha
nge
Median — 0.19% -7.89% -1.25% -4.11%
Average — 6.98% -9.91% -3.17% -4.45%
Annual Average -2.64% Annual Median -3.27% 2009-2013 Average -10.83% 2009-2013 Median -12.62%
Source: Statement of Disbursements of the House, as collated by LegiStorm, various years, and CRS calculations. Visualizations provide information in constant 2014 dollars in thousands, except where indicated. Detailed information about data sources is available above in “Data Tables and Visualizations.”
Notes: Data are based on a sample of 45 observations per year from various Members’ offices. In the Change section of the data table, Annual Average and Annual Median cells provide the average and median change per year, respectively, while the 2009-2013 Average and 2009-2013 Median provide the change over the entire five-year period, respectively. In the 2013 Distribution of Pay visualization, percentages are rounded, and may not equal 100%.

Staff Pay Levels for Selected Positions in House Member Offices, 2009-2013
Congressional Research Service 12
Table 8. Legislative Correspondent Duties may include: providing research for response to constituents' correspondence; drafting, proofreading, and transmitting letters; and providing administrative support to legislative staff as needed.
2009 2010 2011 2012 2013
Nom
inal
$ Minimum $29,085 $28,000 $28,833 $26,000 $28,900
Median $38,875 $38,542 $39,600 $39,000 $37,500
Average $41,173 $40,366 $42,489 $39,351 $38,589
Maximum $75,917 $75,833 $86,250 $65,000 $65,000
Con
stan
t $ Minimum $32,047 $30,353 $30,300 $26,769 $29,325
Median $42,834 $41,781 $41,615 $40,153 $38,052
Average $45,366 $43,759 $44,651 $40,515 $39,156
Maximum $83,648 $82,207 $90,638 $66,922 $65,956
Cha
nge
Median — -2.46% -0.40% -3.51% -5.23%
Average — -3.54% 2.04% -9.26% -3.35%
Annual Average -3.53% Annual Median -2.90% 2009-2013 Average -13.69% 2009-2013 Median -11.16%
Source: Statement of Disbursements of the House, as collated by LegiStorm, various years, and CRS calculations. Visualizations provide information in constant 2014 dollars in thousands, except where indicated. Detailed information about data sources is available above in “Data Tables and Visualizations.”
Notes: Data are based on a sample of 45 observations per year from various Members’ offices. In the Change section of the data table, Annual Average and Annual Median cells provide the average and median change per year, respectively, while the 2009-2013 Average and 2009-2013 Median provide the change over the entire five-year period, respectively. In the 2013 Distribution of Pay visualization, percentages are rounded, and may not equal 100%.
Staff Pay Levels for Selected Positions in House Member Offices, 2009-2013
Congressional Research Service 13
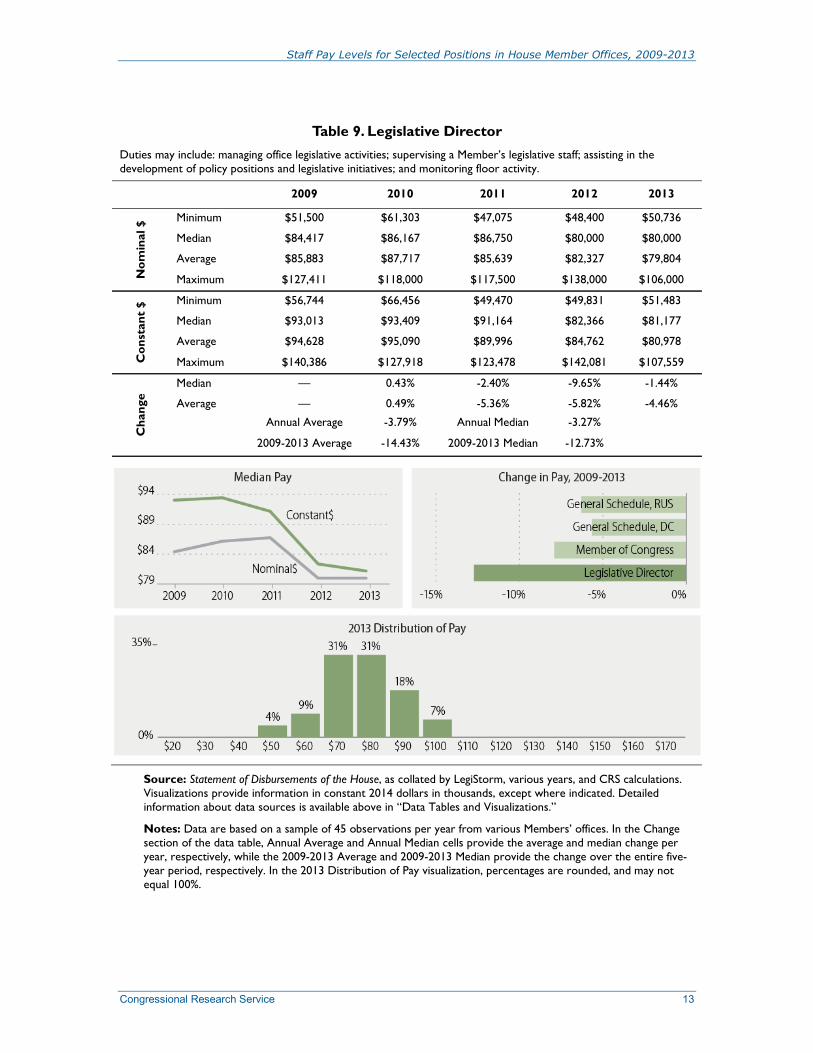
Table 9. Legislative Director Duties may include: managing office legislative activities; supervising a Member’s legislative staff; assisting in the development of policy positions and legislative initiatives; and monitoring floor activity.
2009 2010 2011 2012 2013
Nom
inal
$ Minimum $51,500 $61,303 $47,075 $48,400 $50,736
Median $84,417 $86,167 $86,750 $80,000 $80,000
Average $85,883 $87,717 $85,639 $82,327 $79,804
Maximum $127,411 $118,000 $117,500 $138,000 $106,000
Con
stan
t $ Minimum $56,744 $66,456 $49,470 $49,831 $51,483
Median $93,013 $93,409 $91,164 $82,366 $81,177
Average $94,628 $95,090 $89,996 $84,762 $80,978
Maximum $140,386 $127,918 $123,478 $142,081 $107,559
Cha
nge
Median — 0.43% -2.40% -9.65% -1.44%
Average — 0.49% -5.36% -5.82% -4.46%
Annual Average -3.79% Annual Median -3.27%
2009-2013 Average -14.43% 2009-2013 Median -12.73%
Source: Statement of Disbursements of the House, as collated by LegiStorm, various years, and CRS calculations. Visualizations provide information in constant 2014 dollars in thousands, except where indicated. Detailed information about data sources is available above in “Data Tables and Visualizations.”
Notes: Data are based on a sample of 45 observations per year from various Members’ offices. In the Change section of the data table, Annual Average and Annual Median cells provide the average and median change per year, respectively, while the 2009-2013 Average and 2009-2013 Median provide the change over the entire five-year period, respectively. In the 2013 Distribution of Pay visualization, percentages are rounded, and may not equal 100%.
Staff Pay Levels for Selected Positions in House Member Offices, 2009-2013
Congressional Research Service 14
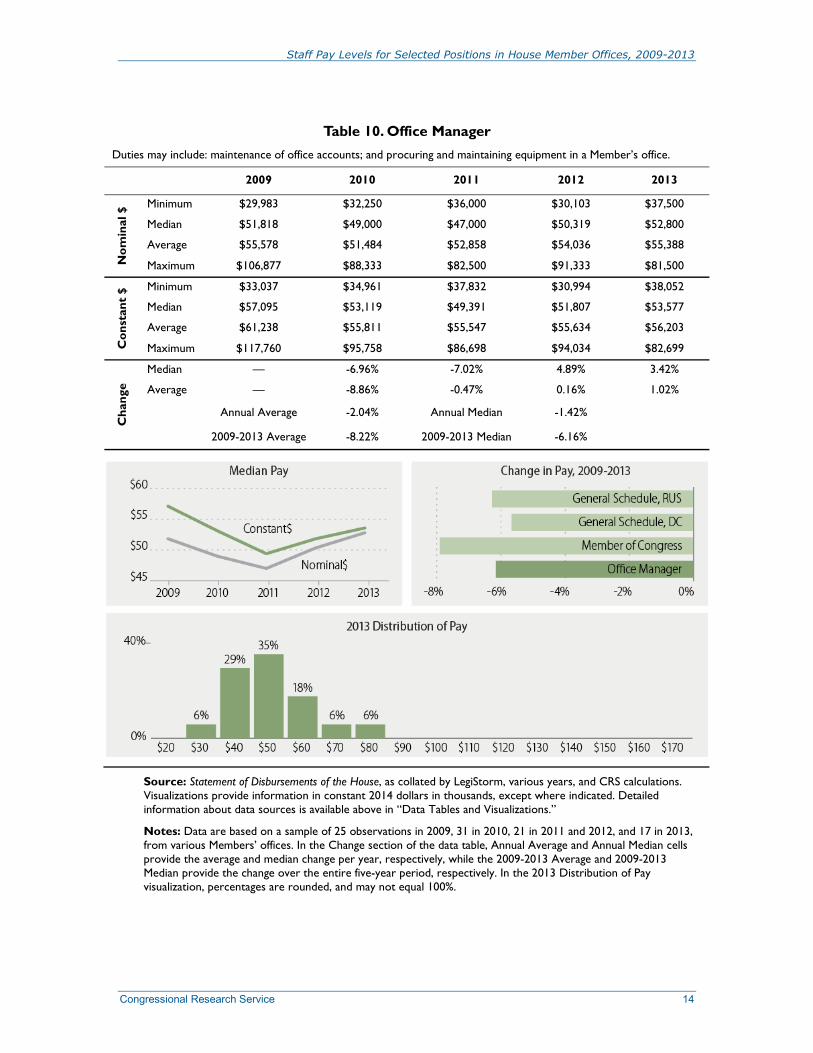
Table 10. Office Manager Duties may include: maintenance of office accounts; and procuring and maintaining equipment in a Member’s office.
2009 2010 2011 2012 2013
Nom
inal
$ Minimum $29,983 $32,250 $36,000 $30,103 $37,500
Median $51,818 $49,000 $47,000 $50,319 $52,800
Average $55,578 $51,484 $52,858 $54,036 $55,388
Maximum $106,877 $88,333 $82,500 $91,333 $81,500
Con
stan
t $ Minimum $33,037 $34,961 $37,832 $30,994 $38,052
Median $57,095 $53,119 $49,391 $51,807 $53,577
Average $61,238 $55,811 $55,547 $55,634 $56,203
Maximum $117,760 $95,758 $86,698 $94,034 $82,699
Cha
nge
Median — -6.96% -7.02% 4.89% 3.42%
Average — -8.86% -0.47% 0.16% 1.02%
Annual Average -2.04% Annual Median -1.42% 2009-2013 Average -8.22% 2009-2013 Median -6.16%
Source: Statement of Disbursements of the House, as collated by LegiStorm, various years, and CRS calculations. Visualizations provide information in constant 2014 dollars in thousands, except where indicated. Detailed information about data sources is available above in “Data Tables and Visualizations.”
Notes: Data are based on a sample of 25 observations in 2009, 31 in 2010, 21 in 2011 and 2012, and 17 in 2013, from various Members’ offices. In the Change section of the data table, Annual Average and Annual Median cells provide the average and median change per year, respectively, while the 2009-2013 Average and 2009-2013 Median provide the change over the entire five-year period, respectively. In the 2013 Distribution of Pay visualization, percentages are rounded, and may not equal 100%.

Staff Pay Levels for Selected Positions in House Member Offices, 2009-2013
Congressional Research Service 15
Table 11. Press Secretary Duties may include: developing and implementing media and communications strategies for the Member; acting as the formal spokesperson and media liaison for the Member; and writing speeches for the Member.
2009 2010 2011 2012 2013
Nom
inal
$ Minimum $40,400 $46,000 $48,000 $29,959 $36,439
Median $69,174 $67,250 $76,000 $73,167 $65,000
Average $72,711 $72,512 $76,528 $74,514 $70,351
Maximum $128,992 $132,596 $120,000 $121,805 $124,861
Con
stan
t $ Minimum $44,514 $49,866 $50,442 $30,845 $36,975
Median $76,218 $72,903 $79,867 $75,330 $65,956
Average $80,115 $78,606 $80,422 $76,718 $71,386
Maximum $142,127 $143,741 $126,106 $125,408 $126,698
Cha
nge
Median — -4.35% 9.55% -5.68% -12.44%
Average — -1.88% 2.31% -4.61% -6.95%
Annual Average -2.78% Annual Median -3.23%
2009-2013 Average -10.90% 2009-2013 Median -13.46%
Source: Statement of Disbursements of the House, as collated by LegiStorm, various years, and CRS calculations. Visualizations provide information in constant 2014 dollars in thousands, except where indicated. Detailed information about data sources is available above in “Data Tables and Visualizations.”
Notes: Data are based on a sample of 45 observations per year from various Members’ offices. Another job title for which pay data were collected was Communications Director. In the Change section of the data table, Annual Average and Annual Median cells provide the average and median change per year, respectively, while the 2009-2013 Average and 2009-2013 Median provide the change over the entire five-year period, respectively. In the 2013 Distribution of Pay visualization, percentages are rounded, and may not equal 100%.

Staff Pay Levels for Selected Positions in House Member Offices, 2009-2013
Congressional Research Service 16
Table 12. Scheduler Duties may include: briefing the Member on all scheduling activities; making recommendations on proposed meetings; scheduling staff meetings; and coordinating the scheduling of the Member’s press and media interactions with the press secretary or communications director.
2009 2010 2011 2012 2013
Nom
inal
$ Minimum $32,000 $31,547 $35,000 $34,533 $31,883
Median $52,450 $47,000 $49,309 $46,333 $47,500
Average $52,879 $51,968 $53,293 $49,421 $51,910
Maximum $93,000 $110,750 $90,942 $80,500 $85,833
Con
stan
t $ Minimum $35,259 $34,198 $36,781 $35,555 $32,352
Median $57,791 $50,950 $51,818 $47,704 $48,199
Average $58,264 $56,336 $56,005 $50,883 $52,674
Maximum $102,471 $120,059 $95,569 $82,881 $87,096
Cha
nge
Median — -11.84% 1.70% -7.94% 1.04%
Average — -3.31% -0.59% -9.15% 3.52%
Annual Average -2.38% Annual Median -4.26%
2009-2013 Average -9.59% 2009-2013 Median -16.60%
Source: Statement of Disbursements of the House, as collated by LegiStorm, various years, and CRS calculations. Visualizations provide information in constant 2014 dollars in thousands, except where indicated. Detailed information about data sources is available above in “Data Tables and Visualizations.”
Notes: Data are based on a sample of 41 observations in 2009 and 2010, 26 in 2011 and 2013, and 36 in 2012, from various Members’ offices. In the Change section of the data table, Annual Average and Annual Median cells provide the average and median change per year, respectively, while the 2009-2013 Average and 2009-2013 Median provide the change over the entire five-year period, respectively. In the 2013 Distribution of Pay visualization, percentages are rounded, and may not equal 100%.

Staff Pay Levels for Selected Positions in House Member Offices, 2009-2013
Congressional Research Service 17
Table 13. Staff Assistant Duties may include: answering telephones and providing support services; greeting visitors; assisting with scheduling; responding to constituent requests for general information, tours, and other non-legislative matters; and monitoring delivery and pickup of materials.
2009 2010 2011 2012 2013
Nom
inal
$ Minimum $20,175 $25,000 $26,250 $22,000 $21,095
Median $37,504 $39,750 $34,833 $35,767 $34,986
Average $37,829 $42,084 $38,681 $41,076 $37,726
Maximum $67,333 $93,750 $87,500 $167,411 $67,167
Con
stan
t $ Minimum $22,229 $27,101 $27,586 $22,651 $21,405
Median $41,323 $43,091 $36,606 $36,824 $35,501
Average $41,682 $45,621 $40,649 $42,291 $38,281
Maximum $74,190 $101,630 $91,952 $172,362 $68,155
Cha
nge
Median — 4.28% -15.05% 0.60% -3.59%
Average — 9.45% -10.90% 4.04% -9.48%
Annual Average -1.72% Annual Median -3.44%
2009-2013 Average -8.16% 2009-2013 Median -14.09%
Source: Statement of Disbursements of the House, as collated by LegiStorm, various years, and CRS calculations. Visualizations provide information in constant 2014 dollars in thousands, except where indicated. Detailed information about data sources is available above in “Data Tables and Visualizations.”
Notes: Data are based on a sample of 45 observations per year from various Members’ offices. In the Change section of the data table, Annual Average and Annual Median cells provide the average and median change per year, respectively, while the 2009-2013 Average and 2009-2013 Median provide the change over the entire five-year period, respectively. In the 2013 Distribution of Pay visualization, percentages are rounded, and may not equal 100%.

Staff Pay Levels for Selected Positions in House Member Offices, 2009-2013
Congressional Research Service 18
Author Contact Information R. Eric Petersen Specialist in American National Government [email protected], 7-0643
Amber Hope Wilhelm Visual Information Specialist [email protected], 7-2392
Lara E. Chausow Research Assistant [email protected], 7-2384
Acknowledgments Jose Wisniewski and Claire Laurence, former CRS interns, collected data for this report.