staff management in emergency evacuation preparedness and
TRANSCRIPT

University of Massachusetts Boston
From the SelectedWorks of Davood Golmohammadi
2008
Staff Management in Emergency EvacuationPreparedness and ResponseDavood Golmohammadi, PhD, University of Massachusetts Boston
Available at: https://works.bepress.com/davood_golmohammadi/8/

Journal of Homeland Security andEmergency Management
Volume 5, Issue 1 2008 Article 46
Staff Management in Emergency EvacuationPreparedness and Response
Mohsen A. Jafari∗ Davood Golmohammadi†
Kian Seyed‡
∗Rutgers, The State University of New Jersey, [email protected]†University of Massachusetts Boston, [email protected]‡Rutgers, The State University of New Jersey, kian [email protected]
Copyright c©2008 The Berkeley Electronic Press. All rights reserved.

Staff Management in Emergency EvacuationPreparedness and Response
Mohsen A. Jafari, Davood Golmohammadi, and Kian Seyed
Abstract
In this paper, the crucial role of resource management during an emergency situation in ahospital environment is addressed and analyzed. We propose a methodology to help the incidentmanagers allocate their available medical and non-medical staff members to the areas of the hos-pital undergoing emergency evacuation. We first show that the assumptions of unlimited resourcecapacity and lack of interaction between these resources may lead to invalid results and plans. Wethen present an analytical approach to model the dispatching of these limited human resourcesto the impacted floors. We also formulate a procedure to estimate the evacuation time. Withina reasonable degree of accuracy this estimation methodology can be used instead of a complexsimulation model which often takes time to develop and test. The basis for this study is a recentproject on simulation and modeling of emergency evacuation in a local hospital.
KEYWORDS: simulation modeling, resource allocation, resource management, evacuation mod-eling, emergency event

1. Introduction Hospitals and healthcare facilities always support the first emergency responders - fire departments and emergency medical services - by providing medical and clinical care to the victims and casualties of emergency events caused by natural disasters, fire and accidents. On the other hand, events like hurricane Katrina proved that hospitals themselves could also be affected and endangered during the course of these emergencies. Events like fire and chemical spills could also happen and endanger the life of patients and their family members. Therefore, at some point the hospital managers and authorities must deal with such difficult and complex tasks as evacuating and transferring patients of the affected areas to a safer location. This safe area could either be inside or outside of the facility depending on the nature, source and degree of acuity of the causal event. Timeliness, efficiency and safe movement of patients add even more complexity to the problem at hand.
In accordance with FEMA and JCAHO1 rules and regulations, all hospitals and healthcare facilities need to have a plan in place to be able to respond to internal and external emergencies. This plan is usually activated and supervised by a designated Incident Manager. An important task before an incident manager is the allocation and assignment of available fixed and dynamic resources (such as medical and non-medical staff, elevators, egress routes and so forth) to the floors and units in need of extra help during the course of evacuation. This decision making is crucial when multiple floors are in danger and all their patients together with their family members, medical records and necessary medications need to be vacated to some safe location. Some of these floors may have patients with more critical conditions and therefore the incident manager may need to assign more resources to those floors to make the evacuation process faster, safer and more efficient.
In this paper, the crucial role of resource management in an emergency situation is addressed and analyzed. More specifically, we propose a methodology to allocate hospital’s limited human resources to the sections of the facility that need to be evacuated. The objective of evacuation planning is to minimize the evacuation time and to maximize number of evacuees. To that end, we first show that the assumptions of unlimited resource capacity and lack of interaction between these resources may lead to invalid results and plans. We then present an analytical methodology to model the dispatching of the limited human resources to aid patients to transfer to a safe location. We also formulate a procedure to estimate the evacuation time. Within a reasonable degree of accuracy this
1 FEMA: Federal Emergency Management Agency JCAHO: Joint Commission on Accreditation of Healthcare Organizations
1Jafari et al.: Staff Management in Emergency Evacuation Preparedness
Published by The Berkeley Electronic Press, 2008

estimation methodology can be used instead of a full blown simulation which often takes time to develop and test. The rationale for this research is our recent experience with a local hospital. During that project which was funded by New Jersey Department of Health, we studied emergency management processes including both patient evacuation and surge capacity operations. While this work specifically focuses on evacuation, the methodology can also be extended for surge capacity analysis. In the remainder of this article, we will first present a brief overview of existing literature on hospital evacuation. We will then describe our models and findings. Whenever necessary we will use simulations to validate our results. 2. Literature and Technology Survey A vast majority of emergency response plans focuses on a host hospital being able to accommodate the influx of patients resulting from the disaster. However, few formal studies have specifically addressed the issues that an actual hospital faces when their occupants must vacate (see Bakuli, 1996, Taaffe et al. 2005). In the context of emergency planning, researchers have focused on general population evacuations, as it pertains to the use of roadway infrastructure to move people away from the hazard (see Sheffi et al. 1982, Hobeika and Jamei, 1985, Pidd et al. 1996, Hobeika and Kim, 1998, Wolshon, 2001, Franzese and Joshi, 2002, Chang, 2003, Cova and Johnson, 2003, Radwan et al. 2005).
The problem of hospital evacuation is in essence a queuing network problem, where a queue defines a group of patients at some section of the hospital, with an attempt to move to a safe location (another node in the queuing network) using the hospital resources. Therefore, the general problem of evacuation has been studied extensively within the queuing network community. Because of the transient nature of these networks and also complexity of interaction between different queues and resources, traditional queuing network models have come short of presenting useful results for practical scenarios. Moreover, the arrangement for an evacuation exercise in a large building is difficult. Numerical simulation can therefore become an alternative approach for studying the evacuation in high-rise buildings (Lo et al. 2001). The problem with these works is that results are specific to a hospital with a fixed layout, and any major changes in the hospital operation or layout require extensive changes in the simulation models. Nevertheless, simulation has been quite popular for addressing real life situations. Generally speaking, simulation helps make an as is model of the process using the existing plans and after running that model with collected input data and finding the problems and bottlenecks of the system, an improved model could be built based on suggestions and recommendations to come up with a final revised plan that is more efficient.
2 JHSEM: Vol. 5 [2008], No. 1, Article 46
http://www.bepress.com/jhsem/vol5/iss1/46

Simulation in a broader application has been used to model emergency egress from public buildings. In their recent work, Santos and Aguirre (2004) have reviewed available emergency evacuation simulation models that are mainly used to simulate crowd egress from buildings and other similar large areas and facilities (not specifically hospitals). They have selected simulation models in four categories: flow based cellular automata, agent-based and activity-based models as well as three simulation models that incorporate social scientific processes i.e. FIRESCAP, EXODUS and Multi-Agent Simulation of Crisis Management. EXODUS (http://fseg.gre.ac.uk/exodus/) developed by Fire Safety Engineering Group (FSEG) of the University of Greenwich, Greenwich, UK, can be considered as the best fire evacuation simulation tool currently available in the market, featuring very sophisticated fire and smoke propagation models, as well as complex human behavior, (Santos and Aguirre, 2004). EXODUS is used for simulation of emergency evacuation from buildings, air crafts and large ships.
OREMS is another well-known crowd traffic simulation software developed by Oak Ridge National Labs. It is developed to help first responders develop plans for moving people quickly and safely away from the site of most disastrous events. OREMS is based on actual data from experiences and disasters and could be used to estimate clearance times for evacuation of a large area, predict traffic bottlenecks, and evaluate traffic control strategies. Again, the emphasis is on large areas and traffic control. Among other available software tools, PedGo (used to simulate evacuation of pedestrians) developed by TraffGo in Germany, and Assisted Evacuation Simulation System developed by Takenada Co. in Japan could be mentioned. The latter is designed to simulate evacuation of patients and personnel in environments where some people are not capable of moving out by themselves, such as hospitals, nursing homes or assisted living facilities, (Santos and Aguirre, 2004, Bakhadyrov et al. 2003). This may be the closest to our work in terms of dealing with patients and hospitals. This tool is used in Japan and is based on experiences gained from severe natural disasters like earthquakes and typhoons that occur more frequently in that part of the world. Crowd Dynamics Co. (http://www.crowddynamics.com/) based in UK has developed a tool that could simulate the dynamic behavior of individuals in crowd related incidents and disasters. The model treats every entity as an individual and it can simulate how people react to their environment in a variety of conditions, which allows the user to study a wide range of crowd dynamics in different geometries and highlights the interactions of the crowd with its surroundings.
In principle, computer simulations can be used to compute resource management strategies through enumeration of many possible scenarios. But clearly, this is not a computationally efficient solution. More importantly, not every hospital has access to simulation platforms or has resources to build computer simulations. What we are presenting here does not necessarily have the
3Jafari et al.: Staff Management in Emergency Evacuation Preparedness
Published by The Berkeley Electronic Press, 2008

accuracy that one may achieve by using simulation. Nevertheless, it is a practical approach that can be used by hospitals with minimum investment in staffing, software technology or other requirements.
3. Resource Management The problem of evacuation planning and management is certainly a very complex problem where risks are too high and interactions are too many to be fully considered. In such scenarios, it is often the case that planners tend to make simplifying assumptions in terms of resource availability and complexity of interactions in the system. In this section, we first study the effect of such assumptions on the efficiency of evacuation plans. We show that the evacuation time estimation could be severely affected by such invalid assumptions. We then continue our presentation with the formulation of resource (medical and non-medical staff) management problem in a typical hospital. These results are analytical and do not require simulation. We, however, use simulation to validate our results and findings. 3.1 Resource Capacity
For this analysis, we used Arena simulation software version 9 to build a simulation model for an urban hospital in New Jersey. The model is capable of simulating the evacuation of up to eight floors of one of the hospital buildings. Any combination of candidate floors could be used to simulate an emergency evacuation. The simulation allows for the user to disable the interaction between various floors or enable it for various combinations of the floors. One such interaction could happen when the same hallway is used by ambulatory patients from different floors or units. Also sharing of elevators to move critical patients by bed is another source of complex interaction between units of floors at a hospital. The model specifically takes into account floor layouts, safe location layout, and many other details relevant to physical layout of the hospital. For our analysis here we will assume fictitious floors arrangement as shown in Table 1. We note that floors 5, 6, 7 and 8 contain the most critically conditioned patients who will need special care during the course of an emergency evacuation. The other floors contain mostly ambulatory patients/people that could walk or run on their own without much clinical help. Two types of resources are defined: fixed and dynamic. Fixed resources are dependent on the physical layout, e.g., hallways and stairways. We assume that the capacity and status of these resources do not change and they remain intact during the course of an emergency evacuation. This may not always be the case and depends on the structural design of the hospital building.
4 JHSEM: Vol. 5 [2008], No. 1, Article 46
http://www.bepress.com/jhsem/vol5/iss1/46

Table 1. Floor Arrangement in Our Imaginary Hospital Floor 1 Radiation Oncology Floor 2a Emergency Dept. Floor 2b Ultrasound Dept. Floor 3 Main Lobby, Admission/Registration Floor 4 Restaurant Floor 5 CCU/ICU – Critical Care Units Floor 6 Bone Marrow Transplant Floor 7 Medical Oncology Floor 8 Surgical Oncology
Dynamic resources are staff members (e.g., nurses, doctors, residents, technicians) and the necessary equipment (elevators, beds, oxygen tanks, etc.). We consider the following capacity levels for our resources. Level 1 - Unlimited Resources Here it is assumed that there is no limitation on resources (fixed or dynamic) for the purpose of evacuation planning. Table 2 illustrates the evacuation time estimates for the eight floors of the hospital obtained from simulation model run with the assumption of unlimited resources and no interactions.
Table 2. Evacuation Times – Unlimited Resources Floor Estimated Evacuation
Time (Min) 1 7.2
2a 3.1 2b 9 3 1.4 4 2 5 19 6 13 7 13.9 8 14.8
Level 2 - Unlimited Fixed Resources and Limited Dynamic Resources In this case fixed resources are assumed to have unlimited capacity, while the dynamic resources have limited capacity. For example a clinical unit may have 10 medical staff members, 15 non-medical staff members, and 30 patients at the time of the incident. It should be noted that these parameters are input variables and could be changed to run and examine various scenarios. These resources are assigned to the patients one by one until no more resources are available.
5Jafari et al.: Staff Management in Emergency Evacuation Preparedness
Published by The Berkeley Electronic Press, 2008

Those patients not receiving service in the first round must wait until these resources become available again (e.g., staff that return to the floor from the safe location). This repeats until all the patients are removed from the floor. Here, we assume that resources from one floor are not shared by the other floors. Therefore, no interaction exists between units. Table 3 shows the estimated evacuation times from simulations.
Table 3. Evacuation times – Unlimited Fixed Resources, Limited Dynamic Resources
Floor Number of Staff
Number of Patients (Ambulatory)
Number of Patients (Nonambulatory)
Evacuation Time ( Min)
1 25 21 6 8.2 2a 28 19 10 3.5 2b 20 15 24 14 3 30 39 - 1.85 4 - 300 - 2 5 40 - 30 40.1 6 24 7 23 31.2 7 28 17 30 29.7 8 22 5 25 28.5
Level 3 - Limited Fixed and Dynamic Resources In this level, both fixed and dynamic resources are assumed to have limited capacity. No interaction between floors is assumed. The corresponding evacuation times at this level of approximation are shown in Table 4. Level 4 - Limited Fixed and Dynamic Resources with Interaction between floors In this level, all resources have limited capacities, all floors are being evacuated simultaneously, and floors are sharing and competing for resources. In this case, congestion and waiting in long queues could happen in hallways, elevators, stairways, and so on. Table 5 shows the estimated evacuation times obtained from simulations.
6 JHSEM: Vol. 5 [2008], No. 1, Article 46
http://www.bepress.com/jhsem/vol5/iss1/46

Table 4. Evacuation Times – Limited Resources, No Interaction between Floors
Floor Number of Staff
Number of Patients (Ambulatory)
Number of Patients (Nonambulatory)
Evacuation Time ( Min)
1 25 21 6 9.1 2a 28 19 10 4 2b 20 15 24 16.2 3 30 39 - 2.1 4 - 300 - 18.2 5 40 - 30 78.1 6 24 7 23 69.5 7 28 17 30 48.9 8 22 5 25 45.1
Table 5. Evacuation times – Limited Fixed and Dynamic Resources with
Interactions
Floor Number of Staff
Number of Patients (Ambulatory)
Number of Patients (Nonambulatory)
Evacuation Time ( Min)
1 25 21 6 11.45 2a 28 19 10 4 2b 20 15 24 16.9 3 30 39 - 2.1 4 - 300 - 24 5 40 - 30 80.2 6 24 7 23 75.7 7 28 17 30 57.6 8 22 5 25 65.2
Figure 1 summarizes the results of all four levels of approximation above. As expected, level 4 has the highest values, but is also closest to any real scenario where resources are limited and different units of the hospital are competing for use of these resources. Clearly for critical units in floors 5 to 8, the assumptions of unlimited resources and/or independence of these units play major roles in evacuation times.
7Jafari et al.: Staff Management in Emergency Evacuation Preparedness
Published by The Berkeley Electronic Press, 2008

Comparison between 4 levels - effect of resource capacity on evacuation time
05
10152025303540455055606570758085
1 2a 2b 3 4 5 6 7 8
Floors
Evac
uatio
n Ti
me
(min
)
Level 1
Level 2
Level 3
Level 4
Fig. 1) Comparison of evacuation times for various levels of resource capacity
3.2 Resource Allocation Upon evacuation of a unit with smaller number of patients or with patients having lower acuity of illness (like a typical med/surge unit compared to a critical care unit), the staff of that floor may be available to help other floors that are still undergoing evacuation or may have patients with higher acuity. External resources such as volunteers and county/EMS responders, who may be present at the scene throughout the emergency response, could also be allocated by incident manager to help units during evacuation. Some hospital systems (like Lehigh Valley Hospital in Allentown PA) maintain a float pool that mainly consists of registered nurses. These nurses are normally assigned to the clinical units that may need extra staffing. The incident manager may also use these resources - if available - as extra help when needed. Now the main problem of interest is to develop a strategy that could help the Emergency Incident Manager or the Administrator-On-Call allocate these various types of human resources to the units at risk during an emergency evacuation operation. The objective function for such an optimization problem will clearly be to minimize the overall evacuation time or to maximize the number of evacuees during a given time period. One constraint in such an optimization problem is to ensure that the minimum patient-to-nurse ratio is satisfied at safe location(s) where the evacuees are transferred to. The problem of resource allocation has been addressed in systems engineering and operation research literature quite extensively. Except for
8 JHSEM: Vol. 5 [2008], No. 1, Article 46
http://www.bepress.com/jhsem/vol5/iss1/46

systems with small number of resources and tasks, this problem has non-polynomial computational complexity in time and exact solutions cannot be obtained. For a typical hospital with several units (often spread over several floors) the problem can only then be solved through heuristic algorithms. These dispatch policies are presented next. While these polices can be evaluated and ranked for a given application using simulations, we adopt more rigorous analytical techniques to promote the generality of our results. We will use an illustrative example for the comparison of these techniques. The example will be based on the local hospital in New Jersey, except that all the data are changed. 3.2.1 Dispatch Policy 1 Suppose that at any given time t during a hospital evacuation, there is a float pool of human resources (medical and/or non-medical) available to assist with the operation. Here, the dispatching of extra resources from this float pool will be based on the ratio of remaining evacuation time to the number of patients at the units. The decision maker will assign the extra staff to a unit which has the greatest improvement (or reduction) of this ratio. This technique requires us to compute the remaining evacuation time at each incomplete unit at any given time. Of course it is essential that such a technique is real time, thus computationally efficient. While simulation is a potential candidate, there are issues like statistical instability of the results for short simulation runs that may create major drawbacks. A rigorous analytical technique, on the other hand, can provide reasonably accurate results in a very short amount of time without much of instability problems. One problem with such an analytical approach is that it cannot take into account the non-deterministic behavior of evacuees and human resources, except in the form of expected values. While in simulation, it is possible to deal with this problem with any degree of accuracy required. In what follows, we propose one such analytical technique which can be used by any hospital with no hospital dependent constraints such as layout. The list of input parameters used in this analytical approach is given below. It should be emphasized that these parameters are input variables and their values can be changed to create various scenarios. The value of these variables also may differ from one floor to another. Algorithm Objective: Estimation of evacuation time based on the shortest process time Parameters:
P1 = Number of walking wounded patients - type 1
9Jafari et al.: Staff Management in Emergency Evacuation Preparedness
Published by The Berkeley Electronic Press, 2008

P2 = Number of less critical patients (on wheelchair) - type 2 P3 = Number of critical patients (on bed) - type 3 P11 = Evacuation time for type 1 patients from a floor to the safe location (one patient) P22 = Evacuation time for type 2 patients from a floor to the safe location (one patient) P33 = Evacuation time for type 3 patients from a floor to the safe location (one patient) M = Number of Medical staff N = Number of non-medical staff B = Number of staff members who stay with their patients at the safe location R = Ratio of assigned staff to the walking wounded patients C = Capacity of fixed resources (elevators and so on) S = Number of existing staff on a floor P = Number of patients on a floor (see the following note)
Et = Estimated evacuation time Note that the ratio of number of staff needed to the number of remaining patients (S:P) should also be considered in the calculations. This ratio is equal to two for a patient on bed and one for a walking wounded or a wheel-chaired patient (P = P1+P2+2*P3). The algorithm estimates the evacuation time for each floor. Therefore, the value of parameters such as evacuation times (P11, P22, and P33) and number of patients (P1, P2, and P3) may vary among individual floors. Step 1: For time t during the evacuation operation, find the number of remaining patients on each floor. If S >= P, then there is no need for extra staff at this stage. Otherwise go to step 3. The floors/units with S < P have higher priority. Not more than (P-S)/2 extra staff members are assigned in each iteration. At the end of the first iteration for all candidate floors, the next iteration is started if extra staffs are still available. Step 2: If S >= P for the units that are not fully evacuated yet, allocation of extra help can make the operation move faster. Go to step 3. Step 3: Estimate the remaining time of evacuation for all the floors that are not completely evacuated using 14 different sets of conditions, most possible situations, in a hospital. According to their functions for each set, the remaining evacuation time was estimated. One of the set as an example is as follows: If P1 1≥ , P2 ≤ (M+N-R), P3< (M+N), 1 ≤≤ R M+N), M+ N-R ≤ C and M+ N-B ≤ C, Then Et= P22+ [
)(32BNM
P−+
] × P33 + F × P33
10 JHSEM: Vol. 5 [2008], No. 1, Article 46
http://www.bepress.com/jhsem/vol5/iss1/46

If )(
32BNM
P−+
>1 and non-integer,
then F=1, otherwise F=0. We want to restate that the objective of evacuation is to minimize the evacuation time and maximize the number of evacuees. Therefore, the priority is to evacuate the patients from type 1 to type 3 respectively. Obviously patients need less help in this order and this is a realistic reaction of a system in an event. Step 4: Find out the ratio of the remaining evacuation time to the number of patients (Et / P). Step 5: Send one extra nurse to each candidate floor and measure the ratio in step 4. Step 6: The best ratio is eligible for the assignment of one extra nurse. Continue this algorithm until S=P for the floors. If for all floors S=P, then continue the ratio approach to make evacuation operation faster. 3.2.2 Dispatch Policy 2 Here we utilize the concept of shortest processing time, often used in scheduling theory to minimize overall make span time. The floor that has the lowest evacuation time per patient has the highest priority to receive extra staff.
3.2.3 Dispatch Policy 3
This policy is the same as policy 1 except that all extra staff are assigned to the unit or floor with the highest ratio, until the condition S=P is satisfied. The heuristic algorithm is as follows: Step 1: For each floor, if S>= P then there is no need to assign extra staff at this stage. Step 2: Estimate the remaining time for evacuation for all floors that are not completely evacuated. Step 3: Find out the ratio of remaining evacuation time to the number of remaining patients on the floor (Et / P). Step 4: For the lowest ratio, assign nurses at time t up to (P-S). Step 5: Continue this algorithm until S=P for the floors. 3.2.4 Dispatch Policy 4
Here, the assignment of extra staff at time t is according to the value of S/P. Any unit with S/P≤1 is eligible for the assignment of extra staff but the floor with a
11Jafari et al.: Staff Management in Emergency Evacuation Preparedness
Published by The Berkeley Electronic Press, 2008

lower ratio has more priority. After adding 1 extra staff member to each floor, the ratio is recalculated. 3.2.5 Dispatch Policy 5 Here the extra staff is assigned to each floor based on a weight factor defined a priori. The algorithm is as follows:
1. Extra staffs are assigned to the floors based on the value of Wi (weight factor assigned to floor i). For example if there are 10 extra nurses and the weights for floors 3, 4, and 5 are 0.4, 0.5, and 0.1 respectively, then they receive 4, 5, and 1 of extra available resources according to the associated weight for each of these floors.
2. If the ratio is not an integer or the number of assigned staff cannot be used for that floor (for example 1 patient on bed needs 2 staffs and only 1 is available) then the number of assigned staff is rounded based on the priority.
Note that the assumption of S/P ≤ 1 is not considered in this policy. 3.2.6 Dispatch Policy 6 Here extra staffs are randomly distributed to the candidate floors according to a probability distribution. 3.3 Illustrative Examples To compare the above-mentioned dispatch policies we use the following examples. The results are compared to the real data provided by the hospital and obtained from the simulation model. Example 1 Suppose all floors are being evacuated and that at time t = 20 (20 minutes after the start of evacuation operation) the pool of staff has 16 nurses. Also assume that six elevators are available. Furthermore, we assume that at time t = 20 minutes, the fourth, fifth, and sixth floors need extra help. This information is summarized in Table 6.
12 JHSEM: Vol. 5 [2008], No. 1, Article 46
http://www.bepress.com/jhsem/vol5/iss1/46

Table 6. Summary Information for Example 1
Floor Staff
P3 (#patients
on bed)
P2 (#patients
on wheelchair)
B (#staff at the safe location)
Preparation time for P2
(each patient) (min)
Preparation time for P3
(each patient) (min)
C ( number
of elevators)
4 27 13 7 2 3 4 2 5 28 15 7 2 3 4 2 6 23 11 12 2 3 4 2
Policy 1: In this scenario S:P ratio is taken into the consideration, which requires two staff members for type 3 patients (P3). The condition of S<P then becomes valid for all three floors (e.g., 27 < (13*2+7)). After applying this policy, 6, 5, and 5 extra staff members are assigned to the floors 4, 5, and 6 respectively. Policy 2: In this case, the priority in assigning extra staff is considered based on the shortest evacuation time. The average time shows the evacuation time for a patient on that floor. Floor 4 has the lowest value so the first group of extra staff is assigned to that floor. The results are 6, 9, and 1 extra staff for the floors 4, 5, 6, respectively. Policy 3: Based on this policy, floor 4 has the best ratio so all extra staff members will be assigned to this floor until the S=P condition is satisfied. The result would be 6, 9, and 1 extra staffs for floors 4, 5, 6 respectively. Policy 4: Based on this policy, the lower value for ratio of staff to the patients is the best candidate to get extra staff. Floor 6 has the lowest ratio; therefore the first extra staff is assigned to this floor first. Table 7 shows the assignment of staffs to each floor after applying this policy. Policy 5: The extra help will be assigned based on the weight factor considered for each floor by the incident manager. For example if 0.3, 0.3 and 0.4 are the weights assigned to floors 4, 5 and 6 respectively, then 5, 5, and 6 extra staffs are sent to these floors accordingly. Example 2 In this example, the number of extra staff is considered to be 7 who are available 15 minutes after evacuation starts. Table 8 shows the status of the floors. The results of assigning the staff to the floors are shown in Table 9. Example 3 The information is the same as example 2 but the number of extra staff is 10. The results are shown in Table 10.
13Jafari et al.: Staff Management in Emergency Evacuation Preparedness
Published by The Berkeley Electronic Press, 2008

Table 7. Assignment of Staff based on Policy 4 – Example 1 Extra staff Floor 4 Floor 5 Floor 6
1 0 0 1 2 0 0 1 3 0 0 1 4 0 1 0 5 0 0 1 6 0 1 0 7 1 0 0 8 0 0 1 9 0 1 0
10 0 0 1 11 0 1 0 12 1 0 0 13 0 0 1 14 0 1 0 15 1 0 0 16 0 0 1
Table 8. Summarized Information for Example 2
Floor Staff P3 P2 B Preparation time
for P2 (each patient)
Preparation time for P3
(each patient)
C ( number of elevators)
4 20 7 7 2 3 4 2 5 15 8 6 2 3 4 2 6 15 6 7 2 3 4 2
Table 9. Assigned Staff for the Example 2
Floor Policy 1 Policy 2 Policy 3 Policy 4 Policy 5 4 1 1 1 0 2 5 4 6 2 5 2 6 2 0 4 2 3
Table 10. Assigned Staff for Example 3
Assigned Staff Floor Policy 1 Policy 2 Policy 3 Policy 4 Policy 5
4 1 1 1 0 3 5 5 7 5 6 3 6 4 2 4 4 4
14 JHSEM: Vol. 5 [2008], No. 1, Article 46
http://www.bepress.com/jhsem/vol5/iss1/46

4. Comparison of Results A simulation model was used to compare the results of these policies. Number of evacuees at time t and the remaining evacuation time are the main performance criteria used in this comparison. The simulation results shown in figures 2, 3, and 4 indicate that policy 1 gives better results. In other words, the evacuation process is performed in a shorter amount of time if policy 1 is to be followed.
Example 1- Total number of evacuated patients based upon the time after adding extra staff
05
10152025303540455055606570
5 10 15 20 25 30 35 40 45 50Time (min) after assigning extra staff
Number of evacuated
patients
Policy 1Policy 2Policy 3Policy 4
Policy 5
Fig.2) Results of Example 1
According to the results of example 1 shown in figure 2, execution of the shortest process time policy (policy 1) resulted in the evacuation of all patients in about 40 minutes. Other policies performed slower than policy 1. Although policy 5 produces the same evacuation time as policy 1, the performance of the evacuation process is slightly different than policy 1. As indicated in figure 2, the number of evacuated patients in any time interval is less than or equal to the policy 1.
15Jafari et al.: Staff Management in Emergency Evacuation Preparedness
Published by The Berkeley Electronic Press, 2008
Example 2- Total number of evacuated patients based upon the time after adding extra staff
05
1015202530354045
5 10 15 20 25 30 35 40
Number of evacuated patients
Policy 1Policy 2Policy 3Policy 4Policy 5
Time (min) after assigning extra staff
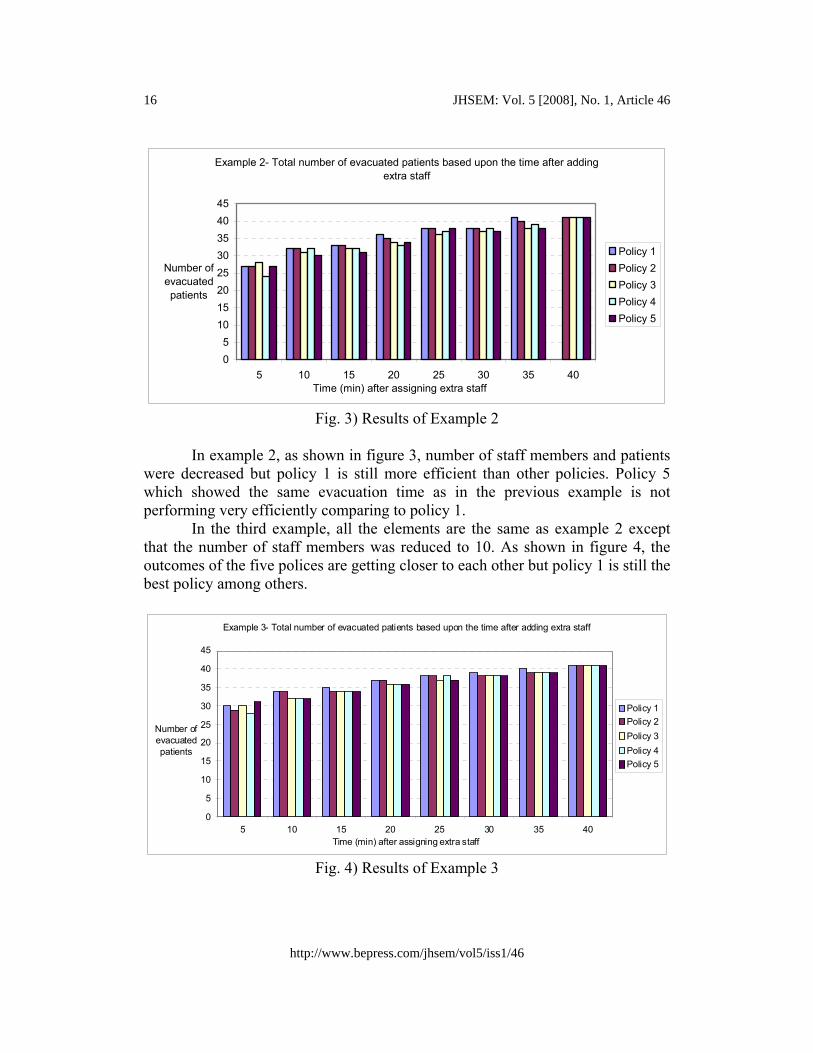
Fig. 3) Results of Example 2 In example 2, as shown in figure 3, number of staff members and patients were decreased but policy 1 is still more efficient than other policies. Policy 5 which showed the same evacuation time as in the previous example is not performing very efficiently comparing to policy 1. In the third example, all the elements are the same as example 2 except that the number of staff members was reduced to 10. As shown in figure 4, the outcomes of the five polices are getting closer to each other but policy 1 is still the best policy among others.
Example 3- Total number of evacuated patients based upon the time after adding extra staff
0
5
10
15
20
25
30
35
40
45
5 10 15 20 25 30 35 40
Number of evacuated patients
Policy 1Policy 2Policy 3Policy 4Policy 5
Time (min) after assigning extra staff
Fig. 4) Results of Example 3
16 JHSEM: Vol. 5 [2008], No. 1, Article 46
http://www.bepress.com/jhsem/vol5/iss1/46

5. Conclusion In this paper, we first showed that the interactions between critical resources and their availability play a major role in the duration of time it takes to evacuate patients in a hospital setting. A simulation model was built to evaluate the evacuation process for this purpose. The assumptions used in the modeling were established such that the model was built as close to the reality as possible. For example, probabilistic distributions were used to estimate the duration of evacuation activities and the moving distances between different locations. We then generated computational models of the allocation of some critical resources, namely medical and non-medical staff, to the various unites of a hospital at the time of emergency. The objective was to obtain a resource allocation policy with high performance. In other words, the best policy is the one that can be use to evacuate patients as fast as possible to save more lives. We used simulation modeling to compare these various allocation policies and showed that a policy based on the shortest remaining evacuation time could be a very good solution if the incident manager decides to proportionally allocate extra staff. Different S:P ratios in several scenarios confirm that policy 1 may show better performance than others. It was also realized that the proposed policies generated similar outcomes as the S:P ratio decreased. We believe that this study can give incident managers an estimate of the evacuation times and help them in their decision makings and resource allocation during an emergency situation. We also believe that our models are generic enough to be used in various hospital settings. The next step of this research is to focus on creating a simple, practical spreadsheet simulation that uses these policies as a basis to build various what-if scenarios. References
Bakhadyrov, I., Jafari, M. and Maher, A., “Technological Advances in Evacuation Planning and Emergency Management: Current State of the Art”, Technical Report, Rutgers, The State University of New Jersey, March 2003.
Bakuli, D. L. and Smith J. M., “Resource Allocation in State-Dependent Emergency Evacuation Networks”, European Journal of Operations Research, 1996, 89: 543-555.
Chang, E. C., “Traffic Simulation for Effective Emergency Evacuation”, vailable online at http://www.ictpaweb.org/publication/NCA/conferean03/Proceeding/074.pdf,2003.
17Jafari et al.: Staff Management in Emergency Evacuation Preparedness
Published by The Berkeley Electronic Press, 2008

Cova, T. J. and Johnson, J. P., “A Network Flow Model for Lane-Based vacuation Routing”, Transportation Research - Part A, 2003, 37: 579-604.
Franzese, O. and Joshi, S., “Traffic Simulation Application to Plan Real-Time Distribution Routes, In Proceedings of the 2002 Winter Simulation Conference.
Hobeika, A.G. and Jamei B., “MASSVAC: A Model for Calculating Evacuation Times under Natural Disaster”, Emergency Planning - Simulation Series, 1985, 15: 23–28.
Hobeika, A.G. and Kim, C., “Comparison of Traffic Assignments in Evacuation Modeling”, IEEE Transactions on Engineering Management, 1998, 45(2): 192–198.
Lo, S. M., Fang, Z., and Chen, D., “Use of a Modified Network Model For Analyzing Evacuation Patterns in High-Rise Buildings”, Journal of Architectural Engineering, June 2001, 7(2): 21-29.
Pidd, M., de Silva, F. N., and Eglese, R. W., “A Simulation Model for Emergency Evacuation”, European Journal of Operational Research, 1996, 90(3): 413–419.
Radwan, E., Mollaghasemi, M., Mitchell, S., and Yildirim, G., “Framework for Modeling Emergency Evacuation”, Final project report submitted to Florida Department of Transportation, 2005.
Santos, G. and Aguirre, B. E., “A Critical Review of Emergency Evacuation Simulation Models”, Preliminary Paper No. 339, University of Delaware, Disaster Research Center, 2004.
Sheffi, Y., Mahmassani H., and Powell W. B., “A Transportation Network Evacuation model”, Transportation Research - Part A, 1982, 16(3): 209–218.
Taaffe, K. M., Kohl, R., and Kimbler, D. L., “Hospital Evacuation: Issues and Complexities”, In Proceedings of the 2005 Winter Simulation Conference.
Wolshon, B., “One-way-out: Contra flow Freeway Operation for Hurricane Evacuation”, Natural Hazards Review, 2001, 2(3): 105–112.
18 JHSEM: Vol. 5 [2008], No. 1, Article 46
http://www.bepress.com/jhsem/vol5/iss1/46