staar grades 3-8 assessments 2021 - texas education agency
TRANSCRIPT

STAA
R G
rade
s 3–
8
2021 TEXAS STUDENT ASSESSMENT PROGRAM INTERPRETING ASSESSMENT REPORTS 2.1
STAAR Grades 3–8 Assessments
Program OverviewRefer to the table in the General Information section that includes the assessments available for the 3–8 program.
STAARSTAAR includes assessments of mathematics, reading, writing, science, and social studies in grades 3–8.
STAAR SpanishSTAAR Spanish is provided for English learners (E L s) in grades 3–5 who meet specific participation requirements for a Spanish-version assessment.
STAAR with Embedded SupportsEmbedded supports (e.g., text-to-speech and content and language supports) are available on STAAR assessments for eligible students as individual embedded online accommodations, or designated supports. Paper administrations with embedded supports are also available for eligible students requiring a paper administration of STAAR. Paper administrations with embedded supports require approval of the Texas Education Agency (TEA) and contain only some of the supports available in the online assessments with embedded supports.
The Speech-To-Text (STT) tool is available online for students who meet the eligibility criteria for Basic Transcribing or Spelling Assistance, AND for whom Speech-To-Text is the most appropriate method of delivery for these supports.
Only available for tests with a composition open entry response box (grades 4 & 7 writing, and English I, English II, and English III, and grade 4 Spanish writing).
STAAR Refreshable BrailleOnline screen reader support for refreshable braille displays is available for eligible students as an individual online accommodation.
STAAR American Sign Language VideoAmerican Sign Language videos are available online for eligible students as individual embedded online accommodations.

STAA
R G
rade
s 3–
8
2021 TEXAS STUDENT ASSESSMENT PROGRAM INTERPRETING ASSESSMENT REPORTS 2.2
Assessment Scores The following gives a brief description of scores provided for the STAAR grades 3–8 assessments. For more detailed technical information about scores, refer to the Technical Digest, available on TEA’s Student Assessment Division webpage.
Raw ScoreThe raw score is the number of items answered correctly on an assessment. By itself, the raw score has limited utility; it can be interpreted only in reference to the total number of items on a subject-area assessment, and raw scores should not be compared across administrations.
The raw score is reported by overall assessment and by reporting category.
Horizontal Scale ScoreThe horizontal scale score is used for the grades 4 and 7 writing, grades 5 and 8 science, and grade 8 social studies STAAR assessments.
The horizontal scale score is a statistic that allows a comparison of scores by adjusting for variations in the difficulty of the forms used in different administrations. The horizontal scale score can be used to determine whether a student achieved Approaches Grade Level, Meets Grade Level, or Masters Grade Level performance, to compare one student to another taking the same grade/subject area assessment, and to compare cohorts of students taking the same grade/subject area assessment in different years. However, the horizontal scale score cannot be used to compare a student’s achievement across grades or subject areas.
Vertical Scale ScoreThe vertical scale score is used for the STAAR grades 3–8 mathematics and reading assessments (including Spanish versions for grades 3–5).
The important feature of the vertical scale score is that, unlike the horizontal scale score, it can be used to evaluate a student’s progress across grades in a particular subject. The vertical scale score can also be used to determine whether a student achieved Approaches Grade Level, Meets Grade Level, or Masters Grade Level performance, to compare one student to another taking the same grade/subject area assessment, and to compare cohorts of students taking the same grade/subject area assessment in different years. However, the vertical scale score cannot be compared across subject areas within the same assessment program. On the vertical scale, the Approaches Grade Level, Meets Grade Level, or Masters Grade Level scale score increases for each grade.

STAA
R G
rade
s 3–
8
2021 TEXAS STUDENT ASSESSMENT PROGRAM INTERPRETING ASSESSMENT REPORTS 2.3
Performance StandardsThe following gives a brief description of the performance levels used on the STAAR 3–8 assessments.
Masters Grade LevelPerformance in this category indicates that students are expected to succeed in the next grade or course with little or no academic intervention. Students in this category demonstrate the ability to think critically and apply the assessed knowledge and skills in varied contexts, both familiar and unfamiliar.
For Algebra II and English III, the Masters Grade Level performance also indicates students are well prepared for postsecondary success.
Meets Grade LevelPerformance in this category indicates that students have a high likelihood of success in the next grade or course but may still need some short-term, targeted academic intervention. Students in this category generally demonstrate the ability to think critically and apply the assessed knowledge and skills in familiar contexts.
For Algebra II and English III, the Meets Grade Level performance also indicates students are sufficiently prepared for postsecondary success.
Approaches Grade LevelPerformance in this category indicates that students are likely to succeed in the next grade or course with targeted academic intervention. Students in this category generally demonstrate the ability to apply the assessed knowledge and skills in familiar contexts.
Did Not Meet Grade LevelPerformance in this category indicates that students are unlikely to succeed in the next grade or course without significant, ongoing academic intervention. Students in this category do not demonstrate a sufficient understanding of the assessed knowledge and skills.
Appropriate Score UsesSTAAR 3–8 assessment results have several uses, both for individual students and for comparing the performance of groups. A more detailed explanation of appropriate score uses can be found in the Technical Digest, available on TEA’s Student Assessment Division webpage.

STAA
R G
rade
s 3–
8
2021 TEXAS STUDENT ASSESSMENT PROGRAM INTERPRETING ASSESSMENT REPORTS 2.4
Individual StudentsThe STAAR 3–8 scale score indicates whether a student has met a performance level and how far the student’s achievement is above or below a performance level. All students not achieving the Approaches Grade Level performance on a STAAR 3–8 assessment must be offered additional instruction.
Assessment results can be used to compare the performance of an individual student to the performance of a demographic group, a program group, or an entire campus or district in a particular grade level. For example, the scores for a Hispanic student in a gifted and talented program could be compared to the average scores of Hispanic students, to other gifted and talented students, or to all the students at the campus assessed at the grade level.
Groups of StudentsAssessment scores can be used to compare the performance of different demographic or program groups. All STAAR 3–8 scores can be analyzed within the same grade and subject area for any single administration to determine which demographic or program group had the highest average scale score, the lowest percentage achieving each performance level, the highest percentage achieving Masters Grade Level performance, etc.
Other scores can be used to help evaluate the academic performance of demographic or program groups in core academic areas. For example, aggregations of reporting-category data can help districts and campuses identify areas of potential academic weakness for a group of students. This same methodology can be applied to an entire campus or district.
In addition, all assessment scores can be compared to regional and statewide performance within the same subject area for any administration.
Cautions for Score Use Several cautions must be kept in mind when analyzing STAAR assessment results. More detailed technical information describing cautions for score use is provided in the Technical Digest, available on TEA’s Student Assessment Division webpage.
Horizontal and Vertical Scale ScoresBoth the horizontal and vertical scale scores allow for a comparison of assessment scores, within a particular grade and subject area, across administrations.
Only the vertical scale score allows for a comparison of scores across grades in a particular subject. For example, a student’s scale score on the grade 3 reading assessment could be compared to the student’s scale score on the grade 4 reading assessment.

STAA
R G
rade
s 3–
8
2021 TEXAS STUDENT ASSESSMENT PROGRAM INTERPRETING ASSESSMENT REPORTS 2.5
Neither the vertical nor the horizontal scale score can be used to compare achievement across subjects.
Using Reporting-Category Information Reporting-category information at the individual student level should be used with caution due to the limited number of items in each reporting category. When aggregated at the campus or district level, such information might be useful in helping campuses identify skill areas in which further diagnosis is warranted. As with all assessments given at a single point in time, the data generated from this snapshot should be used in conjunction with other evaluations of performance to provide an in-depth portrait of student achievement. Once an area of possible weakness has been identified, supplementary data should be gathered to further define which instructional intervention would be most effective.
Furthermore, because each STAAR 3–8 assessment is equated only at the total assessment level, year-to-year comparisons of reporting-category performance should be made cautiously. The assessment is constructed to make the difficulty of a given reporting category similar for each administration of a STAAR 3–8 assessment. However, some fluctuations in the difficulty of the reporting categories do occur at every administration. Observing trends in reporting-category performance over time, identifying patterns of performance in clusters of reporting categories assessing similar skills, and comparing campus or district reporting-category performance to that of the region or state are appropriate uses of group reporting-category information.
Raw Score Distribution for Essay QuestionsBecause the essay questions from different administrations could be different items, the raw score distributions for such items across administrations are not directly comparable.
Program Evaluation Standardized assessments are a valuable tool for evaluating programs. However, any assessment can furnish only one part of the picture. The STAAR 3–8 assessments are not able to identify, let alone measure, every factor that contributes to the success or failure of a program. Assessment results can be most helpful if considered as one component of an evaluation system.
The Passing Standard and Items CorrectThe passing standards for STAAR 3–8 are related to two factors: (1) the difficulty of the items on the assessments, and (2) the number of items students have to answer correctly to pass. The passing standard is set on the original form of each grade and subject-area assessment. When different items are used in another administration, the difficulty of the items, and thus the overall difficulty of the assessment, might fluctuate. To compensate for slight changes in difficulty, the number of items needed to pass the assessment is adjusted.

STAA
R G
rade
s 3–
8
2021 TEXAS STUDENT ASSESSMENT PROGRAM INTERPRETING ASSESSMENT REPORTS 2.6
Report Formats Standard and additional reports are available for the STAAR 3–8 assessments. Assessment reports are provided automatically to districts. Additional services for assessment reports are also available for a fee to districts. A district must submit a request through the STAAR Assessment Management System to receive additional copies of the STAAR report card or Confidential Student Label.
Reports that include “confidential” in the title contain student-level results. All other reports present assessment results in an aggregated format. More information about the confidentiality of students’ results is contained in the General Information section.
Note that the sample reports included in this guide are for illustration only. They are provided to show the basic layout of the reports and the information they provide. Some information might not correspond to real values.
ResourcesRefer to the General Information section of this guide and TEA’s Student Assessment Division webpage for additional STAAR 3–8 information and resources.

STAA
R G
rade
s 3–
8
2021 TEXAS STUDENT ASSESSMENT PROGRAM INTERPRETING ASSESSMENT REPORTS 2.7
Assessment ReportsInformation contained in the assessment reports is sufficient to satisfy mandatory reporting requirements (refer to the General Information section). The following section of the guide describes the STAAR and STAAR Spanish assessment reports that districts receive.
STAAR Report Card 2.8
Confidential Student Label 2.19
Confidential Campus Roster 2.22
Summary Report 2.27
Constructed Responses Summary Report 2.31
Combined Summary Report 2.34
Confidential Images of Essays 2.36
Confidential Student Item Analysis Report 2.39
Item Analysis Summary Report 2.42
Electronic Individual Student Record File (Confidential) 2.44

STAA
R G
rade
s 3–
8
2021 TEXAS STUDENT ASSESSMENT PROGRAM INTERPRETING ASSESSMENT REPORTS 2.8
STAAR Report CardExamples shown: STAAR Grade 4, STAAR Grade 5, STAAR Grade 8
A separate STAAR Report Card is provided for each student for whom a STAAR, STAAR Spanish, or STAAR with Embedded Supports answer document or online record was submitted. Assessment results are shown for each subject area assessed for that grade. Information from this report is useful when reporting results to students and parents. Results for students taking one or more STAAR subjects will be combined on the same STAAR Report Card.
Available: STAAR, STAAR Spanish, and STAAR with Embedded Supports results are combined on one report.
A.
Performance at a Glance This shows the student’s performance levels for all STAAR assessments the student has taken.
B. Student Portal InformationThis provides the web address and access code for parents and students to access information from the STAAR Report Card online.
C. Student and School Identification InformationThe top of the STAAR Report Card contains identification information, both for the student (name, identification number, etc.) and the school (district, class group, etc.). For confidentiality, the student identification number (P E I M S) is indicated by five asterisks followed by the last four digits of the ID number. The grade and the report date are also indicated.
D. PercentileThis shows the percentage of students who scored the same or lower than the student’s score when comparing the student’s performance to all Texas students who took the same test last year. For more information about last year’s scoring distribution, visit T E A ’s STAAR Frequency Distributions webpage.
E. Student’s Scale ScoreThe student’s scale score is an indicator of his or her performance on the test. The STAAR scale score allows comparison of the student’s score with the score ranges of the Did Not Meet Grade Level, Approaches Grade Level, Meets Grade Level, and Masters Grade Level performances. The scale score indicates how far the student’s achievement is above or below these performance standards.
F. Scale Score BarThis bar shows how well students could perform on the test. The placement of the student’s scale score shows where the student actually performed on the test. The scores needed to achieve each performance level are also marked on the scale score bar.

STAA
R G
rade
s 3–
8
2021 TEXAS STUDENT ASSESSMENT PROGRAM INTERPRETING ASSESSMENT REPORTS 2.9
G.
Reporting CategoriesThe content and skills tested on each STAAR assessment are grouped together. Each group is called a reporting category. The categories for each subject are listed in this review description section.
H. Weighted Score This shows the points the student earned on the written composition out of the total points possible. The process of weighting assessment scores emphasizes the contribution of the written composition when computing the final score. The written composition is not weighted at grade 4 and is weighted by two at grade 7.
For example, at grade 4, if a student has 17 of the 24 multiple-choice items correct and receives a combined score of 5 on the written composition, the student’s total writing raw score will be 22 out of 32 possible raw score points (17 + 5).
At grade 7, if a student has 22 of the 30 multiple-choice items correct and receives a combined score of 5 on the written composition, the student’s total writing raw score will be 32 out of 46 possible raw score points {22 + (5 * 2)}.
I. Answered CorrectlyThis shows the number of questions the student answered correctly out of the total number of questions tested in each reporting category.
J. STAAR Progress MeasureThe STAAR Progress Measure provides information about how much the student has improved in a subject area. This measure is based on a comparison of the student’s score last year with his or her score this year. The student can receive one of the three Progress Measure designations—Limited, Expected, and Accelerated. Additional information about the STAAR Progress Measures can be found in the STAAR Resources section on TEA’s webpage.
K. Test InformationThis shows whether the student took the STAAR assessment with embedded supports on paper or took the STAAR assessment online with or without embedded supports. This also indicates when a Spanish test was administered.
L. Lexile MeasureThe Lexile measure indicates the difficulty of the materials that the student should be able to read successfully. The Lexile measure for STAAR students is reported in the range of Beginning Reader (BR or 0L) to a positive value in each grade (e.g., 1100L at grade 3, 1200L at grade 4, and so on).
M. Quantile Measure The Quantile measure indicates the progress made in learning mathematics content and what new mathematics content they may be ready to learn next. The Quantile measure for STAAR students is reported in the range of Emerging Mathematician (EM or 0L) to a positive value in each grade (e.g., 400Q at grade 3, 500Q at grade 4 and so on).
N. Resources These are personalized strategies per subject for college and career planning.

STAA
R G
rade
s 3–
8
2021 TEXAS STUDENT ASSESSMENT PROGRAM INTERPRETING ASSESSMENT REPORTS 2.10
O.
Test DateFor grades without retest administrations, the date of testing will be SPRING 2021. For grades with retest administrations (grades 5 and 8), the date of testing will be the month the assessment occurred.
P. Test ResultsIn place of a scale score, a variety of report messages might appear in each subject area, indicating the student’s performance status or scoring information.
Possible messages are listed below. Changes in policy might result in different messages.
• NO INFORMATION AVAILABLE No information is available for this subject.
• NOT SCORED The student’s answer document or online record was coded “OTHER” for reasons such as illness during testing or test administration irregularities, or if the student was assessed above grade level (e.g., a grade 7 student took a grade 8 assessment).
• NOT TESTED—ABSENT The student was absent during the test.
• NOT SCORED—PREVIOUSLY ACHIEVED Student achieved Approaches Grade Level, Meets Grade Level, or Masters Grade Level performance in a previous administration.
Q. Previous Year Test ResultsThe left column of the graph shows the student’s previous year scale score as well as the performance level that the student’s scale score falls into. From the bottom to the top, the four performance levels are Did Not Meet Grade Level, Approaches Grade Level, Meets Grade Level, and Masters Grade Level.
R. Current Year Test ResultsThe right column of the graph shows the student’s current year scale score as well as the performance level that the student’s scale score falls into. From the bottom to the top, the four performance levels are Did Not Meet Grade Level, Approaches Grade Level, Meets Grade Level, and Masters Grade Level.
S. Math Badge IndicatorThe mathematics badge indicator is added for eligible students in grades 5, 6, and 7. The badge will be placed on the STAAR report card to inform parents that there is enough supporting evidence in their child’s assessment history to indicate that their child is ready to meaningfully engage in advanced mathematics course materials such as those in Algebra I coursework.
T. Algebra I ResultsStudents in grades 7 and 8 who took the Algebra I test during the spring administration will have their Algebra I results shown on their STAAR report card along with the other grade-level assessments they took during the STAAR grades 3-8 administration.

STAA
R G
rade
s 3–
8
2021 TEXAS STUDENT ASSESSMENT PROGRAM INTERPRETING ASSESSMENT REPORTS 2.11
RESOURCES TAILORED FOR FIRSTNAMEReading
Strategies to improve your child’s grade 8 reading understanding
Understanding/Analysis Across Genres
• Help your child plan and create a podcast. Explore different genres of podcasts, then plan and create your own!
• Point out and discuss instances where foreign phrases are used frequently in English, such as quid pro quo.
Understanding/Analysis of Literary Texts
• In works of literary (fiction) text, point out and discuss non-linear plot elements like flashbacks and foreshadowing with your child.
Understanding/Analysis of Informational Texts
• Read informational (nonfiction) texts with your child and discuss whether any opinions presented are substantiated (supported by evidence) or unsubstantiated (not supported by evidence).
Writing: Composition, Revision and Editing
• Challenge your child to randomly choose fifteen words from a dictionary and use those words to write a story.
MathematicsStrategies to improve your child’s grade 8 math understanding
Numerical Representations and Relationships
• Have your child find a number between 100 and 225 and approximate the square root of that number.
• Have your child find numbers in everyday life and have them categorize them as real numbers, integers, etc.
Computations and Algebraic Relationships
• When taking a trip, whether to the store or on vacation, have your child create a map indicating how long it will take to travel a quarter of the way, half way, three quarters of the way, and all the way there. Have your child compare these times to the actual time it takes.
Geometry and Measurement
• Have your child find the volume of an everyday object, such as a can of soup.
• Have your child measure the length and the diagonal of a table and use the Pythagorean theorem to find the width.
Data Analysis and Personal Financial Literacy
• Have your child find the amount of simple interest that is earned when a certain amount of money is invested at a percentage for one year.
• Have your child locate or create scatterplots from everyday events and draw a trend line beginning at (0,0) through the data points and make a prediction about data not represented by a point plotted on the graph.
Use the Find a Book tool on http://TexasAssessment.gov
to find appropriate reading material for FIRSTNAME.
Confidential 2021 STAAR Report Card for:
FIRSTNAME LASTNAMEFIRSTNAME'S PERFORMANCE AT A GLANCE
Reading
MastersGrade Level
Test Date: April 2021
Mathematics
MeetsGrade Level
Test Date: April 2021
Social Studies
ApproachesGrade Level
Test Date: May 2021
Science
Did Not MeetGrade Level
Test Date: May 2021
Go to http://TexasAssessment.gov and log in to learn more.
FIRSTNAME'S UNIQUE ACCESS
CODE 3V6H2GFrom the CommissionerTests are a part of life. Our kids will take tests to get a driver's license, to get into college, and even to get certain jobs. As a parent of four myself, I know that no one test can tell me everything about my children. But the STAAR tests have been designed to provide useful information about how much our children have learned academically and how well prepared they are for what comes next.
Students who meet or master grade level by high school graduation have more than a 60% chance of passing their college classes, substantially increasing their lifetime earnings and prospects for success. This report is intended to give you information on how well your child learned this year's academic material in school and how you can help them learn even more.
Mike Morath, Commissioner of Education
What the Results MeanThis report shows how well your child did on the STAAR. There are four levels of performance.
MASTERSGRADE LEVELMastery of the course knowledge and skills is shown — student is on track for college and career readiness.
MEETSGRADE LEVELStrong knowledge of course content — student is prepared to progress to the next grade.
APPROACHESGRADE LEVELSome knowledge of course content but may be missing critical elements — student needs additional support in the coming year.
DID NOT MEETGRADE LEVELNo basic understanding of course expectations is shown — student may need significant support in the coming year.
Maximize Time During Parent Teacher Conferences
Sample Questions to Ask the Teacher:• What do you see as my child’s strengths?• What does my child seem to be the most interested in at school?• Does my child get along well with their classmates?• What is the most important thing that I can be doing to prepare my
child for high school?• Is my child giving his/her best effort?• What could my child be doing that he/she is not already doing?• What do you think are the biggest challenges for my child, and how
can I help him/her with those challenges?
E
D
C
B
A
F
G
H
I

STAA
R G
rade
s 3–
8
2021 TEXAS STUDENT ASSESSMENT PROGRAM INTERPRETING ASSESSMENT REPORTS 2.12
Performance: 4th GradeFIRSTNAME I. LASTNAME ENROLLED GRADE: 4
Student ID: *****9999 Local Student ID: 99999 District: 999-999 DISTRICT NAME
Reading Test Date: Spring 2021. . . . . . . . . . . . . . . . . . . . . . . . . . . . . . . . . . . . . . . . . . . . . . . . . . . . . . . . . . . .
MEETSGRADE LEVELYour child scored the same or better than 86% of all grade 4 students in Texas.
Administered STAAR Spanish Test
Did Not Meet Grade Level(707-1412)
Approaches Grade Level (1413-1538)
Meets Grade Level (1539-1635)
Masters Grade Level (1636-2042)
Knowledge and Skills Categories for ReadingUnderstanding/Analysis Across Genres
2 Correct of8 Total
Understanding/Analysis of Literary Texts
15 Correct of15 Total
Understanding/Analysis of Informational Texts
13 Correct of13 Total
Mathematics Test Date: Spring 2021. . . . . . . . . . . . . . . . . . . . . . . . . . . . . . . . . . . . . . . . . . . . . . . . . . . . . . . . . . . .
MEETSGRADE LEVELYour child scored the same or better than 86% of all grade 4 students in Texas.
Administered STAAR Spanish Test
Did Not Meet Grade Level(944-1466)
Approaches Grade Level (1467-1588)
Meets Grade Level (1589-1669)
Masters Grade Level (1670-1997)
Knowledge and Skills Categories for Mathematics
Numerical Representations and Relationships
9 Correct of9 Total
Computations and Algebraic Relationships
8 Correct of11 Total
Geometry and Measurement
7 Correct of10 Total
Data Analysis and Personal Financial Literacy
3 Correct of4 Total
Writing Test Date: Spring 2021. . . . . . . . . . . . . . . . . . . . . . . . . . . . . . . . . . . . . . . . . . . . . . . . . . . . . . .
MEETSGRADE LEVELYour child scored the same or better than 66% of all grade 4 students in Texas.
Administered STAAR Spanish Test
Did Not Meet Grade Level(793-3549)
Approaches Grade Level (3550-3999)
Meets Grade Level (4000-4542)
Masters Grade Level (4543-6472)
Knowledge and Skills Categories for WritingWritten Composition
Composition 6 of8 Total Points
Multiple-Choice
Revision 0 Correct of8 Total
Editing 16 Correct of16 Total
999999 Want to see the questions FIRSTNAMEanswered incorrectly? Use this code to log in. http://TexasAssessment.gov
RUI = 0 ReportDocID = 0044620612379320
G
P
CC
B
K
O
DF
I
E
H
EPaper with Embedded Supports
K
Paper with Embedded Supports
Paper with Embedded Supports
Progress: From Previous YearsFIRSTNAME I. LASTNAME
Campus: 999 CAMPUS NAME Class Group: GROUP NAME Report Date: JUNE 2021 Date of Testing: SPRING 2021
Reading. . . . . . . . . . . . . . . . . . . . . . . . . . . . . . . . . . . . . . . . . . . . . . . . . . . . . . . . . . . . . .
Lexile Measure:815L
Learn more about Lexile Measures and how they can be used to help your child succeed at http://TexasAssessment.gov.
Mathematics . . . . . . . . . . . . . . . . . . . . . . . . . . . . . . . . . . . . . . . . . . . . . . . . . . . . . . . . . . . . . .
Quantile Measure:847Q
Learn more about Quantile Measures and how they can be used to help your child succeed at http://TexasAssessment.gov.
Progress Legend
Your child has shown less thanexpected academic improvement from
last year to this year.
Your child has shown expectedacademic improvement from last
year to this year.
Your child has shown more thanexpected academic improvement from
last year to this year.
999999 Want to help support FIRSTNAME’s progress? Use this code to log in. http://TexasAssessment.gov
Document # 9999-99990 060121-99999999-999999999
Due to COVID-19, progress was calculated using spring 2019 and spring 2021 assessment results. Considering your child’s instructional and learning conditions from 2018-2019 and 2020-2021 school years, you can use this information as one of the many tools to gauge your child’s academic performance across these two years.
A
B
C
D
F
G
H
I
J
K
L
M
N
O
P
Q
R
S
T
U
A
B
C
D
E
F
G
H
I
J
L
M
N
O
P
Q
R
S
T
U

STAA
R G
rade
s 3–
8
2021 TEXAS STUDENT ASSESSMENT PROGRAM INTERPRETING ASSESSMENT REPORTS 2.13
Performance: 4th GradeFIRSTNAME I. LASTNAME ENROLLED GRADE: 4
Student ID: *****9999 Local Student ID: 99999 District: 999-999 DISTRICT NAME
Reading Test Date: Spring 2021. . . . . . . . . . . . . . . . . . . . . . . . . . . . . . . . . . . . . . . . . . . . . . . . . . . . . . . . . . . . . . . . . .
MEETSGRADE LEVELYour child scored the same or better than 86% of all grade 4 students in Texas.
Administered STAAR Spanish Test
Did Not Meet Grade Level(707-1412)
Approaches Grade Level (1413-1538)
Meets Grade Level (1539-1635)
Masters Grade Level (1636-2042)
Knowledge and Skills Categories for ReadingUnderstanding/Analysis Across Genres
2 Correct of8 Total
Understanding/Analysis of Literary Texts
15 Correct of15 Total
Understanding/Analysis of Informational Texts
13 Correct of13 Total
Mathematics Test Date: Spring 2021. . . . . . . . . . . . . . . . . . . . . . . . . . . . . . . . . . . . . . . . . . . . . . . . . . . . . . . . . . . . . . . . . .
MEETSGRADE LEVELYour child scored the same or better than 86% of all grade 4 students in Texas.
Administered STAAR Spanish Test
Did Not Meet Grade Level(944-1466)
Approaches Grade Level (1467-1588)
Meets Grade Level (1589-1669)
Masters Grade Level (1670-1997)
Knowledge and Skills Categories for Mathematics
Numerical Representations and Relationships
9 Correct of9 Total
Computations and Algebraic Relationships
8 Correct of11 Total
Geometry and Measurement
7 Correct of10 Total
Data Analysis and Personal Financial Literacy
3 Correct of4 Total
Writing Test Date: Spring 2021. . . . . . . . . . . . . . . . . . . . . . . . . . . . . . . . . . . . . . . . . . . . . . . . . . . . . . . . . . . . . . . . . .
MEETSGRADE LEVELYour child scored the same or better than 66% of all grade 4 students in Texas.
Administered STAAR Spanish Test
Did Not Meet Grade Level(793-3549)
Approaches Grade Level (3550-3999)
Meets Grade Level (4000-4542)
Masters Grade Level (4543-6472)
Knowledge and Skills Categories for WritingWritten Composition
Composition 6 of8 Total Points
Multiple-Choice
Revision 0 Correct of8 Total
Editing 16 Correct of16 Total
999999 Want to see the questions FIRSTNAME answered incorrectly? Use this code to log in. http://TexasAssessment.gov
RUI = 0 ReportDocID = 0044620612379320
Progress: From Previous YearsFIRSTNAME I. LASTNAME
Campus: 999 CAMPUS NAME Class Group: GROUP NAME Report Date: JUNE 2021 Date of Testing: SPRING 2021
Reading. . . . . . . . . . . . . . . . . . . . . . . . . . . . . . . . . . . . . . . . . . . . . . . . . . . . . . . . . . . . . .
Lexile Measure: 815L
Learn more about Lexile Measures and how they can be used to help your child succeed at http://TexasAssessment.gov.
Mathematics . . . . . . . . . . . . . . . . . . . . . . . . . . . . . . . . . . . . . . . . . . . . . . . . . . . . . . . . . . . . . .
Quantile Measure:847Q
Learn more about Quantile Measures and how they can be used to help your child succeed at http://TexasAssessment.gov.
Progress Legend
Your child has shown less thanexpected academic improvement from
last year to this year.
Your child has shown expectedacademic improvement from last
year to this year.
Your child has shown more thanexpected academic improvement from
last year to this year.
999999 Want to help support FIRSTNAME’s progress? Use this code to log in. http://TexasAssessment.gov
Document # 9999-99990 060121-99999999-999999999
Due to COVID-19, progress was calculated using spring 2019 and spring 2021 assessment results. Considering your child’s instructional and learning conditions from 2018-2019 and 2020-2021 school years, you can use this information as one of the many tools to gauge your child’s academic performance across these two years.
L
M
C
J
Q
R
B
J

STAA
R G
rade
s 3–
8
2021 TEXAS STUDENT ASSESSMENT PROGRAM INTERPRETING ASSESSMENT REPORTS 2.14
Performance: 5th GradeFIRSTNAME I. LASTNAME ENROLLED GRADE: 5
Student ID: *****9999 Local Student ID: 99999 District: 999-999 DISTRICT NAME
1420,1950,1451,2000
99999999150044620612379321
1950
2000
4950
92
95
90
4
4
4
Progress: From Previous YearFIRSTNAME I. LASTNAME
Campus: 999 CAMPUS NAME Class Group: GROUP NAME Report Date: JUNE 2020 Date of Testing: MAY 2020
Reading. . . . . . . . . . . . . . . . . . . . . . . . . . . . . . . . . . . . . . . . . . . . . . . . . . . . . . . . . . . . . .
Lexile Measure: 1200L
Learn more about Lexile Measures and how they can be used to help your child succeed at TexasAssessment.gov.
Mathematics. . . . . . . . . . . . . . . . . . . . . . . . . . . . . . . . . . . . . . . . . . . . . . . . . . . . . . . . . . . . . .
Quantile Measure:1785Q
Learn more about Quantile Measures and how they can be used to help your child succeed at TexasAssessment.gov.
Progress Legend
Your child has shown less thanexpected academic improvement from
last year to this year.
Your child has shown expectedacademic improvement from last
year to this year.
Your child has shown more thanexpected academic improvement from
last year to this year.
999999 Want to see the questions FIRSTNAME answered incorrectly? Use this code to log in. TexasAssessment.gov 999999 Want to help support FIRSTNAME’s progress?
Use this code to log in. TexasAssessment.govRUI = 0 ReportDocID = 0044620612379321 Document # 9999-99991 060120-99999999-999999999
Reading Test Date: April 2020. . . . . . . . . . . . . . . . . . . . . . . . . . . . . . . . . . . . . . . . . . . . . . . . . . . . . . . . . . . . . . . . . .
MASTERSGRADE LEVELYour child scored the same or better than 92% of all grade 5 students in Texas.
Did Not Meet Grade Level(772-1460)
Approaches Grade Level (1461-1581)
Meets Grade Level (1582-1700)
Masters Grade Level (1701-2127)
Passing
Knowledge and Skills Categories for ReadingUnderstanding/AnalysisAcross Genres
7 Correct of8 Total
Understanding/Analysis of Literary Texts
15 Correct of16 Total
Understanding/Analysis of Informational Texts
13 Correct of14 Total
Mathematics Test Date: April 2020. . . . . . . . . . . . . . . . . . . . . . . . . . . . . . . . . . . . . . . . . . . . . . . . . . . . . . . . . . . . . . . . . .
MASTERSGRADE LEVELYour child scored the same or better than 95% of all grade 5 students in Texas.
Did Not Meet Grade Level(964-1499)
Approaches Grade Level (1500-1624)
Meets Grade Level (1625-1723)
Masters Grade Level (1724-2052)
Passing
Knowledge and Skills Categories for MathematicsNumerical Representations and Relationships
6 Correct of6 Total
Computations and Algebraic Relationships
16 Correct of17 Total
Geometry and Measurement
9 Correct of9 Total
Data Analysis and Personal Financial Literacy
4 Correct of4 Total
This badge indicates that your child is ready to meaningfully engage in advanced math course material. This is one of many tools to help gauge their readiness for advanced math.
Science Test Date: May 2020. . . . . . . . . . . . . . . . . . . . . . . . . . . . . . . . . . . . . . . . . . . . . . . . . . . . . . . . . . . . . . . . . .
MASTERSGRADE LEVELYour child scored the same or better than 90% of all grade 5 students in Texas.
Did Not Meet Grade Level(1174-3549)
Approaches Grade Level (3550-3999)
Meets Grade Level (4000-4401)
Masters Grade Level (4402-5566)
Knowledge and Skills Categories for Science
Matter and Energy 5 Correct of6 Total
Force, Motion, and Energy 7 Correct of8 Total
Earth and Space 10 Correct of10 Total
Organisms and Environments
11 Correct of12 Total
G
P
C
B
O
DF
I
E
S

STAA
R G
rade
s 3–
8
2021 TEXAS STUDENT ASSESSMENT PROGRAM INTERPRETING ASSESSMENT REPORTS 2.15
Performance: 5th GradeFIRSTNAME I. LASTNAME ENROLLED GRADE: 5
Student ID: *****9999 Local Student ID: 99999 District: 999-999 DISTRICT NAME
Reading Test Date: April 2021. . . . . . . . . . . . . . . . . . . . . . . . . . . . . . . . . . . . . . . . . . . . . . . . . . . . . . . . . . . . . . . . . .
MASTERSGRADE LEVELYour child scored the same or better than 92% of all grade 5 students in Texas.
Did Not Meet Grade Level(772-1460)
Approaches Grade Level (1461-1581)
Meets Grade Level (1582-1700)
Masters Grade Level (1701-2127)
Passing
Knowledge and Skills Categories for ReadingUnderstanding/Analysis Across Genres
7 Correct of8 Total
Understanding/Analysis of Literary Texts
15 Correct of16 Total
Understanding/Analysis of Informational Texts
13 Correct of14 Total
Mathematics Test Date: April 2021. . . . . . . . . . . . . . . . . . . . . . . . . . . . . . . . . . . . . . . . . . . . . . . . . . . . . . . . . . . . . . . . . .
MASTERSGRADE LEVELYour child scored the same or better than 95% of all grade 5 students in Texas.
Did Not Meet Grade Level(964-1499)
Approaches Grade Level (1500-1624)
Meets Grade Level (1625-1723)
Masters Grade Level (1724-2052)
Passing
Knowledge and Skills Categories for Mathematics
Numerical Representations and Relationships
6 Correct of6 Total
Computations and Algebraic Relationships
16 Correct of17 Total
Geometry and Measurement
9 Correct of9 Total
Data Analysis and Personal Financial Literacy
4 Correct of4 Total
This badge indicates that your child is ready to meaningfully engage in advanced math course material. This is one of many tools to help gauge their readiness for advanced math.
Science Test Date: May 2021. . . . . . . . . . . . . . . . . . . . . . . . . . . . . . . . . . . . . . . . . . . . . . . . . . . . . . . . . . . . . . . . . .
MASTERSGRADE LEVELYour child scored the same or better than 90% of all grade 5 students in Texas.
Did Not Meet Grade Level(1174-3549)
Approaches Grade Level (3550-3999)
Meets Grade Level (4000-4401)
Masters Grade Level (4402-5566)
Knowledge and Skills Categories for Science
Matter and Energy 5 Correct of6 Total
Force, Motion, and Energy 7 Correct of8 Total
Earth and Space 10 Correct of10 Total
Organisms and Environments
11 Correct of12 Total
999999 Want to see the questions FIRSTNAME answered incorrectly? Use this code to log in. http://TexasAssessment.gov
RUI = 0 ReportDocID = 0044620612379321
Progress: From Previous YearsFIRSTNAME I. LASTNAME
Campus: 999 CAMPUS NAME Class Group: GROUP NAME Report Date: JUNE 2021 Date of Testing: MAY 2021
Reading. . . . . . . . . . . . . . . . . . . . . . . . . . . . . . . . . . . . . . . . . . . . . . . . . . . . . . . . . . . . . .
Lexile Measure: 1200L
Learn more about Lexile Measures and how they can be used to help your child succeed at http://TexasAssessment.gov.
Mathematics . . . . . . . . . . . . . . . . . . . . . . . . . . . . . . . . . . . . . . . . . . . . . . . . . . . . . . . . . . . . . .
Quantile Measure:1785Q
Learn more about Quantile Measures and how they can be used to help your child succeed at http://TexasAssessment.gov.
Progress Legend
Your child has shown less thanexpected academic improvement from
last year to this year.
Your child has shown expectedacademic improvement from last
year to this year.
Your child has shown more thanexpected academic improvement from
last year to this year.
999999 Want to help support FIRSTNAME’s progress? Use this code to log in. http://TexasAssessment.gov
Document # 9999-99991 060121-99999999-999999999
Due to COVID-19, progress was calculated using spring 2019 and spring 2021 assessment results. Considering your child’s instructional and learning conditions from 2018-2019 and 2020-2021 school years, you can use this information as one of the many tools to gauge your child’s academic performance across these two years.
L
M
J
C
Q
R
B
J

STAA
R G
rade
s 3–
8
2021 TEXAS STUDENT ASSESSMENT PROGRAM INTERPRETING ASSESSMENT REPORTS 2.16
Performance: 8th GradeFIRSTNAME I. LASTNAME ENROLLED GRADE: 8
Student ID: *****9999 Local Student ID: 99999 District: 999-999 DISTRICT NAME
Reading Test Date: April 2021. . . . . . . . . . . . . . . . . . . . . . . . . . . . . . . . . . . . . . . . . . . . . . . . . . . . . . . . . . . . . . . . . .
APPROACHESGRADE LEVELYour child scored the same or better than 46% of all grade 8 students in Texas.
Did Not Meet Grade Level(969-1586)
Approaches Grade Level (1587-1699)
Meets Grade Level (1700-1782)
Masters Grade Level (1783-2156)
Passing
Knowledge and Skills Categories for ReadingUnderstanding/Analysis Across Genres
2 Correct of8 Total
Understanding/Analysis of Literary Texts
13 Correct of19 Total
Understanding/Analysis of Informational Texts
11 Correct of17 Total
Algebra I Test Date: Spring 2021. . . . . . . . . . . . . . . . . . . . . . . . . . . . . . . . . . . . . . . . . . . . . . . . . . . . . . . . . . . . . . . . . .
MASTERSGRADE LEVELYour child scored the same or better than 91% of all students who took this test.
Did Not Meet Grade Level(1420-3549)
Approaches Grade Level (3550-3999)
Meets Grade Level (4000-4332)
Masters Grade Level (4333-6181)
PassingKnowledge and Skills Categories for Algebra I
Number and Algebraic Methods
10 Correct of11 Total
Describing and Graphing Linear Functions, Equations, and Inequalities
12 Correct of12 Total
Writing and Solving Linear Functions, Equations, and Inequalities
14 Correct of14 Total
Quadratic Functions and Equations
10 Correct of11 Total
Exponential Functions and Equations
5 Correct of6 Total
Social Studies Test Date: May 2021. . . . . . . . . . . . . . . . . . . . . . . . . . . . . . . . . . . . . . . . . . . . . . . . . . . . . . . . . . . . . . . . . .
MEETSGRADE LEVELYour child scored the same or better than 74% of all grade 8 students in Texas.
Did Not Meet Grade Level(1043-3549)
Approaches Grade Level (3550-3999)
Meets Grade Level (4000-4267)
Masters Grade Level (4268-5985)
Knowledge and Skills Categories for Social Studies
History 14 Correct of17 Total
Geography and Culture 7 Correct of10 Total
Government and Citizenship
6 Correct of10 Total
Economics, Science, Technology, and Society
4 Correct of7 Total
Science Test Date: May 2021. . . . . . . . . . . . . . . . . . . . . . . . . . . . . . . . . . . . . . . . . . . . . . . . . . . . . . . . . . . . . . . . . .
DID NOT MEETGRADE LEVELYour child scored the same or better than 23% of all grade 8 students in Texas.
Did Not Meet Grade Level(773-3549)
Approaches Grade Level (3550-3999)
Meets Grade Level (4000-4405)
Masters Grade Level (4406-6246)
Knowledge and Skills Categories for Science
Matter and Energy 4 Correct of11 Total
Force, Motion, and Energy 5 Correct of9 Total
Earth and Space 5 Correct of11 Total
Organisms and Environments
3 Correct of11 Total
999999 Want to see the questions FIRSTNAME answered incorrectly? Use this code to log in. http://TexasAssessment.gov
RUI = 0 ReportDocID = 0044620612379322
Progress: From Previous YearsFIRSTNAME I. LASTNAME
Campus: 999 CAMPUS NAME Class Group: GROUP NAME Report Date: JUNE 2021 Date of Testing: MAY 2021
Reading. . . . . . . . . . . . . . . . . . . . . . . . . . . . . . . . . . . . . . . . . . . . . . . . . . . . . . . . . . . . . .
Lexile Measure: 1045L
Learn more about Lexile Measures and how they can be used to help your child succeed at http://TexasAssessment.gov.
Algebra I . . . . . . . . . . . . . . . . . . . . . . . . . . . . . . . . . . . . . . . . . . . . . . . . . . . . . . . . . . . . . .
Growth Graph Not Applicable.To learn more, visit http://TexasAssessment.gov.
Quantile Measure:1750Q
Learn more about Quantile Measures and how they can be used to help your child succeed at http://TexasAssessment.gov.
Progress Legend
Your child has shown less thanexpected academic improvement from
last year to this year.
Your child has shown expectedacademic improvement from last
year to this year.
Your child has shown more thanexpected academic improvement from
last year to this year.
999999 Want to help support FIRSTNAME’s progress? Use this code to log in. http://TexasAssessment.gov
Document # 9999-99992 060121-99999999-999999999
Due to COVID-19, progress was calculated using spring 2019 and spring 2021 assessment results. Considering your child’s instructional and learning conditions from 2018-2019 and 2020-2021 school years, you can use this information as one of the many tools to gauge your child’s academic performance across these two years.
G
P
C
B
O
DF
I
E
T

STAA
R G
rade
s 3–
8
2021 TEXAS STUDENT ASSESSMENT PROGRAM INTERPRETING ASSESSMENT REPORTS 2.17
Performance: 8th GradeFIRSTNAME I. LASTNAME ENROLLED GRADE: 8
Student ID: *****9999 Local Student ID: 99999 District: 999-999 DISTRICT NAME
Reading Test Date: April 2021. . . . . . . . . . . . . . . . . . . . . . . . . . . . . . . . . . . . . . . . . . . . . . . . . . . . . . . . . . . . . . . . . .
APPROACHESGRADE LEVELYour child scored the same or better than 46% of all grade 8 students in Texas.
Did Not Meet Grade Level(969-1586)
Approaches Grade Level (1587-1699)
Meets Grade Level (1700-1782)
Masters Grade Level (1783-2156)
Passing
Knowledge and Skills Categories for ReadingUnderstanding/Analysis Across Genres
2 Correct of8 Total
Understanding/Analysis of Literary Texts
13 Correct of19 Total
Understanding/Analysis of Informational Texts
11 Correct of17 Total
Algebra I Test Date: Spring 2021. . . . . . . . . . . . . . . . . . . . . . . . . . . . . . . . . . . . . . . . . . . . . . . . . . . . . . . . . . . . . . . . . .
MASTERSGRADE LEVELYour child scored the same or better than 91% of all students who took this test.
Did Not Meet Grade Level(1420-3549)
Approaches Grade Level (3550-3999)
Meets Grade Level (4000-4332)
Masters Grade Level (4333-6181)
PassingKnowledge and Skills Categories for Algebra I
Number and Algebraic Methods
10 Correct of11 Total
Describing and Graphing Linear Functions, Equations, and Inequalities
12 Correct of12 Total
Writing and Solving Linear Functions, Equations, and Inequalities
14 Correct of14 Total
Quadratic Functions and Equations
10 Correct of11 Total
Exponential Functions and Equations
5 Correct of6 Total
Social Studies Test Date: May 2021. . . . . . . . . . . . . . . . . . . . . . . . . . . . . . . . . . . . . . . . . . . . . . . . . . . . . . . . . . . . . . . . . .
MEETSGRADE LEVELYour child scored the same or better than 74% of all grade 8 students in Texas.
Did Not Meet Grade Level(1043-3549)
Approaches Grade Level (3550-3999)
Meets Grade Level (4000-4267)
Masters Grade Level (4268-5985)
Knowledge and Skills Categories for Social Studies
History 14 Correct of17 Total
Geography and Culture 7 Correct of10 Total
Government and Citizenship
6 Correct of10 Total
Economics, Science, Technology, and Society
4 Correct of7 Total
Science Test Date: May 2021. . . . . . . . . . . . . . . . . . . . . . . . . . . . . . . . . . . . . . . . . . . . . . . . . . . . . . . . . . . . . . . . . .
DID NOT MEETGRADE LEVELYour child scored the same or better than 23% of all grade 8 students in Texas.
Did Not Meet Grade Level(773-3549)
Approaches Grade Level (3550-3999)
Meets Grade Level (4000-4405)
Masters Grade Level (4406-6246)
Knowledge and Skills Categories for Science
Matter and Energy 4 Correct of11 Total
Force, Motion, and Energy 5 Correct of9 Total
Earth and Space 5 Correct of11 Total
Organisms and Environments
3 Correct of11 Total
999999 Want to see the questions FIRSTNAME answered incorrectly? Use this code to log in. http://TexasAssessment.gov
RUI = 0 ReportDocID = 0044620612379322
Progress: From Previous YearsFIRSTNAME I. LASTNAME
Campus: 999 CAMPUS NAME Class Group: GROUP NAME Report Date: JUNE 2021 Date of Testing: MAY 2021
Reading. . . . . . . . . . . . . . . . . . . . . . . . . . . . . . . . . . . . . . . . . . . . . . . . . . . . . . . . . . . . . .
Lexile Measure: 1045L
Learn more about Lexile Measures and how they can be used to help your child succeed at http://TexasAssessment.gov.
Algebra I . . . . . . . . . . . . . . . . . . . . . . . . . . . . . . . . . . . . . . . . . . . . . . . . . . . . . . . . . . . . . .
Growth Graph Not Applicable.To learn more, visit http://TexasAssessment.gov.
Quantile Measure:1750Q
Learn more about Quantile Measures and how they can be used to help your child succeed at http://TexasAssessment.gov.
Progress Legend
Your child has shown less thanexpected academic improvement from
last year to this year.
Your child has shown expectedacademic improvement from last
year to this year.
Your child has shown more thanexpected academic improvement from
last year to this year.
999999 Want to help support FIRSTNAME’s progress? Use this code to log in. http://TexasAssessment.gov
Document # 9999-99992 060121-99999999-999999999
Due to COVID-19, progress was calculated using spring 2019 and spring 2021 assessment results. Considering your child’s instructional and learning conditions from 2018-2019 and 2020-2021 school years, you can use this information as one of the many tools to gauge your child’s academic performance across these two years.
L
M
J
C
Q
R
B
J
T

STAA
R G
rade
s 3–
8
2021 TEXAS STUDENT ASSESSMENT PROGRAM INTERPRETING ASSESSMENT REPORTS 2.18
RESOURCES TAILORED FOR FIRSTNAMEReading
Strategies to improve your child’s grade 8 reading understanding
Understanding/Analysis Across Genres
• Help your child plan and create a podcast. Explore different genres of podcasts, then plan and create your own!
• Point out and discuss instances where foreign phrases are used frequently in English, such as quid pro quo.
Understanding/Analysis of Literary Texts
• In works of literary (fiction) text, point out and discuss non-linear plot elements like flashbacks and foreshadowing with your child.
Understanding/Analysis of Informational Texts
• Read informational (nonfiction) texts with your child and discuss whether any opinions presented are substantiated (supported by evidence) or unsubstantiated (not supported by evidence).
Writing: Composition, Revision and Editing
• Challenge your child to randomly choose fifteen words from a dictionary and use those words to write a story.
MathematicsStrategies to improve your child’s grade 8 math understanding
Numerical Representations and Relationships
• Have your child find a number between 100 and 225 and approximate the square root of that number.
• Have your child find numbers in everyday life and have them categorize them as real numbers, integers, etc.
Computations and Algebraic Relationships
• When taking a trip, whether to the store or on vacation, have your child create a map indicating how long it will take to travel a quarter of the way, half way, three quarters of the way, and all the way there. Have your child compare these times to the actual time it takes.
Geometry and Measurement
• Have your child find the volume of an everyday object, such as a can of soup.
• Have your child measure the length and the diagonal of a table and use the Pythagorean theorem to find the width.
Data Analysis and Personal Financial Literacy
• Have your child find the amount of simple interest that is earned when a certain amount of money is invested at a percentage for one year.
• Have your child locate or create scatterplots from everyday events and draw a trend line beginning at (0,0) through the data points and make a prediction about data not represented by a point plotted on the graph.
Use the Find a Book tool on http://TexasAssessment.gov
to find appropriate reading material for FIRSTNAME.
Confidential 2021 STAAR Report Card for:
FIRSTNAME LASTNAMEFIRSTNAME'S PERFORMANCE AT A GLANCE
Reading
MastersGrade Level
Test Date: April 2021
Mathematics
MeetsGrade Level
Test Date: April 2021
Social Studies
ApproachesGrade Level
Test Date: May 2021
Science
Did Not MeetGrade Level
Test Date: May 2021
Go to http://TexasAssessment.gov and log in to learn more.
FIRSTNAME'S UNIQUE ACCESS
CODE 3V6H2GFrom the CommissionerTests are a part of life. Our kids will take tests to get a driver's license, to get into college, and even to get certain jobs. As a parent of four myself, I know that no one test can tell me everything about my children. But the STAAR tests have been designed to provide useful information about how much our children have learned academically and how well prepared they are for what comes next.
Students who meet or master grade level by high school graduation have more than a 60% chance of passing their college classes, substantially increasing their lifetime earnings and prospects for success. This report is intended to give you information on how well your child learned this year's academic material in school and how you can help them learn even more.
Mike Morath, Commissioner of Education
What the Results MeanThis report shows how well your child did on the STAAR. There are four levels of performance.
MASTERSGRADE LEVELMastery of the course knowledge and skills is shown — student is on track for college and career readiness.
MEETSGRADE LEVELStrong knowledge of course content — student is prepared to progress to the next grade.
APPROACHESGRADE LEVELSome knowledge of course content but may be missing critical elements — student needs additional support in the coming year.
DID NOT MEETGRADE LEVELNo basic understanding of course expectations is shown — student may need significant support in the coming year.
Maximize Time During Parent Teacher Conferences
Sample Questions to Ask the Teacher:• What do you see as my child’s strengths?• What does my child seem to be the most interested in at school?• Does my child get along well with their classmates?• What is the most important thing that I can be doing to prepare my
child for high school?• Is my child giving his/her best effort?• What could my child be doing that he/she is not already doing?• What do you think are the biggest challenges for my child, and how
can I help him/her with those challenges?
N

STAA
R G
rade
s 3–
8
2021 TEXAS STUDENT ASSESSMENT PROGRAM INTERPRETING ASSESSMENT REPORTS 2.19
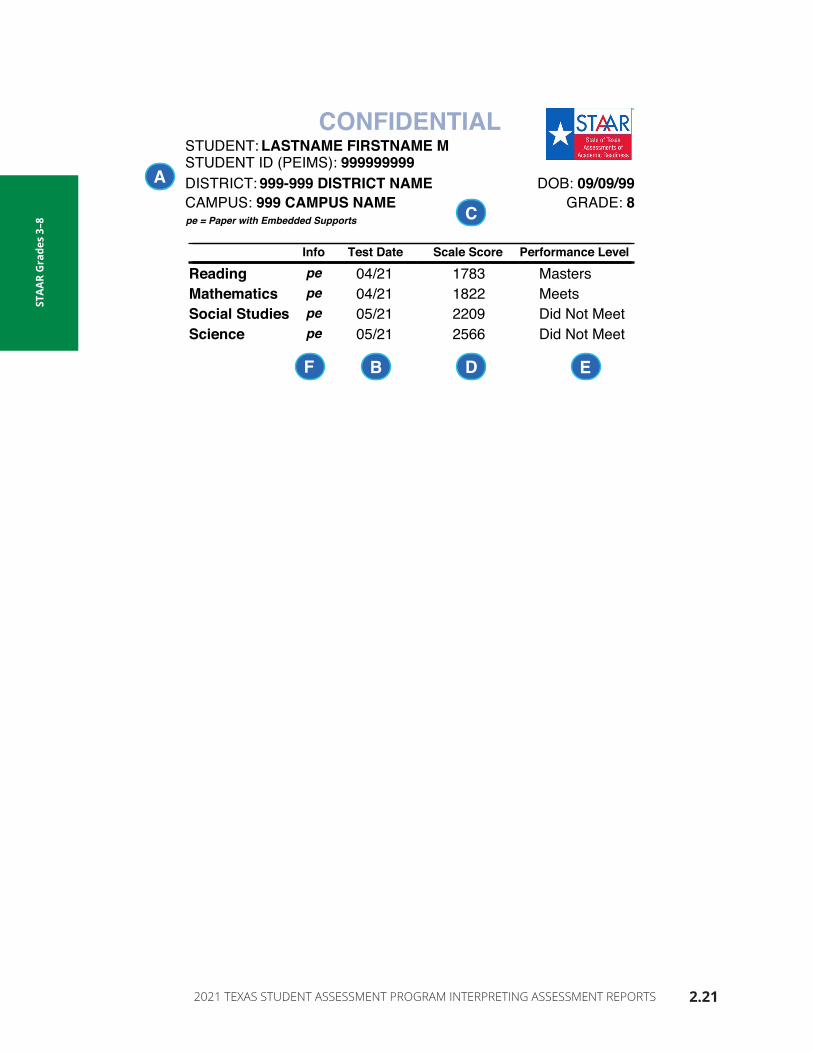
Confidential Student LabelExample shown: STAAR Grade 8
An adhesive Confidential Student Label is provided for each examinee for whom a STAAR answer document or online record was submitted. Assessment results are shown for each subject assessed, and these labels could be placed on the individual student’s permanent record. Results are combined on one label per student. Districts also have the option of not receiving labels.
A.
Student Identification InformationIdentification information shown at the top of the label includes the student name, student identification number (as used for PEIMS), birth date, district number and name, campus number and name, and grade.
B. Test DateThe test date of the student’s most recent performance status is given for each subject area.
C. Scale ScoreThe scale score corresponding to the student’s subject-area raw score is shown. Refer to Assessment Scores in the Program Overview for additional information about the STAAR scale scores. The raw score conversion tables for the STAAR administrations can be found on TEA’s Performance Reporting Department webpage.
D. Test ResultsIn place of a scale score, a variety of report comments might appear in each subject area, indicating the student’s performance status or scoring information.
Possible messages are listed below. Changes in policy might result in different messages.
•
ABSENT The student was absent during the test.
• NO INFORMATION AVAILABLE No information is available for this subject.
• NOT SCORED The student’s answer document or online record was coded “OTHER” for reasons such as illness during testing or test administration irregularities, or if the student was assessed above grade level (e.g., a grade 7 student took a grade 8 assessment).
E.
Performance LevelThe label indicates the performance level achieved for each subject. Refer to Performance Standards in the Program Overview for additional information about these standards.
F. InfoInformation about the assessment is provided whenever the student is not assessed with the general STAAR assessment. The information is indicated by one or two characters, and the description of the characters used will also be listed on the label.
STAA
R G
rade
s 3–
8
2021 TEXAS STUDENT ASSESSMENT PROGRAM INTERPRETING ASSESSMENT REPORTS 2.20
Possible messages are listed below. Changes in policy might result in different messages.
s STAAR Spanish (grades 3–5) A Spanish-version assessment was indicated for this subject.
e Online with Embedded Supports An online assessment with embedded supports was indicated for this subject.
o Online with No Embedded Supports An online assessment with no embedded supports was indicated for this subject.
pe Paper with Embedded Supports A paper assessment with embedded supports was indicated for this subject.
STAA
R G
rade
s 3–
8
2021 TEXAS STUDENT ASSESSMENT PROGRAM INTERPRETING ASSESSMENT REPORTS 2.21
CONFIDENTIALSTUDENT:STUDENT ID (PEIMS):DISTRICT: 999-999 DISTRICT NAME DOB:CAMPUS: 999 CAMPUS NAME GRADE:
Info Test Date Scale Score Performance Level
XXXX
CONFIDENTIALSTUDENT:STUDENT ID (PEIMS):DISTRICT: 999-999 DISTRICT NAME DOB:CAMPUS: 999 CAMPUS NAME GRADE:
Info Test Date Scale Score Performance Level
XXXX
CONFIDENTIALSTUDENT:STUDENT ID (PEIMS):DISTRICT: 999-999 DISTRICT NAME DOB:CAMPUS: 999 CAMPUS NAME GRADE:
Info Test Date Scale Score Performance Level
XXXX
CONFIDENTIALSTUDENT:STUDENT ID (PEIMS):DISTRICT: 999-999 DISTRICT NAME DOB:CAMPUS: 999 CAMPUS NAME GRADE:
Info Test Date Scale Score Performance Level
XXXX
CONFIDENTIALSTUDENT:STUDENT ID (PEIMS):DISTRICT: 999-999 DISTRICT NAME DOB:CAMPUS: 999 CAMPUS NAME GRADE:
Info Test Date Scale Score Performance Level
XXXX
CONFIDENTIALSTUDENT:STUDENT ID (PEIMS):DISTRICT: 999-999 DISTRICT NAME DOB:CAMPUS: 999 CAMPUS NAME GRADE:
Info Test Date Scale Score Performance Level
XXXX
CONFIDENTIALSTUDENT:STUDENT ID (PEIMS):DISTRICT: 999-999 DISTRICT NAME DOB:CAMPUS: 999 CAMPUS NAME GRADE:
Info Test Date Scale Score Performance Level
XXXX
CONFIDENTIALSTUDENT:STUDENT ID (PEIMS):DISTRICT: 999-999 DISTRICT NAME DOB:CAMPUS: 999 CAMPUS NAME GRADE:
Info Test Date Scale Score Performance Level
XXXX
CONFIDENTIALSTUDENT:STUDENT ID (PEIMS):DISTRICT: 999-999 DISTRICT NAME DOB:CAMPUS: 999 CAMPUS NAME GRADE:
Info Test Date Scale Score Performance Level
XXXX
CONFIDENTIALSTUDENT:STUDENT ID (PEIMS):DISTRICT: 999-999 DISTRICT NAME DOB:CAMPUS: 999 CAMPUS NAME GRADE:
Info Test Date Scale Score Performance Level
XXXX
CONFIDENTIALSTUDENT:STUDENT ID (PEIMS):DISTRICT: 999-999 DISTRICT NAME DOB:CAMPUS: 999 CAMPUS NAME GRADE:
Info Test Date Scale Score Performance Level
XXXX
CONFIDENTIALSTUDENT:STUDENT ID (PEIMS):DISTRICT: 999-999 DISTRICT NAME DOB:CAMPUS: 999 CAMPUS NAME GRADE:
Info Test Date Scale Score Performance Level
XXXX
CONFIDENTIAL
DISTRICT: 999-999 DISTRICT NAME
CAMPUS: 999 CAMPUS NAME
GRADE: 8
060121-99999999-999999999
CONFIDENTIAL CONFIDENTIALSTUDENT: LASTNAME FIRSTNAME MSTUDENT ID (PEIMS): 999999999DISTRICT: 999-999 DISTRICT NAME DOB: 09/09/99CAMPUS: 999 CAMPUS NAME GRADE: 8
p,
p,
p,
p,
p pe = Paper with Embedded Supports
Info Test Date Scale Score Performance Level
Reading pe 04/21 1783 MastersMathematics pe 04/21 1822 MeetsSocial Studies pe 05/21 2209 Did Not MeetScience pe 05/21 2566 Did Not Meet
A
B
C
DF E
B
C
D
E
F
G
H
I
J
K
L
M
N
O
P
Q
R
S
T
U
A
C
D
E
F
G
H
I
J
K
L
M
N
O
P
Q
R
S
T
U
A
B
D
E
F
G
H
I
J
K
L
M
N
O
P
Q
R
S
T
U
A
B
C
E
F
G
H
I
J
K
L
M
N
O
P
Q
R
S
T
U
A
B
C
D
E
G
H
I
J
K
L
M
N
O
P
Q
R
S
T
U
A
B
C
D
F
G
H
I
J
K
L
M
N
O
P
Q
R
S
T
U

STAA
R G
rade
s 3–
8
2021 TEXAS STUDENT ASSESSMENT PROGRAM INTERPRETING ASSESSMENT REPORTS 2.22
Confidential Campus RosterExample shown: STAAR Grade 4 Mathematics
The Confidential Campus Roster (All Students) is available for each grade assessed at each campus and lists every student for whom an answer document or online record was submitted. This report provides detailed student-level score results for each subject area assessed.
The Confidential Campus Roster (Students Not Achieving Approaches Grade Level) is available for each grade assessed at each campus and lists every student for whom an answer document or online record was submitted, but did not pass the subject area assessment.
Available: STAAR STAAR Spanish
Test results NOT included in the reporting-category summary results of the reports: - STAAR with Embedded Supports paper administrations - Braille - American Sign Language video
A.
Campus Identification InformationThe top of the report contains identification information for the campus. The grade assessed, subject area, report date, and date of testing are also indicated. The logo in the upper left-hand corner indicates the program reported.
B. Student InformationStudents are identified by name and student identification number (as used for PEIMS).
C. GradeThe student’s enrolled grade at the time of the assessment is indicated.
D. Scale ScoreThe scale score corresponding to the student’s subject-area raw score is shown. Refer to Assessment Scores in the Program Overview for additional information about STAAR scale scores. The raw score conversion tables for all STAAR administrations can be found on TEA’s Performance Reporting Department webpage.

STAA
R G
rade
s 3–
8
2021 TEXAS STUDENT ASSESSMENT PROGRAM INTERPRETING ASSESSMENT REPORTS 2.23
E.
Performance Levels
� Approaches Grade Level• If the student achieved Approaches, “YES” is shown.• If the student did not meet Approaches, “NO” is shown.• If a score code other than “S” is present, “---” is shown.
� Meets Grade Level• If the student achieved Meets, “YES” is shown.• If the student did not achieve Meets, “NO” is shown.• If a score code other than “S” is present, “---” is shown.
� Masters Grade Level• If the student achieved Masters, “YES” is shown.• If the student did not achieve Masters, “NO” is shown.• If a score code other than “S” is present, “---” is shown.
F. STAAR Progress MeasureThe STAAR progress measure provides information about the amount of improvement or progress a student has made in grades 5 and 8 mathematics and reading. The STAAR progress measure is calculated based on a student’s gain score—the scale score difference between the current accountability year and the previous accountability year(s). Individual student progress is then categorized as Limited, Expected, or Accelerated progress.
Additional information about the STAAR Progress Measures can be found in the STAAR Resources section on TEA’s Student Assessment Division webpage.
G. Results for Each Reporting Category
Mathematics, Reading, Science, and Social StudiesReporting category titles appear in the column headings. The number of items assessed in each reporting category is indicated below the reporting category titles. The number of items correct out of the total number of items for each reporting category is shown in the column headed “Number of Items Correct.”
WritingReporting-category titles appear in the column headings.
Under the reporting category “Composition,” the number of points possible is shown. The number of points scored out of the total points possible for the composition is shown in the column headed “Number of Points Scored.”
Under the reporting categories “Revision” and “Editing,” the number of items assessed in each reporting category is shown. The number of items answered correctly is shown in the columns headed “Number of Items Correct.”

STAA
R G
rade
s 3–
8
2021 TEXAS STUDENT ASSESSMENT PROGRAM INTERPRETING ASSESSMENT REPORTS 2.24
MessagesIn place of reporting-category-level data, a variety of report messages might appear, indicating the student’s performance status or scoring information.
Possible messages are listed below. Changes in policy might result in different messages.
•
NOT SCORED The student’s answer document or online record was coded “O” for reasons such as illness during testing or test administration irregularities, or if the student was assessed above grade level (e.g., a grade 7 student took a grade 8 assessment).
• NOT TESTED—ABSENT The student was absent during the test.
• NO INFORMATION AVAILABLE No information is available for this subject.
• ADMINISTERED STAAR SPANISH TEST
• ADMINISTERED STAAR TEST IN ENGLISH
H. InfoInformation about the assessment is provided whenever the student was administered an online assessment with embedded supports, an online assessment with no embedded supports, or a paper assessment with embedded supports. The information is indicated by characters or a symbol, and the description of the characters or symbol is shown in the legend.
Possible messages are listed below. Changes in policy might result in different messages.
e Online with Embedded Supports An online assessment with embedded supports was indicated for this subject.
o Online with No Embedded Supports An online assessment with no embedded supports was indicated for this subject.
p e Paper with Embedded Supports A paper assessment with embedded supports was indicated for this subject.
I.
Total Students Listed and Total Students TestedTotal Students Listed indicates the number of students included on the report. Total Students Tested indicates the total number of students that took this assessment.
J. Average Scale ScoreOn the final page of the report, this number represents the average scale score of the total number of students tested on the report.
K. Performance Results•
Number On the final page of the report, this number represents the total number of “YES” results for the entire report.
• Percent On the final page of the report, this number represents the percentage of “YES” results for all students tested on the report.

STAA
R G
rade
s 3–
8
2021 TEXAS STUDENT ASSESSMENT PROGRAM INTERPRETING ASSESSMENT REPORTS 2.25
L.
Average Reporting Category ResultsThese columns summarize reporting-category-level data for scored assessments excluding paper with embedded supports, braille, and American Sign Language videos. For each reporting category, the average number (#) and the percentage (%) of items students answered correctly are calculated. The average number of items correct is the total number of items correct divided by the total number of students assessed. The average percentage of items correct is the average total number of items correct divided by the total number of items assessed.
M. Process NumberThe process number found in the bottom-right corner of the report is a unique number, per administration, that is assigned to the report by the testing contractor. Refer to this number if questions arise about the report.

STAA
R G
rade
s 3–
8
2021 TEXAS STUDENT ASSESSMENT PROGRAM INTERPRETING ASSESSMENT REPORTS 2.26
NO
T SC
OR
ED
NO
T SC
OR
ED
STA
TE O
F TE
XAS
ASS
ESSM
ENTS
OF
AC
AD
EMIC
REA
DIN
ESS
Con
fiden
tial C
ampu
s R
oste
rG
RA
DE
4 M
ATH
EMA
TIC
SA
ll St
uden
tsD
ate
of T
estin
g: S
PRIN
G 2
021
Dis
tric
t: 99
9-99
9 D
ISTR
ICT
NAM
EC
ampu
s: 9
99 C
AMPU
S N
AME
Rep
ort D
ate:
JU
NE
2021
Info
Stud
ent
Stud
ent-I
D(P
EIM
S)G
r
Lege
nd---
=
No
Info
rmat
ion
Ava
ilabl
epe
= P
aper
with
Em
bedd
ed S
uppo
rts.
Dat
a ar
e no
t inc
lude
d in
the
repo
rtin
g ca
tego
ry s
umm
ary
info
rmat
ion.
o =
Onl
ine
with
no
Embe
dded
Sup
port
sPr
ogre
ss M
easu
re: 0
=Lim
ited,
1=E
xpec
ted,
2=A
ccel
erat
ed
Scale Score
Approaches
Meets
Masters
STAARProgress Measure
Res
ults
for E
ach
Rep
ortin
g C
ateg
ory
12
34
Num
eric
alR
epre
sent
atio
ns a
nd
Rel
atio
nshi
psC
ompu
tatio
ns a
nd
Alg
ebra
ic R
elat
ions
hips
Geo
met
ry a
nd
Mea
sure
men
tD
ata
Ana
lysi
s an
d Pe
rson
al F
inan
cial
Lite
racy
Num
ber o
f Ite
ms
Test
ed9
1110
4N
umbe
r of I
tem
s C
orre
ct
peLA
STN
AME
FIR
STN
AME
M99
9999
999
0414
67YE
SN
ON
O0
53
54
peLA
STN
AME
FIR
STN
AME
M99
9999
999
0414
79YE
SN
ON
O0
54
54
peLA
STN
AME
FIR
STN
AME
M99
9999
999
0414
94YE
SN
ON
O0
55
54
peLA
STN
AME
FIR
STN
AME
M99
9999
999
0415
09YE
SN
ON
O0
55
64
peLA
STN
AME
FIR
STN
AME
M99
9999
999
0415
24YE
SN
ON
O0
56
64
peLA
STN
AME
FIR
STN
AME
M99
9999
999
0415
39YE
SN
ON
O0
57
64
peLA
STN
AME
FIR
STN
AME
M99
9999
999
0415
55YE
SN
ON
O0
57
74
peLA
STN
AME
FIR
STN
AME
M99
9999
999
0415
72YE
SN
ON
O0
58
74
peLA
STN
AME
FIR
STN
AME
M99
9999
999
0415
89YE
SYE
SN
O0
68
74
peLA
STN
AME
FIR
STN
AME
M99
9999
999
0416
08YE
SYE
SN
O0
68
84
peLA
STN
AME
FIR
STN
AME
M99
9999
999
0416
28YE
SYE
SN
O0
78
84
peLA
STN
AME
FIR
STN
AME
M99
9999
999
0416
50YE
SYE
SN
O0
79
84
peLA
STN
AME
FIR
STN
AME
M99
9999
999
0416
70YE
SYE
SYE
S1
79
94
peLA
STN
AME
FIR
STN
AME
M99
9999
999
0417
05YE
SYE
SYE
S1
89
94
peLA
STN
AME
FIR
STN
AME
M99
9999
999
0417
41YE
SYE
SYE
S1
810
94
peLA
STN
AME
FIR
STN
AME
M99
9999
999
0417
90YE
SYE
SYE
S2
810
104
peLA
STN
AME
FIR
STN
AME
M99
9999
999
0418
69YE
SYE
SYE
S9
1010
4pe
LAST
NAM
EFI
RST
NAM
EM
9999
9999
904
2003
YES
YES
YES
29
1110
4pe
LAST
NAM
EFI
RST
NAM
EM
9999
9999
904
1338
NO
NO
NO
09
00
0pe
LAST
NAM
EFI
RST
NAM
EM
9999
9999
904
1373
NO
NO
NO
10
110
0
peLA
STN
AME
FIR
STN
AME
M99
9999
999
0413
56N
ON
ON
O0
00
100
peLA
STN
AME
FIR
STN
AME
M99
9999
999
0412
20N
ON
ON
O0
00
04
peLA
STN
AME
FIR
STN
AME
M99
9999
999
0413
38N
ON
ON
O2
90
00
peLA
STN
AME
FIR
STN
AME
M99
9999
999
0420
03YE
SYE
SYE
S9
1110
4pe
LAST
NAM
EFI
RST
NAM
EM
9999
9999
904
2003
YES
YES
YES
911
104
peLA
STN
AME
FIR
STN
AME
M99
9999
999
0413
38N
ON
ON
O9
00
0pe
LAST
NAM
EFI
RST
NAM
EM
9999
9999
904
------
------
---pe
LAST
NAM
EFI
RST
NAM
EM
9999
9999
904
2003
YES
YES
YES
911
104
peLA
STN
AME
FIR
STN
AME
M99
9999
999
0420
03YE
SYE
SYE
S9
1110
4pe
LAST
NAM
EFI
RST
NAM
EM
9999
9999
904
1389
NO
NO
NO
34
23
peLA
STN
AME
FIR
STN
AME
M99
9999
999
0415
24YE
SN
ON
O7
85
1pe
LAST
NAM
EFI
RST
NAM
EM
9999
9999
904
1628
YES
YES
NO
911
34
peLA
STN
AME
FIR
STN
AME
M99
9999
999
0416
50YE
SYE
SN
O9
114
4LA
STN
AME
FIR
STN
AME
M99
9999
999
04---
------
------
LAST
NAM
EFI
RST
NAM
EM
9999
9999
904
1037
NO
NO
NO
00
01
115
TOTA
L ST
UD
ENTS
LIS
TED
: 115
AVE
RA
GE:
1492
AVE
RA
GE
TOTA
L ST
UD
ENTS
TES
TED
: 106
NU
MB
ER:
5536
256.
04.
85.
31.
7PE
RC
ENT:
5234
2466
4453
43
Page
3 o
f 305
3120
21-9
9999
999-
9999
9999
9
A
M
I
GE
DF
C
B
KJ
L
H

STAA
R G
rade
s 3–
8
2021 TEXAS STUDENT ASSESSMENT PROGRAM INTERPRETING ASSESSMENT REPORTS 2.27
Summary ReportExample shown: STAAR Grade 3 Mathematics, STAAR Grade 4 Writing
The Summary Report is available for each grade assessed at each campus and district and contains aggregate information about every student for whom an answer document or online record was submitted.
Available: STAAR STAAR Spanish
Test results NOT included in the reporting-category-level and written composition constructed-response results of the reports: - STAAR with Embedded Supports paper administrations - Braille - American Sign Language video
A.
Campus or District Identification InformationThe top of the report contains identification information for the campus or district. The grade assessed, subject area, date of testing, and report date are also indicated. The program logo in the upper-left corner of the summary reports indicates the program (STAAR or STAAR Spanish).
B. Administration SummaryThis section of the report lists the number and percentage of students who were assessed, the number and percentage of students who were not assessed (broken down by students who were absent and other), and total number of documents submitted.
C. LegendTo maintain student confidentiality, no data are reported if fewer than five students were assessed. The legend indicates this by showing “---.”
D. Demographic Groups and Program InformationDemographic and program categories are listed on the left side of this section. Results for students for whom no demographic or program information was available are included in the “No Information Provided” categories.
E. Number of Students TestedThe number of students tested is provided for each program and demographic group.
F. Average Scale ScoreThe average scale score is displayed for each program and demographic group. Refer to Assessment Scores in the Program Overview for additional information about the STAAR scale scores.

STAA
R G
rade
s 3–
8
2021 TEXAS STUDENT ASSESSMENT PROGRAM INTERPRETING ASSESSMENT REPORTS 2.28
G.
Did Not Meet, Approaches, Meets, and Masters Grade LevelThe number and percentage of students who achieved the Did Not Meet, Approaches, Meets, and Masters Grade Level performance are displayed for each program and demographic group.
Masters Grade Level indicates that students demonstrate mastery of the course knowledge and skills. They are on-track to be successful in the next grade or course. Meets Grade Level indicates that students demonstrate strong knowledge of course content. They are prepared to progress to the next grade. Approaches Grade Level indicates that students demonstrate some knowledge of course content, but may be missing critical elements. They need additional support in the coming year. Did Not Meet Grade Level indicates that the students demonstrate no basic understanding of course expectations. They may need significant support in the coming year. Refer to Performance Standards in the Program Overview for additional information about these standards.
H. Results for Each Reporting CategoryThese columns summarize reporting-category-level data for all scored assessments. For each reporting category, the average number (#) and the percentage (%) of items students answered correctly are calculated. The average number of items correct is the total number of items correct divided by the total number of students assessed. The average percentage of items correct is the average total number of items correct divided by the total number of items assessed.
I. Written Composition SummaryThe STAAR writing assessments include essays with scores ranging from 0 to 8. The number of possible points for each essay item is 8 for grade 4 and 16 for grade 7. The average number of points in the first column should be interpreted as the average number of points scored for all scored assessments for each demographic group. The percentage scored in the second column should be interpreted as the average points scored converted to a percentage for each demographic group. Detailed rubric and score point information can be found in the scoring guides on TEA’s Student Assessment Division webpage.
J. Process NumberThe process number found in the bottom-right corner of the report is a unique number, per administration, that is assigned to the report by the testing contractor. Refer to this number if questions arise about the report.

STAA
R G
rade
s 3–
8
2021 TEXAS STUDENT ASSESSMENT PROGRAM INTERPRETING ASSESSMENT REPORTS 2.29
0531
21-9
9999
999-
9999
9999
9* R
esul
ts fo
r stu
dent
s w
ho to
ok th
e te
st w
ith th
e Br
aille
, Am
eric
an S
ign
Lang
uage
vid
eos
acco
mm
odat
ion,
or t
he p
aper
STA
AR w
ith e
mbe
dded
sup
ports
ar
e no
t inc
lude
d in
the
repo
rting
cat
egor
y re
sults
.
STA
TE O
F TE
XAS
ASS
ESSM
ENTS
OF
AC
AD
EMIC
REA
DIN
ESS
Sum
mar
y R
epor
tG
RA
DE
3 M
ATH
EMA
TIC
SD
ate
of T
estin
g:
Dis
tric
t:C
ampu
s:99
9-99
9 D
ISTR
ICT
NAM
ER
epor
t Dat
e:
999
CAM
PUS
NAM
EJU
NE
2021
SPR
ING
202
1
Lege
nd---
= N
o D
ata
Rep
orte
d Fo
r Few
er T
han
Five
Stu
dent
s
Adm
inis
trat
ion
Sum
mar
y
Num
ber
Perc
ent
Stud
ents
Tes
ted
Stud
ents
Not
Tes
ted
Oth
erTo
tal D
ocum
ents
Sub
mitt
ed
Abs
ent
111
97 11
22
114
100
Number ofStudents Tested
AverageScale Score
Did Not Meet
Approaches
Meets
Masters
#%
#%
#%
#%
Res
ults
for E
ach
Rep
ortin
g C
ateg
ory*
12
34
NumericalRepresentationsandRelationships
Computationsand Algebraic Relationships
Geometry and Measurement
Data Analysis and Personal FinancialLiteracy
Num
ber o
f Ite
ms
Test
ed8
137
4A
vg. #
of I
tem
s / %
Cor
rect
#%
#%
#%
#%
All
Stud
ents
111
1339
6054
5146
3128
2018
4.0
504.
736
4.0
571.
948
Mal
e72
1342
3853
3447
2028
1318
4.0
515.
240
4.4
642.
050
Fem
ale
3913
3422
5617
4411
287
183.
948
3.6
273.
044
1.8
44N
o In
form
atio
n Pr
ovid
ed0
------
------
------
------
------
------
------
------
---H
ispa
nic/
Latin
o22
1205
2091
29
15
15
4.3
541.
814
3.5
501.
435
Am
eric
an In
dian
or A
lask
a N
ativ
e15
1431
427
1173
853
213
5.9
744.
635
5.7
813.
075
Asi
an12
1623
18
1192
867
650
5.0
639.
372
6.6
943.
998
Bla
ck o
r Afr
ican
Am
eric
an11
1622
00
1110
08
737
643.
240
11.4
886.
897
1.6
40N
ativ
e H
awai
ian
or O
ther
Pac
ific
Isla
nder
1614
474
2512
754
252
135.
771
4.6
355.
274
2.8
70W
hite
1112
169
822
180
00
00.
810
2.6
200.
46
0.8
20Tw
o or
Mor
e R
aces
1510
3515
100
00
00
00
1.1
142.
217
0.7
100.
00
No
Info
rmat
ion
Prov
ided
912
547
782
222
222
223.
948
3.3
252.
536
1.0
25Ec
onom
ical
ly45
1527
511
4089
2351
1431
5.3
667.
155
6.3
903.
177
Dis
adva
ntag
ed20
1170
1995
15
00
00
3.5
441.
814
2.2
310.
820
4612
2936
7810
228
176
133.
239
3.8
292.
841
1.4
35Ti
tle I,
Par
t A35
1327
1440
2160
1029
26
5.5
693.
325
4.7
672.
563
2714
5114
5213
489
337
264.
657
6.9
535.
274
2.8
6949
1286
3265
1735
1224
1122
2.5
314.
232
2.7
390.
923
Mig
rant
2514
0210
4015
606
242
86.
581
5.1
396.
086
3.2
8017
1505
424
1376
953
529
5.8
734.
938
5.3
762.
973
6912
7646
6723
3316
2313
192.
734
4.6
353.
043
1.3
31Li
mite
d En
glis
h41
1282
2561
1639
717
37
4.6
583.
930
4.4
632.
254
Prof
icie
nt10
1380
330
770
440
00
5.2
651.
612
4.4
632.
050
515
400
05
100
360
120
3.6
4510
.480
7.0
100
4.0
100
513
604
801
201
201
203.
443
5.2
403.
449
1.6
4010
1215
880
220
00
00
0.8
102.
620
0.4
60.
820
1012
158
802
200
00
00.
810
2.6
200.
46
0.8
207
1683
114
686
571
571
6.4
808.
263
6.2
893.
895
3313
2919
5814
4211
3310
303.
240
4.6
353.
144
0.9
22B
iling
ual
3013
3515
5015
506
202
74.
961
4.9
384.
868
2.4
6022
1472
836
1464
1045
627
5.0
635.
038
4.7
672.
562
5912
9237
6322
3715
2512
203.
038
4.5
343.
347
1.4
35ES
L24
1379
1250
1250
938
729
4.6
586.
248
5.4
773.
075
3013
9514
4716
537
233
105.
771
5.1
395.
476
2.8
7057
1293
3460
2340
1526
1018
2.7
333.
829
2.6
370.
923
Spec
ial E
duca
tion
5213
9822
4230
5818
3510
196.
581
5.1
396.
086
3.2
8010
1423
440
660
330
330
5.8
734.
938
5.3
762.
973
4912
6034
6915
3110
207
142.
734
4.6
353.
043
1.3
31G
ifted
/Tal
ente
d25
1402
1040
1560
624
28
6.5
815.
139
6.0
863.
280
1715
054
2413
769
535
295.
873
4.9
385.
376
2.9
7369
1276
4667
2333
1623
1319
2.7
344.
635
3.0
431.
331
At-R
isk
2514
0210
4015
606
242
86.
581
5.1
396.
086
3.2
8017
1505
424
1376
953
529
5.8
734.
938
5.3
762.
973
6912
7646
6723
3316
2313
192.
734
4.6
353.
043
1.3
31
Yes
No
No
Info
rmat
ion
Prov
ided
Parti
cipa
nts
Non
parti
cipa
nts
No
Info
rmat
ion
Prov
ided Ye
sN
oN
o In
form
atio
n Pr
ovid
edC
urre
nt L
EPN
on-L
EP (M
onito
red
1st Y
ear)
Non
-LEP
(Mon
itore
d 2n
d Ye
ar)
Non
-LEP
(Mon
itore
d 3r
d Ye
ar)
Non
-LEP
(Mon
itore
d 4t
h Ye
ar)
Non
-LEP
(Pos
t Mon
itorin
g)O
ther
Non
-LEP
No
Info
rmat
ion
Prov
ided
Parti
cipa
nts
Non
parti
cipa
nts
No
Info
rmat
ion
Prov
ided
Parti
cipa
nts
Non
parti
cipa
nts
No
Info
rmat
ion
Prov
ided Ye
sN
oN
o In
form
atio
n Pr
ovid
edPa
rtici
pant
sN
onpa
rtici
pant
sN
o In
form
atio
n Pr
ovid
ed Yes
No
No
Info
rmat
ion
Prov
idedA
EF
C D
J
B
H
G

STAA
R G
rade
s 3–
8
2021 TEXAS STUDENT ASSESSMENT PROGRAM INTERPRETING ASSESSMENT REPORTS 2.30
0531
21-9
9999
999-
9999
9999
9* R
esul
ts fo
r stu
dent
s w
ho to
ok th
e te
st w
ith th
e Br
aille
, Am
eric
an S
ign
Lang
uage
vid
eos
acco
mm
odat
ion,
or t
he p
aper
STA
AR w
ith e
mbe
dded
sup
ports
ar
e no
t inc
lude
d in
the
repo
rting
cat
egor
y re
sults
.
STA
TE O
F TE
XAS
ASS
ESSM
ENTS
OF
AC
AD
EMIC
REA
DIN
ESS
Sum
mar
y R
epor
tG
RA
DE
4 W
RIT
ING
Dat
e of
Tes
ting:
D
istr
ict:
Cam
pus:
999-
999
DIS
TRIC
T N
AME
Rep
ort D
ate:
99
9 C
AMPU
S N
AME
JUN
E 20
21SP
RIN
G 2
021
Lege
nd---
= N
o D
ata
Rep
orte
d Fo
r Few
er T
han
Five
Stu
dent
s
Adm
inis
trat
ion
Sum
mar
y
Num
ber
Perc
ent
Stud
ents
Tes
ted
Stud
ents
Not
Tes
ted
Oth
erTo
tal D
ocum
ents
Sub
mitt
ed
Abs
ent
102
95 22
33
107
100
Number ofStudents Tested
AverageScale Score
Did Not Meet
Approaches
Meets
Masters
#%
#%
#%
#%
Res
ults
for E
ach
Rep
ortin
g C
ateg
ory*
12
3
Composition
Revision
Editing
Num
ber o
f Poi
nts
Poss
ible
Num
ber o
f Ite
ms
Test
ed8
816
Avg
. # o
f Poi
nts
/ % S
core
dA
vg. #
of I
tem
s / %
Cor
rect
#%
#%
#%
All
Stud
ents
102
3417
6362
3938
2827
1919
3.3
412.
126
7.7
48M
ale
6032
3140
6720
3312
207
123.
543
2.4
317.
346
Fem
ale
4236
8323
5519
4516
3812
292.
835
1.3
178.
654
No
Info
rmat
ion
Prov
ided
0---
------
------
------
------
------
------
------
His
pani
c/La
tino
2440
569
3815
6310
428
332.
937
2.9
369.
157
Am
eric
an In
dian
or A
lask
a N
ativ
e8
3126
338
563
563
225
7.8
982.
430
15.8
99A
sian
1030
306
604
403
303
301.
013
1.4
181.
811
Bla
ck o
r Afr
ican
Am
eric
an10
3468
990
110
110
110
1.6
201.
620
14.8
93N
ativ
e H
awai
ian
or O
ther
Pac
ific
Isla
nder
528
495
100
00
00
00
0.0
00.
00
0.0
0W
hite
1027
6610
100
00
00
00
0.0
01.
620
8.4
53Tw
o or
Mor
e R
aces
1432
4110
714
291
71
75.
366
1.0
131.
912
No
Info
rmat
ion
Prov
ided
2135
2111
5210
488
384
193.
746
2.8
353.
723
Econ
omic
ally
5432
0139
7215
2814
2610
193.
139
1.1
147.
849
Dis
adva
ntag
ed14
3999
214
1286
429
214
4.0
505.
063
12.0
7534
3521
2265
1235
1029
721
3.3
412.
632
6.5
41Ti
tle I,
Par
t A33
3797
1442
1958
1545
1030
3.9
491.
215
10.4
6519
2991
842
1158
421
00
3.4
422.
329
4.9
3150
3328
4182
918
918
918
3.0
372.
430
8.2
51M
igra
nt15
3546
747
853
427
320
2.0
252.
531
8.5
5319
3321
947
1053
1053
632
4.7
581.
317
8.8
5568
3416
4769
2131
1421
1015
3.3
412.
228
7.1
44Li
mite
d En
glis
h21
3600
1048
1152
733
629
2.9
372.
936
9.1
57Pr
ofic
ient
1046
070
010
100
1010
06
607.
898
2.4
3015
.899
626
965
831
170
00
02.
025
7.0
889.
056
1432
229
645
363
210
05.
569
0.0
00.
00
1028
6310
100
00
00
00
0.0
01.
620
8.4
5310
2863
1010
00
00
00
00.
00
1.6
208.
453
1240
405
427
586
505
420.
89
0.0
00.
00
2930
5124
835
172
72
73.
342
2.2
287.
446
Bili
ngua
l34
3637
2059
1441
926
721
1.8
222.
126
10.4
6523
3169
1357
1043
1043
626
4.9
620.
912
6.1
3845
3378
3067
1533
920
613
3.4
432.
936
6.6
41ES
L10
2749
660
440
330
330
2.9
362.
531
6.0
3819
3435
947
1053
632
421
4.7
582.
835
6.7
4273
3504
4866
2534
1926
1216
3.0
371.
822
8.6
54Sp
ecia
l Edu
catio
n57
3457
3358
2442
1526
1018
2.0
252.
531
8.5
539
2956
444
556
556
222
4.7
581.
317
8.8
5536
3470
2672
1028
822
719
3.3
412.
228
7.1
44G
ifted
/Tal
ente
d15
3546
747
853
427
320
2.0
252.
531
8.5
5319
3321
947
1053
1053
632
4.7
581.
317
8.8
5568
3416
4769
2131
1421
1015
3.3
412.
228
7.1
44A
t-Ris
k15
3546
747
853
427
320
2.0
252.
531
8.5
5319
3321
947
1053
1053
632
4.7
581.
317
8.8
5568
3416
4769
2131
1421
1015
3.3
412.
228
7.1
44
Yes
No
No
Info
rmat
ion
Prov
ided
Parti
cipa
nts
Non
parti
cipa
nts
No
Info
rmat
ion
Prov
ided Ye
sN
oN
o In
form
atio
n Pr
ovid
edC
urre
nt L
EPN
on-L
EP (M
onito
red
1st Y
ear)
Non
-LEP
(Mon
itore
d 2n
d Ye
ar)
Non
-LEP
(Mon
itore
d 3r
d Ye
ar)
Non
-LEP
(Mon
itore
d 4t
h Ye
ar)
Non
-LEP
(Pos
t Mon
itorin
g)O
ther
Non
-LEP
No
Info
rmat
ion
Prov
ided
Parti
cipa
nts
Non
parti
cipa
nts
No
Info
rmat
ion
Prov
ided
Parti
cipa
nts
Non
parti
cipa
nts
No
Info
rmat
ion
Prov
ided Ye
sN
oN
o In
form
atio
n Pr
ovid
edPa
rtici
pant
sN
onpa
rtici
pant
sN
o In
form
atio
n Pr
ovid
ed Yes
No
No
Info
rmat
ion
Prov
ided
A
I
EF
C D
J
B
H
G

STAA
R G
rade
s 3–
8
2021 TEXAS STUDENT ASSESSMENT PROGRAM INTERPRETING ASSESSMENT REPORTS 2.31
Constructed Responses Summary Report Example shown: STAAR Grade 4 Writing
The Constructed Responses Summary Report is provided for each district and campus and shows the number and percentage of students receiving each rating for the written composition.
Available: STAAR STAAR Spanish
Test results NOT included in the report: - STAAR with Embedded Supports paper administrations - Braille - American Sign Language video
A.
Campus or District Identification InformationThe top of the report contains identification information for the campus or district. The grade assessed, report date, and the date of testing are also indicated.
B. Written Composition Rating SummaryA breakdown of the number and the percentage of students who achieved each rating on each type of written composition is shown. Detailed rubric and score point information can be found in the scoring guides on TEA’s Student Assessment Division webpage.
Composition ratings are shown below.
0 = Nonscorable (0 out of possible 8 points)
2 = Very Limited (summed score: 2 out of possible 8 points)
3 = Between Very Limited and Basic (summed score: 3 out of possible 8 points)
4 = Basic (summed score: 4 out of possible 8 points)
5 = Between Basic and Satisfactory (summed score: 5 out of possible 8 points)
6 = Satisfactory (summed score: 6 out of possible 8 points)
7 = Between Satisfactory and Accomplished (summed score: 7 out of possible 8 points)
8 = Accomplished (summed score: 8 out of possible 8 points)

STAA
R G
rade
s 3–
8
2021 TEXAS STUDENT ASSESSMENT PROGRAM INTERPRETING ASSESSMENT REPORTS 2.32
C.
Number of PapersThe number of students receiving each rating is shown in the column with the heading “#.” The total number is shown at the bottom of this column.
The percentage of the total number of students receiving each composition rating (0, 2–8) is shown in the column with the heading “%.” The total percentage is shown at the bottom of this column. The percentage of the students on the “Total” row will always be 100.
D. GraphThe graph shows a visual representation of the percentage of students receiving each composition rating.
E. Process Number The process number found in the bottom-right corner of the report is a unique number, per administration, that is assigned to the report by the testing contractor. Refer to this number if questions arise about the report.

STAA
R G
rade
s 3–
8
2021 TEXAS STUDENT ASSESSMENT PROGRAM INTERPRETING ASSESSMENT REPORTS 2.33
Writ
ten
Com
posi
tion
Rat
ing
Sum
mar
y*---
= N
o D
ata
Rep
orte
d Fo
r Few
er T
han
Five
Stu
dent
s
Com
posi
tion
Rat
ing
#%
020
41
24
8
33
6
44
8
53
6
63
6
72
4
810
20
Tota
l49
100
PERCENT
The
writ
ten
com
posi
tion
has
been
sco
red
inde
pend
ently
by
two
read
ers.
The
ratin
g of
0-8
repr
esen
ts th
e su
mm
atio
n of
thes
e sc
ores
.
0531
21-9
9999
999-
9999
9999
9* R
esul
ts fo
r stu
dent
s w
ho to
ok th
e te
st w
ith th
e Br
aille
, Am
eric
an S
ign
Lang
uage
vid
eos
acco
mm
odat
ion,
or t
he p
aper
STA
AR w
ith e
mbe
dded
sup
ports
ar
e no
t inc
lude
d in
this
repo
rt.
STA
TE O
F TE
XAS
ASS
ESSM
ENTS
OF
AC
AD
EMIC
REA
DIN
ESS
Con
stru
cted
Res
pons
es S
umm
ary
Rep
ort
GR
AD
E4
WR
ITIN
GD
ate
of T
estin
g:
Dis
tric
t:SP
RIN
G 2
021
Cam
pus:
999-
999
DIS
TRIC
T N
AME
Rep
ort D
ate:
99
9 C
AMPU
S N
AME
JUN
E 20
21
A
C
B
D
E

STAA
R G
rade
s 3–
8
2021 TEXAS STUDENT ASSESSMENT PROGRAM INTERPRETING ASSESSMENT REPORTS 2.34
Combined Summary ReportExample shown: STAAR Grade 3 Reading
The Combined Summary Report is available for Grades 3–5 for each grade/subject area assessed at each campus or district and shows the number and percentage of students achieving the Approaches Grade Level performance for each program (STAAR and STAAR Spanish) and across both programs.
A.
Campus or District Identification InformationThe top of the report contains identification information for the campus or district. The grade and subject area, report date, and date of testing are also indicated.
B. LegendTo maintain student confidentiality, no data are reported if fewer than five students were assessed. The legend indicates this by showing “---.”
C. Demographic Groups and Program InformationDemographic and program categories are listed on the left side of this section. Results for students for whom no demographic or program information was available are included in the “No Information Provided” categories.
D. Program SummariesThese columns summarize program data for all scored assessments. For each program and across all programs, the average number (#) and the percentage (%) of students in each demographic group achieving the Approaches Grade Level performance is shown.
E. Number of Students TestedThe number of students tested in each program and across all programs is provided for each demographic group.
F. Approaches Grade Level PerformanceThese columns show the number and percentage of students who achieved the Approaches Grade Level performance.
G. Process NumberThe process number found in the bottom-right corner of the report is a unique number, per administration, that is assigned to the report by the testing contractor. Refer to this number if questions arise about the report.

STAA
R G
rade
s 3–
8
2021 TEXAS STUDENT ASSESSMENT PROGRAM INTERPRETING ASSESSMENT REPORTS 2.35
Lege
nd---
= N
o D
ata
Rep
orte
d Fo
r Few
er T
han
Five
Stu
dent
s
Approaches
STA
AR
#%
Number ofStudents Tested
%#
Approaches
STA
AR
Spa
nish
Number ofStudents Tested
Approaches
TOTA
L
#%
Number ofStudents Tested
All
Stud
ents
111
5146
7129
4118
280
44M
ale
7235
4945
1840
117
5345
Fem
ale
3916
4126
1142
6527
42N
o In
form
atio
n Pr
ovid
ed0
------
0---
---0
------
His
pani
c/La
tino
222
911
764
339
27A
mer
ican
Indi
an o
r Ala
ska
Nat
ive
1513
875
240
2015
75A
sian
1211
9211
00
2311
48B
lack
or A
fric
an A
mer
ican
1111
100
105
5021
1676
Nat
ive
Haw
aiia
n or
Oth
er P
acifi
c Is
land
er16
1275
102
2026
1454
Whi
te11
00
55
100
165
31Tw
o or
Mor
e R
aces
150
013
646
286
21N
o In
form
atio
n Pr
ovid
ed9
222
62
3315
427
Econ
omic
ally
4541
9136
719
8148
59D
isad
vant
aged
201
511
545
316
1946
920
2417
7170
2637
Title
I, P
art A
3523
6620
525
5528
5127
1348
214
1948
1735
4915
3130
2067
7935
44M
igra
nt25
1664
112
1836
1850
1714
8213
215
3016
5369
2130
4725
5311
646
40Li
mite
d En
glis
h41
1741
2411
4665
2843
Prof
icie
nt10
880
62
3316
1063
55
100
60
011
545
51
206
233
113
2710
00
66
100
166
3810
00
66
100
166
387
686
60
013
646
3314
4217
847
5022
44B
iling
ual
3016
5324
729
5423
4322
1568
184
2240
1948
5920
3429
1862
8838
43ES
L24
1250
155
3339
1744
3017
5718
422
4821
4457
2239
3820
5395
4244
Spec
ial E
duca
tion
5229
5611
218
6331
4910
770
132
1523
939
4915
3147
2553
9640
42G
ifted
/Tal
ente
d25
1664
112
1836
1850
1714
8213
215
3016
5369
2130
4725
5311
646
40A
t-Ris
k25
1664
112
1836
1850
1714
8213
215
3016
5369
2130
4725
5311
646
40
Yes
No
No
Info
rmat
ion
Prov
ided
Parti
cipa
nts
Non
parti
cipa
nts
No
Info
rmat
ion
Prov
ided Ye
sN
oN
o In
form
atio
n Pr
ovid
edC
urre
nt L
EPN
on-L
EP (M
onito
red
1st Y
ear)
Non
-LEP
(Mon
itore
d 2n
d Ye
ar)
Non
-LEP
(Mon
itore
d 3r
d Ye
ar)
Non
-LEP
(Mon
itore
d 4t
h Ye
ar)
Non
-LEP
(Pos
t Mon
itorin
g)O
ther
Non
-LEP
No
Info
rmat
ion
Prov
ided
Parti
cipa
nts
Non
parti
cipa
nts
No
Info
rmat
ion
Prov
ided
Parti
cipa
nts
Non
parti
cipa
nts
No
Info
rmat
ion
Prov
ided Ye
sN
oN
o In
form
atio
n Pr
ovid
edPa
rtici
pant
sN
onpa
rtici
pant
sN
o In
form
atio
n Pr
ovid
ed Yes
No
No
Info
rmat
ion
Prov
ided
STA
TE O
F TE
XAS
ASS
ESSM
ENTS
OF
AC
AD
EMIC
REA
DIN
ESS
Com
bine
d Su
mm
ary
Rep
ort
GR
AD
E3
REA
DIN
GD
ate
of T
estin
g:
Dis
tric
t:SP
RIN
G 2
021
999-
999
DIS
TRIC
T N
AME
Rep
ort D
ate:
JU
NE
2021
999
CAM
PUS
NAM
EC
ampu
s:
0531
21-9
9999
999-
9999
9999
9
A
DE
C
G
B
F

STAA
R G
rade
s 3–
8
2021 TEXAS STUDENT ASSESSMENT PROGRAM INTERPRETING ASSESSMENT REPORTS 2.36
Confidential Images of EssaysExample shown: STAAR Grade 4 Writing
The Confidential Images of Essays includes written compositions. Districts might find it helpful to use the Confidential Images of Essays in conjunction with the corresponding released STAAR tests.
Available: STAAR STAAR Spanish
A.
Assessment InformationThe program, grade level, type of composition, and season and year of the assessment scored is indicated.
B. Student Identification InformationThe top of the report contains identification information for the student. The student name, date-of-birth, and PEIMS identification are shown. For confidentiality, the student identification number (PEIMS) is indicated by five asterisks followed by the last four digits of the ID number.
C. Written Composition Score (Personal Narrative or Expository)Composition ratings are shown below.
0 = Nonscorable
2 = Very Limited
3 = Between Very Limited and Basic
4 = Basic
5 = Between Basic and Satisfactory
6 = Satisfactory
7 = Between Satisfactory and Accomplished
8 = Accomplished
EssayThe essay text from the answer document or online record is shown.

STAA
R G
rade
s 3–
8
2021 TEXAS STUDENT ASSESSMENT PROGRAM INTERPRETING ASSESSMENT REPORTS 2.37
MessagesIn place of the essay, a variety of report messages might appear, indicating the student’s performance status. Possible messages are listed below. Changes in policy might result in different messages.
•
Not Tested —Absent The student was absent during the test.
• Not Scored The student’s answer document or online record was coded “O” for reasons such as illness during testing or test administration irregularities, or if the student was assessed above grade level (e.g., a grade 7 student took a grade 8 assessment).
• No Info Available No information is available for this subject.
• Image is not Available for Paper STAAR with Embedded Supports Images are not available for students administered a STAAR with Embedded Supports paper assessment, online braille, and online American Sign Language.
Detailed rubric and score point information can be found in the scoring guides on TEA’s Student Assessment Division webpage.
D. Document Number and Process NumberThe document number found in the bottom-left corner of the report is a unique number, per administration, that is assigned to the student’s record by the testing contractor. Refer to this number if questions arise about the student’s results. The process number found in the bottom-right corner of the report is a unique number, per administration, that is assigned to the report by the testing contractor.

STAA
R G
rade
s 3–
8
2021 TEXAS STUDENT ASSESSMENT PROGRAM INTERPRETING ASSESSMENT REPORTS 2.38
STATE OF TEXAS ASSESSMENTS OF ACADEMIC READINESS SPANISHSPRING 2019
GRADE 4 WRITING - COMPOSITION
DOB:
PEIMS ID:
NAME: Written Composition Score: 7
47 = Between Satisfactory and Accomplished09/09/99
*****9999
LASTNAME, FIRSTNAME I.
True
0045960601514872_P1 090919-99999999-999999999Page 5 of 5
A
A
D
CB
SPRING 2021
090920-99999999-999999999

STAA
R G
rade
s 3–
8
2021 TEXAS STUDENT ASSESSMENT PROGRAM INTERPRETING ASSESSMENT REPORTS 2.39
Confidential Student Item Analysis ReportExample shown: STAAR Grade 4 Reading Mathematics and Writing
This report provides detailed student-level results for each subject tested. Indicated on this report is the reporting category measured by each test item, which answer choice the student selected for the item, and the correct answer. The information in this report might be useful to students, parents, and teachers for identifying item types students might find difficult and for exploring possible reasons why incorrect answer choices were made. Districts might find it helpful to use the Confidential Student Item Analysis Report in conjunction with the corresponding released STAAR tests.
Available: STAAR STAAR Spanish
A.
Student and School Identification InformationThe top of the report contains identification information, both for the student (name, identification number, etc.) and the school (district, campus, etc.). For confidentiality, the student identification number (PEIMS) is indicated by five asterisks followed by the last four digits of the ID number. The grade, date of testing, and the report date are also indicated.
B. Test ResultsThis section gives the student’s scale score and indicates the performance level the student achieved. Refer to Assessment Scores in the Program Overview for additional information about the STAAR scale scores. The raw score conversion tables for all STAAR administrations can be found on TEA’s Performance Reporting Department webpage. Refer to Performance Standards in the Program Overview for additional information about these standards.
Information about the assessment is provided whenever the student is assessed with something other than the general STAAR assessment. The information is indicated by characters in parenthesis next to the subject.
Possible messages are listed below. Changes in policy might result in different messages.
e Online with Embedded Supports An online assessment with embedded supports was indicated for this subject.
o Online with No Embedded Supports An online assessment with no embedded supports was indicated for this subject.
p e Paper with Embedded Supports A paper assessment with embedded supports was indicated for this subject.
C. Item NumberThe item number corresponds to the item number of the released test for that grade and subject area.

STAA
R G
rade
s 3–
8
2021 TEXAS STUDENT ASSESSMENT PROGRAM INTERPRETING ASSESSMENT REPORTS 2.40
D.
Reporting CategoryThe number of the reporting category measured by each test item is listed. An abbreviated listing of reporting categories can be found on the STAAR Report Card. The complete wording of each reporting category for every assessment is found on TEA’s Student Assessment Division webpage.
E. Correct AnswerThe correct answer choice for each test item is shown.
F. Student’s AnswerThe student’s answer choice is shown for each test item. A plus sign (+) in this column indicates that the student selected the correct answer. NR in this column indicates that the student did not answer. For items that are not multiple-choice items, the letter “A” represents the correct answer and the letter “B” represents an incorrect answer. Scores for essay questions are not included; student’s scores for these items are available on the STAAR Report Card.
G. MessagesIn place of item analysis data, a variety of report messages might appear. Possible messages are listed below. Changes in policy might result in different messages.
•
NOT SCORED The student’s answer document or online record was coded “O” for reasons such as illness during testing or test administration irregularities, or if the student was assessed above grade level (e.g., a grade 7 student took the grade 8 reading assessment).
• NOT TESTED—ABSENT The student was absent during the test.
• NO INFORMATION AVAILABLE No information is available for this subject.
H. Document Number and Process NumberThe document number found in the bottom-left corner of the report is a unique number, per administration, that is assigned to the student’s record by the testing contractor. Refer to this number if questions arise about the student’s results. The process number in the bottom-right corner of the report is a unique number, per administration, that is assigned to the report by the testing contractor.

STAA
R G
rade
s 3–
8
2021 TEXAS STUDENT ASSESSMENT PROGRAM INTERPRETING ASSESSMENT REPORTS 2.41
READINGScale Score:
Performance Level:
ItemReportingCategory
CorrectAnswer
Student'sAnswer
NO INFORMATION AVAILABLE
MATHEMATICS (o)Scale Score: 2040
Performance Level: Masters
ItemReportingCategory
CorrectAnswer
Student'sAnswer
1 . 1 A +2 . 2 H +3 . 1 B +4 . 4 F +5 . 2 C +6 . 3 F +7 .† 4 A +8 . 3 J +9 . 1 B +
10 . 2 J +11. 3 B +12 . 1 F +13 . 3 C +14 . 1 G +15 .† 3 A +16 . 2 H +17 . 1 D +18 . 2 G +19 . 3 D +20 . 2 F +21 . 3 C +22 . 2 J +23 . 4 B +24 . 2 J +25 . 3 A +26 .† 2 A +27 . 4 B +28 . 2 H +29 . 1 A +30 . 3 H +31 . 2 D +32 . 1 H +33 . 3 B +34 . 1 J +
WRITINGScale Score:
Performance Level:
ItemReportingCategory
CorrectAnswer
Student'sAnswer
NO INFORMATION AVAILABLE
STATE OF TEXAS ASSESSMENTS OF ACADEMIC READINESSConfidential Student Item Analysis Report
GRADE 4
Date of Birth: District: Report Date:Date of Testing:Student ID (PEIMS): Campus:
Local Student ID: Grade:
FIRSTNAME M. LASTNAME09/09/99*****9999---
999-999 DISTRICT NAME999 CAMPUS NAME
SUMMER 2021SPRING 20214
† = Item is not a multiple-choice item. For this item, the letter "A" represents the correct answer and "B" represents an incorrect answer.+ = student answered correctly NR = student did not answer o = Online with no Embedded SupportsAdditional information about this student’s performance and a listing of the reporting categories are found on the Confidential STAAR Report Card.
Document # 1000-70145
053121-99999999-999999999
F
G
D EC
B
A
H

STAA
R G
rade
s 3–
8
2021 TEXAS STUDENT ASSESSMENT PROGRAM INTERPRETING ASSESSMENT REPORTS 2.42
Item Analysis Summary ReportExample: STAAR Grade 4 Reading Mathematics and Writing
This report shows the item number, the reporting category measured by the item, and the percentage of students selecting each possible answer choice for that test item. This summary report is provided for all students. Districts might find it helpful to use the Item Analysis Summary Report in conjunction with the corresponding released STAAR tests. For STAAR grades 3–5, English and Spanish results are reported separately.
Available: STAAR STAAR Spanish
A.
Campus Identification InformationThe top of the report contains identification information for the campus. The grade assessed, report date, and date of testing are also indicated. The program logo in the upper-left corner of the summary report indicates the program.
B. Number of Students TestedThe number of students tested is provided.
C. Item NumberThe item number corresponds to the item number of the test for that grade and subject area.
D. Reporting CategoryThe number of the reporting category measured by each test item is listed. An abbreviated listing of reporting categories can be found on the Summary Report. The complete wording of each reporting category for every assessment is found on TEA’s Student Assessment Division webpage.
E. Percent RespondingThe percentage of students responding to each answer choice is shown for each test item. The correct answer is indicated by an asterisk. To maintain student confidentiality, no data are reported if fewer than five students were assessed.
F. Percent Not RespondingThe percentage of students who did not respond to this item is shown in the column with the double-asterisk heading. To maintain student confidentiality, no data are reported if fewer than five students were assessed.
G. Process NumberThe process number found in the bottom-right corner of the report is a unique number, per administration, that is assigned to the report by the testing contractor. Refer to this number if questions arise about the report.
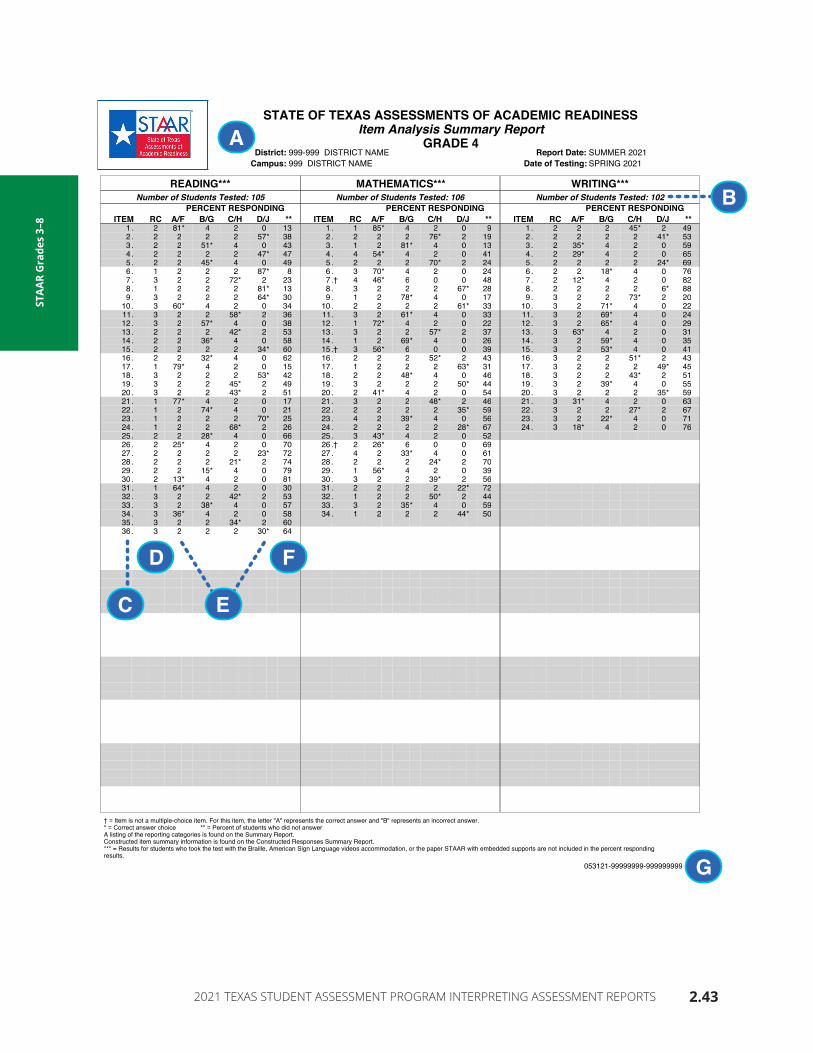
STAA
R G
rade
s 3–
8
2021 TEXAS STUDENT ASSESSMENT PROGRAM INTERPRETING ASSESSMENT REPORTS 2.43
† = Item is not a multiple-choice item. For this item, the letter "A" represents the correct answer and "B" represents an incorrect answer.* = Correct answer choice ** = Percent of students who did not answerA listing of the reporting categories is found on the Summary Report.Constructed item summary information is found on the Constructed Responses Summary Report.*** = Results for students who took the test with the Braille, American Sign Language videos accommodation, or the paper STAAR with embedded supports are not included in the percent responding results.
053121-99999999-999999999
STATE OF TEXAS ASSESSMENTS OF ACADEMIC READINESS Item Analysis Summary Report
GRADE 4999 DISTRICT NAME
District: Report Date: Date of Testing:
SUMMER 2021SPRING 2021Campus:
999-999 DISTRICT NAME
READING***Number of Students Tested: 105
PERCENT RESPONDINGITEM RC A/F B/G C/H D/J **
1 . 2 81* 4 2 0 132 . 2 2 2 2 57* 383 . 2 2 51* 4 0 434 . 2 2 2 2 47* 475 . 2 2 45* 4 0 496 . 1 2 2 2 87* 87 . 3 2 2 72* 2 238 . 1 2 2 2 81* 139 . 3 2 2 2 64* 30
10 . 3 60* 4 2 0 3411. 3 2 2 58* 2 3612 . 3 2 57* 4 0 3813 . 2 2 2 42* 2 5314 . 2 2 36* 4 0 5815 . 2 2 2 2 34* 6016 . 2 2 32* 4 0 6217 . 1 79* 4 2 0 1518 . 3 2 2 2 53* 4219 . 3 2 2 45* 2 4920 . 3 2 2 43* 2 5121 . 1 77* 4 2 0 1722 . 1 2 74* 4 0 2123 . 1 2 2 2 70* 2524 . 1 2 2 68* 2 2625 . 2 2 28* 4 0 6626 . 2 25* 4 2 0 7027 . 2 2 2 2 23* 7228 . 2 2 2 21* 2 7429 . 2 2 15* 4 0 7930 . 2 13* 4 2 0 8131 . 1 64* 4 2 0 3032 . 3 2 2 42* 2 5333 . 3 2 38* 4 0 5734 . 3 36* 4 2 0 5835 . 3 2 2 34* 2 6036 . 3 2 2 2 30* 64
MATHEMATICS***Number of Students Tested: 106
PERCENT RESPONDINGITEM RC A/F B/G C/H D/J **
1 . 1 85* 4 2 0 92 . 2 2 2 76* 2 193 . 1 2 81* 4 0 134 . 4 54* 4 2 0 415 . 2 2 2 70* 2 246 . 3 70* 4 2 0 247 .† 4 46* 6 0 0 488 . 3 2 2 2 67* 289 . 1 2 78* 4 0 17
10 . 2 2 2 2 61* 3311. 3 2 61* 4 0 3312 . 1 72* 4 2 0 2213 . 3 2 2 57* 2 3714 . 1 2 69* 4 0 2615 .† 3 56* 6 0 0 3916 . 2 2 2 52* 2 4317 . 1 2 2 2 63* 3118 . 2 2 48* 4 0 4619 . 3 2 2 2 50* 4420 . 2 41* 4 2 0 5421 . 3 2 2 48* 2 4622 . 2 2 2 2 35* 5923 . 4 2 39* 4 0 5624 . 2 2 2 2 28* 6725 . 3 43* 4 2 0 5226 .† 2 26* 6 0 0 6927 . 4 2 33* 4 0 6128 . 2 2 2 24* 2 7029 . 1 56* 4 2 0 3930 . 3 2 2 39* 2 5631 . 2 2 2 2 22* 7232 . 1 2 2 50* 2 4433 . 3 2 35* 4 0 5934 . 1 2 2 2 44* 50
WRITING***Number of Students Tested: 102
PERCENT RESPONDINGITEM RC A/F B/G C/H D/J **
1 . 2 2 2 45* 2 492 . 2 2 2 2 41* 533 . 2 35* 4 2 0 594 . 2 29* 4 2 0 655 . 2 2 2 2 24* 696 . 2 2 18* 4 0 767 . 2 12* 4 2 0 828 . 2 2 2 2 6* 889 . 3 2 2 73* 2 20
10 . 3 2 71* 4 0 2211. 3 2 69* 4 0 2412 . 3 2 65* 4 0 2913 . 3 63* 4 2 0 3114 . 3 2 59* 4 0 3515 . 3 2 53* 4 0 4116 . 3 2 2 51* 2 4317 . 3 2 2 2 49* 4518 . 3 2 2 43* 2 5119 . 3 2 39* 4 0 5520 . 3 2 2 2 35* 5921 . 3 31* 4 2 0 6322 . 3 2 2 27* 2 6723 . 3 2 22* 4 0 7124 . 3 18* 4 2 0 76
F
A
G
B
D
EC

STAA
R G
rade
s 3–
8
2021 TEXAS STUDENT ASSESSMENT PROGRAM INTERPRETING ASSESSMENT REPORTS 2.44
Electronic Individual Student Record File (Confidential)
The Electronic Individual Student Record File contains individual data records for each student for whom an answer document or online record was submitted. The student record includes identification and demographic data as well as assessment scores. Reporting-category-level data are also included.

STAA
R G
rade
s 3–
8
2021 TEXAS STUDENT ASSESSMENT PROGRAM INTERPRETING ASSESSMENT REPORTS 2.45
Additional ReportsAssessment reports may be requested for rerun. There is a fee for rerun requests that result from a district error, such as a misgridded answer document. There will be NO charge for rerun requests resulting from a contractor error, such as nonreceipt of reports. The following reports are available for rerun:
•
STAAR Report Card
• Confidential Student Label
• Confidential Campus Roster—All Students
• Confidential Campus Roster—Students Not Achieving Approaches Grade Level
Additional printed copies of student reports are available for download and printing from the Assessment Management System after scoring is complete. Districts can request the following additional printed copies be sent to them for a fee:
•
STAAR Report Card (Primary Administration Only)
• Confidential Student Label
• Confidential Campus Roster—All Students
• Confidential Campus Roster—Students Not Achieving Approaches Grade Level
• Campus and District Summary Reports