st. lucia: statistical appendix - imf.org · international monetary fund st. lucia statistical...
TRANSCRIPT

© 2008 International Monetary Fund October 2008
IMF Country Report No. 08/330
St. Lucia: Statistical Appendix
This Statistical Appendix for St. Lucia was prepared by a staff team of the International Monetary Fund as background documentation for the periodic consultation with the member country. It is based on the information available at the time it was completed on July 10, 2008. The views expressed in this document are those of the staff team and do not necessarily reflect the views of the Government of St. Lucia or the Executive Board of the IMF. The policy of publication of staff reports and other documents by the IMF allows for the deletion of market-sensitive information.
Copies of this report are available to the public from
International Monetary Fund ● Publication Services 700 19th Street, N.W. ● Washington, D.C. 20431
Telephone: (202) 623-7430 ● Telefax: (202) 623-7201 E-mail: [email protected] ● Internet: http://www.imf.org
Price: $18.00 a copy
International Monetary Fund
Washington, D.C.


INTERNATIONAL MONETARY FUND
ST. LUCIA
Statistical Appendix
Prepared by a staff team consisting of Paul Cashin, Koffie Nassar, and Yan Sun (all WHD)
Approved by Western Hemisphere Department
July 10, 2008
Contents Page
Basic Data .....................................................................................................................................2 Tables 1. GDP by Economic Activity at Constant Factor Cost ............................................................4 2. GDP by Economic Activity at Current Factor Cost ..............................................................5 3. Expenditure on GDP at Current Prices..................................................................................6 4. Saving and Investment ..........................................................................................................7 5. Selected Data on the Banana Industry...................................................................................8 6. Selected Industrial Production...............................................................................................9 7. Consumer Price Index .........................................................................................................10 8. Operations of the Central Government ...............................................................................11 9. Operations of the Central Government (in percent of GDP)...............................................12 10. Monetary Survey .................................................................................................................13 11. Summary Operations of the Eastern Caribbean Central Bank ............................................14 12. Consolidated Accounts of the Commercial Banks..............................................................15 13. Distribution of Commercial Bank Loans and Advances.....................................................16 14. Summary Balance of Payments...........................................................................................17 15. Value, Volume, and Unit Value of Major Exports..............................................................18 16. Merchandise Imports by SITC Category.............................................................................19 17. Imports and Prices of Petroleum Products ..........................................................................20 18. Merchandise Trade Volumes, Unit Values and Terms of Trade.........................................21 19. Direction of Trade ...............................................................................................................22 20. Selected Tourism Statistics .................................................................................................23 21. Stayover Tourist Arrivals by Country of Origin .................................................................24 22. Structure of Public Debt ......................................................................................................25 23. Structure of Public Debt (in percent of GDP) .....................................................................26 24. Effective Exchange Rate Indices.........................................................................................27

2
Area (sq. km.) 616 Health (2005)Arable land (percent of land area) 4.9 Life expectancy at birth (males) 74.0
Hospital beds (per 10,000 population) 28.0Population (2007)
Total (thousands) 171.2 Access to safe water (2004)Annual rate of growth 1.4 Percent of population
(percent a year) Urban 98.0Density (per sq. km.) 317.6 Rural 98.0GDP per capita (US$), 2007 5,606
Education (2006)Population characteristics (2007) Enrollment percentage
Infant mortality (per thousand live births) 23.5 Primary 98.6Secondary 75.8
Distribution of labor force (in percent, 2006)Agriculture 14.5 Gross domestic product GDP (2007)Industry and mining 22.0 (in millions of EC$) 2,592Services 63.5 (in millions of US$) 960
Prel.2003 2004 2005 2006 2007
Origin of GDP Agriculture and mining 5.4 5.5 4.2 4.1 4.2Manufacturing, construction and utilities 17.3 17.7 19.0 20.0 18.9Services 77.3 76.9 76.8 75.9 77.0
National accounts and pricesReal GDP 3.5 3.8 4.4 4.9 1.7Real GDP per capita 2.6 2.6 2.9 3.6 0.7GDP deflator 1.3 2.5 3.1 2.3 0.5Consumer price index (period average) 1.0 1.5 3.9 3.6 2.8Consumer price index (end of period) 0.5 3.5 5.2 0.7 6.8Unemployment rate (in percent) 22.3 21.0 18.7 16.6 14.0
Public finances 1/ Central government
Total revenue 2/ 26.2 25.5 25.6 26.9 28.2Total expenditure 29.8 29.2 31.6 32.8 30.9Of which
Interest 2.8 3.0 3.0 3.3 3.5Savings 1.8 3.8 4.0 4.9 5.9Primary balance 3/ -0.8 -0.7 -3.0 -2.6 0.8Overall balance 3/ -3.6 -3.8 -6.0 -5.9 -2.7
Central government debt 56.4 61.9 63.7 63.5 64.0
Money and credit 4/Liabilities to private sector 7.6 10.1 13.4 20.1 6.2
Of whichMoney 4.4 10.1 4.4 0.8 3.8Quasi money 3.3 0.0 9.1 19.3 2.4
Net domestic assets of the banking system -10.1 11.3 27.9 19.1 14.2Of which
Credit to the public sector (net) -2.8 -2.5 3.2 1.7 1.0Credit to the private sector -4.3 11.1 17.7 27.4 34.2
Liabilities to private sector, in percent of GDP 63.3 65.2 67.6 76.6 79.3
II. Economic Indicators, 2003–07
I. Social and Demographic Indicators
St. Lucia: Basic Data
(In percent of GDP)
(Annual percentage changes, unless otherwise indicated)
(12-month percentage changes, unless otherwise indicated)
(Ratios to GDP)

3
Prel.2003 2004 2005 2006 2007
Balance of paymentsCurrent account -110.3 -87.5 -150.1 -277.4 -279.6
Trade balance (goods) -245.7 -251.8 -329.3 -403.6 -405.9Exports, f.o.b. 109.3 96.2 88.8 117.4 135.9Imports, f.o.b. -355.1 -348.0 -418.1 -521.0 -541.8
Services and transfers (net) 135.4 164.3 179.2 126.2 126.3Of which
Tourism receipts 282.1 325.7 356.0 287.5 299.4Interest (public sector) 17.0 18.0 17.2 19.7 23.0
Capital and financial account 5/ 145.9 101.0 139.7 321.8 303.5Capital transfers 17.1 3.5 5.3 11.4 5.8Official borrowing (net) 72.4 24.4 43.2 21.7 -8.4Private capital 5/ 56.4 73.2 91.1 288.7 306.1
Change in net international reserves (increase -) 6/ -12.8 -25.5 16.0 -18.0 -19.0
Exports (in percent of GDP) 14.6 12.0 10.1 12.6 14.2Imports (in percent of GDP) -47.5 -43.4 -47.6 -55.8 -56.4Current account (in percent of GDP) -14.7 -10.9 -17.1 -29.7 -29.1Goods exports (in US$, annual percentage change) 57.7 -12.0 -7.7 32.2 15.8Goods imports (in US$, annual percentage change) 30.6 -2.0 20.1 24.6 4.0Terms of trade (annual percentage change) 7/ -9.8 -13.8 -6.0 -7.2 -10.0Real effective exchange rate (12-month percentage
change) -4.9 -4.6 -0.5 0.1 -3.9
International reserve position and external debtGross official reserves of the ECCB 539.9 632.4 600.8 696.0 764.1Net official reserves (central bank, imputed) 104.7 130.2 114.2 132.2 151.2Net reserves of the banking system 19.5 -12.2 -77.2 -88.6 -168.9Outstanding external debt, in percent of GDP 45.6 46.1 47.4 44.8 46.0 Public 8/ 45.6 46.1 47.4 44.8 46.0 Private ... ... ... ... ...
IMF data (as of June 30, 2008)Membership status: Article VIIIIntervention currency and rate U.S. dollar at EC$2.70 per U.S. dollarQuota SDR 15.3 millionFund holdings of Eastern Caribbean dollars SDR 15.29 million (As percent of quota) 99.97 percentOutstanding purchases and loans NoneSDR department Net cumulative allocation SDR 0.74 million Holdings SDR 1.57 million
Sources: St. Lucia authorities; World Development Indicators; and Fund staff estimates.
1/ Data for fiscal years beginning April.2/ Including grants. 3/ After grants.4/ Change as a percentage of liabilities to the private sector at the beginning of the period.5/ Includes errors and omissions.6/ Imputed reserves at the ECCB.7/ Excluding tourism.8/ Total public and publicly guaranteed debt.
(In millions of U.S. dollars, unless otherwise indicated)
St. Lucia: Basic Data

4
Prel.2002 2003 2004 2005 2006 2007
Gross domestic product 1,188.5 1,230.5 1,277.0 1,333.1 1,398.9 1,422.5Primary sector 73.2 62.6 60.8 47.0 52.1 53.3Agriculture 67.3 56.7 55.1 41.5 45.5 45.9 Bananas 35.8 22.8 26.8 16.8 18.8 18.1 Other crops 13.5 14.3 11.3 8.2 8.9 9.6 Livestock 6.9 6.6 6.8 6.9 6.3 6.4 Fishing 10.0 11.9 9.1 8.5 10.5 10.8 Forestry 1.2 1.2 1.1 1.1 1.1 1.0Mining and quarrying 5.8 5.8 5.7 5.5 6.6 7.5
Secondary sector 225.7 231.4 231.4 246.2 261.2 256.5Manufacturing 69.2 72.2 70.1 81.5 87.0 88.4Construction 94.2 95.7 96.7 108.8 123.2 110.5Electricity, gas, and water 62.3 63.4 64.6 56.0 51.1 57.6
Services 995.2 1,043.6 1,095.3 1,169.3 1,231.7 1,274.9Wholesale and retail trade 126.4 136.2 147.7 156.3 170.4 178.2Hotels and restaurants 138.4 161.4 170.9 181.7 176.7 163.6Transport and communications 250.3 261.4 274.9 293.7 304.8 314.1Banking and insurance 129.3 131.9 137.7 150.9 183.2 200.5Real estate and housing 149.6 154.6 159.7 168.8 173.2 186.4Government services 147.0 143.9 149.8 162.3 165.7 172.1Other services 54.3 54.3 54.6 55.6 57.8 60.1
Less imputed banking charges -108.2 -110.0 -115.2 -123.7 -150.7 -149.7
Gross domestic product 0.6 3.5 3.8 4.4 4.9 1.7Primary sector 4.2 -14.5 -2.8 -22.8 10.9 2.3Agriculture 4.4 -15.7 -2.9 -24.7 9.8 0.8 Bananas 59.8 -36.3 17.7 -37.2 11.4 -3.4 Other crops -34.1 5.7 -20.8 -27.9 9.7 7.6 Livestock -4.7 -3.2 2.0 2.2 -9.7 1.8 Fishing -24.2 18.6 -23.4 -6.8 24.1 2.3 Forestry -2.4 -3.3 -3.4 -3.6 -2.8 -3.8Mining and quarrying 1.9 0.2 -1.9 -3.9 19.8 13.1
Secondary sector -1.2 2.5 0.0 6.4 6.1 -1.8Manufacturing 5.5 4.4 -3.0 16.3 6.7 1.7Construction -4.8 1.6 1.0 12.5 13.2 -10.3Electricity, gas, and water -2.5 1.9 1.9 -13.4 -8.7 12.7
Services 0.9 4.9 4.9 6.8 5.3 3.5Wholesale and retail trade 1.2 7.8 8.4 5.8 9.0 4.6Hotels and restaurants -0.6 16.6 5.9 6.3 -2.7 -7.4Transport and communications 1.7 4.4 5.2 6.8 3.8 3.1Banking and insurance 1.2 2.0 4.5 9.6 21.4 9.4Real estate and housing 2.4 3.3 3.3 5.7 2.6 7.6Government services -1.6 -2.1 4.1 8.4 2.1 3.8Other services 1.8 0.0 0.6 1.9 3.9 4.0
Less imputed banking charges 1.9 1.5 5.0 10.2 18.0 11.0
Sources: Statistics Department of the Ministry of Finance; and Fund staff estimates.
Table 1. St. Lucia: GDP by Economic Activity at Constant Factor Cost
( In millions of 1990 Eastern Caribbean dollars )
(Annual percentage change)

5
Prel.2002 2003 2004 2005 2006 2007
Gross domestic product 1,601.3 1,680.2 1,787.5 1,924.3 2,066.2 2,111.4Primary sector 100.2 91.0 97.7 80.6 85.2 88.3Agriculture 94.2 85.0 91.8 75.0 78.4 80.5 Bananas 40.5 32.3 40.6 27.2 30.6 30.0 Other crops 18.6 22.4 20.6 17.3 14.0 16.0 Livestock 12.3 9.5 9.7 11.1 10.1 10.2 Fishing 21.6 19.6 19.7 18.3 22.7 23.2 Forestry 1.2 1.1 1.1 1.1 1.0 1.1Mining and quarrying 6.0 6.0 5.9 5.7 6.8 7.7
Secondary sector 279.3 290.8 315.6 365.4 412.7 398.1Manufacturing 78.7 87.6 96.8 116.6 129.1 137.4Construction 118.4 114.0 119.0 150.8 187.5 169.2Electricity, gas, and water 82.2 89.2 99.8 98.0 96.1 91.5
Services 1,348.6 1,433.6 1,519.2 1,637.3 1,745.9 1,812.7Wholesale and retail trade 178.4 195.2 215.3 239.6 268.1 294.4Hotels and restaurants 199.6 235.2 252.6 279.1 281.2 267.6Transport and communications 326.2 341.6 358.8 383.9 398.4 415.2Banking and insurance 160.5 169.6 178.9 194.6 217.9 230.3Real estate and housing 156.3 161.8 167.4 172.3 188.8 215.7Government services 247.3 248.1 261.2 282.1 302.4 297.9Other services 80.3 82.1 85.0 85.7 89.2 91.6
Less imputed banking charges 126.8 135.3 144.9 159.0 177.6 187.7
Gross domestic product 100.0 100.0 100.0 100.0 100.0 100.0
Primary sector 6.3 5.4 5.5 4.2 4.1 4.2Agriculture 5.9 5.1 5.1 3.9 3.8 3.8 Bananas 2.5 1.9 2.3 1.4 1.5 1.4 Other crops 1.2 1.3 1.2 0.9 0.7 0.8 Livestock 0.8 0.6 0.5 0.6 0.5 0.5 Fishing 1.4 1.2 1.1 1.0 1.1 1.1 Forestry 0.1 0.1 0.1 0.1 0.0 0.1Mining and quarrying 0.4 0.4 0.3 0.3 0.3 0.4
Secondary sector 17.4 17.3 17.7 19.0 20.0 18.9Manufacturing 4.9 5.2 5.4 6.1 6.2 6.5Construction 7.4 6.8 6.7 7.8 9.1 8.0Electricity, gas, and water 5.1 5.3 5.6 5.1 4.6 4.3
Services 84.2 85.3 85.0 85.1 84.5 85.9Wholesale and retail trade 11.1 11.6 12.0 12.5 13.0 13.9Hotels and restaurants 12.5 14.0 14.1 14.5 13.6 12.7Transport and communications 20.4 20.3 20.1 19.9 19.3 19.7Banking and insurance 10.0 10.1 10.0 10.1 10.5 10.9Real estate and housing 9.8 9.6 9.4 9.0 9.1 10.2Government services 15.4 14.8 14.6 14.7 14.6 14.1Other services 5.0 4.9 4.8 4.5 4.3 4.3
Less imputed banking charges 7.9 8.1 8.1 8.3 8.6 8.9
Sources: Statistics Department of the Ministry of Finance; and Fund staff estimates.
Table 2. St. Lucia: GDP by Economic Activity at Current Factor Cost
( In millions of current Eastern Caribbean dollars )
(In percent of GDP)

6
Prel.2002 2003 2004 2005 2006 2007
Consumption 1,708.3 1,806.2 1,798.8 2,067.5 2,249.3 2,283.6Public sector 1/ 381.6 400.0 409.7 431.1 458.2 483.8Private sector 1,326.7 1,406.2 1,389.2 1,636.4 1,791.2 1,799.8
Gross domestic investment 415.9 408.4 451.8 551.2 906.2 933.0Public sector 1/ 175.9 156.6 154.9 220.4 269.6 246.8Private sector 240.0 251.8 296.9 330.8 636.6 686.3
Gross domestic expenditure 2,124.2 2,214.6 2,250.6 2,618.7 3,155.5 3,216.6
Balance of goods and nonfactor services -220.7 -195.3 -87.6 -244.6 -635.7 -624.9Exports of goods and nonfactor services 861.9 1,154.7 1,250.9 1,347.9 1,226.9 1,314.6Imports of goods and nonfactor services 1,082.6 1,350.0 1,338.5 1,592.5 1,862.6 1,939.5
GDP at market prices 1,903.5 2,019.3 2,163.0 2,374.1 2,519.8 2,591.7
Net indirect taxes 302.2 339.1 375.5 449.8 453.6 480.3
GDP at factor cost 1,601.3 1,680.2 1,787.5 1,924.3 2,066.2 2,111.4
Net factor income -98.1 -137.3 -186.3 -195.8 -145.7 -162.4
GNP at market prices 1,805.4 1,882.0 1,976.8 2,178.4 2,374.1 2,429.3
Consumption 89.7 89.4 83.2 87.1 89.3 90.6Public sector 1/ 20.0 19.8 18.9 18.2 18.2 19.2Private sector 69.7 69.6 64.2 68.9 71.1 71.4Gross domestic investment 21.8 20.2 20.9 23.2 36.0 36.0Public sector 1/ 9.2 7.8 7.2 9.3 10.7 9.5Private sector 12.6 12.5 13.7 13.9 25.3 26.5Gross domestic expenditure 111.6 109.7 104.0 110.3 125.2 124.1Balance of goods and nonfactor services -11.6 -9.7 -4.0 -10.3 -25.2 -24.1Exports of goods and nonfactor services 45.3 57.2 57.8 56.8 48.7 50.7Imports of goods and nonfactor services 56.9 66.9 61.9 67.1 73.9 74.8GDP at market price 100.0 100.0 100.0 100.0 100.0 100.0
Net indirect taxes 15.9 16.8 17.4 18.9 18.0 18.5GDP at factor cost 84.1 83.2 82.6 81.1 82.0 81.5
Memorandum item:GDP at market price (Annual percentage change) 2.9 6.1 7.1 9.8 6.1 2.9
Sources: Statistics Department of the Ministry of Finance; and Fund staff estimates.
1/ The figure covers only the central government.
Table 3. St. Lucia: Expenditure on GDP at Current Prices
(In millions of Eastern Caribbean dollars)
(In percent of GDP at market price)

7
Prel.2002 2003 2004 2005 2006 2007
Gross national saving 129.7 110.6 215.5 145.9 157.1 178.2Public 1/ 36.2 83.3 71.4 74.6 120.6 176.0Private 93.5 27.2 144.1 71.2 36.5 2.2
External saving 286.1 297.8 236.3 405.4 749.1 754.8
Total saving 415.9 408.4 451.8 551.2 906.2 933.0
Gross domestic investment 415.9 408.4 451.8 551.2 906.2 933.0Public sector 1/ 175.9 156.6 154.9 220.4 269.6 246.8Private sector 240.0 251.8 296.9 330.8 636.6 686.3
Gross national saving 6.8 5.5 10.0 6.1 6.2 6.9Public 1/ 1.9 4.1 3.3 3.1 4.8 6.8Private 4.9 1.3 6.7 3.0 1.4 0.1
External saving 15.0 14.7 10.9 17.1 29.7 29.1
Total saving 21.8 20.2 20.9 23.2 36.0 36.0
Gross domestic investment 21.8 20.2 20.9 23.2 36.0 36.0Public sector 1/ 9.2 7.8 7.2 9.3 10.7 9.5Private sector 12.6 12.5 13.7 13.9 25.3 26.5
Sources: Statistics Department of the Ministry of Finance; and Fund staff estimates.
1/ This figure covers the central government only.
(In percent of GDP)
Table 4. St. Lucia: Saving and Investment
(In millions of Eastern Caribbean dollars)

8
2002 2003 2004 2005 2006 2007
Banana production (000 tons) 48.2 34.0 42.3 30.0 34.0 30.3Banana exports (000 tons) 48.2 34.0 42.3 30.0 34.0 30.3
Banana export receipts (In millions of EC$) 58.6 43.6 54.3 41.5 48.1 43.7
Export unit price (In US$/000 tons) 451.6 475.0 471.1 512.0 523.9 533.2
Memorandum items:Banana exports/GDP 3.1 2.2 2.5 1.7 1.9 1.7Banana exports/merchandise exports 31.3 14.8 20.9 17.3 15.2 11.9Banana exports/exports of goods and nonfactor services 6.8 3.8 4.3 3.1 3.9 2.3
Sources: Windward Islands Banana Development and Export Company (WIBDECO); and Fund staff estimates.
Table 5. St. Lucia: Selected Data on the Banana Industry
(In percent)

9
Prel.2002 2003 2004 2005 2006 2007
CopraValue 1,138 1,365 1,103 820 967 792Tons 1,270 1,535 1,094 714 776 644
Unrefined coconut oilValue 734 576 1,434 1,215 1,135 999Liters (000's) 264 205 517 400 439 360
Refined coconut oilValue 2,040 2,553 2,170 965 1,119 1,595Liters (000's) 572 731 609 271 356 447
Coconut mealValue 145 189 130 91 100 89Kgs. (000's) 330 429 649 453 499 390
Food, beverages, and tobaccoValue 60,053 64,261 69,099 78,015 82,475 81,005
Paper products and cardboard boxesValue 21,206 20,040 20,661 19,713 21,560 21,253Quantity (000's) 14,069 10,260 10,742 9,763 11,352 10,341
Electrical productsValue 25,369 18,477 24,529 28,279 28,083 31,489Quantity (000's) 20,822 13,942 14,655 11,890 10,916 10,798
Wearing apparelValue 1,465 1,011 1,039 886 787 839Doz. Pcs. (000's) 17 12 16 15 18 14
Source: Statistics Department of the Ministry of Finance.
Table 6. St. Lucia: Selected Industrial Production
(Values in thousands of Eastern Caribbean dollars; quantity as indicated)

10
2002 2003 2004 2005 2006 2007
All items 175.6 177.5 180.1 187.1 193.8 199.2Food 173.4 177.0 178.5 191.1 199.9 209.5Beverages and tobacco 157.0 159.2 159.4 161.8 176.1 182.8Clothing and footwear 237.0 237.0 248.9 248.9 248.9 248.9Housing 137.2 137.2 137.2 137.2 137.4 137.6Fuel and light 131.7 135.6 140.4 151.2 158.9 165.0Furniture, household equipment 185.2 184.1 191.9 191.9 195.0 196.9Health care 239.8 236.1 248.7 249.4 264.0 261.1Transport and communication 184.2 184.5 182.5 188.0 195.4 198.7Recreation and education 299.4 298.5 301.6 304.3 308.0 309.7Miscellaneous goods and services 154.4 153.9 157.0 158.4 167.3 169.1
All items -0.3 1.0 1.5 3.9 3.6 2.8Food -1.2 2.1 0.8 7.1 4.6 4.8Beverages and tobacco 2.6 1.4 0.1 1.5 8.8 3.8Clothing and footwear 0.0 0.0 5.0 0.0 0.0 0.0Housing -0.1 0.0 0.0 0.0 0.1 0.2Fuel and light -1.6 3.0 3.5 7.7 5.1 3.8Furniture, household equipment -1.2 -0.6 4.2 0.0 1.6 1.0Health care 6.5 -1.5 5.3 0.3 5.8 -1.1Transport and communication 3.6 0.2 -1.1 3.0 3.9 1.7Recreation and education -0.1 -0.3 1.0 0.9 1.2 0.5Miscellaneous goods and services 0.7 -0.3 2.0 0.9 5.6 1.1
All items 176.3 177.2 183.4 192.9 194.2 207.4Food 174.0 177.1 184.6 201.9 200.4 224.8Beverages and tobacco 158.9 159.2 160.6 161.8 176.1 183.7Clothing and footwear 237.0 237.0 248.9 248.9 248.9 248.9Housing 137.3 137.2 137.2 137.3 137.5 137.6Fuel and light 134.1 135.0 145.0 153.8 155.5 180.4Furniture, household equipment 184.1 184.1 191.9 191.9 195.2 196.4Health care 246.7 237.0 249.2 249.5 264.4 260.9Transport and communication 188.5 179.6 184.7 196.6 197.9 199.1Recreation and education 298.1 298.5 303.2 305.6 309.2 310.4Miscellaneous goods and services 153.1 154.6 157.7 158.6 168.8 172.3
All items -0.7 0.5 3.5 5.2 0.7 6.8Food -1.8 1.8 4.2 9.4 -0.7 12.2Beverages and tobacco 2.3 0.2 0.9 0.7 8.8 4.3Clothing and footwear 0.0 0.0 5.0 0.0 0.0 0.0Housing 0.0 -0.1 0.0 0.1 0.1 0.1Fuel and light 3.1 0.7 7.4 6.1 1.1 16.0Furniture, household equipment -1.8 0.0 4.2 0.0 1.7 0.6Health care -1.0 -3.9 5.1 0.1 6.0 -1.3Transport and communication 5.4 -4.7 2.8 6.4 0.7 0.6Recreation and education -0.6 0.1 1.6 0.8 1.2 0.4Miscellaneous goods and services -1.6 1.0 2.0 0.6 6.4 2.1
Source: Statistics Department of Ministry of Finance.
Table 7. St. Lucia: Consumer Price Index(April 1984 = 100)
(Period averages)
(Annual percentage change)
(End of period)
(Percentage change during year)

11
Prel.2002/03 2003/04 2004/05 2005/06 2006/07 2007/08
Total revenue and grants 497.7 538.3 564.1 615.9 682.6 744.3
Current revenue 441.5 496.7 563.3 609.3 675.3 740.2
Tax revenue 405.4 452.9 518.6 566.7 619.8 685.2Taxes on income and profits 105.4 110.0 132.4 156.6 160.1 196.4Taxes on property 4.4 3.8 3.7 5.8 4.2 5.2Taxes on goods and services 173.7 194.8 210.0 198.6 217.2 237.7 Consumption taxes 112.7 121.0 123.5 115.2 123.0 125.7 Imports 107.8 114.4 117.2 104.2 111.5 112.2 Domestic goods 4.9 6.6 6.3 8.2 8.1 9.8 Hotel occupancy tax 19.5 22.2 26.3 29.4 29.5 33.5 Excises 6.3 7.2 7.6 6.4 3.9 2.6 Other 35.2 44.4 52.7 47.6 60.8 76.0Taxes on international trade 120.8 144.4 172.6 205.7 238.4 246.0
Of whichImport duties 57.4 69.4 75.3 90.1 98.4 107.0Service charge (imports) 30.2 39.3 46.4 52.2 65.4 64.8
Nontax revenue 36.2 43.8 44.6 42.7 55.5 54.9
Capital revenue 19.9 8.6 0.9 0.6 0.7 0.0 Capital grants 36.3 32.9 0.0 6.0 6.6 4.1
Total expenditure and net lending 637.3 611.5 647.7 761.7 831.7 815.0
Current expenditure 433.6 460.0 479.8 513.3 551.4 585.0Wages and salaries 211.6 229.9 221.3 233.7 250.9 264.7NIS contributions and retirement 34.3 35.2 38.2 43.3 46.3 48.1Goods and services 72.8 78.0 90.4 96.1 101.5 111.5Transfers 68.4 60.2 62.9 67.2 68.5 67.8Interest payments 46.6 56.6 66.9 73.0 84.3 92.9 Domestic 21.9 20.2 22.2 24.1 27.7 30.7 External 24.7 36.4 44.8 48.9 56.6 62.3
Capital expenditure and net lending 197.5 136.1 164.3 248.4 280.3 230.0
Current balance 7.9 36.8 83.5 96.0 123.9 155.1
Overall balance before grants -176.0 -106.2 -83.5 -151.8 -155.7 -74.9
Overall balance after grants -139.7 -73.3 -83.5 -145.8 -149.0 -70.7
Primary balance -93.1 -16.7 -16.6 -72.7 -64.8 22.2
Financing 159.5 73.3 90.1 157.0 151.0 89.3External -55.4 54.2 135.4 116.7 58.5 -22.6Domestic 195.1 10.4 -45.4 40.3 92.5 112.0Privatization receipts 19.9 8.6 0.0 0.0 0.0 0.0
Statistical discrepancy -19.9 0.0 -6.5 -11.3 -1.9 -18.6
Exceptional financing 0.0 8.6 0.0 0.0 0.0 0.0
Sources: Ministry of Finance; and Fund staff estimates.
1/ Data are for fiscal years beginning April 1.
Table 8. St. Lucia: Operations of the Central Government 1/
(In millions of Eastern Caribbean dollars)

12
Prel.2002/03 2003/04 2004/05 2005/06 2006/07 2007/08
Total revenue and grants 25.8 26.2 25.5 25.6 26.9 28.2
Current revenue 22.8 24.2 25.4 25.3 26.6 28.0
Tax revenue 21.0 22.0 23.4 23.5 24.4 26.0Taxes on income and profits 5.5 5.4 6.0 6.5 6.3 7.4Taxes on property 0.2 0.2 0.2 0.2 0.2 0.2Taxes on goods and services 9.0 9.5 9.5 8.2 8.6 9.0 Consumption taxes 5.8 5.9 5.6 4.8 4.8 4.8 Imports 5.6 5.6 5.3 4.3 4.4 4.3 Domestic goods 0.3 0.3 0.3 0.3 0.3 0.4 Hotel occupancy tax 1.0 1.1 1.2 1.2 1.2 1.3 Excises 0.3 0.3 0.3 0.3 0.2 0.1 Other 1.8 2.2 2.4 2.0 2.4 2.9Taxes on international trade 6.3 7.0 7.8 8.5 9.4 9.3
Of which Import duties 3.0 3.4 3.4 3.7 3.9 4.1 Service charge (imports) 1.6 1.9 2.1 2.2 2.6 2.5
Nontax revenue 1.9 2.1 2.0 1.8 2.2 2.1
Capital revenue 1.0 0.4 0.0 0.0 0.0 0.0 Capital grants 1.9 1.6 0.0 0.2 0.3 0.2
Total expenditure and net lending 33.0 29.8 29.2 31.6 32.8 30.9
Current expenditure 22.4 22.4 21.7 21.3 21.7 22.2Wages and salaries 11.0 11.2 10.0 9.7 9.9 10.0NIS contributions and retirement 1.8 1.7 1.7 1.8 1.8 1.8Goods and services 3.8 3.8 4.1 4.0 4.0 4.2Transfers 3.5 2.9 2.8 2.8 2.7 2.6Interest payments 2.4 2.8 3.0 3.0 3.3 3.5 Domestic 1.1 1.0 1.0 1.0 1.1 1.2 External 1.3 1.8 2.0 2.0 2.2 2.4
Capital expenditure and net lending 10.2 6.6 7.4 10.3 11.0 8.7
Current balance 0.4 1.8 3.8 4.0 4.9 5.9
Overall balance before grants -9.1 -5.2 -3.8 -6.3 -6.1 -2.8
Overall balance after grants -7.2 -3.6 -3.8 -6.0 -5.9 -2.7
Primary balance -4.8 -0.8 -0.7 -3.0 -2.6 0.8
Financing 8.3 3.6 4.1 6.5 5.9 3.4External -2.9 2.6 6.1 4.8 2.3 -0.9Domestic 10.1 0.5 -2.0 1.7 3.6 4.2Privatization receipts 1.0 0.4 0.0 0.0 0.0 0.0
Statistical discrepancy -1.0 0.0 -0.3 -0.5 -0.1 -0.7
Exceptional financing 0.0 0.4 0.0 0.0 0.0 0.0
Memorandum item:Nominal GDP (in millions of EC$) 1,932 2,055 2,216 2,411 2,538 2,639
Sources: Ministry of Finance; and Fund Staff estimates.
1/ Data are for fiscal years beginning April 1.
Table 9. St. Lucia: Operations of the Central Government 1/
(In percent of GDP)

13
2002 2003 2004 2005 2006 2007
Net foreign assets 109.8 335.2 318.7 99.9 117.6 -47.7Net imputed reserves (ECCB) 248.1 282.6 351.5 308.3 356.9 408.2Commercial banks' net foreign assets -138.3 52.5 -32.9 -208.5 -239.3 -455.9
Net domestic assets 1,163.5 1,035.2 1,190.5 1,611.9 1,938.6 2,230.9
Net credit to the public sector -255.2 -290.8 -324.7 -275.9 -246.8 -226.2Central government -96.3 -104.4 -130.7 -90.7 -32.0 17.2Nonfinancial public enterprises -158.9 -186.4 -194.0 -185.2 -214.8 -243.4
Credit to private sector 1,553.5 1,498.2 1,650.6 1,917.3 2,386.8 3,090.8Other 1/ -102.0 -132.9 -100.0 8.3 -161.1 -592.5
Money plus quasi-money (M2) 1,273.3 1,370.4 1,509.2 1,711.8 2,056.2 2,183.2Money 287.6 343.1 481.3 547.3 560.7 639.0Quasi-money 985.7 1,027.3 1,027.8 1,164.5 1,495.5 1,544.2
Net foreign assets -0.6 17.7 -1.2 -14.5 1.0 -8.0
Net domestic assets 3.8 -10.1 11.3 27.9 19.1 14.2
Net credit to the public sector 2.1 -2.8 -2.5 3.2 1.7 1.0Central government 1.4 -0.6 -1.9 2.7 3.4 2.4Nonfinancial public enterprises 0.8 -0.5 0.3 -0.1 -0.1 0.0Credit to private sector 0.9 -4.3 11.1 17.7 27.4 34.2Other -0.2 -2.4 2.4 7.2 -9.9 -21.0
Credit to the private sector 0.8 -3.6 10.2 16.2 24.5 29.5Money plus quasi-money 3.2 7.6 10.1 13.4 20.1 6.2 Money 1.3 19.3 40.3 13.7 2.4 14.0 Quasi-money 3.7 4.2 0.1 13.3 28.4 3.3
Source: Eastern Caribbean Central Bank (ECCB).
1/ Includes intra-banking system float.
(12-months percentage change)
Table 10. St. Lucia: Monetary Survey
(In millions of Eastern Caribbean dollars)
(12-month change in percent of M2 at the beginning of the period)

14
2002 2003 2004 2005 2006 2007 Net (imputed) international reserves 1/ 248.1 282.6 351.5 308.3 356.9 408.2
Net claims on commercial banks -167.6 -190.7 -238.6 -191.9 -210.5 -237.0
Claims 0.0 0.0 0.0 0.0 0.0 0.0Liabilities -167.6 -190.8 -238.7 -192.0 -210.6 -237.0
Currency (ECCB notes and coins) -40.8 -41.0 -41.3 -55.3 -52.7 -59.1Statutory reserves and deposits -126 -150 -197 -137 -158 -178Current Deposits -1 0 0 0 0 0
Net claims on statutory bodies 0.0 0.0 0.0 0.0 0.0 0.0
Net domestic assets 3.1 -0.6 -13.8 -10.0 -19.8 -43.2Net credit to central government -1.9 -4.6 -16.7 -12.0 -20.8 -43.2
Short-term credit -5.0 -4.0 -3.0 -2.0 -1.0 0.0Temporary advances 3.3 2.9 3.9 4.2 7.0 11.2Treasury bills 0.2 0.2 0.2 0.0 0.0 0.0Debentures 5.0 5.0 5.0 5.0 0.0 0.0Other claims 2.2 1.1 0.0 0.0 0.0 0.0Central-government deposits -7.7 -9.8 -22.9 -19.2 -26.8 -54.3
Other items net 5.0 4.0 3.0 2.0 1.0 0.0
Currency in circulation 83.6 91.3 99.2 106.4 126.6 128.0Total currency issued 124.4 132.3 140.5 161.7 179.3 187.1Less: Currency held by banks -40.8 -41.0 -41.3 -55.3 -52.7 -59.1
Source: Eastern Caribbean Central Bank (ECCB).
1/ Share of St. Lucia in the international reserves of the ECCB, calculated as the difference between liabilities to the private sector and net claims on commercial banks and government.
(In millions of Eastern Caribbean dollars)
Table 11. St. Lucia: Summary Operations of the Eastern Caribbean Central Bank

15
2002 2003 2004 2005 2006 2007
Net foreign assets -138.3 52.5 -32.9 -208.5 -239.3 -455.9
Foreign assets 232.6 428.8 444.4 492.3 815.2 1,070.6Foreign currency holdings 10.5 10.5 8.9 12.7 11.0 18.1Claims on ECCB area banks 78.9 184.7 95.2 70.9 295.9 481.2Claims on banks abroad 47.1 97.7 115.4 80.4 176.6 118.7Other 1/ 96.1 135.9 224.9 328.3 331.6 452.7
Foreign liabilities -370.9 -376.3 -477.2 -700.8 -1,054.5 -1,526.6Balances due to ECCB area banks -49.4 -18.0 -102.7 -248.6 -366.1 -704.1Balances due to banks abroad -94.7 -124.2 -116.4 -179.3 -331.8 -418.1Nonresident deposits -147.2 -145.3 -169.3 -187.6 -264.4 -290.9Other -79.7 -88.7 -88.8 -85.3 -92.1 -113.4
Net position with ECCB 172.8 190.1 240.6 188.5 198.6 190.1
Net claims on ECCB 173.9 194.1 240.6 198.6 204.4 207.3Currency holdings 40.8 41.0 41.3 55.3 52.7 59.1Current deposits 112.4 120.4 198.1 142.1 149.1 147.1Fixed deposits and call accounts 20.7 32.7 1.1 1.1 1.1 1.1
Liabilities to ECCB -1.0 -4.1 0.0 -10.2 -5.8 -17.2
Net domestic assets 1,155.2 1,036.5 1,202.3 1,625.4 1,970.3 2,321.0
Net credit to government -99.4 -103.8 -117.0 -80.6 -12.2 60.4Treasury bills 20.3 28.1 11.3 32.2 23.8 12.8Other securities 52.2 71.1 132.0 179.2 172.4 174.2Loans and advances 70.1 31.8 34.2 58.4 87.5 152.3Deposits -242.1 -234.8 -294.6 -350.5 -295.8 -278.9
Net credit to National Insurance Scheme -174.3 -229.5 -240.9 -248.2 -264.2 -291.7Net credit to public enterprises 15.5 43.1 46.9 62.9 49.4 48.3
Loans, advances, and investments 65.3 96.0 99.9 120.0 116.1 112.4Deposits -49.8 -52.9 -52.9 -57.0 -66.7 -64.2
Net credit to other financial institutions -32.7 -39.3 -35.4 -37.8 -40.4 -41.3Loans, advances, and investments 28.3 31.7 30.8 36.8 37.2 38.1Deposits -61.0 -71.0 -66.2 -74.5 -77.6 -79.4
Credit to private sector 1,553.5 1,498.2 1,650.6 1,917.3 2,386.8 3,090.8Interbank float 1.7 0.9 4.0 6.8 5.2 11.9
Claims 28.1 18.7 17.4 22.7 23.7 28.0Liabilities -26.5 -17.9 -13.4 -15.9 -18.5 -16.1
Net unclassified assets -108.9 -133.0 -105.9 5.0 -154.4 -557.4
Liabilities to the private sector 2/ 1,189.7 1,279.1 1,410.0 1,605.4 1,929.6 2,055.2Demand deposits 204.0 251.8 382.2 440.9 434.1 510.9Saving deposits 652.3 755.2 810.4 916.3 1,064.9 1,150.8Time deposits 309.6 240.2 178.7 185.9 222.7 283.3Foreign currency deposits 23.8 31.9 38.7 62.2 207.9 110.2
Sources: Eastern Caribbean Central Bank (ECCB); and Fund staff projections.
1/ Includes financial instrument issued by and loans to nonbank residents of countries ouside ECCB territory.2/ Private sector includes nonbank financial institutions.
(In millions of Eastern Caribbean dollars)
Table 12. St. Lucia: Consolidated Accounts of the Commercial Banks

16
2002 2003 2004 2005 2006 2007
Total 1,721.2 1,721.1 1,807.7 2,174.6 2,732.7 3,510.8
Public sector 149.9 89.8 124.2 170.6 197.4 330.1Government and public enterprises, n.i.e. 112.3 67.5 102.5 149.9 154.9 215.7Public utilities 37.5 22.3 21.7 20.7 42.5 114.3
Businesses 813.2 766.6 849.3 1,046.4 1507.2 2031.3Agriculture and fisheries 34.9 34.51 33.4 31.5 30.5 35.9Manufacturing and mining 56.9 54.2 106.9 59.9 67.3 62.3Distributive trades 214.0 197.8 195.2 227.7 236.2 239.4Tourism and entertainment 212.2 198.8 161.7 293.8 506.0 793.9Transport 33.2 28.0 24.0 50.2 88.8 112.4Construction and land development 110.9 101.4 108.5 121.8 166.4 244.0Professional and other services 135.9 125.0 202.4 218.5 370.0 505.7Financial institutions 15.2 26.9 17.2 43.1 42.0 37.8
Households 758.1 864.7 834.3 957.6 1,028.2 1,149.4House and land purchases 325.7 408.6 413.4 465.0 503.3 513.1Durable consumer goods 63.9 64.8 80.5 109.7 138.9 187.9Other personal loans 368.6 391.3 340.4 382.9 386.0 448.4
Public sector 8.7 5.2 6.9 7.8 7.2 9.4Government and public enterprises, n.i.e. 6.5 3.9 5.7 6.9 5.7 6.1Public utilities 2.2 1.3 1.2 1.0 1.6 3.3
Businesses 47.2 44.5 47.0 48.1 55.2 57.9Agriculture and fisheries 2.0 2.0 1.8 1.4 1.1 1.0Manufacturing and mining 3.3 3.2 5.9 2.8 2.5 1.8Distributive trades 12.4 11.5 10.8 10.5 8.6 6.8Tourism and entertainment 12.3 11.5 8.9 13.5 18.5 22.6Transport 1.9 1.6 1.3 2.3 3.3 3.2Construction and land development 6.4 5.9 6.0 5.6 6.1 6.9Professional and other services 7.9 7.3 11.2 10.0 13.5 14.4Financial institutions 0.9 1.6 1.0 2.0 1.5 1.1
Households 44.0 50.2 46.1 44.0 37.6 32.7House and land purchases 18.9 23.7 22.9 21.4 18.4 14.6Durable consumer goods 3.7 3.8 4.5 5.0 5.1 5.4Other personal loans 21.4 22.7 18.8 17.6 14.1 12.8
Source: Eastern Caribbean Central Bank (ECCB).
Table 13. St. Lucia: Distribution of Commercial Bank Loans and Advances
(In millions of Eastern Caribbean dollars at end of period)
(In percent of total)

17
Prel.
2002 2003 2004 2005 2006 2007
Current account -106.0 -110.3 -87.5 -150.1 -277.4 -279.6Trade balance -202.6 -245.7 -251.8 -329.3 -403.6 -405.9 Exports, f.o.b. 69.3 109.3 96.2 88.8 117.4 135.9 Imports, f.o.b. -271.9 -355.1 -348.0 -418.1 -521.0 -541.8Services (net) 84.5 122.6 150.4 166.2 114.2 114.3
Receipts 253.5 323.2 373.3 418.6 347.5 357.2Travel 210.0 282.1 325.7 356.0 287.5 299.4Other nonfactor services 39.9 36.2 41.5 54.5 49.6 51.6Factor services 3.6 4.9 6.2 8.1 10.4 6.2
Payments 169.0 200.6 222.9 252.3 233.3 242.9Travel 33.7 35.7 36.8 38.9 39.3 41.4Other nonfactor services 95.3 109.3 110.9 132.8 129.5 135.2Factor services 39.9 55.7 75.2 80.6 64.4 66.4
Of which Public interest payments 11.0 17.0 18.0 17.2 19.7 23.0
Current transfers (net) 12.1 12.9 13.9 13.0 12.0 12.0
Capital and financial account 126.0 145.9 101.0 139.7 321.8 303.5Capital transfers (net) 19.7 17.1 3.5 5.3 11.4 5.8Official borrowing (net) 41.5 72.4 24.4 43.2 21.7 -8.4
Central government loan drawings 0.4 0.4 0.5 0.5 0.5 0.5Central government loan amortization 15.4 26.8 9.0 16.0 8.0 -3.1Other (net) 24.2 31.0 16.5 21.6 13.7 16.8
Private capital 64.8 56.4 73.2 91.1 288.7 306.1Private long-term (net) 57.2 129.2 53.2 66.5 224.3 225.9Of which
Direct investment (net) 51.9 106.4 76.5 78.2 233.9 233.9Commercial banks 7.6 -72.8 20.0 24.6 64.4 80.2Other short term capital (net) 0.0 0.0 0.0 0.0 0.0 0.0
Overall balance 5.8 18.3 26.8 -15.3 13.4 19.0
Financing (increase -) -5.8 -18.3 -26.8 15.3 -13.4 -19.0Change in SDR holdings 0.0 0.0 0.0 0.0 0.0 0.0Change in government foreign assets -1.0 -5.5 -1.3 -0.7 4.6 0.0Change in imputed reserves (increase -) -4.8 -12.8 -25.5 16.0 -18.0 -19.0
Current account -15.0 -14.7 -10.9 -17.1 -29.7 -29.1Capital and financial account 17.9 19.5 12.6 15.9 34.5 31.6
Sources: St. Lucian authorities; Eastern Caribbean Central Bank (ECCB); and Fund staffestimates.
Table 14. St. Lucia: Summary Balance of Payments
(In percent of GDP)
(In millions of U.S. dollars)

18
Prel.2002 2003 2004 2005 2006 2007
Total goods exports 69,342 109,333 96,163 88,773 117,355 135,929Domestic exports 42,937 38,830 45,141 43,729 51,960 55,122Re-exports 19,120 60,780 34,489 20,431 41,054 55,217Repairs and goods procured in ports 7,285 9,722 16,532 24,612 24,341 25,589
Domestic exports (SITC categories) 42,937 38,830 45,141 43,729 51,960 55,122 Food and live animals 23,584 17,809 21,216 20,819 19,242 17,453 Beverages and tobacco 8,626 10,640 11,710 11,711 15,084 19,460 Crude materials (except fuel) 213 412 1,011 567 1,142 1,816 Minerals, fuel, lubricants and related materials 0 0 0 0 0 0 Animal and vegetable oils and fats 49 5 76 0 0 47 Chemicals and related products 366 394 1,414 899 1,186 1,767 Manufactured goods classified chiefly by materials 4,010 3,592 4,237 4,237 5,308 5,282 Machinery and transport equipment 2,967 2,966 2,923 2,880 8,614 7,421 Miscellaneous manufactured articles 3,115 3,011 2,548 2,548 1,323 1,684 Other, and statistical discrepancy 7 2 6 69 62 191
Total goods exports 27.8 3.6 -12.0 -7.7 32.2 15.8Domestic exports 15.6 -9.0 16.3 -3.1 18.8 6.1 Bananas 42.4 -25.7 24.7 -23.7 15.9 -9.2
Memorandum item: Bananas exports ('000s U.S. dollars) 21,707 16,136 20,125 15,370 17,815 16,167
Sources: Statistics Department; St. Lucia Banana Growers Association, Windward Islands Banana Development and Exporting Company (WIBDECO); and Fund staff estimates.
(Value change in percent)
Table 15. St. Lucia: Value, Volume, and Unit Value of Major Exports
(In thousands of U.S. dollars)

19
Prel.2002 2003 2004 2005 2006 2007
Total imports, c.i.f. 314.8 403.5 421.4 482.4 592.0 615.7Food 62.6 75.6 83.7 86.7 94.6 96.8Beverages and tobacco 12.0 15.3 16.9 17.7 20.5 26.5Crude materials 8.0 8.9 10.1 13.3 16.3 12.5Fuels 31.0 45.7 54.8 67.0 76.3 130.6Oils and fats 0.4 0.8 1.0 1.5 1.5 1.6Chemicals 26.4 29.4 33.2 35.7 40.6 36.6Manufactured goods 53.2 61.4 68.0 75.6 105.0 77.1Machinery and transport equipment 72.3 105.7 85.1 106.7 153.2 152.7Miscellaneous manufactured articles 49.0 60.7 68.4 77.9 83.9 81.2Miscellaneous 0.1 0.1 0.1 0.1 0.3 0.3
Total imports, c.i.f. 100.0 100.0 100.0 100.0 100.0 100.0Food 19.9 18.7 18.8 18.0 16.0 15.7Beverages and tobacco 3.8 3.8 3.8 3.7 3.5 4.3Crude materials 2.5 2.2 2.3 2.7 2.8 2.0Fuels 9.9 11.3 17.3 13.9 12.9 21.2Oils and fats 0.1 0.2 0.2 0.3 0.2 0.3Chemicals 8.4 7.3 7.5 7.4 6.9 5.9Manufactured goods 16.9 15.2 15.3 15.7 17.7 12.5Machinery and transport equipment 23.0 26.2 19.3 22.1 25.9 24.8Miscellaneous manufactured articles 15.6 15.0 15.5 16.1 14.2 13.2Miscellaneous 0.0 0.0 0.0 0.0 0.0 0.0
Memorandum items:Total imports, c.i.f. Percent change 1.8 28.2 4.4 14.5 22.7 4.0 Ratio to GDP (percent) 44.7 53.9 52.6 54.9 63.4 64.1
Sources: Statistics Department of the Ministry of Finance; and Fund staff estimates.
Table 16. St. Lucia: Merchandise Imports by SITC Category
(In percent of total)
(In millions of U.S. dollars)

20
2002 2003 2004 2005 2006 2007
GasolineValue of imports for domestic use 26.9 31.5 60.4 51.3 135.9 ...Domestic value 93.6 94.4 102.0 109.3 119.7 ...Domestic volume 12.0 12.1 12.0 11.5 12.6 ...Volume of duty-free and re-exports 0.2 0.1 0.1 0.3 0.2 ...Retail price 7.8 7.8 8.5 9.5 9.5 12.8Consumption tax collected 35.2 25.1 60.4 13.0 12.9 ...
DieselValue of imports for domestic use 4.8 11.5 … … 5.1 ...Domestic value 16.9 34.0 22.6 23.8 41.4 ...Domestic volume 2.4 4.9 2.9 2.7 4.7 ...Volume of duty-free and re-exports 1.1 1.1 0.3 0.1 18.3 ...Retail price 7.0 7.0 7.8 8.8 8.8 12.8Consumption tax collected 6.5 6.3 4.5 2.2 2.4 ...
Electricity consumption (millions of kwh) 284.5 305.5 309.1 323.9 331.9 345.7 Of which
Domestic 89.1 93.3 95.9 98.9 101.6 104.8Commercial 86.7 91.8 95.7 101.6 103.4 106.9Industrial 12.7 13.2 13.0 12.5 13.0 15.8Other and losses 96.0 107.2 104.5 110.9 113.8 118.2
Sources: Ministry of Finance; Statistics Department; Eastern Caribbean Central Bank (ECCB); and LUCELEC.
Table 17. St. Lucia: Imports and Prices of Petroleum Products
(Values and taxes in millions of Eastern Caribbean dollars, quantities in millions of imperial gallons, and prices in Eastern Caribbean dollar per imperial gallon; unless otherwise indicated)

21
Prel. Prel.2003 2004 2005 2006 2007
VolumesExports 99.8 109.7 111.0 106.4 108.8
Merchandise exports 1/ 69.9 79.1 67.9 72.9 70.7Tourism 2/ 105.0 114.9 118.4 112.2 115.4
Merchandise imports 99.2 90.1 91.8 102.2 93.2
Unit valuesExports 94.9 102.4 110.2 105.0 104.9
Merchandise exports 1/ 103.5 102.7 108.4 111.0 113.9Tourism 3/ 93.8 102.3 110.3 104.3 103.8
Merchandise imports 112.1 129.0 144.9 159.8 182.2
Terms of trade 84.6 79.3 76.0 65.7 57.5(Excluding tourism) 92.3 79.6 74.8 69.5 62.5
(Annual percentage change)
VolumesExports 6.1 9.9 1.2 -4.2 2.3
Merchandise exports 1/ -18.5 13.2 -14.2 7.5 -3.0Tourism 2/ 9.4 9.4 3.0 -5.3 2.9
Merchandise imports 13.6 -9.2 1.9 11.3 -8.8
Unit valuesExports 9.5 7.9 7.6 -4.7 -0.1
Merchandise exports 1/ 1.8 -0.8 5.6 2.4 2.6Tourism 3/ 11.8 9.1 7.8 -5.5 -0.4
Merchandise imports 12.9 15.1 12.3 10.3 14.0
Terms of trade -3.0 -6.3 -4.2 -13.6 -12.4 (Excluding tourism) -9.8 -13.8 -6.0 -7.2 -10.0
Sources: Statistical Department, Ministry of Finance; and Fund staff estimates.1/ Based on merchandise export items accounting for about 90 percent of total domestic
exports.2/ Number of tourist arrivals.3/ Average expenditure per day of each tourist.
(2000 = 100)
Table 18. St. Lucia: Merchandise Trade Volumes, Unit Values and Terms of Trade

22
Prel.2002 2003 2004 2005 2006 2007
Export destination 100.0 100.0 100.0 100.0 100.0 100.0
United Kingdom 52.2 42.6 46.0 18.9 33.6 28.1United States 11.4 11.4 9.2 7.4 7.7 12.7Canada 0.2 0.4 0.2 0.3 0.1 0.2CARICOM countries 33.5 43.3 42.7 65.4 42.9 54.8
Barbados 10.9 10.9 10.4 10.0 1.2 11.8Jamaica 0.3 0.5 0.1 0.1 0.0 0.3Trinidad and Tobago 4.1 11.1 11.8 36.1 37.4 23.5OECS 16.7 19.0 19.1 19.2 3.7 18.0Dominica 7.2 7.1 8.4 4.7 0.8 5.2Grenada 3.7 4.4 4.3 5.8 0.8 3.4St. Vincent 2.4 4.5 3.4 4.1 1.1 4.4Antigua 1.7 1.2 1.7 3.1 1.1 3.5Montserrat 0.2 0.1 0.1 0.2 0.0 0.0St. Kitts and Nevis 1.5 1.8 1.3 1.3 0.5 1.4
Other 2.8 2.4 1.9 15.2 15.8 4.2
Origin of imports 100.0 100.0 100.0 100.0 100.0 100.0
United Kingdom 8.5 8.6 7.7 8.7 8.8 4.6United States 37.5 35.7 35.1 50.0 43.8 31.9Canada 3.8 3.3 2.1 3.1 3.5 1.8Japan 4.5 4.1 3.3 6.1 8.0 6.3France 1.0 0.9 1.2 1.9 1.9 1.0Germany 2.0 1.6 1.4 2.0 1.9 1.1CARICOM countries 21.7 25.3 21.6 27.3 30.8 27.5
Barbados 2.8 3.0 3.3 4.1 5.6 4.2Jamaica 0.8 0.9 0.9 1.1 0.9 0.8Trinidad and Tobago 14.4 17.0 14.2 19.1 21.4 19.9OECS 2.6 2.9 2.2 1.5 1.4 1.8
Of whichSt. Vincent 1.3 1.2 0.7 0.8 1.2 0.8
Other CARICOM 1.1 1.5 1.1 1.5 1.5 0.9Other 20.9 20.6 27.5 0.1 0.1 25.7
Sources: Statistics Department of the Ministry of Finance.
Table 19. St. Lucia: Direction of Trade
(In percent of total)

23
Prel. Prel.2003 2004 2005 2006 2007
Total visitor arrivals 683,027 791,151 719,911 669,154 905,524Stayover arrivals 276,948 298,431 317,939 302,510 287,518 Hotel tourist 235,406 255,383 270,248 257,134 244,390 Hotel business 16,617 17,219 19,076 18,151 17,251 Private residence 24,925 25,829 28,615 27,226 25,877Excursionist 12,817 11,441 7,541 7,051 7,841Cruiseship 393,262 481,279 394,431 359,593 610,165
Average daily expenditure (EC$) 237.9 250.6 279.8 264.5 263.3Stayover arrivals 255.4 282.4 315.3 298.0 296.7 Hotel tourist 265.0 294.0 328.3 310.3 308.9 Hotel business 265.0 294.0 328.3 310.3 308.9 Private residence 171.0 180.5 201.5 190.5 189.7Excursionist 122.9 124.7 139.2 131.6 131.0Cruiseship 118.0 119.8 133.7 126.4 125.8
Average length of stay (days) 4.7 4.4 5.0 5.1 3.9Stayover arrivals 10.1 10.1 10.1 10.1 10.1 Hotel tourist 10.4 10.4 10.4 10.4 10.4 Hotel business 3.5 3.5 3.5 3.5 3.5 Private residence 11.5 11.5 11.5 11.5 11.5Excursionist 1.0 1.0 1.0 1.0 1.0Cruiseship 1.0 1.0 1.0 1.0 1.0
Visitor expenditure (millions of EC$) 761.6 876.3 961.2 793.7 857.1Stayover arrivals 713.6 817.2 896.4 740.2 799.4 Hotel tourist 648.8 745.9 818.1 675.6 729.6 Hotel business 15.9 17.7 19.4 16.0 17.3 Private residence 49.0 53.6 58.8 48.6 52.4Excursionist 1.6 1.4 1.6 1.3 1.4Cruiseship 46.4 57.6 63.2 52.2 56.4
Total visitor expenditure In millions of U.S. dollars 282.1 324.5 356.0 294.0 317.5In percent of GDP 37.8 40.7 40.6 31.5 33.1
Tourist arrivals 5.3 15.8 -9.0 -7.1 35.3Stayover arrivals 9.3 7.8 6.5 -4.9 -5.0
Table 20. St. Lucia: Selected Tourism Statistics
(In percent change)

24
2002 2003 2004 2005 2006 2007
Total stayover arrivals 253.5 276.9 298.4 317.9 302.5 287.5United States 94.0 98.1 107.1 112.6 117.5 113.4United Kingdom 63.3 75.4 81.4 84.7 73.3 79.2Canada 12.9 13.5 15.3 16.5 17.5 18.6Caribbean 66.4 70.5 74.2 84.7 78.5 59.0France 3.4 6.0 7.7 7.2 3.8 3.6Germany 3.9 5.6 3.3 3.3 2.6 1.6Other 9.5 7.8 9.4 8.9 9.5 12.0
Total arrivals 100.0 100.0 100.0 100.0 100.0 100.0United States 37.1 35.4 35.9 35.4 38.8 39.5United Kingdom 25.0 27.2 27.3 26.6 24.2 27.5Canada 5.1 4.9 5.1 5.2 5.8 6.5Caribbean 26.2 25.5 24.9 26.6 25.9 20.5France 1.3 2.2 2.6 2.3 1.2 1.3Germany 1.6 2.0 1.1 1.0 0.8 0.6Other 3.7 2.8 3.2 2.8 3.1 4.2
Sources: Statistics Department of the Ministry of Finance; Tourism Board; and Fund staff estimates.
Table 21. St. Lucia: Stayover Tourist Arrivals by Country of Origin
(Number of arrivals in thousands)
(In percent of total)

25
2003/04 2004/05 2005/06 2006/07 2007/08
Domestic debt (by debtor) 108.8 158.7 172.0 198.6 242.8 Central government 85.5 135.8 151.1 179.0 224.4 Loans 13.0 11.5 18.1 41.9 56.6 Overdraft 1.7 0.6 0.0 0.0 0.0 Bonds 28.2 79.8 111.4 123.2 143.1 Treasury bills 42.6 43.9 21.6 13.9 24.7 Government guaranteed (loans) 14.7 14.3 13.2 12.2 11.5 Government nonguaranteed (loans) 8.6 8.5 7.8 7.4 6.9
Domestic debt (by creditor) 85.5 135.8 151.1 179.0 224.4 Central government 85.5 135.8 151.1 179.0 224.4 Central bank 8.5 8.5 3.0 1.1 0.7 Commercial banks 33.4 72.2 94.1 109.2 135.4 Financial institutions 1.5 8.9 8.0 24.4 43.0 Insurance company 15.5 14.6 15.1 15.4 14.0 Public holders 0.9 1.0 1.0 1.1 0.9 Social security 24.8 29.7 29.7 27.6 30.2 Other 1/ 0.8 1.0 0.3 0.2 0.2
External debt (by debtor and creditor) 341.1 369.7 417.0 418.1 441.8 Central government 277.5 310.4 359.3 361.6 356.6 Bilateral 21.7 23.1 25.3 31.6 32.2 Multilateral 104.3 129.7 167.7 181.1 191.4 Commercial banks 137.2 130.8 125.2 113.3 101.4
Of which 0.0 0.0 0.0 0.0 0.0Loans 14.2 14.2 14.2 14.2 14.2Bonds 122.9 116.6 111.0 99.1 87.2
Export credit 1.3 1.1 1.1 0.8 0.6 Other (bonds) 13.1 25.7 40.1 34.9 30.9
Government guaranteed 51.5 47.1 45.3 44.3 40.9 Bilateral 6.1 5.5 4.8 4.3 2.2 Multilateral 45.3 41.5 40.5 40.0 38.7 Government nonguaranteed 12.1 12.2 12.3 12.2 44.3 Bilateral 0.0 0.0 0.0 0.0 0.0 Multilateral 1.2 1.3 1.5 1.3 44.3 Commercial banks 10.9 10.9 10.9 10.9 0.0
Central-government debt 363.0 446.2 510.4 540.6 581.0Disbursements 16.4 78.3 92.3 63.3 79.1
Domestic 16.4 26.9 33.9 26.4 33.7External 0.0 51.4 58.4 36.9 45.4
Amortization 6.3 96.0 63.8 68.6 124.0Domestic 0.0 78.3 48.6 53.4 70.2External 6.3 17.7 15.2 15.2 53.8
Total public debt 449.9 528.3 589.0 616.7 684.6
Disbursements 16.4 78.3 92.3 63.3 79.1Amortization 6.3 96.0 63.8 68.6 124.0
Sources: Ministry of Finance; and Fund staff estimates.
1/ Includes National Savings and Development bonds and RGSM bonds.
Table 22. St. Lucia: Structure of Public Debt
(In millions of U.S. dollars, unless otherwise stated)
26
2003/04 2004/05 2005/06 2006/07 2007/08
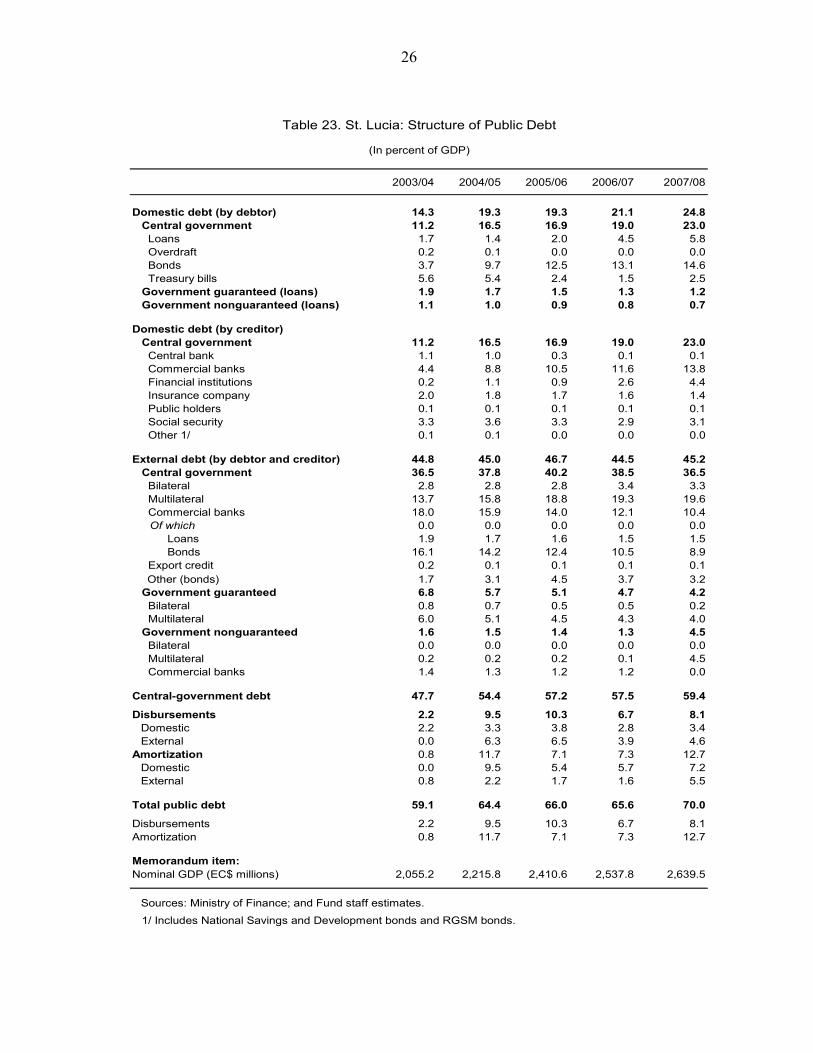
Domestic debt (by debtor) 14.3 19.3 19.3 21.1 24.8 Central government 11.2 16.5 16.9 19.0 23.0 Loans 1.7 1.4 2.0 4.5 5.8 Overdraft 0.2 0.1 0.0 0.0 0.0 Bonds 3.7 9.7 12.5 13.1 14.6 Treasury bills 5.6 5.4 2.4 1.5 2.5 Government guaranteed (loans) 1.9 1.7 1.5 1.3 1.2 Government nonguaranteed (loans) 1.1 1.0 0.9 0.8 0.7
Domestic debt (by creditor) Central government 11.2 16.5 16.9 19.0 23.0 Central bank 1.1 1.0 0.3 0.1 0.1 Commercial banks 4.4 8.8 10.5 11.6 13.8 Financial institutions 0.2 1.1 0.9 2.6 4.4 Insurance company 2.0 1.8 1.7 1.6 1.4 Public holders 0.1 0.1 0.1 0.1 0.1 Social security 3.3 3.6 3.3 2.9 3.1 Other 1/ 0.1 0.1 0.0 0.0 0.0
External debt (by debtor and creditor) 44.8 45.0 46.7 44.5 45.2 Central government 36.5 37.8 40.2 38.5 36.5 Bilateral 2.8 2.8 2.8 3.4 3.3 Multilateral 13.7 15.8 18.8 19.3 19.6 Commercial banks 18.0 15.9 14.0 12.1 10.4
Of which 0.0 0.0 0.0 0.0 0.0Loans 1.9 1.7 1.6 1.5 1.5Bonds 16.1 14.2 12.4 10.5 8.9
Export credit 0.2 0.1 0.1 0.1 0.1 Other (bonds) 1.7 3.1 4.5 3.7 3.2
Government guaranteed 6.8 5.7 5.1 4.7 4.2 Bilateral 0.8 0.7 0.5 0.5 0.2 Multilateral 6.0 5.1 4.5 4.3 4.0 Government nonguaranteed 1.6 1.5 1.4 1.3 4.5 Bilateral 0.0 0.0 0.0 0.0 0.0 Multilateral 0.2 0.2 0.2 0.1 4.5 Commercial banks 1.4 1.3 1.2 1.2 0.0
Central-government debt 47.7 54.4 57.2 57.5 59.4
Disbursements 2.2 9.5 10.3 6.7 8.1Domestic 2.2 3.3 3.8 2.8 3.4External 0.0 6.3 6.5 3.9 4.6
Amortization 0.8 11.7 7.1 7.3 12.7Domestic 0.0 9.5 5.4 5.7 7.2External 0.8 2.2 1.7 1.6 5.5
Total public debt 59.1 64.4 66.0 65.6 70.0
Disbursements 2.2 9.5 10.3 6.7 8.1Amortization 0.8 11.7 7.1 7.3 12.7
Memorandum item:Nominal GDP (EC$ millions) 2,055.2 2,215.8 2,410.6 2,537.8 2,639.5
Sources: Ministry of Finance; and Fund staff estimates.
1/ Includes National Savings and Development bonds and RGSM bonds.
Table 23. St. Lucia: Structure of Public Debt
(In percent of GDP)

27
Real Effective Exchange Rate 2/
Nominal Effective Exchange Rate 2/
Relative Consumer Prices
2003I 98.7 99.0 99.7II 97.2 98.4 98.7III 96.8 99.1 97.7IV 94.6 97.3 97.3
2004I 92.3 95.9 96.2II 93.2 97.1 96.0III 93.3 96.4 96.7IV 90.8 94.4 96.2
2005I 90.3 93.7 96.3II 91.5 94.7 96.7III 92.2 95.7 96.3IV 93.9 96.8 97.0
2006I 94.4 96.7 97.7II 92.4 95.3 96.9III 91.0 94.9 95.9IV 90.3 94.6 95.4
2007I 88.9 94.4 94.2II 87.5 93.5 93.5III 88.2 92.9 94.9IV 89.1 91.6 97.2
2008I 89.4 91.2 98.0
2002 101.8 101.4 100.32003 96.8 98.4 98.42004 92.4 96.0 96.32005 92.0 95.2 96.62006 92.0 95.4 96.52007 88.4 93.1 95.0
Source: IMF Information Notice System.
1/ Period averages.2/ Increases denote appreciation.
Table 24. St. Lucia: Effective Exchange Rate Indices 1/
(2000 = 100)