about dementia; statistics - asiapacificepidemicsept06 - statistical appendix
TRANSCRIPT

NOT FOR PUBLICATION
DEMENTIA IN THE ASIA PACIFIC REGION:
STATISTICAL APPENDIX
BY ACCESS ECONOMICS PTY LIMITED
FOR
ASIA PACIFIC MEMBERS OF ALZHEIMER'S DISEASE INTERNATIONAL
21 SEPTEMBER 2006
NOT FOR PUBLICATION
Dementia in the Asia Pacific Region: Statistical Appendix
2
DEMENTIA PREVALENCE AND INCIDENCE ESTIMATES This statistical appendix presents individual estimates of prevalence and incidence for each of the economies included in the Asia Pacific region, for the period 2005 to 2050. At the end, a summary of the regional data is presented.
For each economy, a table of data is presented first, which includes:
! Population (in thousands of people) is the estimated total population of each economy according the United Nations estimates and projections, for the given year.
! Prevalence (in thousands of people) is the number of people with dementia in each economy estimated on the basis of multiplying the matrix of prevalence rates (by age group and gender) to the matrix of population (by age group and gender), for the given year.
! Incidence (in thousands of people) is the number of new cases of people with dementia in each economy estimated on the basis of multiplying the matrix of incidence rates (by age group and gender) to the matrix of population (by age group and gender), for the given year.
! Prevalence rate is the estimated prevalence of dementia in each economy expressed as a percentage of the economy’s population, for the given year.
! Incidence rate is the estimated incidence of dementia in each economy expressed as a percentage of the economy’s population, for the given year.
! Population share is the population of each economy expressed as a percentage of the total population for the Asia Pacific region, for the given year.
! Prevalence share is the estimated prevalence of dementia in each economy expressed as a percentage of the total dementia prevalence for the Asia Pacific region, for the given year.
! Incidence share is the estimated incidence of dementia in each economy expressed as a percentage of the total dementia incidence for the Asia Pacific region, for the given year.
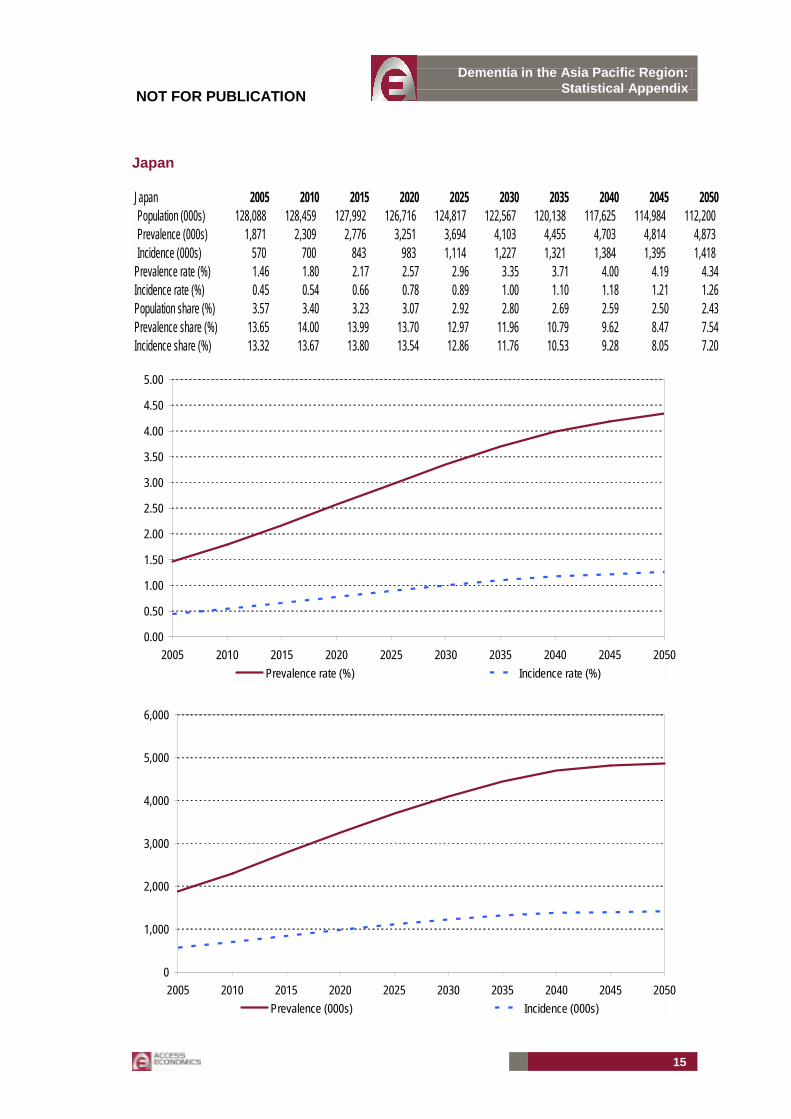
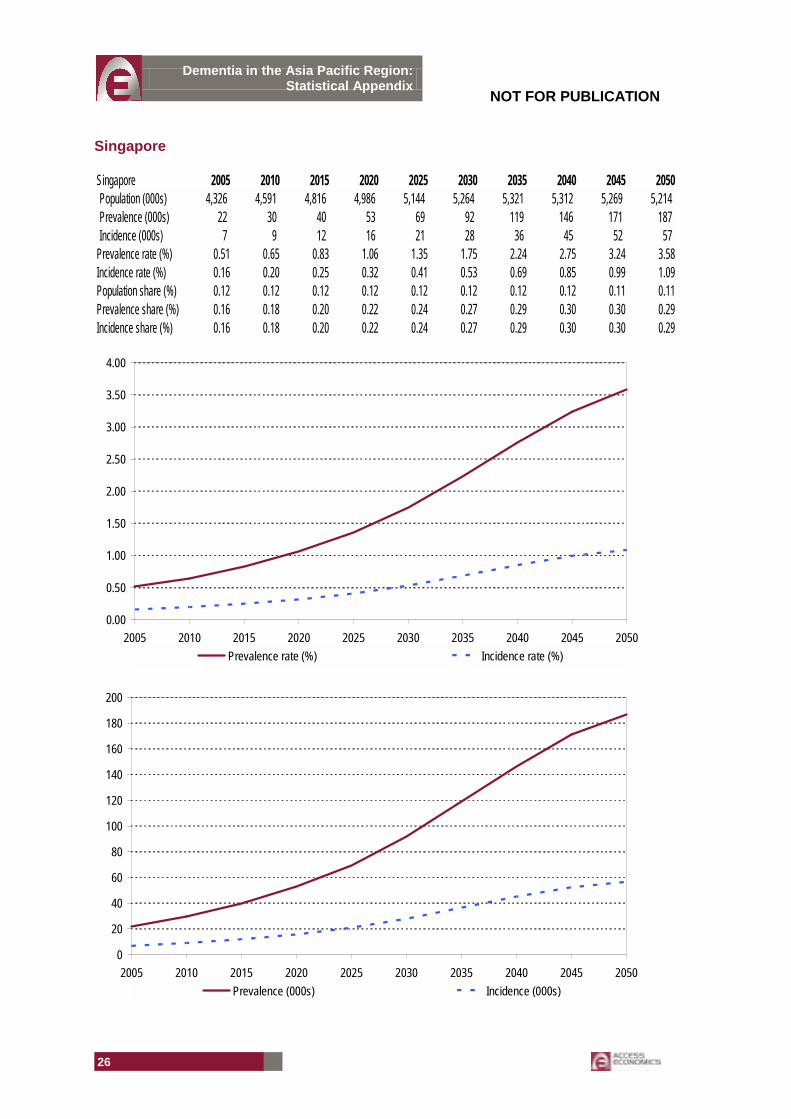
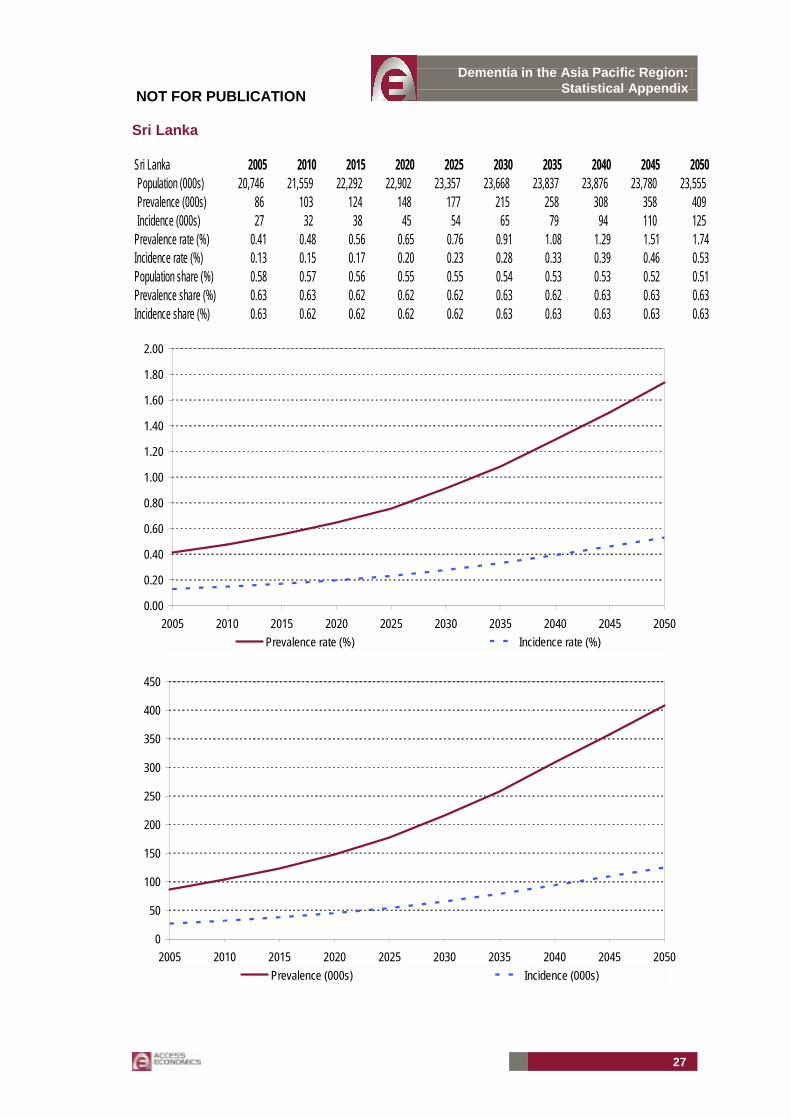
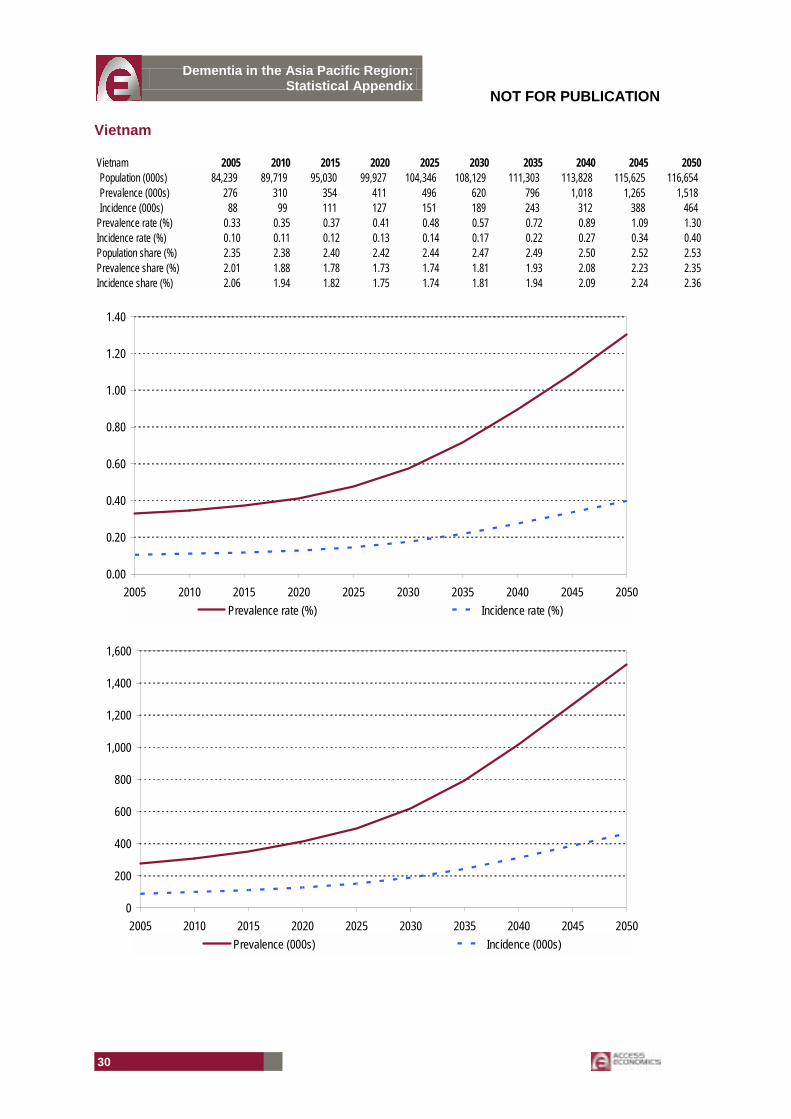
Two figures are also presented for each economy.
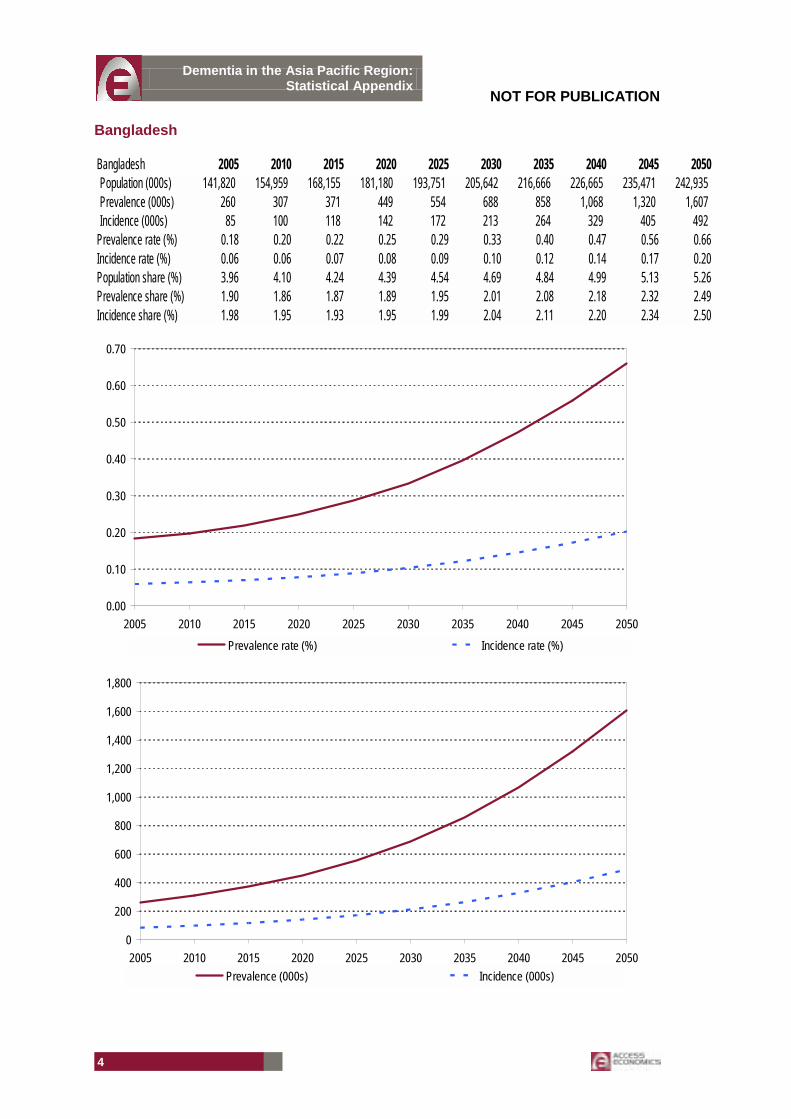
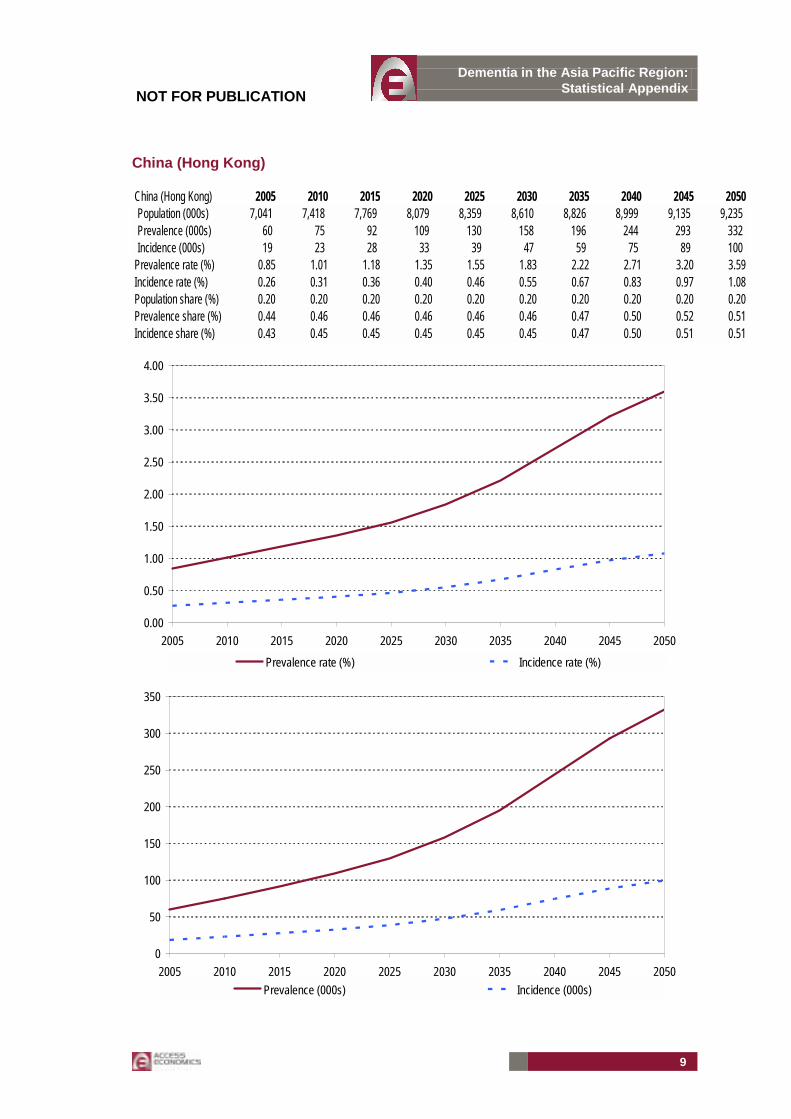
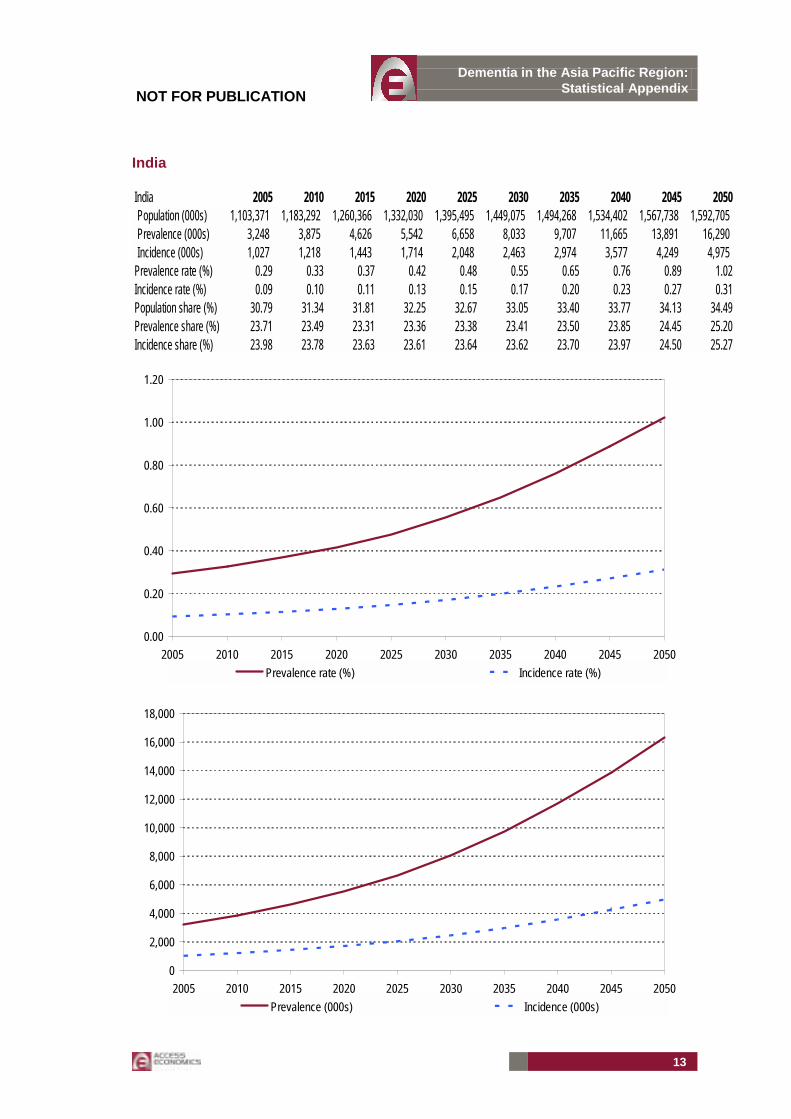
! The first depicts the change in the prevalence rate and incidence rate, as defined above, over the period 2005-2050 (expressed as a percentage).
! The second depicts the change in prevalence and incidence, as defined above, over the period 2005-2050 (expressed in thousands of people).
Every economy experiences an increase in its prevalence rate, incidence rate, prevalence and incidence. However, the rates of change (gradient) and extent of change vary depending on the projected rates of demographic ageing.
Data for the Republic of Korea include official estimates as well as those by Access Economics.

NOT FOR PUBLICATION
Dementia in the Asia Pacific Region: Statistical Appendix
3
Australia
Australia 2005 2010 2015 2020 2025 2030 2035 2040 2045 2050Population (000s) 20,158 21,199 22,249 23,314 24,325 25,239 26,022 26,708 27,336 27,940 Prevalence (000s) 195 229 263 301 350 412 482 552 613 664 Incidence (000s) 60 70 80 91 106 125 147 168 185 200
Prevalence rate (%) 0.97 1.08 1.18 1.29 1.44 1.63 1.85 2.07 2.24 2.38Incidence rate (%) 0.30 0.33 0.36 0.39 0.44 0.50 0.56 0.63 0.68 0.71Population share (%) 0.56 0.56 0.56 0.56 0.57 0.58 0.58 0.59 0.60 0.61Prevalence share (%) 1.43 1.39 1.32 1.27 1.23 1.20 1.17 1.13 1.08 1.03Incidence share (%) 1.41 1.36 1.31 1.25 1.22 1.20 1.17 1.13 1.07 1.01
0.00
0.50
1.00
1.50
2.00
2.50
2005 2010 2015 2020 2025 2030 2035 2040 2045 2050
Prevalence rate (%) Incidence rate (%)
0
100
200
300
400
500
600
700
2005 2010 2015 2020 2025 2030 2035 2040 2045 2050Prevalence (000s) Incidence (000s)
NOT FOR PUBLICATION
Dementia in the Asia Pacific Region: Statistical Appendix
4
Bangladesh
Bangladesh 2005 2010 2015 2020 2025 2030 2035 2040 2045 2050Population (000s) 141,820 154,959 168,155 181,180 193,751 205,642 216,666 226,665 235,471 242,935 Prevalence (000s) 260 307 371 449 554 688 858 1,068 1,320 1,607 Incidence (000s) 85 100 118 142 172 213 264 329 405 492
Prevalence rate (%) 0.18 0.20 0.22 0.25 0.29 0.33 0.40 0.47 0.56 0.66Incidence rate (%) 0.06 0.06 0.07 0.08 0.09 0.10 0.12 0.14 0.17 0.20Population share (%) 3.96 4.10 4.24 4.39 4.54 4.69 4.84 4.99 5.13 5.26Prevalence share (%) 1.90 1.86 1.87 1.89 1.95 2.01 2.08 2.18 2.32 2.49Incidence share (%) 1.98 1.95 1.93 1.95 1.99 2.04 2.11 2.20 2.34 2.50
0.00
0.10
0.20
0.30
0.40
0.50
0.60
0.70
2005 2010 2015 2020 2025 2030 2035 2040 2045 2050
Prevalence rate (%) Incidence rate (%)
0
200
400
600
800
1,000
1,200
1,400
1,600
1,800
2005 2010 2015 2020 2025 2030 2035 2040 2045 2050Prevalence (000s) Incidence (000s)

NOT FOR PUBLICATION
Dementia in the Asia Pacific Region: Statistical Appendix
5
Bhutan
Bhutan 2005 2010 2015 2020 2025 2030 2035 2040 2045 2050Population (000s) 2,159 2,413 2,683 2,950 3,208 3,458 3,702 3,946 4,183 4,392 Prevalence (000s) 5 6 8 9 10 12 14 16 20 25 Incidence (000s) 2 2 2 3 3 4 4 5 6 8
Prevalence rate (%) 0.23 0.26 0.28 0.31 0.32 0.34 0.37 0.42 0.49 0.58Incidence rate (%) 0.07 0.08 0.09 0.10 0.10 0.11 0.12 0.13 0.15 0.18Population share (%) 0.06 0.06 0.07 0.07 0.08 0.08 0.08 0.09 0.09 0.10Prevalence share (%) 0.04 0.04 0.04 0.04 0.04 0.03 0.03 0.03 0.04 0.04Incidence share (%) 0.04 0.04 0.04 0.04 0.04 0.04 0.03 0.03 0.04 0.04
0.00
0.10
0.20
0.30
0.40
0.50
0.60
0.70
2005 2010 2015 2020 2025 2030 2035 2040 2045 2050
Prevalence rate (%) Incidence rate (%)
0
5
10
15
20
25
30
2005 2010 2015 2020 2025 2030 2035 2040 2045 2050Prevalence (000s) Incidence (000s)

NOT FOR PUBLICATION
Dementia in the Asia Pacific Region: Statistical Appendix
6
Brunei Darussalam
Brunei Darussalam 2005 2010 2015 2020 2025 2030 2035 2040 2045 2050Population (000s) 372 413 453 491 526 561 594 628 653 678 Prevalence (000s) 1 1 1 1 2 2 3 5 6 7 Incidence (000s) 0 0 0 0 1 1 1 1 2 2
Prevalence rate (%) 0.15 0.19 0.20 0.27 0.33 0.44 0.54 0.73 0.84 1.05Incidence rate (%) 0.05 0.06 0.06 0.08 0.10 0.14 0.17 0.23 0.26 0.32Population share (%) 0.01 0.01 0.01 0.01 0.01 0.01 0.01 0.01 0.01 0.01Prevalence share (%) 0.00 0.00 0.00 0.01 0.01 0.01 0.01 0.01 0.01 0.01Incidence share (%) 0.00 0.00 0.00 0.01 0.01 0.01 0.01 0.01 0.01 0.01
0.00
0.20
0.40
0.60
0.80
1.00
1.20
2005 2010 2015 2020 2025 2030 2035 2040 2045 2050
Prevalence rate (%) Incidence rate (%)
0
1
2
3
4
5
6
7
8
2005 2010 2015 2020 2025 2030 2035 2040 2045 2050Prevalence (000s) Incidence (000s)

NOT FOR PUBLICATION
Dementia in the Asia Pacific Region: Statistical Appendix
7
Cambodia
Cambodia 2005 2010 2015 2020 2025 2030 2035 2040 2045 2050Population (000s) 14,071 15,526 17,068 18,580 19,989 21,312 22,574 23,791 24,942 25,970 Prevalence (000s) 23 29 37 45 56 70 84 99 119 141 Incidence (000s) 8 9 12 14 18 22 27 31 37 43
Prevalence rate (%) 0.17 0.19 0.21 0.24 0.28 0.33 0.37 0.42 0.48 0.54Incidence rate (%) 0.05 0.06 0.07 0.08 0.09 0.10 0.12 0.13 0.15 0.17Population share (%) 0.39 0.41 0.43 0.45 0.47 0.49 0.50 0.52 0.54 0.56Prevalence share (%) 0.17 0.18 0.18 0.19 0.20 0.20 0.20 0.20 0.21 0.22Incidence share (%) 0.18 0.19 0.19 0.20 0.21 0.21 0.21 0.21 0.21 0.22
0.00
0.10
0.20
0.30
0.40
0.50
0.60
2005 2010 2015 2020 2025 2030 2035 2040 2045 2050
Prevalence rate (%) Incidence rate (%)
0
20
40
60
80
100
120
140
160
2005 2010 2015 2020 2025 2030 2035 2040 2045 2050Prevalence (000s) Incidence (000s)

NOT FOR PUBLICATION
Dementia in the Asia Pacific Region: Statistical Appendix
8
China
China 2005 2010 2015 2020 2025 2030 2035 2040 2045 2050Population (000s) 1,315,844 1,354,533 1,392,981 1,423,936 1,441,430 1,446,454 1,442,973 1,433,434 1,416,925 1,392,309 Prevalence (000s) 5,539 6,647 8,021 9,591 11,646 14,267 17,455 20,748 24,012 26,986 Incidence (000s) 1,720 2,050 2,442 2,915 3,515 4,318 5,288 6,349 7,384 8,264
Prevalence rate (%) 0.42 0.49 0.58 0.67 0.81 0.99 1.21 1.45 1.69 1.94Incidence rate (%) 0.13 0.15 0.18 0.20 0.24 0.30 0.37 0.44 0.52 0.59Population share (%) 36.72 35.87 35.16 34.48 33.74 32.99 32.26 31.55 30.85 30.15Prevalence share (%) 40.42 40.29 40.42 40.42 40.90 41.58 42.26 42.43 42.26 41.75Incidence share (%) 40.17 40.02 39.99 40.14 40.57 41.41 42.14 42.55 42.58 41.97
0.00
0.50
1.00
1.50
2.00
2.50
2005 2010 2015 2020 2025 2030 2035 2040 2045 2050
Prevalence rate (%) Incidence rate (%)
0
5,000
10,000
15,000
20,000
25,000
30,000
2005 2010 2015 2020 2025 2030 2035 2040 2045 2050Prevalence (000s) Incidence (000s)
NOT FOR PUBLICATION
Dementia in the Asia Pacific Region: Statistical Appendix
9
China (Hong Kong)
China (Hong Kong) 2005 2010 2015 2020 2025 2030 2035 2040 2045 2050Population (000s) 7,041 7,418 7,769 8,079 8,359 8,610 8,826 8,999 9,135 9,235 Prevalence (000s) 60 75 92 109 130 158 196 244 293 332 Incidence (000s) 19 23 28 33 39 47 59 75 89 100
Prevalence rate (%) 0.85 1.01 1.18 1.35 1.55 1.83 2.22 2.71 3.20 3.59Incidence rate (%) 0.26 0.31 0.36 0.40 0.46 0.55 0.67 0.83 0.97 1.08Population share (%) 0.20 0.20 0.20 0.20 0.20 0.20 0.20 0.20 0.20 0.20Prevalence share (%) 0.44 0.46 0.46 0.46 0.46 0.46 0.47 0.50 0.52 0.51Incidence share (%) 0.43 0.45 0.45 0.45 0.45 0.45 0.47 0.50 0.51 0.51
0.00
0.50
1.00
1.50
2.00
2.50
3.00
3.50
4.00
2005 2010 2015 2020 2025 2030 2035 2040 2045 2050
Prevalence rate (%) Incidence rate (%)
0
50
100
150
200
250
300
350
2005 2010 2015 2020 2025 2030 2035 2040 2045 2050Prevalence (000s) Incidence (000s)

NOT FOR PUBLICATION
Dementia in the Asia Pacific Region: Statistical Appendix
10
China (Macao)
China (Macao) 2005 2010 2015 2020 2025 2030 2035 2040 2045 2050Population (000s) 462 474 491 510 522 533 535 527 528 521 Prevalence (000s) 3 3 3 5 6 8 11 14 16 18 Incidence (000s) 1 1 1 2 2 2 3 4 5 5
Prevalence rate (%) 0.57 0.60 0.71 1.05 1.16 1.54 2.02 2.58 3.11 3.52Incidence rate (%) 0.18 0.19 0.21 0.31 0.34 0.47 0.62 0.80 0.95 1.05Population share (%) 0.01 0.01 0.01 0.01 0.01 0.01 0.01 0.01 0.01 0.01Prevalence share (%) 0.02 0.02 0.02 0.02 0.02 0.02 0.03 0.03 0.03 0.03Incidence share (%) 0.02 0.02 0.02 0.02 0.02 0.02 0.03 0.03 0.03 0.03
0.00
0.50
1.00
1.50
2.00
2.50
3.00
3.50
4.00
2005 2010 2015 2020 2025 2030 2035 2040 2045 2050
Prevalence rate (%) Incidence rate (%)
0
2
4
6
8
10
12
14
16
18
20
2005 2010 2015 2020 2025 2030 2035 2040 2045 2050Prevalence (000s) Incidence (000s)

NOT FOR PUBLICATION
Dementia in the Asia Pacific Region: Statistical Appendix
11
Democratic People’s Republic of Korea
Democratic People's R 2005 2010 2015 2020 2025 2030 2035 2040 2045 2050Population (000s) 22,487 22,909 23,296 23,723 24,116 24,374 24,455 24,414 24,320 24,191 Prevalence (000s) 77 91 106 126 145 167 189 218 252 288 Incidence (000s) 23 28 33 39 45 50 57 66 77 89
Prevalence rate (%) 0.34 0.40 0.46 0.53 0.60 0.69 0.77 0.89 1.04 1.19Incidence rate (%) 0.10 0.12 0.14 0.16 0.18 0.21 0.23 0.27 0.32 0.37Population share (%) 0.63 0.61 0.59 0.57 0.56 0.56 0.55 0.54 0.53 0.52Prevalence share (%) 0.56 0.55 0.54 0.53 0.51 0.49 0.46 0.45 0.44 0.44Incidence share (%) 0.55 0.54 0.54 0.53 0.51 0.48 0.46 0.44 0.45 0.45
0.00
0.20
0.40
0.60
0.80
1.00
1.20
1.40
2005 2010 2015 2020 2025 2030 2035 2040 2045 2050Prevalence rate (%) Incidence rate (%)
0
50
100
150
200
250
300
350
2005 2010 2015 2020 2025 2030 2035 2040 2045 2050Prevalence (000s) Incidence (000s)

NOT FOR PUBLICATION
Dementia in the Asia Pacific Region: Statistical Appendix
12
East Timor (Timor Leste)
East Timor (Timor Lest 2005 2010 2015 2020 2025 2030 2035 2040 2045 2050Population (000s) 946 1,241 1,488 1,712 1,941 2,172 2,433 2,722 3,004 3,263 Prevalence (000s) 1 1 2 3 3 4 5 6 7 8 Incidence (000s) 0 0 1 1 1 1 2 2 2 3
Prevalence rate (%) 0.13 0.12 0.15 0.15 0.17 0.18 0.19 0.21 0.24 0.26Incidence rate (%) 0.04 0.04 0.05 0.05 0.06 0.06 0.06 0.07 0.08 0.08Population share (%) 0.03 0.03 0.04 0.04 0.05 0.05 0.05 0.06 0.07 0.07Prevalence share (%) 0.01 0.01 0.01 0.01 0.01 0.01 0.01 0.01 0.01 0.01Incidence share (%) 0.01 0.01 0.01 0.01 0.01 0.01 0.01 0.01 0.01 0.01
0.00
0.05
0.10
0.15
0.20
0.25
0.30
2005 2010 2015 2020 2025 2030 2035 2040 2045 2050Prevalence rate (%) Incidence rate (%)
0
1
2
3
4
5
6
7
8
9
2005 2010 2015 2020 2025 2030 2035 2040 2045 2050Prevalence (000s) Incidence (000s)
NOT FOR PUBLICATION
Dementia in the Asia Pacific Region: Statistical Appendix
13
India
India 2005 2010 2015 2020 2025 2030 2035 2040 2045 2050Population (000s) 1,103,371 1,183,292 1,260,366 1,332,030 1,395,495 1,449,075 1,494,268 1,534,402 1,567,738 1,592,705 Prevalence (000s) 3,248 3,875 4,626 5,542 6,658 8,033 9,707 11,665 13,891 16,290 Incidence (000s) 1,027 1,218 1,443 1,714 2,048 2,463 2,974 3,577 4,249 4,975
Prevalence rate (%) 0.29 0.33 0.37 0.42 0.48 0.55 0.65 0.76 0.89 1.02Incidence rate (%) 0.09 0.10 0.11 0.13 0.15 0.17 0.20 0.23 0.27 0.31Population share (%) 30.79 31.34 31.81 32.25 32.67 33.05 33.40 33.77 34.13 34.49Prevalence share (%) 23.71 23.49 23.31 23.36 23.38 23.41 23.50 23.85 24.45 25.20Incidence share (%) 23.98 23.78 23.63 23.61 23.64 23.62 23.70 23.97 24.50 25.27
0.00
0.20
0.40
0.60
0.80
1.00
1.20
2005 2010 2015 2020 2025 2030 2035 2040 2045 2050Prevalence rate (%) Incidence rate (%)
0
2,000
4,000
6,000
8,000
10,000
12,000
14,000
16,000
18,000
2005 2010 2015 2020 2025 2030 2035 2040 2045 2050Prevalence (000s) Incidence (000s)

NOT FOR PUBLICATION
Dementia in the Asia Pacific Region: Statistical Appendix
14
Indonesia
Indonesia 2005 2010 2015 2020 2025 2030 2035 2040 2045 2050Population (000s) 222,778 235,756 246,813 255,849 263,745 270,845 276,851 281,211 283,758 284,638 Prevalence (000s) 606 726 863 1,017 1,193 1,419 1,729 2,122 2,570 3,042 Incidence (000s) 191 229 270 314 365 432 527 646 785 932
Prevalence rate (%) 0.27 0.31 0.35 0.40 0.45 0.52 0.62 0.75 0.91 1.07Incidence rate (%) 0.09 0.10 0.11 0.12 0.14 0.16 0.19 0.23 0.28 0.33Population share (%) 6.22 6.24 6.23 6.19 6.17 6.18 6.19 6.19 6.18 6.16Prevalence share (%) 4.42 4.40 4.35 4.29 4.19 4.14 4.19 4.34 4.52 4.71Incidence share (%) 4.47 4.47 4.42 4.32 4.22 4.14 4.20 4.33 4.53 4.73
0.00
0.20
0.40
0.60
0.80
1.00
1.20
2005 2010 2015 2020 2025 2030 2035 2040 2045 2050Prevalence rate (%) Incidence rate (%)
0
500
1,000
1,500
2,000
2,500
3,000
3,500
2005 2010 2015 2020 2025 2030 2035 2040 2045 2050Prevalence (000s) Incidence (000s)
NOT FOR PUBLICATION
Dementia in the Asia Pacific Region: Statistical Appendix
15
Japan
Japan 2005 2010 2015 2020 2025 2030 2035 2040 2045 2050Population (000s) 128,088 128,459 127,992 126,716 124,817 122,567 120,138 117,625 114,984 112,200 Prevalence (000s) 1,871 2,309 2,776 3,251 3,694 4,103 4,455 4,703 4,814 4,873 Incidence (000s) 570 700 843 983 1,114 1,227 1,321 1,384 1,395 1,418
Prevalence rate (%) 1.46 1.80 2.17 2.57 2.96 3.35 3.71 4.00 4.19 4.34Incidence rate (%) 0.45 0.54 0.66 0.78 0.89 1.00 1.10 1.18 1.21 1.26Population share (%) 3.57 3.40 3.23 3.07 2.92 2.80 2.69 2.59 2.50 2.43Prevalence share (%) 13.65 14.00 13.99 13.70 12.97 11.96 10.79 9.62 8.47 7.54Incidence share (%) 13.32 13.67 13.80 13.54 12.86 11.76 10.53 9.28 8.05 7.20
0.00
0.50
1.00
1.50
2.00
2.50
3.00
3.50
4.00
4.50
5.00
2005 2010 2015 2020 2025 2030 2035 2040 2045 2050Prevalence rate (%) Incidence rate (%)
0
1,000
2,000
3,000
4,000
5,000
6,000
2005 2010 2015 2020 2025 2030 2035 2040 2045 2050Prevalence (000s) Incidence (000s)

NOT FOR PUBLICATION
Dementia in the Asia Pacific Region: Statistical Appendix
16
Laos
Laos 2005 2010 2015 2020 2025 2030 2035 2040 2045 2050Population (000s) 5,922 6,604 7,305 8,011 8,709 9,391 10,034 10,623 11,144 11,587 Prevalence (000s) 11 13 15 17 20 25 31 38 47 57 Incidence (000s) 4 4 5 5 7 8 10 12 14 18
Prevalence rate (%) 0.19 0.19 0.20 0.21 0.23 0.27 0.31 0.36 0.42 0.49Incidence rate (%) 0.06 0.06 0.07 0.07 0.07 0.09 0.10 0.11 0.13 0.15Population share (%) 0.17 0.17 0.18 0.19 0.20 0.21 0.22 0.23 0.24 0.25Prevalence share (%) 0.08 0.08 0.07 0.07 0.07 0.07 0.08 0.08 0.08 0.09Incidence share (%) 0.09 0.08 0.08 0.08 0.08 0.08 0.08 0.08 0.08 0.09
0.00
0.10
0.20
0.30
0.40
0.50
0.60
2005 2010 2015 2020 2025 2030 2035 2040 2045 2050Prevalence rate (%) Incidence rate (%)
0
10
20
30
40
50
60
70
2005 2010 2015 2020 2025 2030 2035 2040 2045 2050Prevalence (000s) Incidence (000s)

NOT FOR PUBLICATION
Dementia in the Asia Pacific Region: Statistical Appendix
17
Malaysia
Malaysia 2005 2010 2015 2020 2025 2030 2035 2040 2045 2050Population (000s) 25,347 27,532 29,557 31,472 33,221 34,725 36,038 37,182 38,144 38,926 Prevalence (000s) 63 79 100 127 163 207 261 323 388 454 Incidence (000s) 20 25 31 39 50 64 80 99 119 139
Prevalence rate (%) 0.25 0.29 0.34 0.40 0.49 0.60 0.73 0.87 1.02 1.17Incidence rate (%) 0.08 0.09 0.10 0.12 0.15 0.18 0.22 0.27 0.31 0.36Population share (%) 0.71 0.73 0.75 0.76 0.78 0.79 0.81 0.82 0.83 0.84Prevalence share (%) 0.46 0.48 0.50 0.53 0.57 0.60 0.63 0.66 0.68 0.70Incidence share (%) 0.47 0.48 0.51 0.54 0.58 0.61 0.64 0.67 0.69 0.70
0.00
0.20
0.40
0.60
0.80
1.00
1.20
1.40
2005 2010 2015 2020 2025 2030 2035 2040 2045 2050Prevalence rate (%) Incidence rate (%)
0
50
100
150
200
250
300
350
400
450
500
2005 2010 2015 2020 2025 2030 2035 2040 2045 2050Prevalence (000s) Incidence (000s)

NOT FOR PUBLICATION
Dementia in the Asia Pacific Region: Statistical Appendix
18
Myanmar
Myanmar 2005 2010 2015 2020 2025 2030 2035 2040 2045 2050Population (000s) 50,518 52,802 54,972 57,055 59,001 60,629 61,864 62,744 63,339 63,660 Prevalence (000s) 148 172 202 242 295 364 446 542 647 764 Incidence (000s) 47 54 63 75 91 112 137 165 197 233
Prevalence rate (%) 0.29 0.33 0.37 0.42 0.50 0.60 0.72 0.86 1.02 1.20Incidence rate (%) 0.09 0.10 0.11 0.13 0.15 0.18 0.22 0.26 0.31 0.37Population share (%) 1.41 1.40 1.39 1.38 1.38 1.38 1.38 1.38 1.38 1.38Prevalence share (%) 1.08 1.05 1.02 1.02 1.04 1.06 1.08 1.11 1.14 1.18Incidence share (%) 1.10 1.06 1.03 1.03 1.05 1.07 1.09 1.11 1.14 1.18
0.00
0.20
0.40
0.60
0.80
1.00
1.20
1.40
2005 2010 2015 2020 2025 2030 2035 2040 2045 2050Prevalence rate (%) Incidence rate (%)
0
100
200
300
400
500
600
700
800
900
2005 2010 2015 2020 2025 2030 2035 2040 2045 2050Prevalence (000s) Incidence (000s)

NOT FOR PUBLICATION
Dementia in the Asia Pacific Region: Statistical Appendix
19
Nepal
Nepal 2005 2010 2015 2020 2025 2030 2035 2040 2045 2050Population (000s) 27,130 29,894 32,747 35,680 38,598 41,425 44,115 46,658 49,028 51,172 Prevalence (000s) 50 59 71 84 100 122 147 179 219 270 Incidence (000s) 16 19 23 27 32 38 46 56 68 83
Prevalence rate (%) 0.18 0.20 0.22 0.24 0.26 0.29 0.33 0.38 0.45 0.53Incidence rate (%) 0.06 0.06 0.07 0.08 0.08 0.09 0.10 0.12 0.14 0.16Population share (%) 0.76 0.79 0.83 0.86 0.90 0.94 0.99 1.03 1.07 1.11Prevalence share (%) 0.37 0.36 0.36 0.36 0.35 0.35 0.36 0.37 0.39 0.42Incidence share (%) 0.38 0.38 0.37 0.37 0.37 0.37 0.37 0.37 0.39 0.42
0.00
0.10
0.20
0.30
0.40
0.50
0.60
2005 2010 2015 2020 2025 2030 2035 2040 2045 2050Prevalence rate (%) Incidence rate (%)
0
50
100
150
200
250
300
2005 2010 2015 2020 2025 2030 2035 2040 2045 2050Prevalence (000s) Incidence (000s)

NOT FOR PUBLICATION
Dementia in the Asia Pacific Region: Statistical Appendix
20
New Zealand
New Zealand 2005 2010 2015 2020 2025 2030 2035 2040 2045 2050Population (000s) 4,028 4,168 4,301 4,424 4,538 4,637 4,705 4,749 4,772 4,790 Prevalence (000s) 38 43 49 55 64 75 87 99 109 118 Incidence (000s) 12 13 15 17 19 23 27 30 33 35
Prevalence rate (%) 0.95 1.04 1.13 1.23 1.40 1.62 1.86 2.09 2.29 2.46Incidence rate (%) 0.29 0.32 0.34 0.37 0.43 0.49 0.57 0.64 0.70 0.74Population share (%) 0.11 0.11 0.11 0.11 0.11 0.11 0.11 0.10 0.10 0.10Prevalence share (%) 0.28 0.26 0.25 0.23 0.22 0.22 0.21 0.20 0.19 0.18Incidence share (%) 0.28 0.26 0.24 0.23 0.22 0.22 0.21 0.20 0.19 0.18
0.00
0.50
1.00
1.50
2.00
2.50
3.00
2005 2010 2015 2020 2025 2030 2035 2040 2045 2050Prevalence rate (%) Incidence rate (%)
0
20
40
60
80
100
120
140
2005 2010 2015 2020 2025 2030 2035 2040 2045 2050Prevalence (000s) Incidence (000s)

NOT FOR PUBLICATION
Dementia in the Asia Pacific Region: Statistical Appendix
21
Pakistan
Pakistan 2005 2010 2015 2020 2025 2030 2035 2040 2045 2050Population (000s) 157,934 175,179 193,422 211,704 229,354 246,318 262,611 277,995 292,209 304,699 Prevalence (000s) 330 394 471 567 687 839 1,034 1,275 1,566 1,916 Incidence (000s) 107 127 151 179 216 263 323 396 482 584
Prevalence rate (%) 0.21 0.22 0.24 0.27 0.30 0.34 0.39 0.46 0.54 0.63Incidence rate (%) 0.07 0.07 0.08 0.08 0.09 0.11 0.12 0.14 0.16 0.19Population share (%) 4.41 4.64 4.88 5.13 5.37 5.62 5.87 6.12 6.36 6.60Prevalence share (%) 2.41 2.39 2.38 2.39 2.41 2.45 2.50 2.61 2.76 2.96Incidence share (%) 2.51 2.48 2.47 2.47 2.49 2.52 2.57 2.65 2.78 2.97
0.00
0.10
0.20
0.30
0.40
0.50
0.60
0.70
2005 2010 2015 2020 2025 2030 2035 2040 2045 2050Prevalence rate (%) Incidence rate (%)

NOT FOR PUBLICATION
Dementia in the Asia Pacific Region: Statistical Appendix
22
0
500
1,000
1,500
2,000
2,500
2005 2010 2015 2020 2025 2030 2035 2040 2045 2050Prevalence (000s) Incidence (000s)
Papua New Guinea
Papua New Guinea 2005 2010 2015 2020 2025 2030 2035 2040 2045 2050Population (000s) 5,887 6,448 7,012 7,602 8,205 8,784 9,308 9,783 10,223 10,619 Prevalence (000s) 7 8 10 12 15 19 23 30 38 46 Incidence (000s) 2 3 3 4 5 6 7 9 12 14
Prevalence rate (%) 0.12 0.12 0.14 0.16 0.18 0.21 0.25 0.30 0.37 0.43Incidence rate (%) 0.04 0.04 0.05 0.05 0.06 0.07 0.08 0.09 0.11 0.13Population share (%) 0.16 0.17 0.18 0.18 0.19 0.20 0.21 0.22 0.22 0.23Prevalence share (%) 0.05 0.05 0.05 0.05 0.05 0.05 0.06 0.06 0.07 0.07Incidence share (%) 0.05 0.05 0.05 0.05 0.05 0.06 0.06 0.06 0.07 0.07
p
0.00
0.05
0.10
0.15
0.20
0.25
0.30
0.35
0.40
0.45
0.50
2005 2010 2015 2020 2025 2030 2035 2040 2045 2050Prevalence rate (%) Incidence rate (%)

NOT FOR PUBLICATION
Dementia in the Asia Pacific Region: Statistical Appendix
23
0
5
10
15
20
25
30
35
40
45
50
2005 2010 2015 2020 2025 2030 2035 2040 2045 2050Prevalence (000s) Incidence (000s)
Philippines
Philippines 2005 2010 2015 2020 2025 2030 2035 2040 2045 2050Population (000s) 83,054 90,046 96,838 103,267 109,085 114,083 118,192 121,752 124,753 127,070 Prevalence (000s) 170 205 252 316 399 501 629 779 955 1,159 Incidence (000s) 55 66 80 99 124 155 194 239 293 354
Prevalence rate (%) 0.20 0.23 0.26 0.31 0.37 0.44 0.53 0.64 0.77 0.91Incidence rate (%) 0.07 0.07 0.08 0.10 0.11 0.14 0.16 0.20 0.23 0.28Population share (%) 2.32 2.38 2.44 2.50 2.55 2.60 2.64 2.68 2.72 2.75Prevalence share (%) 1.24 1.24 1.27 1.33 1.40 1.46 1.52 1.59 1.68 1.79Incidence share (%) 1.28 1.28 1.31 1.37 1.43 1.49 1.54 1.60 1.69 1.80
0.00
0.10
0.20
0.30
0.40
0.50
0.60
0.70
0.80
0.90
1.00
2005 2010 2015 2020 2025 2030 2035 2040 2045 2050Prevalence rate (%) Incidence rate (%)

NOT FOR PUBLICATION
Dementia in the Asia Pacific Region: Statistical Appendix
24
pp
0
200
400
600
800
1,000
1,200
1,400
2005 2010 2015 2020 2025 2030 2035 2040 2045 2050Prevalence (000s) Incidence (000s)
Republic of Korea
Official estimates Republic of Korea 2005 2010 2015 2020 2025 2030 2035 2040 2045 2050Population (000s) 48,290 na na na na na na na na 42,348 Prevalence (000s) 360 na 580 650 na na na na na na
Access Economics estimates based on UN data Republic of Korea 2005 2010 2015 2020 2025 2030 2035 2040 2045 2050Population (000s) 47,816 48,564 49,092 49,392 49,457 49,163 48,451 47,403 46,111 44,632 Prevalence (000s) 246 324 421 542 680 835 1,004 1,194 1,394 1,570 Incidence (000s) 76 99 129 164 206 251 303 362 422 475
Prevalence rate (%) 0.52 0.67 0.86 1.10 1.37 1.70 2.07 2.52 3.02 3.52Incidence rate (%) 0.16 0.20 0.26 0.33 0.42 0.51 0.63 0.76 0.92 1.07Population share (%) 1.33 1.29 1.24 1.20 1.16 1.12 1.08 1.04 1.00 0.97Prevalence share (%) 1.80 1.96 2.12 2.29 2.39 2.43 2.43 2.44 2.45 2.43Incidence share (%) 1.76 1.94 2.11 2.26 2.37 2.41 2.41 2.42 2.44 2.41

NOT FOR PUBLICATION
Dementia in the Asia Pacific Region: Statistical Appendix
25
0.00
0.50
1.00
1.50
2.00
2.50
3.00
3.50
4.00
2005 2010 2015 2020 2025 2030 2035 2040 2045 2050Prevalence rate (%) Incidence rate (%)
0
200
400
600
800
1,000
1,200
1,400
1,600
1,800
2005 2010 2015 2020 2025 2030 2035 2040 2045 2050Prevalence (000s) Incidence (000s)
NOT FOR PUBLICATION
Dementia in the Asia Pacific Region: Statistical Appendix
26
Singapore
Singapore 2005 2010 2015 2020 2025 2030 2035 2040 2045 2050Population (000s) 4,326 4,591 4,816 4,986 5,144 5,264 5,321 5,312 5,269 5,214 Prevalence (000s) 22 30 40 53 69 92 119 146 171 187 Incidence (000s) 7 9 12 16 21 28 36 45 52 57
Prevalence rate (%) 0.51 0.65 0.83 1.06 1.35 1.75 2.24 2.75 3.24 3.58Incidence rate (%) 0.16 0.20 0.25 0.32 0.41 0.53 0.69 0.85 0.99 1.09Population share (%) 0.12 0.12 0.12 0.12 0.12 0.12 0.12 0.12 0.11 0.11Prevalence share (%) 0.16 0.18 0.20 0.22 0.24 0.27 0.29 0.30 0.30 0.29Incidence share (%) 0.16 0.18 0.20 0.22 0.24 0.27 0.29 0.30 0.30 0.29
0.00
0.50
1.00
1.50
2.00
2.50
3.00
3.50
4.00
2005 2010 2015 2020 2025 2030 2035 2040 2045 2050Prevalence rate (%) Incidence rate (%)
0
20
40
60
80
100
120
140
160
180
200
2005 2010 2015 2020 2025 2030 2035 2040 2045 2050Prevalence (000s) Incidence (000s)
NOT FOR PUBLICATION
Dementia in the Asia Pacific Region: Statistical Appendix
27
Sri Lanka
Sri Lanka 2005 2010 2015 2020 2025 2030 2035 2040 2045 2050Population (000s) 20,746 21,559 22,292 22,902 23,357 23,668 23,837 23,876 23,780 23,555 Prevalence (000s) 86 103 124 148 177 215 258 308 358 409 Incidence (000s) 27 32 38 45 54 65 79 94 110 125
Prevalence rate (%) 0.41 0.48 0.56 0.65 0.76 0.91 1.08 1.29 1.51 1.74Incidence rate (%) 0.13 0.15 0.17 0.20 0.23 0.28 0.33 0.39 0.46 0.53Population share (%) 0.58 0.57 0.56 0.55 0.55 0.54 0.53 0.53 0.52 0.51Prevalence share (%) 0.63 0.63 0.62 0.62 0.62 0.63 0.62 0.63 0.63 0.63Incidence share (%) 0.63 0.62 0.62 0.62 0.62 0.63 0.63 0.63 0.63 0.63
0.00
0.20
0.40
0.60
0.80
1.00
1.20
1.40
1.60
1.80
2.00
2005 2010 2015 2020 2025 2030 2035 2040 2045 2050Prevalence rate (%) Incidence rate (%)
0
50
100
150
200
250
300
350
400
450
2005 2010 2015 2020 2025 2030 2035 2040 2045 2050Prevalence (000s) Incidence (000s)

NOT FOR PUBLICATION
Dementia in the Asia Pacific Region: Statistical Appendix
28
TADA Chinese Taipei
TADA Chinese Tapiei 2005 2010 2015 2020 2025 2030 2035 2040 2045 2050Population (000s) 22,745 23,331 23,611 23,760 23,713 23,435 22,896 22,108 21,088 19,900 Prevalence (000s) 138 168 205 253 310 379 461 549 620 659 Incidence (000s) 43 52 63 77 93 115 140 168 189 199
Prevalence rate (%) 0.61 0.72 0.87 1.07 1.31 1.62 2.01 2.48 2.94 3.31Incidence rate (%) 0.19 0.22 0.27 0.32 0.39 0.49 0.61 0.76 0.90 1.00Population share (%) 0.63 0.62 0.60 0.58 0.56 0.53 0.51 0.49 0.46 0.43Prevalence share (%) 1.01 1.02 1.04 1.07 1.09 1.11 1.12 1.12 1.09 1.02Incidence share (%) 1.01 1.01 1.03 1.05 1.08 1.10 1.12 1.12 1.09 1.01
0.00
0.50
1.00
1.50
2.00
2.50
3.00
3.50
2005 2010 2015 2020 2025 2030 2035 2040 2045 2050Prevalence rate (%) Incidence rate (%)
0
100
200
300
400
500
600
700
2005 2010 2015 2020 2025 2030 2035 2040 2045 2050Prevalence (000s) Incidence (000s)

NOT FOR PUBLICATION
Dementia in the Asia Pacific Region: Statistical Appendix
29
Thailand
Thailand 2005 2010 2015 2020 2025 2030 2035 2040 2045 2050Population (000s) 64,232 66,784 69,063 71,044 72,633 73,833 74,610 74,966 74,938 74,596 Prevalence (000s) 229 289 362 450 553 674 815 966 1,109 1,233 Incidence (000s) 71 89 111 137 168 206 250 296 340 377
Prevalence rate (%) 0.36 0.43 0.52 0.63 0.76 0.91 1.09 1.29 1.48 1.65Incidence rate (%) 0.11 0.13 0.16 0.19 0.23 0.28 0.33 0.40 0.45 0.51Population share (%) 1.79 1.77 1.74 1.72 1.70 1.68 1.67 1.65 1.63 1.62Prevalence share (%) 1.67 1.75 1.83 1.90 1.94 1.96 1.97 1.97 1.95 1.91Incidence share (%) 1.67 1.75 1.82 1.89 1.94 1.97 1.99 1.99 1.96 1.92
0.00
0.20
0.40
0.60
0.80
1.00
1.20
1.40
1.60
1.80
2005 2010 2015 2020 2025 2030 2035 2040 2045 2050Prevalence rate (%) Incidence rate (%)
0
200
400
600
800
1,000
1,200
1,400
2005 2010 2015 2020 2025 2030 2035 2040 2045 2050Prevalence (000s) Incidence (000s)
NOT FOR PUBLICATION
Dementia in the Asia Pacific Region: Statistical Appendix
30
Vietnam
Vietnam 2005 2010 2015 2020 2025 2030 2035 2040 2045 2050Population (000s) 84,239 89,719 95,030 99,927 104,346 108,129 111,303 113,828 115,625 116,654 Prevalence (000s) 276 310 354 411 496 620 796 1,018 1,265 1,518 Incidence (000s) 88 99 111 127 151 189 243 312 388 464
Prevalence rate (%) 0.33 0.35 0.37 0.41 0.48 0.57 0.72 0.89 1.09 1.30Incidence rate (%) 0.10 0.11 0.12 0.13 0.14 0.17 0.22 0.27 0.34 0.40Population share (%) 2.35 2.38 2.40 2.42 2.44 2.47 2.49 2.50 2.52 2.53Prevalence share (%) 2.01 1.88 1.78 1.73 1.74 1.81 1.93 2.08 2.23 2.35Incidence share (%) 2.06 1.94 1.82 1.75 1.74 1.81 1.94 2.09 2.24 2.36
0.00
0.20
0.40
0.60
0.80
1.00
1.20
1.40
2005 2010 2015 2020 2025 2030 2035 2040 2045 2050Prevalence rate (%) Incidence rate (%)
0
200
400
600
800
1,000
1,200
1,400
1,600
2005 2010 2015 2020 2025 2030 2035 2040 2045 2050Prevalence (000s) Incidence (000s)
NOT FOR PUBLICATION
Dementia in the Asia Pacific Region: Statistical Appendix
31
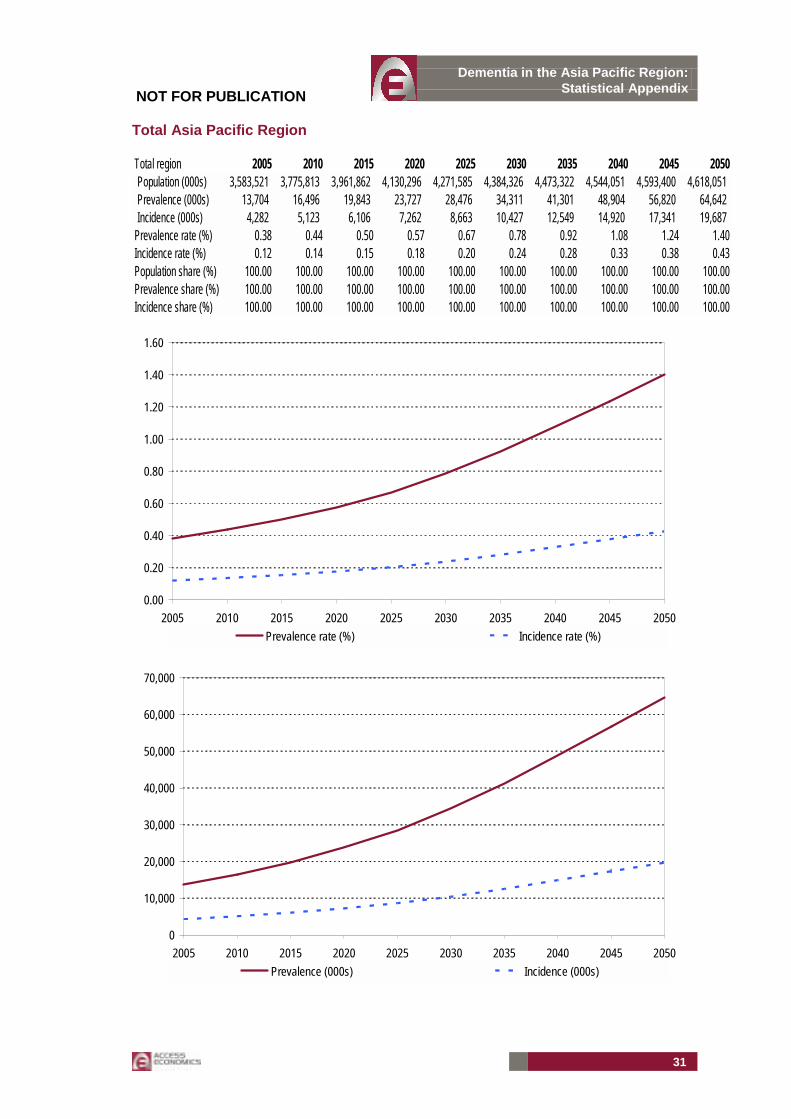
Total Asia Pacific Region
Total region 2005 2010 2015 2020 2025 2030 2035 2040 2045 2050Population (000s) 3,583,521 3,775,813 3,961,862 4,130,296 4,271,585 4,384,326 4,473,322 4,544,051 4,593,400 4,618,051 Prevalence (000s) 13,704 16,496 19,843 23,727 28,476 34,311 41,301 48,904 56,820 64,642 Incidence (000s) 4,282 5,123 6,106 7,262 8,663 10,427 12,549 14,920 17,341 19,687
Prevalence rate (%) 0.38 0.44 0.50 0.57 0.67 0.78 0.92 1.08 1.24 1.40Incidence rate (%) 0.12 0.14 0.15 0.18 0.20 0.24 0.28 0.33 0.38 0.43Population share (%) 100.00 100.00 100.00 100.00 100.00 100.00 100.00 100.00 100.00 100.00Prevalence share (%) 100.00 100.00 100.00 100.00 100.00 100.00 100.00 100.00 100.00 100.00Incidence share (%) 100.00 100.00 100.00 100.00 100.00 100.00 100.00 100.00 100.00 100.00
0.00
0.20
0.40
0.60
0.80
1.00
1.20
1.40
1.60
2005 2010 2015 2020 2025 2030 2035 2040 2045 2050Prevalence rate (%) Incidence rate (%)
0
10,000
20,000
30,000
40,000
50,000
60,000
70,000
2005 2010 2015 2020 2025 2030 2035 2040 2045 2050Prevalence (000s) Incidence (000s)

NOT FOR PUBLICATION
Dementia in the Asia Pacific Region: Statistical Appendix
32
TOTAL PREVALENCE IN 2005 AND 2050
Total prevalence in 2005 - 13.7 millionAustralia (0.20)Bangladesh (0.26)Bhutan (0.01)Brunei Darussalam (0.00)Cambodia (0.02)China (5.54)China (Hong Kong) (0.06)China (Macao) (0.00)TADA Chinese Tapiei (0.14)Democratic People's Republic of Korea (0.08)East Timor (Timor Leste) (0.00)India (3.25)Indonesia (0.61)Japan (1.87)Laos (0.01)Malaysia (0.06)Myanmar (0.15)Nepal (0.05)New Zealand (0.04)Pakistan (0.33)Papua New Guinea (0.01)Philippines (0.17)Republic of Korea (0.25)Singapore (0.02)Sri Lanka (0.09)Thailand (0.23)Vietnam (0.28)
Total prevalence in 2050 - 64.6 millionAustralia (0.66)Bangladesh (1.61)Bhutan (0.03)Brunei Darussalam (0.01)Cambodia (0.14)China (26.99)China (Hong Kong) (0.33)China (Macao) (0.02)TADA Chinese Tapiei (0.66)Democratic People's Republic of Korea (0.29)East Timor (Timor Leste) (0.01)India (16.29)Indonesia (3.04)Japan (4.87)Laos (0.06)Malaysia (0.45)Myanmar (0.76)Nepal (0.27)New Zealand (0.12)Pakistan (1.92)Papua New Guinea (0.05)Philippines (1.16)Republic of Korea (1.57)Singapore (0.19)Sri Lanka (0.41)Thailand (1.23)Vietnam (1.52)

NOT FOR PUBLICATION
Dementia in the Asia Pacific Region: Statistical Appendix
33
TOTAL INCIDENCE IN 2005 AND 2050
Total incidence in 2005 - 4.3 millionAustralia (0.06)Bangladesh (0.08)Bhutan (0.00)Brunei Darussalam (0.00)Cambodia (0.01)China (1.72)China (Hong Kong) (0.02)China (Macao) (0.00)TADA Chinese Tapiei (0.04)Democratic People's Republic of Korea (0.02)East Timor (Timor Leste) (0.00)India (1.03)Indonesia (0.19)Japan (0.57)Laos (0.00)Malaysia (0.02)Myanmar (0.05)Nepal (0.02)New Zealand (0.01)Pakistan (0.11)Papua New Guinea (0.00)Philippines (0.05)Republic of Korea (0.08)Singapore (0.01)Sri Lanka (0.03)Thailand (0.07)Vietnam (0.09)
Total incidence in 2050 - 19.7 millionAustralia (0.20)Bangladesh (0.49)Bhutan (0.01)Brunei Darussalam (0.00)Cambodia (0.04)China (8.26)China (Hong Kong) (0.10)China (Macao) (0.01)TADA Chinese Tapiei (0.20)Democratic People's Republic of Korea (0.09)East Timor (Timor Leste) (0.00)India (4.97)Indonesia (0.93)Japan (1.42)Laos (0.02)Malaysia (0.14)Myanmar (0.23)Nepal (0.08)New Zealand (0.04)Pakistan (0.58)Papua New Guinea (0.01)Philippines (0.35)Republic of Korea (0.48)Singapore (0.06)Sri Lanka (0.12)Thailand (0.38)Vietnam (0.46)