srp812 1998 turfgrass research
TRANSCRIPT

KANSAS STATE UNIVERSITY AGRICULTURAL EXPERIMENT STATION AND COOPERATIVE EXTENSION SERVICE
1998TURFGRASSRESEARCH
Report of Progress 812
This publication from the Kansas State University Agricultural Experiment Station and Cooperative Extension Service has been archived. Current information is available from http://www.ksre.ksu.edu.

FOREWORDAll years have their low points, and this was no exception. We were all saddened by the
passing of Dr. John Pair on January 24, 1998. Dr. Pair had been an important member of ourturfgrass team. His professional career at K-State spanned 32 years, plus 5 years as a graduatestudent. His research accomplishments in ornamentals and turfgrass were substantial. Dr. Pairworked tirelessly on the development of Midlawn and Midfield bermudagrasses. He contributedgreatly to our knowledge of turfgrass adaptation in the Midwest through evaluation of cultivarsbest adapted to this region. In the ornamentals area, he was widely recognized as an expert inspecies adaptation and worked extensively on development of Osage orange and dogwoodselections. Dr. Pair was a true plantsman, who was as comfortable in discussions withnurserymen as he was with golf course superintendents. Such individuals are few and farbetween. We will all miss John dearly!
On a more positive note, 1997 was a successful research year. Not only were numerousstudies initiated and completed, as evidenced by the work reported herein, but we were alsosuccessful in obtaining funding for future work. K-State received four grants from the UnitedStates Golf Association in 1997. Dr. Bingru Huang got funding for at least 1 year to work onmanaging creeping bentgrass through our summer stress periods. Dr. Ned Tisserat receivedfunding for a 3-year project on the biology and management of spring dead spot in bermudagrass. Two projects also were funded in Civil Engineering and Agronomy that involve environmentalstudies related to the construction of Colbert Hills Golf Course in Manhattan.
We are all looking forward to the development of Colbert Hills, a new, $10 million,18-hole, championship golf course in the rolling Flint Hills about 5 miles west of the K-Statecampus. The PGA TOUR will oversee management of the facility. Scheduled for completion in2000, Colbert Hills will serve the university, community, and state in a multitude of ways otherthan as a daily-fee golf course, including: 1) as a practice and tournament course for the K-Stategolf teams; 3) as host for a skills-based youth golf academy; 3) as a research facility to study theenvironmental impact of golf courses on natural resources and evaluate best managementpractices for turfgrass culture in the Midwest; and 4) as a resident course where K State studentspursuing the golf course superintendent profession can gain hands-on classroom and internshipexperience. Tentative approval also has been granted for a classroom/laboratory/office facilityadjacent to the maintenance building for use by researchers working on site.
Of significance to all golf course superintendents in the state is the development of a newGolf Course Management education program that will begin at K-State in Fall, 1998. This is thefirst program of its kind in the U.S. that places a strong emphasis on business and communicationskills and also includes course work in hospitality management. Graduates of the new programthat go to 18-hole facilities will be familiar with responsibilities and goals of managers involved inbusiness, hospitality, and food service operations. Graduates also should be highly employable at9-hole facilities, where retaining a specialist in all areas of course operation is not practical oraffordable. Furthermore, superintendents trained in this program should have the credentials tocompete for a position as general manager later in their careers.
Keep this research report in handy place--it can be useful all year long. This information, andmore, is also available on our web page at http://www.oznet.ksu.edu/dp_hfrr/turf/welcome.htm
Please let us know if we can address your turf management concerns. We strive to make ourresearch projects emphasize the problems we consider most important to Kansas turfgrass managers.
The K-State Turf Team
i
This publication from the Kansas State University Agricultural Experiment Station and Cooperative Extension Service has been archived. Current information is available from http://www.ksre.ksu.edu.

Personnel Associated with the K-State Turfgrass Program
Bob Bauernfeind Extension Entomologist
Mike Daratt Farmer II, Horticulture Research Center, Wichita
Jack Fry Associate Professor of Horticulture, Turfgrass Research & Teaching
Bingru Huang Assistant Professor of Horticulture, Turfgrass Research & Teaching
Steve Keeley Extension Turfgrass Specialist
Larry Leuthold Professor Emeritus
Xiaozhong Liu Ph.D. Candidate, Horticulture
Christy Nagel Extension Horticulture Secretary
Linda Parsons Sedgwick County Master Gardener
Derek Settle M.S. Student, Horticulture
Michael Shelton Plant Research Technician II, Horticulture Research Center, Wichita
Steve Starrett Assistant Professor, Civil Engineering
Ned Tisserat Professor of Plant Pathology, Plant Pathology Extension and Research
Ward Upham Extension Associate - Horticulture
Tom Warner Professor and Head, Department of Horticulture, Forestry, andRecreation Resources
Henry Wetzel Ph.D. Candidate, Plant Pathology
Steve Wiest Associate Professor of Horticulture, Plant Stress Research
Alan Zuk Research Assistant
Contents of this publication may be freely reproduced for educational purposes. All other rightsreserved. In each case, give credit to the author(s), name of work, Kansas State University, and thedate the work was published.
ii
This publication from the Kansas State University Agricultural Experiment Station and Cooperative Extension Service has been archived. Current information is available from http://www.ksre.ksu.edu.
iii
Table of Contents
Turf Evaluation and Variety Trials
1996 National Tall Fescue Cultivar Evaluation Trial 1
Zoysia Cultivar Trial 10
High-Maintenance Kentucky Bluegrass Trial 12
Pest Management
Weed Control
Flowering Ornamentals and Growing Degree Days as Indicators for Crabgrass
Emergence in Midwestern Turf 17
Insect Control
Cyclocephala in Kansas: 1997 Flight Patterns and Species Distribution 21
Disease Control
Assessing Genetic Diversity in Ophiosphaerella herpotricha, O. korrae, and
Phaeosphaeria narmari, Three Agents that Cause Spring Dead Spot 24
Dollar Spot Susceptibility and Fungicide Programs for Four Creeping
Bentgrass Cultivars 26
Preventive Fungicide Applications for Control of Dollar Spot on Creeping Bentgrass 29
Influence of Irrigation Management on Disease Development in Perennial Ryegrass 31
Effects of Aerification and Fungicide Application on the Development of Summer
Patch Disease in Mystic Kentucky Bluegrass 34
Effects of Cultivar, Fungicide Applications, and Clipping Removal on Development
of Rhizoctonia Brown Patch on Tall Fescue 37
Preventive Fungicide Applications for Control of Rhizoctonia Brown Patch of
Tall Fescue 40
Preventive Fall Fungicide Applications for Control of Rhizoctonia Large Patch
Disease of Zoysiagrass 42
Environmental Stress
Variations in Summer Performance of Bentgrass Cultivars 44
Influence of Cultural Factors on Bentgrass Summer Performance 47
Response of Buffalograss and Zoysiagrass to Surface Soil Drying 52
Identifying a Characteristic Dimension in Four Turfgrass Species 57
Other
How Urbanization Impacts Water Resources 59
This publication from the Kansas State University Agricultural Experiment Station and Cooperative Extension Service has been archived. Current information is available from http://www.ksre.ksu.edu.

TITLE: 1996 National Tall Fescue Cultivar Evaluation Trial
OBJECTIVES: To evaluate tall fescue cultivars under Kansas conditions and submit datacollected to the National Turfgrass Evaluation Program.
PERSONNEL: Linda Parsons, Ned Tisserat, and John Pair
SPONSOR: USDA National Turfgrass Evaluation Program
INTRODUCTION:Tall fescue is the best adapted cool-season turfgrass for the transition zone. It is drought and
heat tolerant and has few serious insect and disease problems. However, tall fescue possesses arather coarse leaf texture, because it lacks stolons and has only very short rhizomes. Efforts toimprove cultivar quality include selection for finer leaf texture, a rich green color, and better swarddensity, while still maintaining good stress tolerance and disease resistance.
MATERIALS AND METHODS:After we incorporated 13-13-13 at a rate of 1 lb. NPK per 1000 sq ft into 390 5 ft ×5 ft study
plots in Wichita, we seeded a trial including 130 cultivars and experimental numbers on September11, 1996 at a rate of 4.4 lb seed/1000 sq ft. We maintained fertility of the plots at 0.25 to 0.5 lbN/1000 sq ft per growing month. We mowed the plots weekly during the growing season at 2.5 in.and remove clippings. We irrigated as necessary to prevent stress and control weeds, insects, anddiseases only when they presented a threat to the trial.
At appropriate times during the course of the study, we collected information on seedlingvigor; genetic color; spring green-up; leaf texture; quality; and, where applicable, disease resistance. Rating was done on a scale of 0=brown turf, 6=acceptable, and 9=optimum measure.
RESULTS:Our initial observations (Table 1) showed that Arid, Kentucky-31 w/endo., Titan 2, Safari,
Overtime mix, and Renegade had the greatest seedling vigor. Their short height indicated that PickFA N-9, ZPS-5L, Gazelle, and Pick FA UT-9 were the most dwarf selections. OFI-931, LTP-4026E+, MB 213, Millennium, Pennington-1901, and AA-A91 formed the most dense stands; BAR FA6LV, MB 213, BAR Fa6 US1, J-5, J-98, MB 29, Pick FA 6-91, and ZPS-5LZ had the deepest greencolor; and MB 29, Gazelle, J-101, LTP-4026 E+, Pennington-1901, Pick FA N-93, and Pick RT-95had the finest texture.
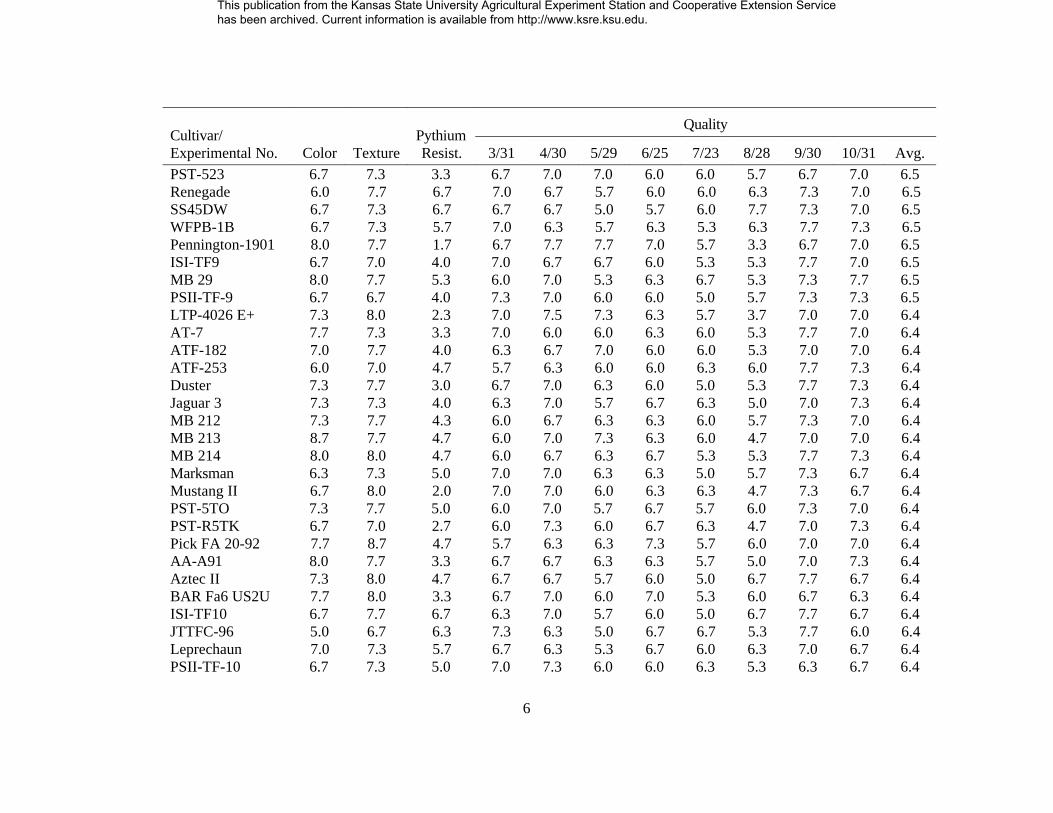
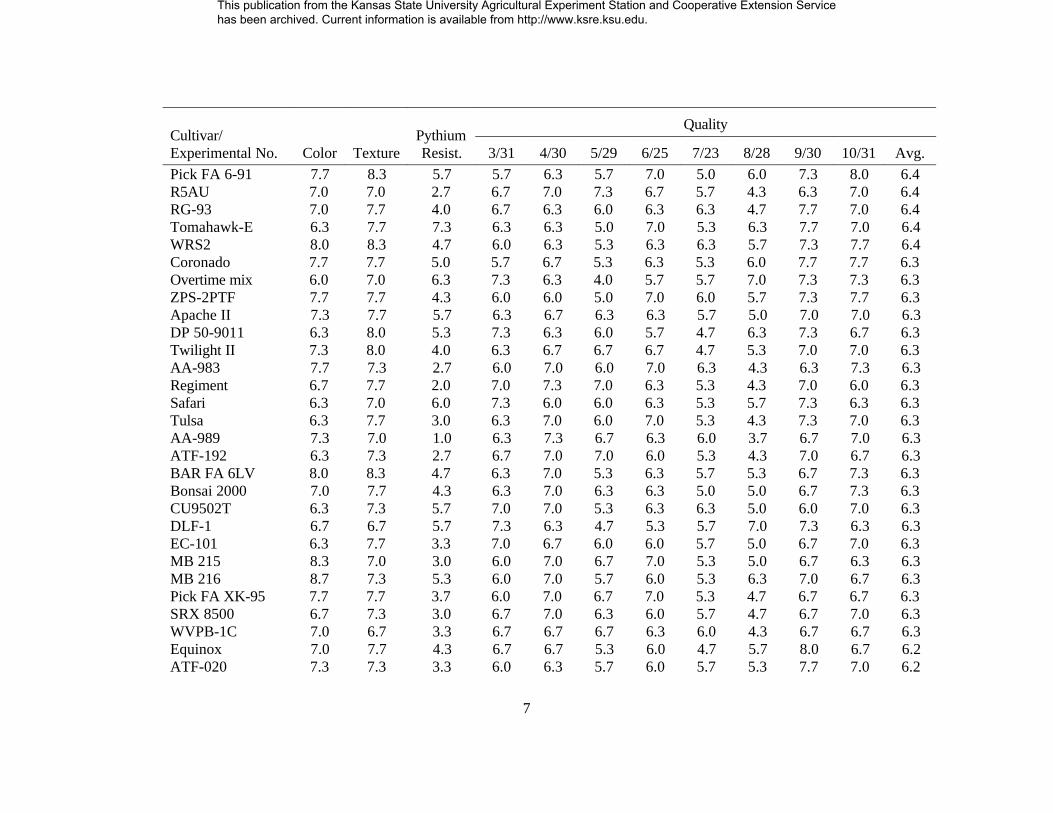
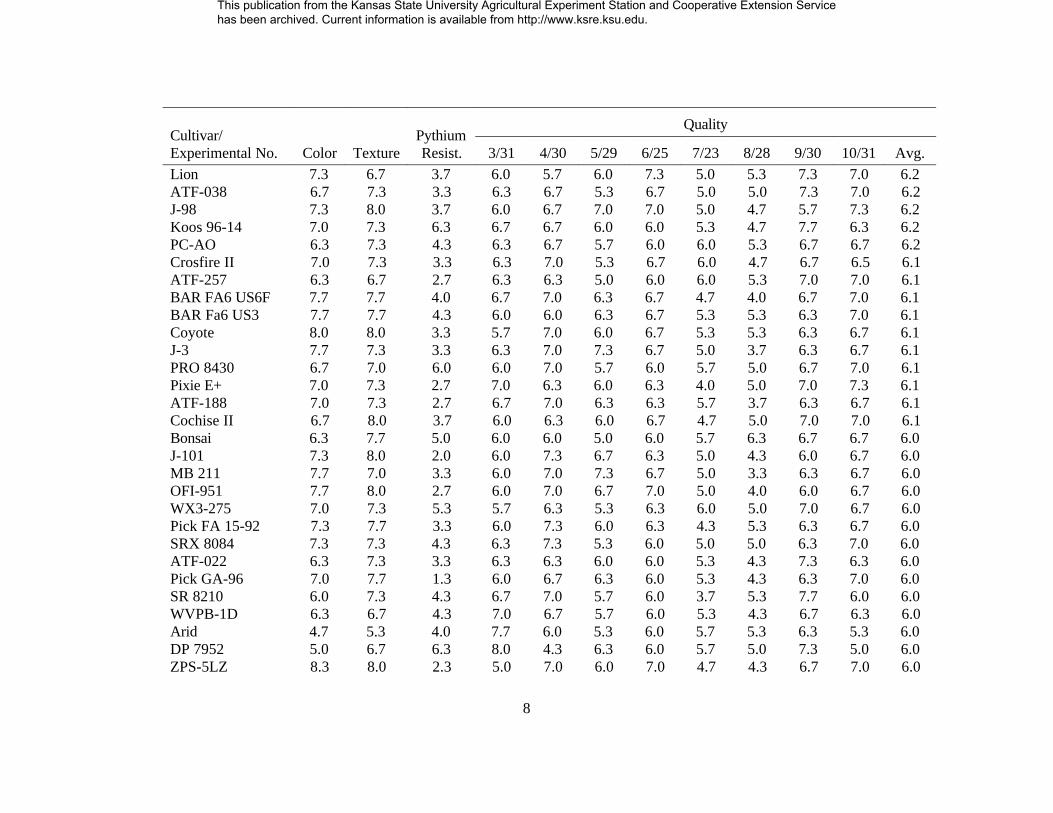
In 1997 (Table 2), we rated the fescue plots monthly throughout the growing season for turfquality. Those that performed best overall were Empress, PST-5E5, LTP-SD-TF, Southern Choice,BAR FA 6D, MB 210, OFI-931, PST-5M5, and Millennium. At the end of the summer, we foundthat MB 213, MB 216, MB 215, Pick FA N-93, and ZPS-5LZ had the darkest green color and thatBAR Fa6 US1, Pick FA 20-92, ATF-196, BAR FA 6LV, Pick FA 6-91, and WRS2 had the finesttexture. As a result of the extremely wet spring and early summer, most of the turf was affected byPythium blight. Tomahawk-E2, Kentucky-31 w/endo., AV-1, ISI-TF10, JSC-1, Renegade, andSS45DW showed the least injury, and Pennington-1901, Gazelle, Pick GA-96, and AA-989 showedthe most injury.
1
This publication from the Kansas State University Agricultural Experiment Station and Cooperative Extension Service has been archived. Current information is available from http://www.ksre.ksu.edu.

2
Table 1. Initial ratings (1996) of tall fescue cultivars at Wichita, KS .1
Cultivar/ SeedlingExperimental Number Vigor Height Density Color Texture
Arid 9.0 9.0 7.7 3.7 3.3Kentucky-31 w/endo. 9.0 9.0 6.7 3.0 2.3Titan 2 8.7 8.3 8.0 6.3 4.0Safari 8.3 8.0 7.7 5.3 4.0Overtime mix 8.0 8.3 7.0 5.3 4.0Renegade 8.0 8.0 8.0 5.7 3.7Aztec II 7.7 7.3 7.3 6.0 5.3Bonsai 2000 7.7 7.7 7.7 6.3 5.0CU9501T 7.7 6.7 7.0 6.7 4.7CU9502T 7.7 7.7 7.7 5.7 5.7DP 7952 7.7 8.7 7.3 4.7 3.0JTTFC-96 7.7 8.0 7.3 4.7 3.7OFI-931 7.7 7.0 8.7 6.7 5.0R5AU 7.7 7.3 7.7 7.0 4.7SSDE31 7.7 8.0 7.3 6.7 3.7Shenandoah 7.7 7.3 8.0 6.0 4.3Southern Choice 7.7 7.0 8.0 7.3 5.3AT-7 7.3 6.7 7.3 7.0 5.0DLF-1 7.3 8.3 7.3 4.7 4.0DP 50-9011 7.3 8.3 7.3 6.0 4.0Equinox 7.3 7.7 7.7 5.7 4.3Falcon II 7.3 8.3 7.7 6.3 5.3ISI-TF9 7.3 7.3 7.3 6.0 4.0JTTFA-96 7.3 7.0 6.3 4.7 3.3Leprechaun 7.3 7.0 7.0 6.3 4.7Pixie E+ 7.3 7.3 7.7 6.3 4.3Regiment 7.3 7.7 8.0 6.0 5.7SR 8210 7.3 7.7 8.0 6.3 5.0WFPB-1B 7.3 7.7 7.0 5.3 4.0WVPB-1D 7.3 7.7 8.0 6.0 3.7AA-A91 7.0 6.7 8.0 7.7 5.3Apache II 7.0 6.3 7.3 6.3 5.3Duster 7.0 7.0 7.3 7.0 5.0Finelawn Petite 7.0 7.3 7.3 6.7 4.3Genesis 7.0 6.3 7.7 7.0 5.3ISI-TF11 7.0 7.7 8.0 6.3 4.3LTP-4026 E+ 7.0 6.7 8.3 7.7 6.3MB 212 7.0 7.3 7.7 7.7 5.3PSII-TF-9 7.0 7.0 7.7 6.7 4.0RG-93 7.0 7.3 8.0 6.3 5.0SS45DW 7.0 6.7 6.7 6.7 4.0WX3-275 7.0 7.3 7.3 6.7 4.7ATF-020 6.7 5.7 6.3 6.7 5.0Anthem II 6.7 7.3 7.0 6.7 5.3
This publication from the Kansas State University Agricultural Experiment Station and Cooperative Extension Service has been archived. Current information is available from http://www.ksre.ksu.edu.

Cultivar/ SeedlingExperimental Number Vigor Height Density Color Texture
3
Empress 6.7 7.0 7.7 6.7 5.0ISI-TF10 6.7 6.7 7.0 6.3 5.7JSC-1 6.7 8.0 7.7 6.0 3.7LTP-SD-TF 6.7 6.0 7.7 7.3 4.7MB 215 6.7 6.3 7.7 8.0 5.7MB 29 6.7 6.7 7.7 8.3 6.7Marksman 6.7 7.7 8.0 6.0 5.0Millennium 6.7 6.3 8.3 7.3 5.7Mustang II 6.7 7.0 8.0 6.0 5.0PST-523 6.7 6.3 7.7 6.7 4.7Pennington-1901 6.7 6.7 8.3 8.0 6.3SRX 8084 6.7 7.0 7.3 6.7 5.0Tarheel 6.7 5.3 6.0 6.0 3.7Tulsa 6.7 6.7 7.0 6.7 5.3WVPB-1C 6.7 7.7 7.0 6.3 4.7AA-989 6.3 6.0 7.7 7.3 5.3ATF-038 6.3 6.3 7.3 6.3 4.7ATF-182 6.3 5.7 7.3 6.0 5.0ATF-257 6.3 7.7 7.0 6.3 3.7AV-1 6.3 8.0 6.7 5.3 4.0Alamo E+ 6.3 7.0 7.7 6.7 5.0BAR FA 6D 6.3 5.7 6.7 7.3 5.7BAR FA 6LV 6.3 7.0 8.0 8.7 6.0BAR Fa6D USA 6.3 5.3 7.3 7.7 5.3Crosfire II 6.3 7.0 7.3 6.7 4.3EA 41 6.3 6.3 7.0 7.7 5.7J-101 6.3 6.0 7.7 7.7 6.3MB 210 6.3 7.0 7.7 7.3 5.7MB 211 6.3 6.7 7.0 7.7 5.7MB 214 6.3 6.0 7.3 8.0 5.0MB 216 6.3 6.7 7.0 8.0 4.3OFI-96-31 6.3 6.7 7.7 7.3 5.0OFI-96-32 6.3 7.0 7.3 7.0 5.3PC-AO 6.3 7.3 6.7 6.7 4.0PRO 8430 6.3 6.3 6.3 6.3 4.7PST-5E5 6.3 6.3 7.0 7.0 4.7PST-5M5 6.3 6.7 7.7 7.0 4.3PST-R5AE 6.3 6.3 7.0 7.3 5.0PST-R5TK 6.3 7.3 7.7 6.3 4.0WRS2 6.3 6.0 7.7 7.3 4.3EC-101 6.0 7.3 7.7 6.3 4.3J-98 6.0 5.7 7.0 8.3 6.0Jaguar 3 6.0 7.0 6.7 6.7 4.0Koos 96-14 6.0 6.7 6.7 6.3 4.0MB 213 6.0 7.0 8.3 8.7 5.3MB 28 6.0 7.3 8.0 8.0 5.7
This publication from the Kansas State University Agricultural Experiment Station and Cooperative Extension Service has been archived. Current information is available from http://www.ksre.ksu.edu.

Cultivar/ SeedlingExperimental Number Vigor Height Density Color Texture
4
PSII-TF-10 6.0 6.7 7.0 7.0 4.0Pick FA 6-91 6.0 5.3 6.3 8.3 6.0Pick FA XK-95 6.0 5.7 7.0 7.7 5.0SRX 8500 6.0 5.0 6.3 7.3 5.3ZPS-2PTF 6.0 6.3 6.7 7.7 5.3ATF-022 5.7 7.0 7.0 6.3 4.3ATF-188 5.7 6.3 6.3 6.7 4.3ATF-192 5.7 6.7 7.0 5.7 4.7ATF-196 5.7 6.3 6.3 6.7 4.7ATF-253 5.7 6.7 7.3 6.3 4.0BAR FA6 US6F 5.7 5.7 7.7 7.3 5.7BAR Fa6 US2U 5.7 5.0 6.7 8.0 5.7Bonsai 5.7 6.3 6.0 6.3 4.0Coyote 5.7 6.3 7.3 7.7 5.3J-5 5.7 5.3 6.3 8.3 5.7Lion 5.7 6.3 6.7 7.0 4.3OFI-FWY 5.7 7.0 7.7 6.3 5.0PST-5RT 5.7 6.7 7.3 7.3 4.7PST-5TO 5.7 7.0 7.0 6.0 4.0Pick FA 15-92 5.7 5.3 6.0 7.7 5.3Pick FA 20-92 5.7 6.0 6.0 8.0 5.3Shortstop II 5.7 5.0 5.3 7.3 6.0Twilight II 5.7 6.3 6.3 7.0 4.7AA-983 5.3 5.0 7.3 8.0 4.7BAR Fa6 US3 5.3 5.3 6.7 8.0 6.0Cochise II 5.3 5.7 5.7 6.7 4.3Coronado 5.3 5.7 6.3 7.3 5.0J-3 5.3 6.0 6.7 7.7 5.3MB 26 5.3 5.3 6.0 7.7 5.7OFI-951 5.3 5.3 6.3 7.3 5.3Pick FA B-93 5.3 5.3 6.3 7.3 6.0Pick FA UT-93 5.3 4.3 5.3 8.0 6.0Pick GA-96 5.3 5.7 6.0 7.0 5.3Pick RT-95 5.3 5.3 7.0 7.7 6.3Sunpro 5.3 5.7 5.7 8.0 5.0BAR Fa6 US1 5.0 5.3 6.7 8.3 6.0Tomahawk-E 5.0 6.0 6.7 6.7 4.3Gazelle 4.7 4.3 5.7 8.0 6.3ZPS-5LZ 4.7 4.0 5.3 8.3 5.0Pick FA N-93 4.0 3.3 5.0 7.7 6.3LSD 1.0 1.2 1.6 0.9 1.22
Ratings based on a scale of 0-9 with 9=greatest vigor, height, density, etc.1
To determine statistical differences among entries, subtract one entry’s mean from another’s . A statistical2
difference occurs when the value is larger than the corresponding LSD value.
This publication from the Kansas State University Agricultural Experiment Station and Cooperative Extension Service has been archived. Current information is available from http://www.ksre.ksu.edu.

5
Table 2. 1997 performance of tall fescue cultivars at Wichita, KS .2
Cultivar/ PythiumExperimental No. Color Texture Resist. 3/31 4/30 5/29 6/25 7/23 8/28 9/30 10/31 Avg.
Quality
Empress 6.7 8.0 4.0 6.7 7.3 7.7 6.3 6.0 6.0 7.7 7.7 6.9PST-5E5 7.3 7.3 5.7 6.0 7.0 6.7 6.7 6.7 6.3 8.0 7.3 6.8LTP-SD-TF 7.3 7.7 5.7 6.7 7.3 6.3 6.7 5.7 6.0 7.7 8.0 6.8Southern Choice 7.7 7.7 2.7 7.0 7.0 7.7 6.7 6.3 5.3 7.0 7.3 6.8BAR FA 6D 8.0 8.0 5.3 6.3 8.0 7.0 6.7 5.0 5.3 7.7 8.0 6.8MB 210 7.7 7.3 5.3 6.7 6.7 7.0 6.3 6.3 6.0 7.3 7.7 6.8OFI-931 7.0 7.7 6.3 7.0 7.3 6.7 6.3 6.0 6.0 7.7 7.0 6.8PST-5M5 6.7 7.3 5.0 6.7 7.0 5.7 7.0 6.7 6.0 7.0 8.0 6.8Millennium 7.3 8.0 3.0 6.7 7.7 8.0 6.3 5.7 4.7 7.3 7.3 6.7OFI-96-32 6.7 7.3 5.0 7.0 7.3 6.7 6.0 5.7 6.0 7.7 7.0 6.7SSDE31 7.0 6.7 4.0 7.0 7.0 6.7 6.0 6.3 5.0 8.0 7.3 6.7Falcon II 6.7 7.3 6.0 7.3 7.0 5.7 6.3 6.3 6.3 7.0 7.3 6.7CU9501T 7.3 7.3 4.0 6.7 7.0 6.7 7.3 5.3 5.0 8.0 7.0 6.6Finelawn Petite 7.0 7.0 6.0 6.7 6.7 5.0 6.3 6.3 7.0 8.0 7.0 6.6ISI-TF11 6.7 7.0 4.0 7.0 7.3 6.0 6.0 6.3 5.7 7.7 7.0 6.6Titan 2 6.3 6.7 4.3 6.7 6.7 6.0 6.0 7.0 5.7 7.7 7.0 6.6Anthem II 7.0 8.0 4.3 7.0 7.0 6.7 6.0 5.3 6.0 7.3 7.3 6.6BAR Fa6D USA 7.7 7.7 5.3 5.7 7.3 5.3 7.0 6.0 5.7 8.0 7.7 6.6PST-R5AE 7.3 7.0 2.7 6.7 7.0 6.3 6.7 6.0 5.0 7.3 7.7 6.6Tarheel 7.0 7.7 4.0 6.0 6.7 5.7 6.3 7.0 6.0 7.3 7.7 6.6BAR Fa6 US1 7.7 8.7 5.0 5.7 6.7 5.3 7.0 6.7 6.0 7.3 7.7 6.5Genesis 6.7 7.0 4.7 7.3 6.7 5.3 6.7 6.0 5.7 7.3 7.3 6.5JSC-1 5.7 7.3 6.7 7.3 6.7 6.0 6.7 6.0 5.3 7.7 6.7 6.5MB 28 8.0 7.0 4.0 6.3 7.0 6.7 6.3 6.0 6.0 7.0 7.0 6.5PST-5RT 7.0 7.3 4.0 6.0 6.7 6.3 6.0 6.0 6.3 7.7 7.3 6.5Shenandoah 5.7 6.7 4.3 7.3 7.0 5.0 6.0 6.7 5.3 7.7 7.3 6.5OFI-96-31 7.3 7.3 5.0 7.0 7.3 7.3 6.3 5.7 4.7 6.7 7.0 6.5OFI-FWY 7.0 7.7 5.0 6.3 6.7 6.0 6.7 6.0 6.3 7.3 6.7 6.5
This publication from the Kansas State University Agricultural Experiment Station and Cooperative Extension Service has been archived. Current information is available from http://www.ksre.ksu.edu.
Cultivar/ PythiumExperimental No. Color Texture Resist. 3/31 4/30 5/29 6/25 7/23 8/28 9/30 10/31 Avg.
Quality
6
PST-523 6.7 7.3 3.3 6.7 7.0 7.0 6.0 6.0 5.7 6.7 7.0 6.5Renegade 6.0 7.7 6.7 7.0 6.7 5.7 6.0 6.0 6.3 7.3 7.0 6.5SS45DW 6.7 7.3 6.7 6.7 6.7 5.0 5.7 6.0 7.7 7.3 7.0 6.5WFPB-1B 6.7 7.3 5.7 7.0 6.3 5.7 6.3 5.3 6.3 7.7 7.3 6.5Pennington-1901 8.0 7.7 1.7 6.7 7.7 7.7 7.0 5.7 3.3 6.7 7.0 6.5ISI-TF9 6.7 7.0 4.0 7.0 6.7 6.7 6.0 5.3 5.3 7.7 7.0 6.5MB 29 8.0 7.7 5.3 6.0 7.0 5.3 6.3 6.7 5.3 7.3 7.7 6.5PSII-TF-9 6.7 6.7 4.0 7.3 7.0 6.0 6.0 5.0 5.7 7.3 7.3 6.5LTP-4026 E+ 7.3 8.0 2.3 7.0 7.5 7.3 6.3 5.7 3.7 7.0 7.0 6.4AT-7 7.7 7.3 3.3 7.0 6.0 6.0 6.3 6.0 5.3 7.7 7.0 6.4ATF-182 7.0 7.7 4.0 6.3 6.7 7.0 6.0 6.0 5.3 7.0 7.0 6.4ATF-253 6.0 7.0 4.7 5.7 6.3 6.0 6.0 6.3 6.0 7.7 7.3 6.4Duster 7.3 7.7 3.0 6.7 7.0 6.3 6.0 5.0 5.3 7.7 7.3 6.4Jaguar 3 7.3 7.3 4.0 6.3 7.0 5.7 6.7 6.3 5.0 7.0 7.3 6.4MB 212 7.3 7.7 4.3 6.0 6.7 6.3 6.3 6.0 5.7 7.3 7.0 6.4MB 213 8.7 7.7 4.7 6.0 7.0 7.3 6.3 6.0 4.7 7.0 7.0 6.4MB 214 8.0 8.0 4.7 6.0 6.7 6.3 6.7 5.3 5.3 7.7 7.3 6.4Marksman 6.3 7.3 5.0 7.0 7.0 6.3 6.3 5.0 5.7 7.3 6.7 6.4Mustang II 6.7 8.0 2.0 7.0 7.0 6.0 6.3 6.3 4.7 7.3 6.7 6.4PST-5TO 7.3 7.7 5.0 6.0 7.0 5.7 6.7 5.7 6.0 7.3 7.0 6.4PST-R5TK 6.7 7.0 2.7 6.0 7.3 6.0 6.7 6.3 4.7 7.0 7.3 6.4Pick FA 20-92 7.7 8.7 4.7 5.7 6.3 6.3 7.3 5.7 6.0 7.0 7.0 6.4AA-A91 8.0 7.7 3.3 6.7 6.7 6.3 6.3 5.7 5.0 7.0 7.3 6.4Aztec II 7.3 8.0 4.7 6.7 6.7 5.7 6.0 5.0 6.7 7.7 6.7 6.4BAR Fa6 US2U 7.7 8.0 3.3 6.7 7.0 6.0 7.0 5.3 6.0 6.7 6.3 6.4ISI-TF10 6.7 7.7 6.7 6.3 7.0 5.7 6.0 5.0 6.7 7.7 6.7 6.4JTTFC-96 5.0 6.7 6.3 7.3 6.3 5.0 6.7 6.7 5.3 7.7 6.0 6.4Leprechaun 7.0 7.3 5.7 6.7 6.3 5.3 6.7 6.0 6.3 7.0 6.7 6.4PSII-TF-10 6.7 7.3 5.0 7.0 7.3 6.0 6.0 6.3 5.3 6.3 6.7 6.4
This publication from the Kansas State University Agricultural Experiment Station and Cooperative Extension Service has been archived. Current information is available from http://www.ksre.ksu.edu.
Cultivar/ PythiumExperimental No. Color Texture Resist. 3/31 4/30 5/29 6/25 7/23 8/28 9/30 10/31 Avg.
Quality
7
Pick FA 6-91 7.7 8.3 5.7 5.7 6.3 5.7 7.0 5.0 6.0 7.3 8.0 6.4R5AU 7.0 7.0 2.7 6.7 7.0 7.3 6.7 5.7 4.3 6.3 7.0 6.4RG-93 7.0 7.7 4.0 6.7 6.3 6.0 6.3 6.3 4.7 7.7 7.0 6.4Tomahawk-E 6.3 7.7 7.3 6.3 6.3 5.0 7.0 5.3 6.3 7.7 7.0 6.4WRS2 8.0 8.3 4.7 6.0 6.3 5.3 6.3 6.3 5.7 7.3 7.7 6.4Coronado 7.7 7.7 5.0 5.7 6.7 5.3 6.3 5.3 6.0 7.7 7.7 6.3Overtime mix 6.0 7.0 6.3 7.3 6.3 4.0 5.7 5.7 7.0 7.3 7.3 6.3ZPS-2PTF 7.7 7.7 4.3 6.0 6.0 5.0 7.0 6.0 5.7 7.3 7.7 6.3Apache II 7.3 7.7 5.7 6.3 6.7 6.3 6.3 5.7 5.0 7.0 7.0 6.3DP 50-9011 6.3 8.0 5.3 7.3 6.3 6.0 5.7 4.7 6.3 7.3 6.7 6.3Twilight II 7.3 8.0 4.0 6.3 6.7 6.7 6.7 4.7 5.3 7.0 7.0 6.3AA-983 7.7 7.3 2.7 6.0 7.0 6.0 7.0 6.3 4.3 6.3 7.3 6.3Regiment 6.7 7.7 2.0 7.0 7.3 7.0 6.3 5.3 4.3 7.0 6.0 6.3Safari 6.3 7.0 6.0 7.3 6.0 6.0 6.3 5.3 5.7 7.3 6.3 6.3Tulsa 6.3 7.7 3.0 6.3 7.0 6.0 7.0 5.3 4.3 7.3 7.0 6.3AA-989 7.3 7.0 1.0 6.3 7.3 6.7 6.3 6.0 3.7 6.7 7.0 6.3ATF-192 6.3 7.3 2.7 6.7 7.0 7.0 6.0 5.3 4.3 7.0 6.7 6.3BAR FA 6LV 8.0 8.3 4.7 6.3 7.0 5.3 6.3 5.7 5.3 6.7 7.3 6.3Bonsai 2000 7.0 7.7 4.3 6.3 7.0 6.3 6.3 5.0 5.0 6.7 7.3 6.3CU9502T 6.3 7.3 5.7 7.0 7.0 5.3 6.3 6.3 5.0 6.0 7.0 6.3DLF-1 6.7 6.7 5.7 7.3 6.3 4.7 5.3 5.7 7.0 7.3 6.3 6.3EC-101 6.3 7.7 3.3 7.0 6.7 6.0 6.0 5.7 5.0 6.7 7.0 6.3MB 215 8.3 7.0 3.0 6.0 7.0 6.7 7.0 5.3 5.0 6.7 6.3 6.3MB 216 8.7 7.3 5.3 6.0 7.0 5.7 6.0 5.3 6.3 7.0 6.7 6.3Pick FA XK-95 7.7 7.7 3.7 6.0 7.0 6.7 7.0 5.3 4.7 6.7 6.7 6.3SRX 8500 6.7 7.3 3.0 6.7 7.0 6.3 6.0 5.7 4.7 6.7 7.0 6.3WVPB-1C 7.0 6.7 3.3 6.7 6.7 6.7 6.3 6.0 4.3 6.7 6.7 6.3Equinox 7.0 7.7 4.3 6.7 6.7 5.3 6.0 4.7 5.7 8.0 6.7 6.2ATF-020 7.3 7.3 3.3 6.0 6.3 5.7 6.0 5.7 5.3 7.7 7.0 6.2
This publication from the Kansas State University Agricultural Experiment Station and Cooperative Extension Service has been archived. Current information is available from http://www.ksre.ksu.edu.
Cultivar/ PythiumExperimental No. Color Texture Resist. 3/31 4/30 5/29 6/25 7/23 8/28 9/30 10/31 Avg.
Quality
8
Lion 7.3 6.7 3.7 6.0 5.7 6.0 7.3 5.0 5.3 7.3 7.0 6.2ATF-038 6.7 7.3 3.3 6.3 6.7 5.3 6.7 5.0 5.0 7.3 7.0 6.2J-98 7.3 8.0 3.7 6.0 6.7 7.0 7.0 5.0 4.7 5.7 7.3 6.2Koos 96-14 7.0 7.3 6.3 6.7 6.7 6.0 6.0 5.3 4.7 7.7 6.3 6.2PC-AO 6.3 7.3 4.3 6.3 6.7 5.7 6.0 6.0 5.3 6.7 6.7 6.2Crosfire II 7.0 7.3 3.3 6.3 7.0 5.3 6.7 6.0 4.7 6.7 6.5 6.1ATF-257 6.3 6.7 2.7 6.3 6.3 5.0 6.0 6.0 5.3 7.0 7.0 6.1BAR FA6 US6F 7.7 7.7 4.0 6.7 7.0 6.3 6.7 4.7 4.0 6.7 7.0 6.1BAR Fa6 US3 7.7 7.7 4.3 6.0 6.0 6.3 6.7 5.3 5.3 6.3 7.0 6.1Coyote 8.0 8.0 3.3 5.7 7.0 6.0 6.7 5.3 5.3 6.3 6.7 6.1J-3 7.7 7.3 3.3 6.3 7.0 7.3 6.7 5.0 3.7 6.3 6.7 6.1PRO 8430 6.7 7.0 6.0 6.0 7.0 5.7 6.0 5.7 5.0 6.7 7.0 6.1Pixie E+ 7.0 7.3 2.7 7.0 6.3 6.0 6.3 4.0 5.0 7.0 7.3 6.1ATF-188 7.0 7.3 2.7 6.7 7.0 6.3 6.3 5.7 3.7 6.3 6.7 6.1Cochise II 6.7 8.0 3.7 6.0 6.3 6.0 6.7 4.7 5.0 7.0 7.0 6.1Bonsai 6.3 7.7 5.0 6.0 6.0 5.0 6.0 5.7 6.3 6.7 6.7 6.0J-101 7.3 8.0 2.0 6.0 7.3 6.7 6.3 5.0 4.3 6.0 6.7 6.0MB 211 7.7 7.0 3.3 6.0 7.0 7.3 6.7 5.0 3.3 6.3 6.7 6.0OFI-951 7.7 8.0 2.7 6.0 7.0 6.7 7.0 5.0 4.0 6.0 6.7 6.0WX3-275 7.0 7.3 5.3 5.7 6.3 5.3 6.3 6.0 5.0 7.0 6.7 6.0Pick FA 15-92 7.3 7.7 3.3 6.0 7.3 6.0 6.3 4.3 5.3 6.3 6.7 6.0SRX 8084 7.3 7.3 4.3 6.3 7.3 5.3 6.0 5.0 5.0 6.3 7.0 6.0ATF-022 6.3 7.3 3.3 6.3 6.3 6.0 6.0 5.3 4.3 7.3 6.3 6.0Pick GA-96 7.0 7.7 1.3 6.0 6.7 6.3 6.0 5.3 4.3 6.3 7.0 6.0SR 8210 6.0 7.3 4.3 6.7 7.0 5.7 6.0 3.7 5.3 7.7 6.0 6.0WVPB-1D 6.3 6.7 4.3 7.0 6.7 5.7 6.0 5.3 4.3 6.7 6.3 6.0Arid 4.7 5.3 4.0 7.7 6.0 5.3 6.0 5.7 5.3 6.3 5.3 6.0DP 7952 5.0 6.7 6.3 8.0 4.3 6.3 6.0 5.7 5.0 7.3 5.0 6.0ZPS-5LZ 8.3 8.0 2.3 5.0 7.0 6.0 7.0 4.7 4.3 6.7 7.0 6.0
This publication from the Kansas State University Agricultural Experiment Station and Cooperative Extension Service has been archived. Current information is available from http://www.ksre.ksu.edu.

Cultivar/ PythiumExperimental No. Color Texture Resist. 3/31 4/30 5/29 6/25 7/23 8/28 9/30 10/31 Avg.
Quality
9
Alamo E+ 7.3 7.7 5.0 6.0 6.7 5.0 6.0 4.7 5.3 6.7 7.0 5.9Gazelle 8.0 8.0 1.3 5.3 7.0 6.0 8.0 3.7 4.0 6.3 7.0 5.9Pick FA B-93 7.0 7.0 2.0 6.7 7.0 5.7 6.3 4.7 4.0 5.7 7.0 5.9AV-1 5.0 6.0 6.7 7.7 5.7 5.7 5.0 5.7 4.7 6.7 5.7 5.8Pick RT-95 7.3 7.7 4.3 6.0 6.7 6.0 6.7 5.0 4.7 5.7 6.0 5.8MB 26 8.0 8.0 4.7 5.3 6.7 4.7 6.0 4.3 5.7 6.7 7.3 5.8Sunpro 7.7 7.7 3.0 5.7 6.0 6.3 6.7 5.0 4.3 6.3 6.3 5.8J-5 8.0 8.0 4.7 5.3 6.3 6.3 5.7 5.3 4.7 6.0 6.7 5.8ATF-196 7.0 8.3 3.3 6.0 6.3 5.7 6.0 4.7 4.7 5.7 7.0 5.8JTTFA-96 4.7 6.0 2.3 8.0 6.3 5.7 5.7 5.3 4.0 6.3 4.7 5.8EA 41 8.0 7.0 4.3 5.7 6.3 5.0 6.3 4.3 4.3 5.7 6.0 5.5Shortstop II 7.3 7.7 2.0 5.3 5.7 6.0 5.7 4.3 3.7 6.0 7.0 5.5Pick FA N-93 8.3 8.0 3.7 4.7 4.0 5.0 6.3 4.0 4.3 5.7 6.3 5.0Pick FA UT-93 7.0 7.7 2.0 5.0 5.3 4.3 6.3 4.3 3.3 5.3 6.3 5.0Kentucky-31 4.0 5.0 7.0 8.0 5.3 4.0 4.0 5.0 4.0 5.7 4.0 5.0 w/endo.
LSD 0.9 1.1 5.2 1.0 1.3 2.3 1.1 1.8 3.9 2.8 1.2 0.72
Ratings based on a scale of 0-9 with 9=color, texture, pythium resistance, and quality.1
To determine statistical differences among entries, subtract one entry’s mean from another’s . A statistical difference occurs when the value2
is larger than the corresponding LSD value.
This publication from the Kansas State University Agricultural Experiment Station and Cooperative Extension Service has been archived. Current information is available from http://www.ksre.ksu.edu.
10
TITLE: Zoysia Cultivar Trial
OBJECTIVE : To compare several vegetative and seeded zoysiagrasses for performance in Kansas.
PERSONNEL: Jack Fry
SPONSOR: National Turfgrass Evaluation Program
INTRODUCTION:Meyer zoysiagrass is used throughout the transition zone for golf course fairways and home lawns.
There is interest in identifying zoysiagrass cultivars that can be established more rapidly, and have betterturf quality attributes than Meyer.
MATERIALS AND METHODS:Twenty-five grasses were established from seed or plugs in July, 1996 at the Rocky Ford Turfgrass
Research Center in Manhattan. Seeded selections were ZEN 500, ZEN 400, Zenith, J-36, J-37, ChineseCommon, Z-18, and Korean Common. Plots measured 5 by 5 ft, and were arranged in a randomizedcomplete block design. Seeding rate was approximately 2 lbs/1000 sq ft. Six 2-inch- diameter plugs ofvegetative selections were planted in each plot. The area received frequent irrigation through theestablishment period, with frequency decreasing as plants became established. Mowing was done at 1.5nches with a rotary mower in 1996. In 1997, a reel mower was used 3 days weekly to maintain turf at a0.75-inch height 3 days weekly. Nitrogen was applied to provide 1 lb N/1000 sq ft.
RESULTS:1996 (Data not shown): The seeded selections, with the exception of Korean Common, exhibited
the best coverage when plots were rated in September. For example, coverage was between 68 and 77%for ZEN 400, Zenith, J-36, J-37, and Chinese Common. Coverage of vegetative selections generallyranged from 20 to 50% at the end of the first season.
1997 (Table 1): Coverage: All seeded selections except ZEN 500, Z-19, and Korean Common hadcoverage > 95% by the August rating date. Of the vegetative selections, only El Toro had > 90% coverageby August. Meyer exhibited 78% coverage. Cultivars with > 80% coverage included J-14, Miyako, Jamur,Emerald, and Palisades.
Spring Green Up: Plots were rated in early May. Early spring green-up generally would beconsidered an asset. However, cultivars that green up too early also may be predisposed to late-springfreezing injury. Cultivars that exhibited relatively high spring green-up scores were Korean Common, ZEN500, ZEN 400, Zenith, and Chinese Common. Conversely, cultivars that exhibited very low spring green-up were Z-18, Miyako, HT 2-10, DeAnza, Victorial El Toro, Jamur, Zeon, Cavalier, and Palisades. Several of these may have been damaged by winter temperatures.
Leaf Texture: Finest leaf texture was observed for Emerald and Cavalier. Cultivars with coarserleaves were DeAnza, Victoria, HT 2-10, and Korean Common.
Color: Cultivars that were among the highest for color scores were Zenith, Korean Common, HT 2-10, DeAnza, Victoria, Jamur, Meyer, Emerald, Crowne, and Palisades.
Turf Quality: Relatively low quality scores in June and July were due partly to the lack of completecover in most of the plots. Cultivars that were slower to establish received lower scores because more bareground was present. Highest quality scores at the end of the season (September) were observed for theseeded cultivars (that had higher coverage). Poorest quality was observed for DeAnza, Victoria, HT 210,and Z-18.
This publication from the Kansas State University Agricultural Experiment Station and Cooperative Extension Service has been archived. Current information is available from http://www.ksre.ksu.edu.

11
Table 1. Performance of zoysiagrass cultivars at Manhattan, KS in 1998._______________________________________________________________________________________________________________
Seeded (S) or Coverage % Spring Leaf Turf Quality Cultivar Vegetative (V) July August Green up Texture Color June July AugustSept._______________________________________________________________________________________________________________
---------------------------------------0 to 9 scale -----------------------------------1
ZEN 500 S 63 70 6.7 5.0 7.7 3.7 3.7 4.0 5.0ZEN 400 S 87 98 6.3 5.7 7.0 5.3 5.3 6.3 7.3Zenith S 88 97 6.3 5.3 8.3 5.3 5.0 6.0 8.0J-36 S 63 97 5.7 5.0 7.7 4.7 4.7 5.3 7.0J-37 S 91 98 5.7 4.3 7.7 5.3 5.3 6.7 7.0Chinese Common S 97 6.3 4.7 7.7 6.0 6.0 6.3 7.3Z-18 S 36 45 0 4.3 7.5 1.0 2.7 2.7 3.3Korean Common S 60 63 7.3 4.0 8.0 2.0 3.3 3.7 4.0DALZ 9601 V 76 65 1.0 6.7 7.0 1.7 4.7 5.0 4.3J-14 V 78 87 5.7 5.3 7.7 3.3 4.0 4.7 6.3Miyako V 70 87 0 4.7 7.7 1.0 3.3 4.7 5.7HT 2-10 V 66 23 0 3.3 8.0 0.0 1.0 5.0 2.0DeAnza V 22 28 0 2.3 8.0 0.3 3.0 2.0 2.3Victoria V 20 1.0 4.3 8.0 0.3 3.3 1.7 1.7El Toro V 88 92 3.0 5.3 7.7 2.3 4.0 6.0 7.0Jamur V 81 83 2.0 6.0 8.0 3.3 3.0 5.7 5.7Zeon V 53 63 1.3 6.3 7.3 1.7 3.0 3.7 4.3Meyer V 78 78 4.3 6.7 8.7 3.0 4.0 4.3 5.3Emerald V 75 85 3.3 8.0 8.0 3.0 3.7 4.7 5.7Cavalier V 57 62 0.7 8.0 7.7 1.7 2.3 3.7 4.3Crowne V 78 78 2.3 5.0 8.0 2.3 3.3 4.7 6.0Palisades V 78 88 1.7 5.0 8.0 2.7 3.7 5.3 6.3LSD 56 49 2.7 4.8 1.5 2.4 4.6 4.2 3.52
______________________________________________________________________________________________________________Attributes rated visually on a 0 to 9 scale, 9 = best.1
To determine statistical differences among entries, subtract one entry’s mean from another’s. A statistical difference occurs when this value is2
larger than the corresponding LSD value.
This publication from the Kansas State University Agricultural Experiment Station and Cooperative Extension Service has been archived. Current information is available from http://www.ksre.ksu.edu.

12
TITLE: High-Maintenance Kentucky Bluegrass Trial
OBJECTIVE: To evaluate Kentucky bluegrass cultivars under golf course fairwayconditions in the transition zone.
PERSONNEL: Steve Keeley
INTRODUCTION:Turfgrass breeders have been recently directing efforts toward developing Kentucky
bluegrass cultivars with improved tolerance to low mowing heights. Successful cultivars mustform a dense playing surface at low mowing heights (5/8 inch or less), and they must haveresistance to summer patch. If such cultivars can be identified, they would provide a viablealternative to perennial ryegrass for cool-season fairway turf in the transition zone.
MATERIALS AND METHODS:One-hundred and five Kentucky bluegrass cultivars were seeded in September of 1995 at
the Rocky Ford Turfgrass Research Center in Manhattan. Plots were mowed at 9/16 inch andwere fertilized with 4 lb N/1000 sq ft/year. The turf was irrigated to prevent stress. Nofungicides or insecticides were applied.
Turf quality was rated monthly from April to November on a visual scale of 0 to 9, where0=dead turf and 9=optimum density and uniformity. In this particular trial, cultivars with anaverage quality rating of 5.5 or above would be acceptable fairway turfs. The cultivars also wererated for color and density. Billbug damage occurred on some plots in July, and rust infestedsome plots in September; accordinglym the cultivars were rated for susceptibility to these pests.
RESULTS:Because summer performance is critical in Kansas, the cultivars are ranked in Table 1
according to their mean quality from June through August. Cultivars with an average rating of5.5 or above included Apollo, Blacksburg, America, PST-B2-42, PST-BO-141, Wildwood,Unique, ZPS-2183, Odyssey, Midnight, Glade, and Bartitia. When selecting cultivars for fairwayuse, one also should consider their season-long quality rating (averaged from April throughNovember). All the cultivars mentioned above except Wildwood, ZPS-2183, and Bartitia had average season-long quality ratings above 5.5. Out of the above group, Blacksburg was the mostsusceptible to rust. Rust is a fairly minor disease concern, but it can be very unsightly while it isactive. Blacksburg should be blended with rust-resistant cultivars for use in fairways. All of thesecultivars appeared to have decent billbug tolerance. We will continue to evaluate these cultivarsover the next several years.
This publication from the Kansas State University Agricultural Experiment Station and Cooperative Extension Service has been archived. Current information is available from http://www.ksre.ksu.edu.

13
Table 1. Performance of Kentucky bluegrass at low mowing height in Manhattan, KS._______________________________________________________________________________________________________________________
Quality* BillbugJun-Aug Apr-Nov Rust Damage
Cultivar Apr May Jun Jul Aug Oct Nov Mean Mean Color Density (Sept.) (July)_______________________________________________________________________________________________________________________Apollo (PST-B 3-180) 6.0 6.8 7.3 5.7 6.7 5.7 5.0 6.7 6.2 6.3 6.7 8.3 8.7Blacksburg 5.2 7.2 7.3 6.0 6.7 4.3 4.0 6.6 5.8 7.7 6.7 5.7 8.3America 4.3 5.8 6.3 5.7 6.3 6.0 5.0 6.1 5.6 6.0 6.3 7.3 8.7PST-B 2-42 5.2 6.2 6.3 5.0 6.0 5.3 4.3 6.1 5.6 6.7 6.3 8.0 8.5PST-B O-141 5.2 6.5 6.0 4.0 6.3 6.0 5.7 6.1 5.9 6.7 6.3 7.7 8.8Wildwood 5.0 6.7 7.0 5.5 5.3 3.7 3.3 5.9 5.2 6.7 6.0 7.3 8.0Unique 5.0 5.5 6.5 4.3 5.8 5.5 5.0 5.9 5.5 6.3 6.0 6.7 8.3ZPS-2183 5.0 5.5 6.3 5.3 5.5 4.0 4.0 5.9 5.2 7.3 6.0 7.7 8.5Odyssey (J-1561) 5.0 6.8 6.7 5.3 5.5 5.0 4.7 5.8 5.6 7.0 6.7 9.0 8.0Midnight 5.2 6.7 7.3 5.2 4.8 5.3 4.3 5.8 5.6 8.0 6.7 9.0 7.7Glade 5.7 7.0 6.3 4.0 5.7 6.3 5.3 5.7 5.9 7.0 6.3 9.0 7.7Bartitia 4.5 5.8 6.3 5.8 4.7 4.0 4.0 5.6 5.0 6.7 6.3 7.0 7.3Abbey 5.0 5.7 6.0 5.8 5.5 5.7 4.0 5.4 5.2 6.0 5.7 9.0 8.2Fortuna 5.0 5.3 5.3 4.5 5.3 4.3 3.7 5.3 4.9 6.7 5.7 8.7 8.0NJ 1190 5.5 7.0 7.0 4.3 4.8 4.0 3.3 5.3 5.1 6.0 7.0 4.0 6.8PST-638 4.5 6.7 6.0 4.5 5.0 3.7 3.0 5.3 4.8 7.0 6.0 6.0 7.7Nimbus 4.5 5.2 5.5 4.0 5.0 4.0 3.0 5.3 4.6 6.0 5.7 6.3 7.2SR2109 5.0 5.7 6.0 4.3 5.0 4.5 3.5 5.3 4.9 6.5. 6.7 7.7 7.2Ba 75-173 5.0 6.2 7.0 4.2 4.5 4.0 3.5 5.3 4.9 6.7 5.7 6.3 6.5NuStar 5.0 5.8 5.3 4.3 5.1 4.3 3.7 5.2 4.9 6.0 5.7 7.3 8.0Ba 73-373 5.0 6.3 6.3 4.5 4.7 4.0 3.7 5.2 5.0 6.3 6.3 6.3 7.8PST-P 46 4.2 5.8 6.0 4.3 5.2 4.0 3.3 5.2 4.7 7.3 6.0 6.7 6.8SR2000 5.0 5.2 6.0 4.0 4.8 5.0 4.0 5.2 5.0 7.3 6.0 6.7 7.7Jefferson 6.2 6.2 6.0 4.5 4.8 4.7 4.3 5.2 5.3 6.0 6.0 8.0 7.5SRX2205 5.0 6.5 6.3 6.0 4.7 3.7 2.7 5.2 4.8 6.7 6.0 6.0 7.3Total Eclipse (TCR-1738) 4.7 5.7 5.7 5.0 4.8 4.7 4.3 5.2 5.0 7.3 6.00 8.7 8.0Ba 81-058 5.2 5.7 6.0 4.2 4.8 4.3 4.3 5.1 5.0 6.7 6.00 9.0 7.3
This publication from the Kansas State University Agricultural Experiment Station and Cooperative Extension Service has been archived. Current information is available from http://www.ksre.ksu.edu.

14
Table 1. Performance of Kentucky bluegrass at low mowing height in Manhattan, KS._______________________________________________________________________________________________________________________
Quality* BillbugJun-Aug Apr-Nov Rust Damage
Cultivar Apr May Jun Jul Aug Oct Nov Mean Mean Color Density (Sept.) (July)________________________________________________________________________________________________________________________Lipoa 5.5 6.3 6.0 3.34 5.0 4.3 5.0 5.1 5.2 7.7 6.0 8.3 7.2ZPS-309 5.2 6.0 6.0 4.7 4.8 5.0 4.0 5.1 5.1 7.0 6.0 7.3 7.7Explorer (Pick-3561) 5.8 5.8 6.0 5.0 4.5 5.5 4.5 5.0 5.2 6.0 6.0 9.0 7.8Eclipse 4.8 4.8 5.0 4.8 5.2 4.7 3.7 5.0 4.7 6.0 5.3 7.3 7.7Marquis 4.7 5.8 5.3 4.2 4.8 4.0 3.7 5.0 4.7 6.7 6.3 8.3 7.2PST-A 7-60 4.8 6.0 6.0 4.8 4.8 4.0 3.7 5.0 4.8 7.0 7.0 7.7 7.0Rugby II (Med-18) 5.0 6.8 6.0 4.8 4.5 4.0 5.0 5.0 5.1 8.0 6.0 9.0 6.8Goldrush (Ba 87-102) 5.0 5.5 6.5 5.5 4.3 5.0 4.5 5.0 5.0 6.7 6.0 8.7 7.2Princet on 105 5.5 6.0 6.3 4.7 4.7 5.0 4.0 5.0 5.1 6.7 6.0 9.0 6.7LTP-621 5.7 6.0 5.7 3.5 4.8 5.3 4.7 4.9 5.2 6.0 6.0 8.7 7.0Award 5.3 6.8 6.0 4.5 4.5 5.0 4.0 4.9 5.1 7.3 6.7 9.0 7.2Arcadi (J-1936) 5.3 6.3 5.5 3.0 4.8 4.5 4.5 4.9 5.0 6.7 5.3 9.0 6.5Conni 6.0 7.0 6.5 4.0 4.3 5.0 4.5 4.9 5.3 6.0 7.0 9.0 7.0Misty (Ba 76-372) 4.5 5.2 5.0 3.5 4.8 4.7 4.0 4.9 4.7 6.0 5.0 8.0 7.3Allure 6.1 6.5 6.0 4.5 4.5 5.0 5.0 4.8 5.3 5.7 6.3 9.0 7.2HV130 4.2 6.3 6.0 4.5 4.3 5.5 4.5 4.8 5.0 7.0 6.3 8.3 6.7ZPS-2572 5.5 6.3 6.5 4.0 4.3 4.0 4.0 4.8 4.9 7.7 6.3 9.0 6.3Coventry 6.5 6.3 6.5 3.8 4.0 4.5 4.5 4.8 5.2 5.3 6.3 8.7 7.5H86-690 4.7 5.3 5.3 3.8 4.7 4.0 3.3 4.8 4.6 7.7 5.0 7.0 7.2LKB-95 5.5 6.2 6.0 4.2 4.7 4.3 4.0 4.8 4.9 6.7 6.7 7.7 6.2SR2100 5.2 5.2 5.7 4.2 4.7 5.7 3.3 4.8 4.8 6.3 5.3 9.0 6.7Chicago (J-2582) 5.5 5.5 5.3 4.2 4.7 4.7 4.3 4.8 4.9 6.0 5.7 8.7 6.8Ba 75-490 5.5 5.5 5.7 4.2 4.5 4.7 4.0 4.8 4.8 6.3 6.0 9.0 6.7Limousine 5.2 6.0 5.3 3.8 5.2 4.0 3.7 4.8 4.7 6.3 6.7 7.0 6.3HV 242 5.8 6.3 5.3 4.2 4.8 4.3 3.7 4.7 4.9 6.7 6.3 8.3 6.3Rambo (J-2579)4.8 5.5 5.5 4.5 4.3 5.0 4.0 4.7 4. 6.3 6.0 8.7 6.7NuGlade 4.5 5.5 5.3 4.0 4.3 5.0 4.0 4.7 4.71 7.0 5.7 9.0 6.8Ba 81-270 5.5 6.0 6.0 4.7 4.0 5.3 4.3 4.7 5.0 5.7 6.3 8.3 6.5
This publication from the Kansas State University Agricultural Experiment Station and Cooperative Extension Service has been archived. Current information is available from http://www.ksre.ksu.edu.

15
Table 1. Performance of Kentucky bluegrass at low mowing height in Manhattan, KS._______________________________________________________________________________________________________________________
Quality* BillbugJun-Aug Apr-Nov Rust Damage
Cultivar Apr May Jun Jul Aug Oct Nov Mean Mean Color Density (Sept.) (July)_______________________________________________________________________________________________________________________Ba 70-060 5.0 5.5 5.3 3.7 4.5 4.7 3.7 4.7 4.5 6.0 5.3 7.3 6.7PST-BO-165 5.8 5.8 5.7 4.2 4.2 5.7 5.0 4.6 5.2 5.3 5.7 8.3 6.3Seabring (BA 79-260) 4.3 5.0 5.7 4.3 3.8 3.7 3.7 4.6 4.3 7.3 5.7 9.0 6.5BAR VG 3115B 5.2 6.0 5.7 3.7 4.2 3.7 3.3 4.6 4.6 5.0 5.7 4.0 6.5Pick 8 5.0 5.3 5.0 2.8 4.7 5.3 4.0 4.6 4.8 8.0 5.7 8.7 7.0Sidekick 4.8 4.6 5.3 4.2 4.2 4.3 3.7 4.6 4.5 6.0 5.3 8.0 6.7Ascot 5.0 5.7 5.7 4.2 4.3 4.3 3.7 4.6 4.6 7.0 5.3 8.0 6.5Ba 77-702 4.5 5.3 5.3 4.2 4.2 4.7 4.0 4.6 4.6 6.3 5.7 8.7 7.0A88-744 4.5 5.5 5.5 4.3 4.0 5.0 5.0 4.5 4.8 6.7 6.0 8.7 6.8Baron 5.2 6.0 5.0 4.0 4.5 4.7 4.3 4.5 4.8 6.0 5.3 8.3 6.5Ba 81-113 4.2 4.5 5.3 5.2 4.0 4.3 3.7 4.5 4.3 6.3 5.3 7.7 6.8Caliber 5.2 5.3 4.7 4.2 4.5 4.7 3.7 4.4 4.6 6.3 5.7 7.7 6.7Cardiff 5.2 5.7 5.7 4.0 3.5 3.0 2.7 4.4 4.2 7.0 6.0 8.0 6.5PST-A 418 4.0 4.8 5.0 3.8 4.2 4.0 3.0 4.4 4.2 8.0 5.3 7.0 7.7OFI 94-25 KBG 5.3 5.0 5.0 4.0 4.8 4.5 4.0 4.4 4.6 5.7 5.3 6.7 6.0Quantum Leap (J-1567) 4.0 4.8 4.5 3.8 4.3 4.5 4.0 4.4 4.4 6.7 6.0 8.3 7.3Shamrock 5.7 5.8 5.3 3.8 3.7 3.7 3.3 4.4 4.5 6.3 5.3 8.0 6.7Ba 76-197 4.8 4.5 5.3 4.0 3.8 4.7 3.3 4.4 4.4 6.3 5.3 7.3 6.7Challenger 4.3 5.5 5.0 4.0 4.2 4.7 4.3 4.4 4.6 6.3 5.3 8.0 6.8Ba 75-163 4.5 4.7 5.0 4.0 4.2 4.3 3.7 4.4 4.3 7.0 5.3 8.7 7.2BAR VG 233 5.3 6.5 5.3 3.8 3.8 3.7 3.3 4.3 4.6 6.3 6.0 8.0 6.3Haga 6.2 6.0 5.7 3.8 3.8 5.7 5.0 4.3 5.1 5.3 5.7 9.0 6.0PST-A 7-245A 4.8 5.3 5.3 4.3 3.8 4.7 4.0 4.3 4.6 6.0 5.7 9.0 6.8Raven 4.7 5.3 4.7 3.7 4.2 4.3 3.3 4.3 4.4 6.3 5.3 8.7 7.0Chateau 5.7 6.3 5.0 3.5 4.2 4.7 4.3 4.3 4.8 5.7 6.3 8.7 6.2VB 16015 4.7 4.3 4.7 3.5 4.2 3.3 2.7 4.3 4.0 7.3 5.0 8.3 6.8Platini 4.7 6.0 5.3 4.8 3.7 4.7 3.7 4.3 4.6 6.7 5.7 7.7 6.7NJ-54 4.3 5.0 5.0 4.8 3.6 3.0 2.4 4.2 4.0 6.9 5.7 7.8 6.6Baronie 6.5 5.0 5.0 4.0 3.8 5.5 5.0 4.2 5.0 5.0 6.0 9.0 6.8
This publication from the Kansas State University Agricultural Experiment Station and Cooperative Extension Service has been archived. Current information is available from http://www.ksre.ksu.edu.

16
Table 1. Performance of Kentucky bluegrass at low mowing height in Manhattan, KS._______________________________________________________________________________________________________________________
Quality* BillbugJun-Aug Apr-Nov Rust Damage
Cultivar Apr May Jun Jul Aug Oct Nov Mean Mean Color Density (Sept.) (July)_______________________________________________________________________________________________________________________BAR VG 5649 4.7 5.8 5.3 5.3 3.5 4.3 4.3 4.2 4.5 7.0 5.7 7.67 5.7OFI 94-13 KBG 4.5 4.8 4.7 3.5 4.3 4.7 4.0 4.2 4.4 5.0 4.7 8.0 6.2Dragon (ZPS-429) 3.8 4.5 4.7 4.0 3.8 3.7 3.7 4.2 4.0 7.0 5.0 8.0 6.7BAR BG 6820 3.5 4.3 5.0 4.2 3.5 3.0 3.0 4.2 3.8 7.0 5.7 9.0 6.2Ba 81-227 4.7 6.0 5.5 5.6 3.5 4.0 3.5 4.2 4.4 6.0 5.7 8.3 6.2Pick-855 3.4 4.7 4.3 3.8 4.0 3.7 3.3 4.1 4.0 6.7 5.0 7.7 6.5Compact 6.0 4.7 5.0 3.7 3.7 3.7 3.7 4.1 4.3 5.0 5.0 8.3 6.0LTP-620 4.5 5.5 4.7 4.2 3.8 4.3 4.0 4.1 4.4 6.7 5.0 8.7 6.3Classic 6.0 5.5 4.5 3.3 4.0 5.5 5.0 4.0 4.9 5.3 5.7 8.3 5.8Ba 81-220 4.5 5.3 5.0 4.0 3.7 4.0 3.5 4.0 4.2 7.0 5.7 8.0 6.7J-1555 4.2 5.2 4.7 4.0 3.7 3.7 3.7 3.9 4.1 6.7 4.7 8.3 5.8NJ-GD 5.3 5.3 4.3 3.8 3.7 4.0 3.7 3.9 4.3 6.0 5.0 8.0 6.2Bluechip (MED-1991) 4.0 4.5 4.3 3.8 3.5 3.3 3.0 3.9 3.8 7.0 4.7 9.0 6.0Sodnet 4.0 4.8 4.7 3.5 3.5 2.3 2.3 3.9 3.6 7.7 4.3 7.7 5.8Livingston 5.3 5.3 4.5 3.3 3.3 4.0 4.0 3.8 4.3 6.0 5.3 7.3 6.7Pepaya (DP 37-192) 3.3 4.8 5.5 3.5 2.8 2.5 2.0 3.8 3.4 8.0 5.0 6.0 5.3Kenblue 3.7 3.7 4.0 3.7 3.5 3.7 3.0 3.7 3.6 4.7 4.3 8.0 6.0MED-1580 4.5 5.8 4.5 4.5 3.3 3.5 3.0 3.7 4.0 7.0 5.3 6.7 6.5Absolute (MED-1497) 4.5 5.5 5.0 3.3 3.0 3.5 3.0 3.6 3.9 8.0 5.7 8.0 5.8J-1576 3.0 4.3 4.5 3.5 2.8 4.0 2.5 3.5 3.5 8.0 5.7 6.0 6.5
LSD** (p =0.05) 1.2 1.5 1.5 1.3 1.4 1.4 1.3 1.1 1.0 0.8 1.2 1.8 1.7_______________________________________________________________________________________________________________________
*Rated on a scale of 0 = dead turf to 9 = optimum density and uniformity.*To determine statistical differences among entries, subtract one entry’s mean from another’s . A statistical difference occurs when the value is larger*
than the corresponding LSD value.
This publication from the Kansas State University Agricultural Experiment Station and Cooperative Extension Service has been archived. Current information is available from http://www.ksre.ksu.edu.

17
TITLE: Flowering Ornamentals and Growing Degree Days as Indicators for CrabgrassEmergence in Midwestern Turf
OBJECTIVE: To correlate flowering times of ornamentals and growing degree days to crab-grass emergence
PERSONNEL: Jack Fry, Steve Wiest, Ward Upham, and Alan Zuk (Kansas State University)Roch Gaussoin (University of Nebraska)
SPONSOR: Kansas Turfgrass Foundation
INTRODUCTION:Efficacy of some preemergence herbicides is strongly dependent upon timing of application
relative to crabgrass emergence. Herbicides that have a relatively short residual, such as pendimethalin,provide better crabgrass control if applied near the date of germination. Applications of preemergenceherbicides after emergence is generally ineffective. In the past, turfgrass managers have employedvarious methods to determine optimum time for preemergence herbicide application, including calendardate, soil temperature, growing degree days (GDD), and flowering ornamentals. However, littleresearch has been done to correlate ornamental bloom times with crabgrass emergence.
MATERIALS AND METHODS:Crabgrass emergence. Areas at the Rocky Ford Turfgrass Research Center at Manhattan, KS
and on the University of Nebraska campus at Lincoln, NE were surveyed for smooth crabgrassemergence during the springs of 1995 through 1997. Bare ground and thin turf areas were assessedseparately, beginning in March and ending when emergence was observed.
Flowering ornamentals. During the springs of 1995 through 1997, 11 flowering ornamentalswere surveyed in Manhattan, KS and Lincoln, NE. Cultivars of ornamentals were not known. At leastone, and usually more more than one, specimen of each species was surveyed. When flower initiationor withering dates differed among specimens within a species, an average date was calculated. Ornamentals evaluated were bridal wreath spiraea (Spiraea prunifolia Sieb. and Zucc.), callery pear(Pyrus calleryana Decne.), daffodil (Narcissus spp. L.), flowering quince (Chaenomeles Lindl.), forsythia(Forsythia x. intermedia Zab.), iris (Iris spp. L.), lilac (Syringa vulgaris L.), redbud (Cercis canadensisL.), saucer magnolia (Magnolia x soulangiana Soul.-Bod.), tulip (Tulipa spp. L.), and Vanhouttespiraea [Spiraea x. vanhouttei (Briot) Zab.].
Analysis. We determined the difference between bloom date or wither date of ornamentals anda date 2 weeks before crabgrass germination. Variance analysis then was conducted on this difference. This is because we didn’t expect the date of bloom or wither to be close to the desired date but hopedto be able to predict the desired date by adding a certain number of days to the date of ornamentalbloom or wither.
Analysis of the degree-day estimation was a bit more complicated. Seven base temperaturesfrom 30 to 60 F were tested. Hourly temperatures were used to calculate the degree-days that occurredabove the base temperature from 1 January until 2 weeks before crabgrass germination (the desireddate). The base tempeatures were averaged across years. The average degree-day then was used toestimate the desired date for each year. Variance analysis was conducted on the difference between theestimated date and the desired date for each year.
This publication from the Kansas State University Agricultural Experiment Station and Cooperative Extension Service has been archived. Current information is available from http://www.ksre.ksu.edu.
18
RESULTS: Crabgrass emergence. At Manhattan, the earliest date of crabgrass emergence in bare soil was15 April 1995, whereas the latest date was 9 May 1996 (Fig. 1). In thin turf, the earliest date ofemergence was 5 May, 1997, and the latest date was 22 May, 1995.
At Lincoln, the earliest date of crabgrass emergence in bare soil was 1 June, 1996 , and the latestdate was 8 June, 1997 (Fig. 1). In thin turf, earliest emergence occurred on 10 June, 1996, and thelatest observed date was 17 June, 1997. The variability in the emergence dates from year to year,particularly in Manhattan, clearly indicates that calendar date is not a reliable indicator for determiningapplication times for preemergence herbicides.
Emergence in bare soil occurred 23 to 53 days earlier in Manhattan than in Lincoln. In thin turf,emergence at Manhattan was observed 25 to 43 days earlier than in Lincoln. This again emphasizesthat the recommended 2-week differential between these locations (i.e., April 15 vs. May 1) forschedules of preemergence herbicide applications is not consistent with differences in emergence datesobserved.
Flowering ornamentals. Candidate ornamentals were those that started and/or ended bloomprior to crabgrass emergence. A period of several days to 2 weeks between start or end of bloom andemergence would be preferred to allow application of the preemergence herbicide and activation byrainfall or irrigation. At Lincoln, all ornamentals started and ended bloom before crabgrass emergencein bare soil or thin turf (Fig. 1). However, several ornamentals ended bloom after crabgrass emergencein bare soil at Manhattan in all years and would not be reliable indicators for timing applications ofpreemergence herbicides.
Considering both locations and emergence in bare soil or thin turf, end of bloom was generally amore consistent indicator of crabgrass emergence than start of bloom (Fig. 2). Those ornamentalswhose flower wither most consistently predicted crabgrass emergence in bare soil were daffodil, callerypear, and lilac. Those whose flower wither were most accurate in predicting emergence in thin turfwere daffodil, lilac, and redbud.
Growing degree days. Lawn care and golf course personnel probably would find it much easierto observe, for instance, flower wither in daffodil than to calculate growing degree-days. However,occasions may arise when the necessary flowers are not available, such as after a particularly harshwinter. Thus, we examined the ability of hourly temperatures to estimate the timing of crabgrassemergence. Figure 3 demonstrates that using a base temperature of 50 or 55 results in the bestprediction (i.e., lowest error). In fact, the error observed for these base temperatures for germinationon bare soil was about 8.5 days, considerably lower than the lowest observed errors for ornamentalbloom (Figure 2). Errors for germination in thin turf were about the same as those observed withornamental bloom. These results indicate that crabgrass germination, and thus control measures, can beestimated by either observing bloom characteristics of selected ornamentals and/or by calculatinggrowing degree-days.
This publication from the Kansas State University Agricultural Experiment Station and Cooperative Extension Service has been archived. Current information is available from http://www.ksre.ksu.edu.

60
7080
90
100110
120
130140
150
BW
spi
rea
Cal
lery
pea
r
Daf
fodi
l
Flw
rg q
uinc
e
For
syth
ia Iris
Lila
c
Red
bud
Tul
ip
Day
of y
ear
Begin bloom
End bloom
Thin turf
Bare soil
60
80
100
120
140
160
BW
spi
rea
Cal
lery
pea
r
Daf
fodi
l
Flw
rg q
uinc
e
For
syth
ia Iris
Lila
c
Red
bud
Tul
ip
Day
of y
ear
Begin bloom
End bloom
Thin turf
Bare soil
60
80
100
120
140
160
BW
spi
rea
Cal
lery
pea
r
Daf
fodi
l
Flw
rg q
uinc
e
For
syth
ia Iris
Lila
c
Red
bud
Tul
ip
Day
of y
ear
Begin bloom
End bloom
Thin turf
Bare soil
60
7080
90
100110
120
130140
150
BW
spi
rea
Cal
lery
pea
r
Daf
fodi
l
Flw
rg q
uinc
e
For
syth
ia Iris
Lila
c
Red
bud
Tul
ip
Day
of y
ear
Begin bloom
End bloom
Thin turf
Bare soil
60
70
80
90
100
110
120
130
140
BW
spi
rea
Cal
lery
pea
r
Daf
fodi
l
Flw
rg q
uinc
e
For
syth
ia Iris
Lila
c
Red
bud
Tul
ip
Day
of y
ear
Begin bloom
End bloom Thin turf
Bare soil
60
80
100
120
140
160
BW
spi
rea
Cal
lery
pea
r
Daf
fodi
l
Flw
rg q
uinc
e
For
syth
ia Iris
Lila
c
Red
bud
Tul
ip
Day
of y
ear
Begin bloom
End bloom
Thin turf
Bare soil
19
Manhattan, KS Lincoln, NE
1995
1996
1997
Figure 1. Correlation between a date 2 weeks prior to crabgrass emergence and the start and end ofbloom of tested ornamental perennials.
This publication from the Kansas State University Agricultural Experiment Station and Cooperative Extension Service has been archived. Current information is available from http://www.ksre.ksu.edu.

5
7
9
11
13
15
17
19
21
23
25
BW
spi
rea
Cal
lery
pea
r
Daf
fodi
l
Flw
rg q
uinc
e
For
syth
ia Iris
Lila
c
Red
bud
Tul
ip
Sta
ndar
d er
ror
(Pre
dict
ed d
ate-
actu
al d
ate)
Begin bloom
End bloom
10
12
14
16
18
20
22
24
BW
spi
rea
Daf
fodi
l
For
syth
ia Iris
Lila
c
Red
bud
Tul
ip
Sta
ndar
d er
ror
(Pre
dict
ed d
ate-
actu
al d
ate)
Begin bloom
End bloom
0
500
1000
1500
2000
30 35 40 45 50 55 60
Base temperature ( oF) for degree-day calculation
Deg
ree-
days
(F
*day
s)
need
ed fo
r cr
abgr
ass
germ
inat
ion
Bare
Thin
8
9
10
11
12
13
14
30 35 40 45 50 55 60
Base temperature ( oF) for degree-day calculation
Sta
ndar
d de
viat
ion
(E
stim
ated
-Act
ual)
Bare
Thin
20
Figure 2. Error of date predicted for crabgrass germination control measure (2 weeks before crabgrassgermination) for each ornamental tested. The larger the value, the worse the error and, thus, the lessdesirable the plant is as an indicator.
Figure 3. Estimating timing of crabgrass germination control measures by calculating degree-days. Actual degree-days are shown on the left, the error at each base temperature is shown on the right.
This publication from the Kansas State University Agricultural Experiment Station and Cooperative Extension Service has been archived. Current information is available from http://www.ksre.ksu.edu.

21
TITLE: Cyclocephala in Kansas: 1997 Flight Patterns and Species Distributions
OBJECTIVES: To identify the species of Cyclocephala in Kansas and to determine flight activities with special emphasis on peak flight activity as a
tool to predict the timing of preventative grubacide applications.
PERSONNEL: Bob Bauernfeind
SPONSOR: Kansas Turfgrass Foundation
COOPERATORS:Various people who operate blacklight traps: Gary Custis (KC area - PBI); Alan Zuk
(Rocky Ford Superintendent); Cliff Dipman (Manhattan Country Club superintendent); KennyWetzel (Abilene School District); Bill Wood (Jewell County CEA, ret.); Byron Hale (DecaturCounty CEA); Craig Poe (Oakley - 4-H’er); Lawrent Buschman (Garden City, SouthwestResearch-Extension Center); Mark Olney and Darryl Kennedy (City of Liberal Parks Dept., andWillow Tree Golf Course Superintendent, respectively); Robert Pohl (Pohl’s Garden andNursery, Great Bend); Mike Daratt (Wichita HRC Field Tech.), and Joe Knickerbocker(Independence Nursery and Garden Center)
INTRODUCTION:White grubs are the most serious insect pests of high-maintenance turfgrass in Kansas.
They are the larval stages of beetles in the family Scarabaeidae. Perhaps the most commonlyrecognized scarab beetles are May and June beetles which, in late spring through summer, areattracted to lights during evening hours. Although white grub larvae of these June beetles arecapable of causing damage to turf, the white grub larvae of “masked chafers” are considered (byturf entomologists throughout the United States) to be the primary pests of high maintenanceturfgrass.
Cyclocephala species have a 1-year developmental cycle. Eggs deposited during June andJuly hatch in 1-2 weeks, and the larvae rapidly develop and become (for the most part) mature 3rdinstar larvae prior to the onset of cooler/cold weather in the fall. During this developmentalperiod, annual grubs will feed on grass root systems. Depending on grub population levels andthe condition/vigor of the turfgrass, turf may be damaged and killed late when grubs have attainedtheir most damaging stage/size in late August through September and into October.
Research has shown that the development of annual grubs can be traced back to the flightactivities of the chafers responsible for egg production. Thirty to 40 days after peak flights ofchafer occur, all grubs will have hatched from eggs, and 90% of the grubs will be in their 1st or2nd developmental stages/instars. This is an ideal time to monitor for grubs (their presence andnumbers) and apply preventative grubacide treatments if deemed necessary. Small grubs areextremely susceptible to insecticides, and will not have yet caused significant damage to the rootsystems of the turfgrass upon which they feed.
This publication from the Kansas State University Agricultural Experiment Station and Cooperative Extension Service has been archived. Current information is available from http://www.ksre.ksu.edu.

22
MATERIALS AND METHODS: Two types of blacklight traps were used to monitor chafer flights: General Purpose
Blacklight Traps (O.B. Enterprises, Inc.) and UL40 Bug Zappers (DeJay Corporation). Theelectric grids of the UL40 traps were deactivated, and the traps were fitted with funnels andcollecting cans. The traps were run over a 3-month period (May 1 - Aug. 1) during which catchesfirest of the year could be recorded as well as flight peaks.
For the most part, collections were made on a daily basis. Specimens were placed inalcohol-filled specimen containers or in plastic sacks that were placed in freezers. Dated sampleseventually were brought Kansas State University where chafer numbers were determined andspecies identified.
RESULTS: The following tables summarize the 1997 work.
Table 1. 1997 Cyclocephala Flight Activities in Kansas.____________________________________________________Trapping Site First Catch Flight Peak
of Year____________________________________________________Kansas City - 7/10Colbert Hills 6/19 7/10
Londondery 6/12 7/08Rocky Ford 6/14 7/10 Manhattan CC 6/11 7/09 Abilene 6/15 7/13Mankato 6/18 7/09 Oberlin 6/17 7/06Oakley 6/15 7/08Garden City 6/17 7/08Liberal 6/17 6/30Great Bend - 7/06Wichita HRC 6/08 7/12Independence 6/09 7/10____________________________________________________
This publication from the Kansas State University Agricultural Experiment Station and Cooperative Extension Service has been archived. Current information is available from http://www.ksre.ksu.edu.

23
Table 2. 1997 Cyclocephala Distribution in Kansas.___________________________________________________________________
Total No. Species Trap Site Chafers lurida pasadenae longula borealis___________________________________________________________________Kansas City 1,908 100.0 0.0 0.0 0.0Colbert Hills 7,194 94.3 5.3 0.0 0.4Londondery 8,575 91.6 8.4 0.0 0.01Rocky Ford 16,116 87.2 12.6 0.0 0.2Manhattan CC 6,003 96.0 3.9 0.0 0.1Abilene 651 93.4 6.0 0.6 0.0Mankato 2,610 66.1 33.9 0.0 0.0Oberlin 593 1.7 98.3 0.0 0.0Oakley 8,408 0.0 99.9 0.1 0.0Garden City 12,147 0.8 99.2 0.0 0.0Liberal 2,396 10.4 87.4 1.9 0.0____________________________________________________________________
Although an 11-day spread occurred between the initiation of chafer flights,overall, most first catches of the year were fairly well clustered. Any differences betweenthem were smoothed out, as evidenced by the dates of flight peaks. Thirteen of the 14sites experienced their respective peaks within a 7-day time frame. Only at the Liberal sitewas the peak out of line. Although substantial peaks occurred on the evenings of July 2and July 9, the total number of chafers collected on those nights were not as high as thenumber for June 30. The bottom line is that for 1997, chafer activities were very uniformthroughout Kansas as determined by the extensive east to west and north to southnetwork of blacklight traps.
As in past years, Cyclocephala lurida and C. pasadenae were the predominantspecies in Kansas. C. lurida can be seen to be a more eastern Kansas species, whereas C.pasadenae is more western in its distribution. However, either species can occur in eitherarea. Numbers of C. borealis numbers were low in comparison to all other species; it wasrecorded only from the four traps in the Manhattan area and the lone trap atIndependence.
Of interest was the appearance of C. longula in five trapping areas. Previously,this species had been recorded only from the Wichita HRC site and in numbers that nevermade up more than 5% of the total trap catch. This is in stark contrast to the 13.4%collected in 1997 Because 1997 was the first year of trapping in Abilene, Great Bend andLiberal, the frequency of appearance of C. longula at those sites is not known. But itspresence (especially at Great Bend and Liberal) is an indicator of some westerndistribution. The appearance of C. longula at the Oakley site was very interesting,because the catch at that northwest site had been 100% C. pasadenae for two previoustrapping seasons.
This publication from the Kansas State University Agricultural Experiment Station and Cooperative Extension Service has been archived. Current information is available from http://www.ksre.ksu.edu.

24
TITLE: Assessing Genetic Diversity in Ophiosphaerella herpotricha, O. korrae, andPhaeosphaeria narmari, Three Agents that Cause Spring Dead Spot ofBermudagrass
OBJECTIVE: To assess the genetic diversity of these fungi through the use of the molecular biology techniques.
PERSONNEL: Henry Wetzel and Ned Tisserat
INTRODUCTION:Spring dead spot (SDS) of bermudagrass is caused by the fungi Ophiosphaerella
herpotricha, O. korrae, and Phaeosphaeria narmari. Ophiosphaerella herpotricha is the agent thathas been associated with SDS throughout the midwest region of the transition zone, whereas O.korrae has been associated with SDS throughout the east and west coast regions of the transitionzone. Phaeosphaeria narmari is the primary cause of SDS in Australia. We reported the firstdetection of P. narmari from colonized bermudagrass obtained from the Shangri-La G.C. inAfton, Oklahoma at the 1996 American Phytopathological Meetings. Since then, we havedetected this fungus on colonized bermudagrass obtained from the Salina C.C. in Salina, Kansasin May of 1997. Classical microbiological methods have failed to reveal the reproductive biologyof these organisms. This study is using molecular biology techniques to determine whether or notpopulations of these fungi are clonal (i.e., identical) or variable on a spatial scale such as fromfairway to fairway on the same golf course or from golf course to golf course within a region.
MATERIALS AND METHODS:Numerous turfgrass samples were collected in May of 1994 from three golf courses
including: Independence G.C. in southeast Kansas and South Lakes G.C. and Shangri-La G.C. innortheast Oklahoma. An additional 272 isolates were collected from Shangri-La G.C. in May of1996 to confirm previous results on the possibility of all three SDS agents coinciding on the samefairway. Bermudagrass roots exhibiting the presence of darkly pigmented ectotrophic runnerhyphae were washed, surface sterilized, and plated on selective medium. Cultures exhibiting O.herpotricha colony morphology then were transferred to liquid media in preparation for theisolation of deoxyribonucleic acid (DNA). The DNA then was extracted, and isolate identity wasconfirmed with specific polymerase chain reaction (PCR) primers for O. herpotricha and O.korrae. In July of 1997, we developed P. narmari-specific PCR primers so we now can identifythis fungus from infected bermudagrass samples. Once isolates are identified through PCR, anadditional set of PCR primers, developed from a DNA library of O. herpotricha, then isimplemented to assess the similarities and differences among the O. herpotricha isolates. Atechnique known as random amplified polymorphic DNA (RAPD) PCR also will be used to assessand verify genetic diversity among O. herpotricha, O. korrae, and P. narmari isolates.
This publication from the Kansas State University Agricultural Experiment Station and Cooperative Extension Service has been archived. Current information is available from http://www.ksre.ksu.edu.

25
RESULTS:Isolates collected in May 1994 from Independence G.C., South Lakes G.C. and Shangri-
La G.C. have been identified to species. All isolates from the South Lakes G.C. appeared to beO. herpotricha. The majority of the isolates from the Independence G.C. were O. herpotricha;however, nine isolates of O. korrae were recovered from this course. This is the first golf coursein Kansas where O. korrae has been detected on bermudgrass. The majority of the isolates fromShangri-La G.C. were O. herpotricha; however, four isolates each of O. korrae and P. narmariwere recovered from this course. Results of the resampling of Shangri-La G.C. in May 1996were as follows: 141 O. herpotricha, 71 O. korrae, 30 P. narmari, and 30 unidentified isolates. We now evidence to support identification of the P. narmari isolates based on comparisons oftheir internal transcribed ribosomal DNA sequences to that of P. narmari isolates from Australia. Five of the 30 Afton, Oklahoma P. narmari isolates are 98% identical to four of the 12 AustralianP. narmari isolates for which we have DNA sequences.
Preliminary data have been assessed for genetic diversity among the Shangri-La G.C. O.herpotricha isolates collected in 1994. Results indicate that many genotypes coexist within anindividual fairway. This suggests that sexual recombination is occurring frequently among thepopulations of O. herpotricha. These initial results need to be repeated, and genetic diversity ofthe remaining two golf course samples needs to be assessed. Because of the more frequentoccurrence of O. korrae and P. narmari from the second sampling trip in May of 1996 toShangri-La G.C., we will begin to assess the genetic diversity of these species with the RAPDPCR assay and also use this assay to verify genetic diversity in O. herpotricha isolates.
This publication from the Kansas State University Agricultural Experiment Station and Cooperative Extension Service has been archived. Current information is available from http://www.ksre.ksu.edu.

26
TITLE: Dollar Spot Susceptibility and Fungicide Programs for Four CreepingBentgrass Cultivars
OBJECTIVES: To evaluate bentgrass cultivars for susceptibility to disease and to investigate the effectiveness of fungicide management regimes for influence
on turf quality, applications required, and active ingredient applied.
PERSONNEL: Derek Settle, Jack Fry, and Ned Tisserat
SPONSORS: Kansas Turfgrass Foundation, Kansas Golf Course Superintendent'sAssociation
INTRODUCTION:More fungicide is applied to creeping bentgrass putting greens per unit area than any other
area of the golf course. Superintendents often choose to use a preventive application schedule,following the “better safe than sorry” approach. In some cases, this preventive schedule results inapplication of more fungicide and higher associated labor costs, with little or no visual qualitygain. Information is needed on how cultivar selection, pesticide selection, and application strategy(preventive vs. curative) influence turf quality and the total amount of active ingredient applied.
MATERIALS AND METHODS:The study was conducted in the summer of 1997 on a USGA green at the Rocky Ford
Turfgrass Research Center. The bentgrass was mowed daily at 5/32 inch, irrigated with 1 mm ofwater daily, and received a season total of 4.4 lbs N / 1000 sq ft. The experimental design was asplit plot with three replications. Whole plots consisted of four creeping bentgrass cultivars: L-93, Crenshaw, Penncross, and Providence. Subplots were 3.3 ft X 7.2 ft and consisted of fivefungicide treatments. Fungicides were applied at various intervals depending on treatment from 6June to 30 September at the manufacturers' recommended rates (Table 1). The treatments andformulations included: 1) Non-treated; 2) Chipco 2F 26019 @ 4 fl oz/1000 sq ft every 14 days; 3)Chipco 2F 26019 @ 4 fl oz/1000 sq ft as needed when the number of dollar spots per plotincreased from previous week's numbers in at least two of the three replicates; 4)Prostar 50WP @3 oz/1000 sq ft + Bayleton 25WG @ 0.5 oz/1000sq ft every 28 days; and 5)Chipco AlietteSignature 80WP @ 4 oz/1000 sq ft + Chipco 26019 2F @ 4 fl oz/1000 sq ft every 14 days. Fungicides were applied with a CO2-powered backpack sprayer equipped with 8004 nozzles at 20psi in water equivalent to 2 liters/144 sq ft. Weekly visual ratings were given to each fungicidesubplot on a 0-9 scale, where 6=acceptable quality. Dollar spot numbers were counted andrecorded for all plots weekly beginning at first appearance on 7 July and continuing until 9October.
RESULTS:The weather during the summer of 1997 was relatively cool and dry. The only disease
observed was dollar spot. Therefore, turf quality in nonfungicide treated plots was primarily afunction of damage caused by dollar spot. Crenshaw exhibited the greatest susceptibility to dollarspot in nontreated plots and had the lowest turf quality rating (Fig.1). L-93, Penncross and
This publication from the Kansas State University Agricultural Experiment Station and Cooperative Extension Service has been archived. Current information is available from http://www.ksre.ksu.edu.

27
Providence consistently had fewer spots and higher quality ratings (Fig.1). In fact, L-93 exhibitedacceptable quality (rating >6) throughout the summer in nontreated plots. This suggests thatcertain bentgrass cultivars may maintain high quality in the absence of fungicides in some years.
Applications of fungicides to protect bentgrass from dollar spot increased turf qualityratings (data not shown). The Aliette + Chipco 26019 (14 day), Chipco 26019 (14 day), Chipco26019 (curative), and Prostar + Bayleton (28 day) treatments all resulted in better quality ratings(6-8) by adequately controlling dollar spot all season. Crenshaw did not exhibit acceptable qualitywith the Prostar + Bayleton combination after 1 August. This illustrates that cultivars more proneto diseases, such as dollar spot, may require a more frequent spray interval during periods of highdisease pressure. Application of Chipco 26019 on a curative schedule was as effective insuppressing dollar spot and maintaining turf quality as the preventive application of the samefungicide on a 14 day interval. The curative schedule resulted in six fewer applications and overthree times less active ingredient applied when compared to the preventive program. The Chipco26019 + Aliette Signature (14 day) resulted in >16 times more active ingredient applied than theChipco 26019 curative program.
Table 1. Fungicide treatments, number of applications, and total active ingredient for creepingbentgrass study at Manhattan, KS in 1997. Treatment Rate No. Applications Total ai (oz/1000sq ft) Chipco 26019 4 fl oz 9 9.0(14-days)
Chipco 26019 4 fl oz 2 or 3* 2.0 or 3.0*(Curative)
Prostar + Bayleton(28 days) 4 oz + 4 fl oz 5
8.8
Chipco 26019 + Aliette Signature(14-days) 4 oz + 4 fl oz 9
37.8
*Curative treatment number and the associated a.i. total varied according to bentgrass cultivar(Crenshaw required three fungicide applications, versus two for L-93, Penncross, Providence).
This publication from the Kansas State University Agricultural Experiment Station and Cooperative Extension Service has been archived. Current information is available from http://www.ksre.ksu.edu.
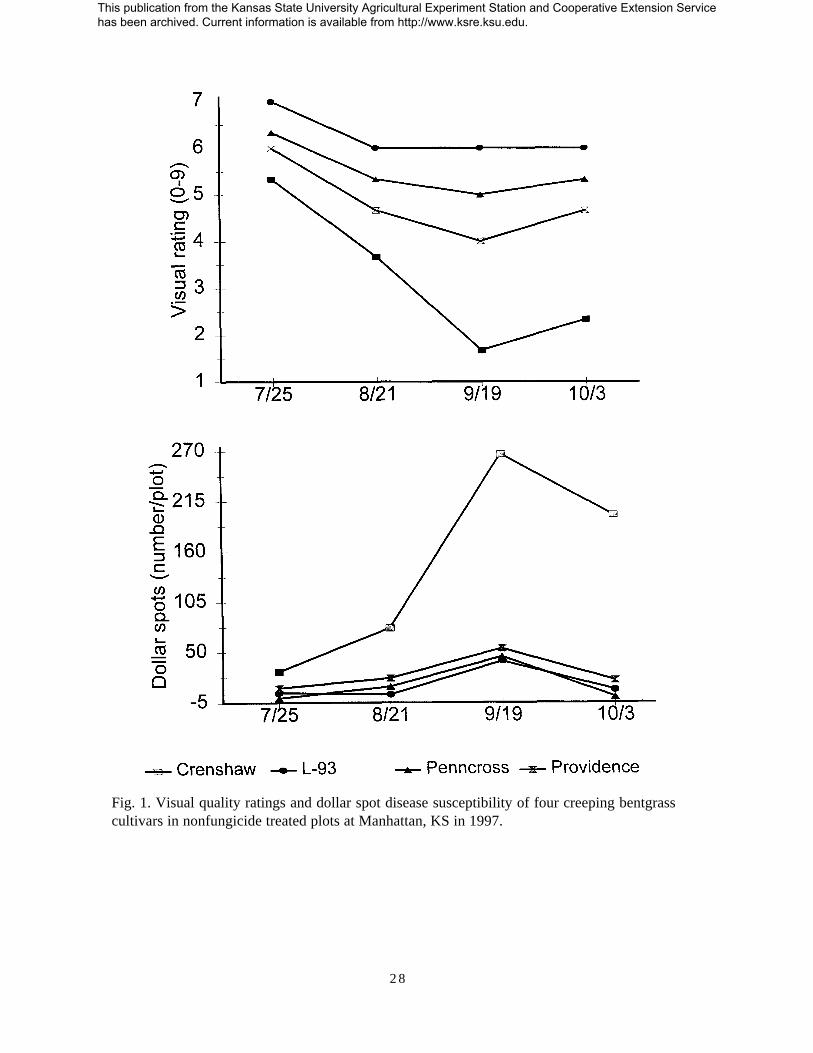
Fig. 1. Visual quality ratings and dollar spot disease susceptibility of four creeping bentgrasscultivars in nonfungicide treated plots at Manhattan, KS in 1997.
2 8
This publication from the Kansas State University Agricultural Experiment Station and Cooperative Extension Service has been archived. Current information is available from http://www.ksre.ksu.edu.
29
TITLE: Preventive Fungicide Applications for Control of Dollar Spot on Creeping Bentgrass
OBJECTIVES : To evaluate the effectiveness of various fungicides for control dollar spoton creeping bentgrass and to determine whether certain fungicidecombinations enhance turf quality in the absence of disease.
PERSONNEL: Derek Settle, Jack Fry, and Ned Tisserat
SPONSORS: Rhone Poulenc, Terra, AgrEvo, Rohm & Haas, Kansas TurfgrassFoundation, Heart of America Golf Course Superintendent’s Association,and the Kansas Golf Course Superintendent’s Association
MATERIALS AND METHODS :Fungicides were evaluated on an established stand of Cohansey bentgrass on a sand-based
putting green at the Rocky Ford Turfgrass Research Center, Manhattan, KS. The turf wasmowed at 0.16 in, irrigated as needed, and fertilized with 4 lb N/1000 sq ft annually. Treatmentsincluded 11 fungicide applications and a no-fungicide control. Applications were made at 2-wkintervals beginning on 13 June and continuing through 21 August. Fungicides were applied with aCO -powered backpack sprayer with 8003 TeeJet nozzles at 30 psi in water equivalent to 5.32
gal/1000 sq. feet. Plots were not irrigated after applications. Plots were 5 ft x 6 ft and arrangedin a randomized complete-block design with three replications. Plots were rated every 2 weeksfor the percent area damaged by dollar spot and for overall turfgrass quality.
RESULTS:The summer was relatively warm and dry. The only disease that was continuously active
on the putting surface was dollar spot. Only one minor outbreak of brown patch and no Pythiumblight were observed. In general, all fungicides except Aliette, Prostar and Heritage reduced theincidence of dollar spot by the final rating date (Table 1). Applications of Aliette Signature pluseither Chipco GT, EXP10702B, or Chipco 26019 Flo did not significantly improve turfgrassquality over application of Chipco 26019 Flo alone.
This publication from the Kansas State University Agricultural Experiment Station and Cooperative Extension Service has been archived. Current information is available from http://www.ksre.ksu.edu.
30
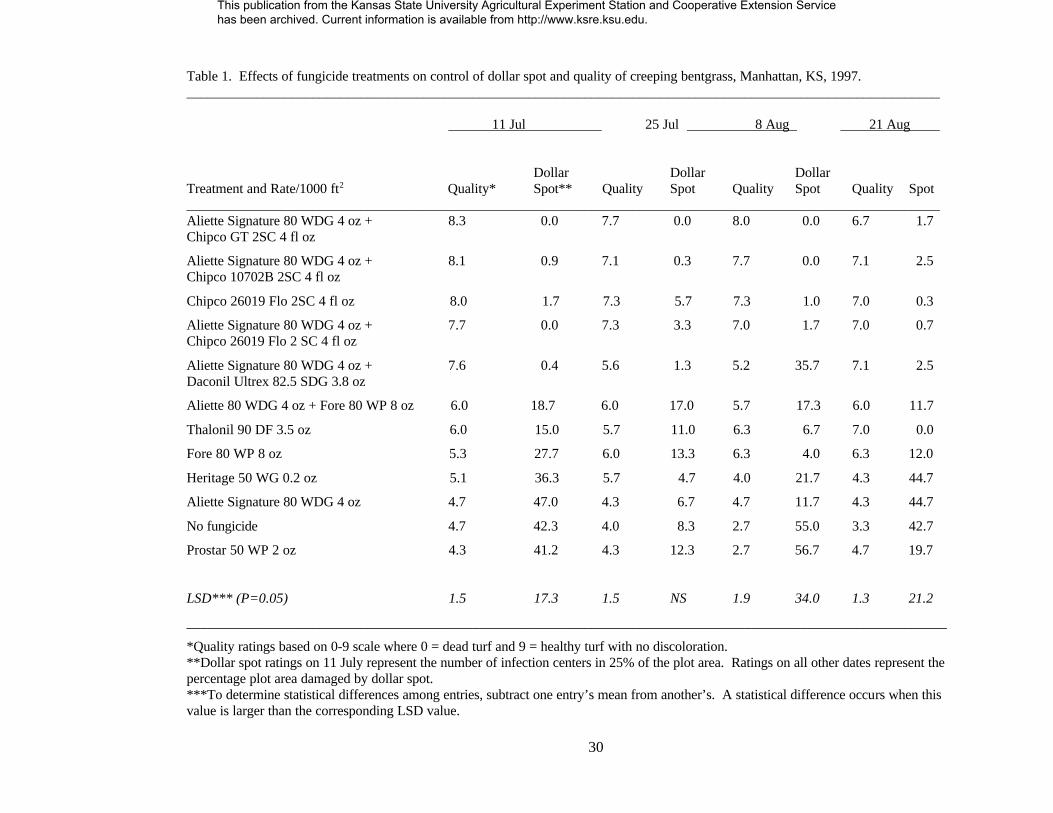
Table 1. Effects of fungicide treatments on control of dollar spot and quality of creeping bentgrass, Manhattan, KS, 1997.____________________________________________________________________________________________________________
11 Jul 25 Jul 8 Aug 21 Aug
Dollar Dollar DollarTreatment and Rate/1000 ft Quality* Spot** Quality Spot Quality Spot Quality Spot2
____________________________________________________________________________________________________________ Aliette Signature 80 WDG 4 oz + 8.3 0.0 7.7 0.0 8.0 0.0 6.7 1.7Chipco GT 2SC 4 fl oz
Aliette Signature 80 WDG 4 oz + 8.1 0.9 7.1 0.3 7.7 0.0 7.1 2.5Chipco 10702B 2SC 4 fl oz
Chipco 26019 Flo 2SC 4 fl oz 8.0 1.7 7.3 5.7 7.3 1.0 7.0 0.3
Aliette Signature 80 WDG 4 oz + 7.7 0.0 7.3 3.3 7.0 1.7 7.0 0.7Chipco 26019 Flo 2 SC 4 fl oz
Aliette Signature 80 WDG 4 oz + 7.6 0.4 5.6 1.3 5.2 35.7 7.1 2.5Daconil Ultrex 82.5 SDG 3.8 oz
Aliette 80 WDG 4 oz + Fore 80 WP 8 oz 6.0 18.7 6.0 17.0 5.7 17.3 6.0 11.7
Thalonil 90 DF 3.5 oz 6.0 15.0 5.7 11.0 6.3 6.7 7.0 0.0
Fore 80 WP 8 oz 5.3 27.7 6.0 13.3 6.3 4.0 6.3 12.0
Heritage 50 WG 0.2 oz 5.1 36.3 5.7 4.7 4.0 21.7 4.3 44.7
Aliette Signature 80 WDG 4 oz 4.7 47.0 4.3 6.7 4.7 11.7 4.3 44.7
No fungicide 4.7 42.3 4.0 8.3 2.7 55.0 3.3 42.7
Prostar 50 WP 2 oz 4.3 41.2 4.3 12.3 2.7 56.7 4.7 19.7
LSD*** (P=0.05) 1.5 17.3 1.5 NS 1.9 34.0 1.3 21.2
_____________________________________________________________________________________________________________
*Quality ratings based on 0-9 scale where 0 = dead turf and 9 = healthy turf with no discoloration.**Dollar spot ratings on 11 July represent the number of infection centers in 25% of the plot area. Ratings on all other dates represent thepercentage plot area damaged by dollar spot.***To determine statistical differences among entries, subtract one entry’s mean from another’s. A statistical difference occurs when thisvalue is larger than the corresponding LSD value.
This publication from the Kansas State University Agricultural Experiment Station and Cooperative Extension Service has been archived. Current information is available from http://www.ksre.ksu.edu.

31
TITLE: Influence of Irrigation Management on Disease Development in PerennialRyegrass
OBJECTIVE: To evaluate effects of irrigation management and fungicide regimes onperennial ryegrass quality and brown patch infection.
PERSONNEL: Derek Settle, Jack Fry, and Ned Tisserat
SPONSORS: Heart of America Golf Course Superintendent's Association, Kansas GolfCourse Superintendent's Association, Golf Course Superintedent'sAssociation of America
INTRODUCTION:Daily irrigation is assumed to enhance disease severity when compared to irrigation
schedules that supply the same amount of water, but less frequently. However, our results overthe past 2 years indicate that more brown patch occurs in perennial ryegrass plots wateredinfrequently than those watered daily. This year we reduced the previous daily irrigation amountof 7.5 mm/day by 2.5 mm/day and applied 5 mm/day. Several fungicide application strategies alsowere compared for efficacy in disease control, and number of applications and total activeingredient required are reported.
MATERIALS AND METHODS:The study was conducted in the summer of 1997 on an established perennial ryegrass
blend maintained at ½ inch fairway mowing height at the Rocky Ford research site. The ryegrasswas fertilized with urea (46-0-0) in September, November, and May to provide a total of 3 lbN/1000 sq ft. The experimental design was a split plot with three replicates. The whole plotswere 30 ft X 100 ft and consisted of two irrigation schedules: 1) 5 mm daily and 2) irrigationevery third day to replace 80% of atmometer-estimated evapotranspiration. Pop-up, gear-driven,Nelson 6000 irrigation heads were used to deliver water to plots. Subplots were 12 ft X 12 ft andconsisted of the following fungicide treatments: 1) no fungicide application; 2) monthly preventiveapplications of Prostar at 3 oz/1000 sq ft; 3) curative applications of Daconil Ultrex at 3.8oz/1000 sq ft immediately following any symptoms of brown patch; and 4) applications of DaconilUltrex at 3.8 oz/1000 sq ft based on a brown patch disease warning model. Fungicides wereapplied to turf with CO2-powered sprayer at 20 psi using 8003 flat fan nozzles in water equivalentto 2 liters per 144 sq ft. Visual quality ratings were made weekly for each fungicide plot on a 0-9scale, where 0=dead turf and 9=optimum color density and uniformity. Disease incidence wasquantified by estimating the visual % plot damage by brown patch and by counting the number ofinfection centers per plot for dollar spot. An infestation of rough bluegrass (Poa trivialis) wasobserved in August and rated visually for % cover. Soil microbial activity was determined byrandomly coring the upper 5 cm from plots in each of the two irrigation regimes. The soil thenwas processed and sealed into air-tight serum bottles that could allow extraction of air samplesusing a needle syringe. The air was extracted five consecutive times during a 48-hour period andinjected into a gas chromatograph that measured CO2 concentration.
This publication from the Kansas State University Agricultural Experiment Station and Cooperative Extension Service has been archived. Current information is available from http://www.ksre.ksu.edu.

32
RESULTS:Irrigation regimes began on June 10 and ended on September 4, 1997. Approximately
twice as much water was applied to the daily blocks versus turf irrigated to replace 80% ofestimated ET (Fig.1). Brown patch severity was light in 1997 with only one major infectionperiod. Brown patch was greater in the ET plots versus daily irrigated plots (Fig 1) The secondobserved disease, dollar spot, exhibited greater activity in the daily irrigation regime (42 infectioncenters per plot) compared to the ET regime (10 infection centers per plot) on August 21 (Fig.1).
An undesirable grass species, Poa trivialis, was observed in midsummer. It was likely aseed contaminant. Coverage was 41% greater in the daily ET-irrigated plots on Sept. 9 (Fig. 1).
Almost 50% more fungicide (active ingredient) was required by following a preventiverather than curative program (Table 1). The preventative flutolanil fungicide treatmentexacerbated dollar spot, and twice as many infection sites were counted than in untreated turf(data not shown). A weather model that relies on a location's daily relative humidity andminimum temperature accurately predicted the July 22 brown patch episode and suppresseddisease effectively (1.2% plot damage). However, the model predicted an additional seven spraydates that were not associated with any brown patch occurrence at the site.
Carbon dioxide was measured on 27 August to investigate differences in microbial activitylevel between the two irrigation treatments. CO2 evolution over a 48-hour period was 6.32 ug/gdry soil/hr in daily irrigated turf compared to 4.44 ug/g dry soil/hr from ET-irrigated turf. Thisindicates a greater population of microbes in the soil under daily irrigated turf, some of whichcould be suppressing brown patch. Continued research will focus on both micro-environment andplant physiological indicators that may be responsible for altering disease development underdiffering irrigation regimes.
Table 1. Fungicide treatments, number of applications, and total active ingredient applied toperennial ryegrass at Manhattan, KS in 1997._____________________________________________________________________Treatment Application Rate of a.i. Number of TotalApplied (oz.) Regime oz/1000 sq ft Applications a.i._____________________________________________________________________No fungicide 0 0 0Flutolanil Preventive 1.5 4 6Chlorothalonil Curative 3.1 1 3.1Chlorothalonil Model* 3.1 4 12.4_____________________________________________________________________*Model based on Rocky Ford weather station data, minimum daily temperature and average dailyrelative humidity, used to predict brown patch outbreaks. (Fidanza, M. A. et. al. 1995. Development and Field Validation of a Brown Patch Warning Model for Perennial Ryegrass Turf. Phytopathology 86:4).
This publication from the Kansas State University Agricultural Experiment Station and Cooperative Extension Service has been archived. Current information is available from http://www.ksre.ksu.edu.

6-10 to 9-4-97 7-22-97
Figure 1. Irrigation treatment effects on total water applied, brown patch, dollar spot, and roughbluegrass on perennial ryegrass in 1997. Irrigation treatments were significantly different on alldates (P ≤ 0.05).
3 3
This publication from the Kansas State University Agricultural Experiment Station and Cooperative Extension Service has been archived. Current information is available from http://www.ksre.ksu.edu.
34
TITLE: Effects of Aerification and Fungicide Application on the Development of Summer Patch Disease in Mystic Kentucky Bluegrass
OBJECTIVE: To evaluate the use of aerification with a fungicide application to suppress summer patch disease in Kentucky bluegrass maintained under
golf course fairway conditions.
PERSONNEL: Henry Wetzel
SPONSORS: Bayer, ISK Biosciences, Novartis, Rohm & Haas, and Zeneca
MATERIALS AND METHODS:An experiment to test the effects of fungicide application and aerification was established
on a 4-year-old stand of Mystic Kentucky bluegrass at the Rocky Ford Turfgrass ResearchCenter. The experimental design was a completely randomized block with four replications, andthe treatment structure was a split plot with the whole plot (120 ft ) receiving fungicide and the2
subplot (60 ft ) receiving aerification. Aerification was done on 18 Oct 96 and 25 Mar 97 with a2
Ryan Greensair equipped with 0.37 in. hollow tines. The aerification cores were verticut toamend the soil back into the plots, and the remaining thatch was raked and discarded. Wholeplots were inoculated on 31 Mar 97 at 10 random locations each with 0.18 oz of oat kernelsinfested with a single M. poae isolate collected from the experimental area in the previous year to a2 in. depth with a 0.75 in. diam. soil probe. The turfgrass was reel mowed three times per weekat 0.75 in. to mimic a golf course fairway situation and received 3.0 lb N/1000 sq ft/year. Irrigation was applied deeply and infrequently to maintain adequate soil moisture. Fungicides(Table 1) were applied on 28 Apr, 24 May, and 21 Jun 97 in 2.2 gal H O/1000 sq ft with a2
backpack CO pressurized (36 psi) sprayer equipped with three flat-fan TeeJet 8010 nozzles. 2
Fungicides were not watered in following treatment. Dimension and Trimec Classic each wasapplied at the rate of 1.5 fl oz/1000 sq ft on 6 May 97 for preemergence crabgrass andpostemergence broadleaf weed control, respectively. Merit 0.5G was applied at the rate of 1.4lb/1000 sq ft on 28 May 97 for the preventative control of subsurface-feeding white grubs.
Summer patch disease severity was assessed visually as a percent of plot area blighted byM. poae on a 0 to 100% scale where 0 = no blighting and 100 = entire plot area blighted. Turfgrass blight ratings exceeding 5.0% would be considered unacceptable control of M. poae. Turfgrass quality was assessed on a 0 to 10 scale, with 0 being completely brown or dead turf; 8being minimal acceptable quality for golf course fairway turf; and 10 being optimum turf densityand greenness. Data were analyzed using the SAS PROC MIXED procedure, and significantlydifferent treatment means were separated using the least squares means or Fisher's protected LSDprocedures at the P = 0.05 level.
RESULTS:Summer patch symptoms were noted first on 28 Jul and reached their greatest expression
on 15 Aug (Table 2), mainly because of natural infestations of M. poae. Generally, summer patchdisease pressure was light, probably because of minimal rainfall and mild temperatures during thespring. Turfgrass quality ratings reflected disease severity in all treatments.
This publication from the Kansas State University Agricultural Experiment Station and Cooperative Extension Service has been archived. Current information is available from http://www.ksre.ksu.edu.

35
Bayleton-, Eagle- and Heritage-treated plots exhibited acceptable quality for golf course fairwayturf regardless of aerification treatment. Turfgrass quality improved in the Fluazinam-treatedplots that were not aerified but was not significantly different than that of the control plots. Heritage, Bayleton, and Eagle significantly reduced summer patch symptoms in the aerified plots. Sentinel reduced blighting under an aerified regime but was associated with an increase inblighting in nonaerified turf. Fluazinam was associated with increased blighting relative to otherfungicides in aerified plots, but blight levels in nonaerified turf were similar to those for all othertreatments except Sentinel.. Control plots that were not aerified had significantly less summerpatch compared to aerified control plots, suggesting that disease severity was enhanced under anaerified regime in the absence of a fungicide treatment.
In addition, an epidemic of leaf rust, caused by Puccinia spp., was observed in late Septinto early Oct on the same Kentucky bluegrass plot area where the summer patch study wasconducted. Turfgrass quality ratings of the whole plot area were collected on 10 Oct 97. Overall,16 weeks after the final fungicide application on 21 June, Eagle-, Sentinel-, and Bayleton-treatedplots were exhibiting control of leaf rust, whereas Fluazinam- and Hertiage-treated and controlplots each exhibited a significant amount of rust pustules that detracted from their overallturfgrass quality (Table 3).
Table 1. Fungicide treatments applied to Mystic Kentucky bluegrass at the Rocky Ford Turfgrass Research Center in Manhattan, KS, 1997.
_______________________________________________________Treatment Rate Application Dates_______________________________________________________
oz/1000 sq ft1. Eagle 40 WP 1.2 28 Apr, 24 May, 21 Jun2. Fluazinam 500F 1.5 28 Apr, 24 May, 21 Jun3. Sentinel 40WG 0.25 28 Apr, 24 May, 21 Jun4. Heritage 50WG 0.4 28 Apr, 24 May, 21 Jun5. Bayleton 25DF 4.0 28 Apr, 24 May, 21 Jun6. Control – 28 Apr, 24 May, 21 Jun_______________________________________________________
This publication from the Kansas State University Agricultural Experiment Station and Cooperative Extension Service has been archived. Current information is available from http://www.ksre.ksu.edu.

36
Table 2. Turfgrass quality and percent plot area blighted in a stand of Mystic Kentucky bluegrass as influenced by fungicide and aerification treatments in the presence of M. poae, the cause ofsummer patch disease in Manhattan, KS on 15 August 1997.
___________________________________________________________________________
Turfgrass Quality Plot Area Blighted ‡ †
Treatment Aerified Not Aerified Aerified Not Aerified
___________________________________________________________________________
1. Eagle 40 WP 8.2 bcd* 8.1 cd 3.0 cd 2.8 cd
2. Fluazinam 6.4 ef 7.6 d 10.6 b 3.0 cd
3. Sentinel 40WG 7.5 de 6.4 ef 5.5 c 11.9 ab
4. Heritage 50WG 9.5 a 9.4 ab 0.0 d 0.2 d
5. Bayleton 25DF 9.0 abc 8.9 abc 1.1 cd 1.1 cd
6. Control 5.4 f 7.6 d 16.2 a 5.1 c
____________________________________________________________________________
Turfgrass quality was assessed on a 0 to 10 scale, with 8 being minimal acceptable quality for a‡
golf course fairway.
Summer patch disease severity expressed as percent plot area of the turfgrass stand blighted. †
Means within a rated parameter followed by the same letter are not significantly different *
according to the least squares means procedure at P=0.05.
Table 3. Whole-plot turfgrass quality rating reflecting the severity of leaf rust (Puccinia spp.) inMystic Kentucky bluegrass in Manhattan, KS on 10 October 1997.
___________________________________________
Treatment Turfgrass Quality ‡
___________________________________________
1. Eagle 40WP 8.1 a*
2. Fluazinam 500F 6.9 b
3. Sentinel 40WG 8.4 a
4. Heritage 50WG 7.0 b
5. Bayleton 25DF 8.7 a
6. Control 7.0 b
___________________________________________
Turfgrass quality was assessed on a 0 to 10 scale, with 8 being minimal acceptable quality for a‡
golf course fairway.
Means followed by the same letter are not significantly different according Fisher's protected*
LSD procedure at P=0.05.
This publication from the Kansas State University Agricultural Experiment Station and Cooperative Extension Service has been archived. Current information is available from http://www.ksre.ksu.edu.

37
TITLE: Effects of Cultivar, Fungicide Applications, and Clipping Removal onDevelopment of Rhizoctonia Brown Patch on Tall Fescue.
OBJECTIVE : To evaluate management options for control of Rhizoctonia brown patchof tall fescue.
PERSONNEL: Ned Tisserat and John Pair
SPONSORS: Kansas Turfgrass Foundation
MATERIALS AND METHODS:
Tall fescue plots were established at the Horticulture Research Center, Wichita, in thespring of 1996. The experimental design was a split-split plot. The cultivars (main plots) AFA,Houndog V, Jaguar 3 and Kentucky 31 were seeded in early April at a rate of 6 lb/1000 sq ft. Cultivars were mowed (subplots)every 4-5 days at a height of 2 ½ inches with 1) a mulchingmower in which the clippings were returned to the turf or 2)with a mower in which clippings werecollected and removed from the plots. Each subplot received 1) no fungicide treatment; 2) preventive applications of Prostar at 3 oz/1000 sq ft on 5 Jun, 1 Jul, and 30 Jul; or 3) curativeapplications of Daconil Weather Stik at 6 oz/1000 sq ft on 18 and 30 Jul. Individual plots were 8X 4 ft and were replicated three times. Fungicides were applied in water equivalent to 4 gal/1000sq ft at 30 psi with 8004 flat-fan nozzles using a CO -powered backpack sprayer. Plots were2
rated for % plot area damaged.
RESULTS:
No significant interactions occurred among cultivars, mowing, or fungicide treatments. Therefore, only main treatment effects are presented. In general, KY-31 sustained the leastamount of damage resulting from brown patch and Pythium blight (Fig. 1). Previous studies haveshown that the open growth habit of KY-31 is less conducive to brown patch development. However, KY-31 did not have aesthetically high quality during periods when diseases were notactive.
Returning clippings to the turf (mulching mower) did not significantly affect diseaseseverity, except on 30 Jul (Fig. 2). These results suggest that returning grass clippings with amulching mower does not influence the development of brown patch. However, mulchingmowers may slightly increase the severity of Pythium blight.
Preventive monthly fungicide treatments with Prostar were effective in reducing brown patchin mid July (Fig. 3). These results suggest that one or two monthly applications may adequatelysuppress brown patch. Unfortunately, Prostar has no efficacy against Pythium blight. Plotstreated with Prostar were not significantly different in the amount of disease at the last twosampling dates. Curative applications of Daconil were somewhat effective in reducing brownpatch severity on 24 Jul (curative application on 18 Jul) but were only moderately effective insuppressing Pythium blight.
This publication from the Kansas State University Agricultural Experiment Station and Cooperative Extension Service has been archived. Current information is available from http://www.ksre.ksu.edu.
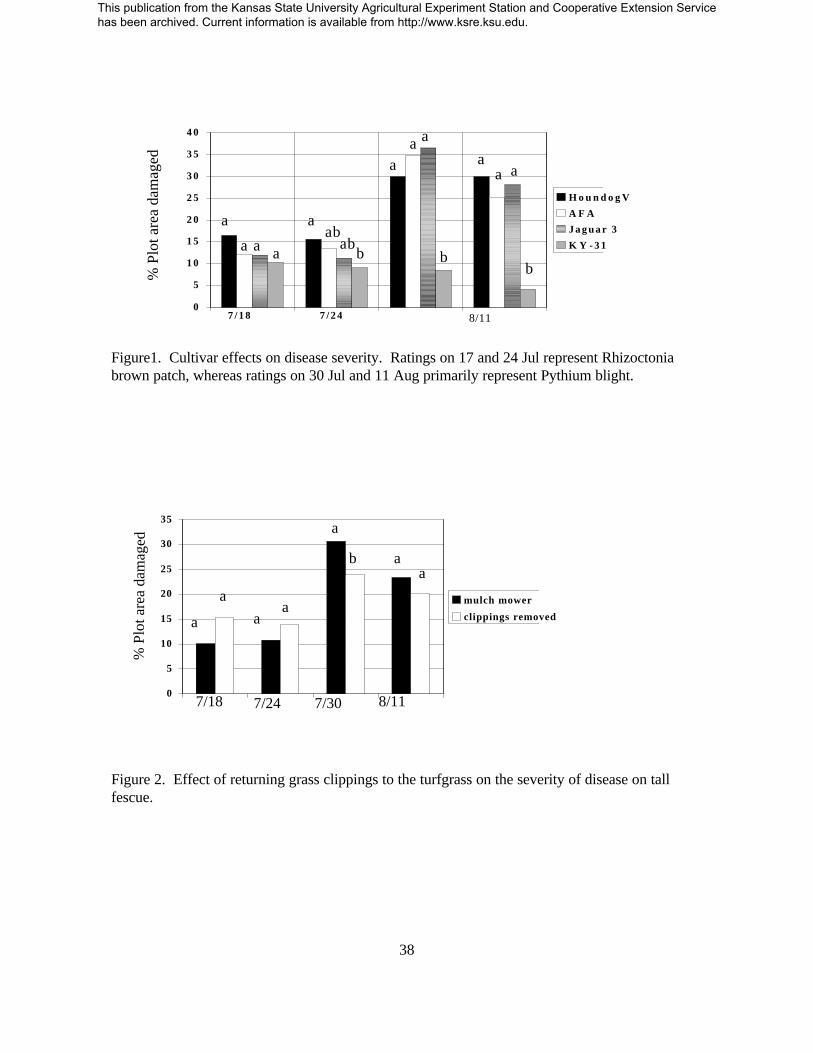
0
5
1 0
1 5
2 0
2 5
3 0
3 5
4 0
H o u n d o g V
A F A
Jagua r 3
K Y - 3 1
7 /18 7 /24 8/11
a
a a a
aab
abb
aa a
b
aa a
b% P
lot a
rea
dam
aged
0
5
10
15
20
25
30
35
mulch mower
clippings removed
7/18 7/24 7/30 8/11
% P
lot a
rea
dam
aged
a
a
aa
a
b aa
38
Figure1. Cultivar effects on disease severity. Ratings on 17 and 24 Jul represent Rhizoctoniabrown patch, whereas ratings on 30 Jul and 11 Aug primarily represent Pythium blight.
Figure 2. Effect of returning grass clippings to the turfgrass on the severity of disease on tallfescue.
This publication from the Kansas State University Agricultural Experiment Station and Cooperative Extension Service has been archived. Current information is available from http://www.ksre.ksu.edu.

0
5
1 0
1 5
2 0
2 5
3 0
3 5
4 0
Con t ro l
D aconi l , curat ive
P ros ta r 28 days
7/18 7/24 7/30 8/11
a
b
c
a
b
c
a
b
a
aa
a
% P
lot a
rea
dam
aged
39
Figure 3. Effects of fungicides on reductions of brown patch (18 and 24 Jul) and Pythium blight(30 Jul and 11 Aug). Preventive applications of Prostar were made at approximate 1 monthintervals beginning 5 Jun. Curative applications of Daconil were made on 18 and 30 Jul.
This publication from the Kansas State University Agricultural Experiment Station and Cooperative Extension Service has been archived. Current information is available from http://www.ksre.ksu.edu.

40
TITLE : Preventive Fungicide Applications for Control of Rhizoctonia Brown Patchof Tall Fescue.
OBJECTIVE : To evaluate the effectiveness of a preventive fungicide spray program tocontrol brown patch disease.
PERSONNEL: Ned Tisserat and John Pair
SPONSORS: Novartis, Rhone Poulenc, Agrevo, Bayer, Zeneca, Terra, and the KansasTurfgrass Foundation
MATERIALS AND METHODS :
Fungicides were evaluated on an established stand of tall fescue (blend of threeunidentified cultivars) at the Horticulture Research Center, Wichita, KS. Fourteen fungicidetreatments were applied on 5 Jun, 1 Jul, and 30 Jul with a CO -powered backpack sprayer with2
8003 TeeJet nozzles at 30 psi in water equivalent to 2.9 gal/1000 sq ft. Plots were not irrigatedafter applications. Plots were 6 ft X 10 ft and arranged in a randomized complete-block designwith three replications. Plots were rated every 2 weeks for the percent area damaged byRhizoctonia brown patch.
RESULTS:
Brown patch was not present on tall fescue until late July. Symptoms were present inplots in late July but at relatively low levels. All fungicide treatments except CGA 245704suppressed brown patch severity on 30 Jul (29 days after the last fungicide application).
(Table 1).
This publication from the Kansas State University Agricultural Experiment Station and Cooperative Extension Service has been archived. Current information is available from http://www.ksre.ksu.edu.

41
Table 1. Control of Rhizoctonia brown patch of tall fescue by preventive fungicide applications atWichita, KS in 1997.
Treatment and Rate/1000 sq ft % Plot Area Damaged1
31 Jul 16 Aug
Banner Maxx 1.2MC 2 fl oz 0.0 a 0.0 a
Heritage 50WP 0.4 oz 0.0 a 0.0 a
Prostar 50WP 2 oz 0.0 a 0.0 a
Prostar 50WP 3 oz plus Bayleton 25 DF .75 oz 1.3 a 0.0 a
Heritage 50WP 0.2 oz 1.7 a 0.0 a
Thalonil 90W 3.5 oz 1.7 a 0.0 a
Chipco 26019 2SC 4 fl oz 1.7 a 0.0 a
Bayleton 25DF 2 oz 1.7a 0.0a
Eagle 40 WP .6 oz plus Daconil Ultrex 82WG 3.8 3.3 a 0.0 a
Sentinel 40WG 0.25 oz 3.3a 0.0a
Aliette Signature 80 WG 4 oz plus Chipco 26019 3.3 a 0.0 a
Daconil Ultrex 82WG 3.8 oz 5.0a 0.0a
Thalonil 4L 6 fl oz 15.7 b 0.0 a
CGA 245704 50WG 0.05oz 23.3c 11.7 b
No fungicide 26.7c 18.3 b
Treatment means not followed by the same letter are significantly different (P= 0.05) by FLSD1
test.
This publication from the Kansas State University Agricultural Experiment Station and Cooperative Extension Service has been archived. Current information is available from http://www.ksre.ksu.edu.

42
TITLE: Preventive Fall Fungicide Applications for Control of Rhizoctonia
Large Patch Disease of Zoysiagrass.
OBJECTIVE : To evaluate the effectiveness of preventive fungicide applications for thecontrol of Rhizoctonia large patch of zoysiagrass.
PERSONNEL: Ned Tisserat
SPONSORS: Kansas Turfgrass Foundation, Heart of America Golf CourseSuperintendents Association, the Kansas Golf Course Superintendent’sAssociation, Novartis, Rhone Poulenc, AgrEvo, Bayer, Zeneca, and Rohm& Haas
MATERIALS AND METHODS:
Fungicide plots were established on Meyer zoysiagrass fairways at the Highlands andAlvamar Golf Courses in Hutchinson and Lawrence, KS respectively. Turfgrass was mowed at0.5 inches, irrigated as needed, and fertilized with approximately 1.5 lb N/1000 sq ft annually.Fourteen fungicide treatments were applied on 24 Sep in Lawrence and 4 Oct 1996 in Hutchinsonwith a CO backpack sprayer with 8003 TeeJet flat fan nozzles at 30 psi in water equivalent to2
2.2 gal (Lawrence) or 4.3 gal (Hutchinson) per 1000 sq ft. Treatment plots were 10 ft X 12 ftand replicated four (Lawrence) or three (Hutchinson) times in a randomized complete-blockdesign. Plots were not irrigated after fungicide applications. The percentage plot area diseasedwas recorded on 23 and 24 Apr 1997 in Lawrence and Hutchinson, respectively, after zoysiagrassresumed spring growth,
RESULTS:
The fall of 1996 was relatively dry, and large patch was not evident at either location beforethe zoysiagrass went dormant. The winter was also very dry. No evidence of active colonizationof the turfgrass by the fungus was observed at the time of the spring rating, suggesting that mostturf damage occurred between fall dormancy and resumption of growth in spring. All fungicidesreduced severity of large patch at Lawrence, but applications of Polyoxorim and Daconil Ultrexdid not significantly reduce disease compared to nontreated plots at Hutchinson. Plots treatedwith Sentinel at both sites appeared to be slower to break winter dormancy and were slightly off-color (lighter green). Results for the past several years indicate that a preventive fungicidetreatment in late September is effective in suppressing both fall and early spring symptoms ofRhizoctonia large patch.
This publication from the Kansas State University Agricultural Experiment Station and Cooperative Extension Service has been archived. Current information is available from http://www.ksre.ksu.edu.

43
Table 1. Control of Rhizoctonia large patch disease of zoysiagrass by preventive fungicideapplications in Kansas, 1997.
_________________________________________________________________
% Plot Area Damaged
Treatment and Rate 1000 sq ft Hutchinson Lawrence
__________________________________________________________________
Prostar 50WP 3 oz 0.0 a* 0.0 a
Banner Maxx 1.2 MC 4 fl oz + Medallion
75WG 0.5 oz 0.0 a 7.5 abc
Eagle 40WP 1.2 oz 0.0 a 1.3 ab
Bayleton 25DF 2 oz 1.0 ab 3.7 abc
Heritage 50WP 0.4 oz 1.0 ab 1.8 ab
Lynx 25DF 1 oz 2.0 abc 2.5 abc
Sentinel 40WG 0.25 oz 3.3 abc 1.3 ab
Banner 1.2MC 2 fl oz + Medallion
75WG 0.25 oz 7.7 bcd 9.8 bc
Banner 1.2MC 3 fl oz 8.3 cd 11.3 cd
Chipco 2601950DG 4 oz 9.3 cd 7.5 abc
Eagle 40W 0.6 oz + Fore 80WP 6 oz 11.7 d 13.0 cd
Penstar 75WP 8 oz 12.0 d 0.0 a
Polyoxorim 2.2 WP 4 oz 19.3 de 8.7 abc
Daconil Ultrex 82 WG 3.8 oz 19.3 de 18.7 d
No fungicide 28.3 e 31.2 e
____________________________________________________________________
*Means not followed by the same letter are significantly different (P = 0.05) by FLSD.
Percentage data were arcsine/square root transformed for analysis and then backtransformed topresentation.
This publication from the Kansas State University Agricultural Experiment Station and Cooperative Extension Service has been archived. Current information is available from http://www.ksre.ksu.edu.

44
TITLE: Variations in Summer Performance of Bentgrass Cultivars
OBJECTIVE: To investigate genetic variations in quality of creeping bentgrass turfduring summer.
PERSONNEL: Xiaozhong Liu and Bingru Huang
SPONSORS: Golf Course Superintendent’s Association of America, Kansas TurfgrassFoundation, Alfred Sloan Foundation
INTRODUCTION:
Creeping bentgrass is the most widely used cool-season turfgrass on golf greens. Turfquality in transitional and warm climate regions often declines during summer months, when golfgreens receive maximum use. Loss of bentgrass in midsummer is observed on many golf coursesand research sites every year. Evaluation of variation among bentgrass cultivars in tolerance tosummer stress might help superintendents to select high quality cultivars and prevent summerquality decline.
MATERIALS AND METHODS :
The experiment was conducted in a USGA green at the Rocky Ford Turfgrass ResearchCenter, Kansas State University, Manhattan, Kansas from June to October, 1997. The green wasmaintained following typical management practices used on Kansas golf courses with a 5/32 inch mowing height and irrigation on alternate days to replace 100% daily water loss. Bentgrassquality was evaluated as visually and estimated using a multispectral radiometer (MSR 16).
RESULTS:
Among the four cultivars, L-93 ranked the highest in visual quality rating from June toOctober, followed by Providence and Crenshaw. Penncross ranked the lowest in turf quality (Fig.1). The results from MSR measurements were consistent with visual quality ranking. Of the fourcultivars, L-93 had the highest leaf area index (Fig. 2) and green leaf biomass (Fig. 3). Penncrosshad the lowest green leaf biomass and leaf area index. Crenshaw and Providence rankedintermediate. The reflectance at 661 nm indicates greenness of turf. L-93 had a darker green colorthan Penncross (Fig. 4).
This publication from the Kansas State University Agricultural Experiment Station and Cooperative Extension Service has been archived. Current information is available from http://www.ksre.ksu.edu.

Figure 1. Bentgrass cultivar variations in turf quality.
Figure 2. Bentgrass cultivar variations in leaf area index.
4 5
This publication from the Kansas State University Agricultural Experiment Station and Cooperative Extension Service has been archived. Current information is available from http://www.ksre.ksu.edu.

Figure 3. Bentgrass cultivar variations in green leaf biomass.
Figure 4. Bentgrass cultivar variations in turf color (reflectance at 661 nm)
46
This publication from the Kansas State University Agricultural Experiment Station and Cooperative Extension Service has been archived. Current information is available from http://www.ksre.ksu.edu.

47
TITLE: Influence of Cultural Factors on Bentgrass Summer Performance
OBJECTIVE: To study the effect of cultural practices on bentgrass quality andphysiological factors that may control decline in turf quality duringsummer.
PERSONNEL: Xiaozhong Liu and Bingru Huang
SPONSORS: Golf Course Superintendent’s Association of America, Kansas TurfgrassFoundation, Alfred Sloan Foundation.
INTRODUCTION:
Many factors could be associated with summer decline of growth and quality in creepingbentgrass, including high temperature, humidity and soil moisture, poor soil aeration, restrictedair movement, localized dry spots, high soluble salts, and disease. Cultural practices includingirrigation and mowing height could modify micro-environmental conditions and affectphysiological processes and turf quality in bentgrass.
MATERIALS AND METHODS:
The experiment was conducted on a USGA green at the Rocky Ford Turfgrass ResearchCenter, Kansas State university, Manhattan, Kansas from June to October, 1997. Two bentgrasscultivars, Penncross and Crenshaw, were used in this study. Two irrigation and two mowingheight treatments were applied, beginning in mid-June. Mowing height treatments were 5/32 inchand 1/8 inch. Irrigation regimes included watering daily (to replace 100% daily ET) or everyother day (to replace 50% daily ET). Bentgrass quality was evaluated visually and estimatedusing a multispectral radiometer (MSR 16). Photosynthesis and respiration were measured usinga Li-Cor 6200 at various times. Chlorophyll fluorescence was measured using a plant efficiencyanalyzer (Hansatech).
RESULTS
Daily irrigation (100% ET) and alternate-day irrigation (50% ET) had no effects on turfquality and physiological factors for Penncross or Crenshaw (Figs. 1 to 5). However, mowingheight had significant effects on bentgrass quality, leaf area index, green leaf biomass,photosynthesis and respiration rates, and photosynthetic efficiency, particularly for Penncross.Both Penncross and Crenshaw had higher visual quality rating at a 5/32 inch mowing height thanat a 1/8 inch height (Fig. 1). Beginning in late September, bentgrass quality started to recover inthe low mowing treatment. Leaf area index (Fig. 2) and green leaf biomass (Fig. 3) also werehigher at a 5/32 inch mowing height than at a 1/8 inch height for both cultivars.
Photosynthesis rates decreased in both Penncross and Crenshaw when mowing heightdecreased from 5/32 inch to 1/8 inch. However, respiration rate increased at the 1/8 inchmowing height (Fig. 4). Photosynthetic efficiency, expressed as chlorophyll fluorescence, washigher at the 5/32 inch mowing height than at 1/8 inch for both cultivars (Fig. 5).
This publication from the Kansas State University Agricultural Experiment Station and Cooperative Extension Service has been archived. Current information is available from http://www.ksre.ksu.edu.

Figure 1. Effects of mowing height and irrigation on bentgrass turf quality.
Figure 2. Effects of mowing height and irrigation on leaf area index of bentgrass.
48
This publication from the Kansas State University Agricultural Experiment Station and Cooperative Extension Service has been archived. Current information is available from http://www.ksre.ksu.edu.

Figure 3. Effects of mowing height and irrigation on green leaf biomass of bentgrass.
49
This publication from the Kansas State University Agricultural Experiment Station and Cooperative Extension Service has been archived. Current information is available from http://www.ksre.ksu.edu.

DateFigure 4. Effects of mowing height and irrigation on photosynthesis and respiration rate ofbentgrass.
50
This publication from the Kansas State University Agricultural Experiment Station and Cooperative Extension Service has been archived. Current information is available from http://www.ksre.ksu.edu.

Figure 5. Effects of mowing height and irrigation on chlorophyll fluorescence of bentgrass.
51
This publication from the Kansas State University Agricultural Experiment Station and Cooperative Extension Service has been archived. Current information is available from http://www.ksre.ksu.edu.

52
TITLE: Responses of Buffalograss and Zoysiagrass to Surface Soil Drying
OBJECTIVE: To determine the responses of root growth, viability, and distribution toupper soil drying in relation to water uptake and drought resistance inbuffalograss and zoysiagrass
PERSONNEL: Bingru Huang
SPONSORS: Kansas Turfgrass Foundation, Kansas Agricultural Experiment Station
INTRODUCTION:
Drought is one of the major stress factors limiting turfgrass growth in Kansas. The surfacesoil layer often becomes very dry, while soil moisture is available in deeper soil in the field in manyareas. Drought-sensitive species may suffer severe damage even with only localized soil droughtstress. Root growth, viability, and water and nutrient uptake capacities may have significantimpacts on turfgrass tolerance to surface soil drying.
MATERIALS AND METHODS :
The study was conducted in a greenhouse from June to August in 1997. Sod pieces (30 x25 cm) of Prairie buffalograss and Meyer zoysiagrass were collected from field plots at the RockyFord Turfgrass Research Center, Kansas State University and planted in 30 x 25 x 80 cm woodboxes filled with a mixture (2:1 v/v) of coarse river sand and top soil. The boxes consisted of threewood sides and a slanted plexiglass front. The front face was tilted about 35 to allow monitoringo
of root elongation and proliferation.
The soil column in the boxes was partitioned into three sections which were separated fromone another with coated waxed paper. Drip irrigation tubes were positioned about 2 cm beneath thesoil surface in each layer to irrigate individual layers separately.
The experiment consisted of three soil moisture treatments: a) well-watered control -waterwas added daily to each soil layer to maintain the entire soil profile well-watered; b) drying ofupper soil - the upper two soil layers (0-40 cm) were allowed to dry down by withholdingirrigation, while the lower 40-cm segment was watered daily; c) drying of whole soil profile - soilwas watered initially and then watering was withhold to allow the entire soil profile to dry down.
RESULTS:
Leaf water potential (R ), a sensitive indicator of water deficit, declined 7 d after drying ofleaf
the upper soil layers for Meyer zoysiagrass but declined only when the entire soil profile was driedfor Prairie buffalogrfass (Table 1). The variations between Prairie buffalograss and Meyerzoysiagrass in responses of R to soil drying were associated with the differences in rootleaf
elongation rate, distribution pattern, and the capacity of water uptake.
Under drying conditions, Prairie buffalograss roots elongated faster than Meyer zoysigrass
This publication from the Kansas State University Agricultural Experiment Station and Cooperative Extension Service has been archived. Current information is available from http://www.ksre.ksu.edu.

53
roots (Fig. 1). Prairie buffalograss had a larger proportion of roots in the lower 40 cm of soil than
Meyer zoysigrass (Fig. 2). The water depletion rate of Prairie buffalograss was also higher thanthat of Meyer zoysiagrass in the deeper layer. However, Meyer zoysiagrass had a higher waterdepletion rate than Prairie buffalograss in the upper 20 cm soil (Fig. 3). Soil water content in theupper drying soil increased at night for both grasses but to a larger extent for Prairie buffalograss(Fig. 4), indicating a flux of water into the upper layer, which could have been due to water effluxfrom roots that penetrated into the deeper soil layers where water was available. Higher N uptake15
in the upper drying soil layer also was demonstrated clearly when Prairie buffalograss was partiallydried than when it was fully dried (Fig. 5). The results imply that the deep, extensive growth ofroots in Prairie buffalograss not only facilitates water utilization in the deeper soil but also mayimprove surface soil water status, thereby maintaining viable roots in surface drying soil andenhancing turfgrass tolerance to localized soil drought stress.
Table 1. Leaf water potential as affected by soil moisture.
Grass Leaf Water Potential (MPa)
species Treatment 7 d 17 d 28 d
Buffalo Well-watered -1.31 b -1.09 b -1.05 b
Partially dried -1.45 baA -1.26 bB -1.39 bB
Fully dried -1.70 aA -2.45 aB -3.78 aB
Zoysia Well watered -1.18 b -1.28 b -1.21 c
Partially dried -1.53 baA -1.65 bA -2.01 bA
Fully dried -1.81 aA -2.88 aA -4.12 aA
Means followed by the same letters within a column are not significantly different based on an LSDtest (p = 0.05). The lowercase letters indicate comparisons between treatments within a grassspecies. The uppercase letters indicate comparisons between grass species within a treatment.
This publication from the Kansas State University Agricultural Experiment Station and Cooperative Extension Service has been archived. Current information is available from http://www.ksre.ksu.edu.

Days after treatmentFigure 1. Root elongation rates of buffalograss and zoysiagrass under well-watered (WW) andfully dried (FD) conditions.
Root dry weight (g)
Figure 2. Root distribution patterns of buffalograss and zoysiagrass as affected by soil drying.Values in parentheses are proportions of roots in each layer.
54
This publication from the Kansas State University Agricultural Experiment Station and Cooperative Extension Service has been archived. Current information is available from http://www.ksre.ksu.edu.

Days after treatmentFigure 3. Water depletion by buffalograss and zoysiagrass in three soil depths when irrigation waswithheld in the entire soil profile.
Time of day (h)
Figure 4. Diurnal changes in soil water content with buffalograss and zoysiagrass in 0-20 and 20-40 cm soil layers over a 4-d period when the upper 40-cm soil was dried and lower 40-cm soil waswatered.
55
This publication from the Kansas State University Agricultural Experiment Station and Cooperative Extension Service has been archived. Current information is available from http://www.ksre.ksu.edu.

Treatment
N-15 uptake of roots of buffalograss and zoysiagrass in the upper 20-cm as affected bysoil drying. Columns marked with the same letters are not significantly different based on an LSDtest (p = 0.05). The lowercase letters are for comparisons between treatments within a species, andthe uppercase letters for comparisons between species within a treatment.
56
This publication from the Kansas State University Agricultural Experiment Station and Cooperative Extension Service has been archived. Current information is available from http://www.ksre.ksu.edu.
57
TITLE: Identifying a Characteristic Dimension in Four Turfgrass Species
OBJECTIVE : To identify an objective way to distinguish turfgrasses.
PERSONNEL: Steven Wiest
SPONSOR: Kansas Turfgrass Foundation
INTRODUCTION:
The analysis of turfgrass plots typically has been done by a subjective rating system. Results varied from observer to observer as well as from experimental location to location. Tomitigate this problem, this project deals with quantifying turf plots in an objective manner. We areconcentrating on the analysis of digitized photographic images of turf plots. This paper reports oneway to distinguish coarse- vs. fine-textured turfgrasses.
MATERIALS AND METHODS:
Black and white photographs of plots were taken with a wide-angle lens (28 mm) at aheight of 65 inches from the turf surface on 8 September 1998. Species examined were:zoysiagrass, buffalograss, bermudagrass and tall fescue, with three replications. The images weredigitized from negatives with an Olympus ES-10 scanner (Olympus America, Inc., Melville, NY). Fourier transforms were performed on the digitized images, and a radial plot of the power spectrumwas obtained from each image using NIH-Image v. 1.61 (National Institutes of Health, WashingtonDC). Hurst plots (log frequency vs. log intensity) were used to subtract “background” from thepower spectra, so peaks would be more evident.
RESULTS:
The power spectra of each species were averaged, and the averages are presented alongwith vertical standard error bars in Figure 1. The peak of the power spectrum occurs at theaverage spacing between leaves (more precisely, between areas of the canopy that reflect significantamounts of light). Zoysiagrass had the lowest characteristic dimension, tall fescue had the highest,and buffalograss and bermudagrass had intermediate characteristic dimensions (Figure 2).
The width of the power spectrum peak (Figure 1) indicates the variability in thecharacteristic dimension within the canopy. Zero intensity was used as the cutoff for measuringpeak width. The minimum characteristic dimension (occurring at the high frequency) was <0.66inches for zoysiagrass whereas all the other species had about the same minimum characteristicdimension (ca. 0.75 inches). The maximum characteristic dimension was largest for fescue (2.7inches), followed by buffalograss (1.5 inches), bermudagrass (1.3 inches), and zoysiagrass (1.1inches).
These results demonstrate that this technique, using digitized photos as part of a ratingsystem, can distinguish species on the basis of their power spectrum characteristics.
This publication from the Kansas State University Agricultural Experiment Station and Cooperative Extension Service has been archived. Current information is available from http://www.ksre.ksu.edu.

-0.04
-0.02
0.00
0.02
0.04
-0.04
-0.02
0.00
0.02
0.04
Zoysiagrass
Buffalograss
-0.04
-0.02
0.00
0.02
0.04
Bermudagrass
Frequency (inches-1)
0.6 0.8 1.0 1.2 1.4 1.6-0.04
-0.02
0.00
0.02
0.04
Fescue
Rel
ativ
e in
tens
ity
A
B
D
C
Zoy
siag
rass
Buf
falo
gras
s
Ber
mud
agra
ss
Fes
cue
Cha
ract
eris
tic d
imen
sion
(in
ches
)
0.2
0.4
0.6
0.8
58
Figure 1. Portions of power spectra of
digitized photographs of turfgrass canopies.
Figure 2. Average characteristic dimension ofthe four tested species.
This publication from the Kansas State University Agricultural Experiment Station and Cooperative Extension Service has been archived. Current information is available from http://www.ksre.ksu.edu.

59
Work in Progress
TITLE : How Urbanization Impacts Water Resources
OBJECTIVE : To determine changes in water quality when a golf course is developed
on native prairie.
PERSONNEL: Steve Starrett
The building of Colbert Hills Golf Course in Manhattan, KS provides many excellent andunique research opportunities related to water resources. We have been collecting surface watersamples for about 1.5 years from the site to determine background water quality. We plan toinvestigate how water quality changes when the land use changes from a native prairie condition toa golf course. The investigation and development of Best Management Practices is also planned. The United States Golf Association is providing funding for 5 years to investigate nutrient runofffrom portions of Colbert Hills Golf Course. Researchers from many different departments atKansas State University are actively pursuing funding to study the changes in the entire ecosystem(water, soil, flora, fauna).
This publication from the Kansas State University Agricultural Experiment Station and Cooperative Extension Service has been archived. Current information is available from http://www.ksre.ksu.edu.

60
THANKS!!
Many organizations and corporations provided a significant level of support to the KSU turfgrassresearch program in 1997. Aid was in the form of grants-in-aid, equipment, contributions, orresearch cooperation.
AgrEvo Manhattan Country Club
Alfred Sloan Foundation Modern Distributing (Toro)
Alvamar Country Club Monsanto
Bayer National Turfgrass Evaluation Program
Daru Novartis
Dow Elanco O.M. Scott & Sons, Inc.
Excel Corporation Outdoor Equipment (Cushman Mfg.)
Gard’N Wise PBI Gordon
Golf Course Supt. Assoc. of America Prairie Dunes Country Club
Grass Pad Professional Lawn Care Assn. of
Great American Turf (John Deere) Mid-America
Great Plains Industries Rhom & Haas
Heart of America GC Supt. Assn. Rhone-Poulenc
Highlands Country Club Royal Seeds
IMC Fertilizer, Inc. Ryan Lawn & Tree
Industrial Sales United States Golf Association
Kansas Agricultural Experiment Stn. Valley Feed & Seed
Kansas Golf Course Supt. Assn. Williams Lawn Seed
Kansas Golf Association Zeneca
Kansas Turfgrass Foundation
Numerous other companies provided grants for pesticide evaluation or donated seed, fertilizer, orchemicals. Several golf course superintendents in state were gracious enough to allow research tobe done on their sites. Without the support of each of these individuals and organizations, turfresearch at KSU would be severely inhibited. Please forgive us if we have overlooked yourcontribution. Thanks to all for your support!
Note: Trade names are used to identify products. No endorsement is intended, nor is any
criticism implied of similar products not mentioned.
Contribution No. 98-439-S from the Kansas Agricultural Experiment Station.
This publication from the Kansas State University Agricultural Experiment Station and Cooperative Extension Service has been archived. Current information is available from http://www.ksre.ksu.edu.

Kansas State University Agricultural Experiment Station and Cooperative Extension Service, Manhattan 66506SRP 812 May 1998It is the policy of Kansas Slate University Agricultural Experiment Station and Cooperative Extension Service that all persons shall have equal opportunity andaccess to its educational programs, services, activities. and materials without regard to race, color, religion, national origin, sex, age, or disability. Kansas StateUniversity is an equal opportunity organization. These materials may be available in alternative formats. 1M
This publication from the Kansas State University Agricultural Experiment Station and Cooperative Extension Service has been archived. Current information is available from http://www.ksre.ksu.edu.