turfgrass and environmental research onlineusgatero.msu.edu/v05/n17.pdf · using science to benefit...
TRANSCRIPT
...Using Science to Benefit Golf
Turfgrass and EnvironmentalResearch Online
Volume 5, Number 17September 1, 2006
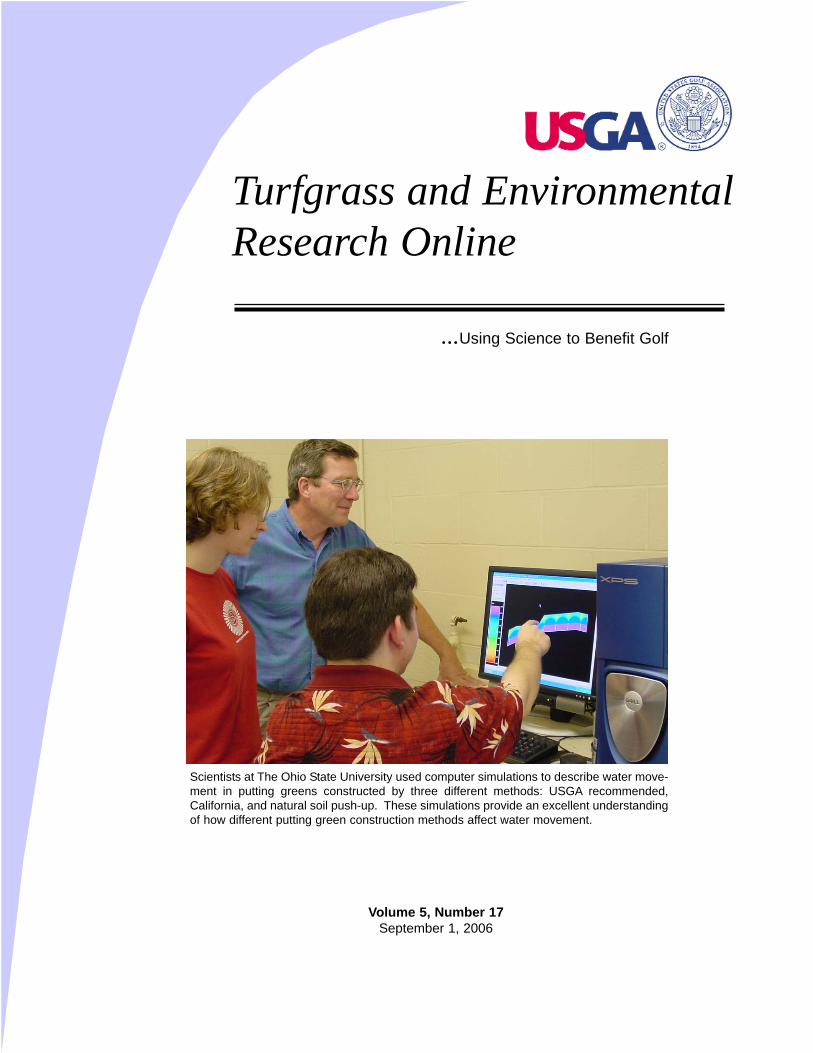
Scientists at The Ohio State University used computer simulations to describe water move-ment in putting greens constructed by three different methods: USGA recommended,California, and natural soil push-up. These simulations provide an excellent understandingof how different putting green construction methods affect water movement.
PURPOSE
The purpose of USGA Turfgrass and Environmental Research Online is to effectively communicate the results ofresearch projects funded under USGA’s Turfgrass and Environmental Research Program to all who can benefitfrom such knowledge. Since 1983, the USGA has funded more than 290 projects at a cost of $25 million. The pri-vate, non-profit research program provides funding opportunities to university faculty interested in working on envi-ronmental and turf management problems affecting golf courses. The outstanding playing conditions of today’sgolf courses are a direct result of using science to benefit golf.
Editor
Jeff Nus, Ph.D.1032 Rogers PlaceLawrence, KS [email protected](785) 832-2300(785) 832-9265 (fax)
Research Director
Michael P. Kenna, Ph.D.P.O. Box 2227Stillwater, OK [email protected](405) 743-3900(405) 743-3910 (fax)
Permission to reproduce articles or material in the USGA Turfgrass and Environmental Research Online (ISSN 1541-0277) isgranted to newspapers, periodicals, and educational institutions (unless specifically noted otherwise). Credit must be given tothe author(s), the article title, and USGA Turfgrass and Environmental Research Online including issue and number. Copyrightprotection must be afforded. To reprint material in other media, written permission must be obtained fom the USGA. In anycase, neither articles nor other material may be copied or used for any advertising, promotion, or commercial purposes.
USGA Turfgrass and Environmental Research Committee
Steve Smyers, ChairmanJulie Dionne, Ph.D.
Ron DodsonKimberly Erusha, Ph.D.
Ali Harivandi, Ph.D.Michael P. Kenna, Ph.D.
Jeff Krans, Ph.D.Pete Landschoot, Ph.D.
James MooreJeff Nus, Ph.D.
Paul Rieke, Ph.D.James T. Snow
Clark Throssell, Ph.D.Pat Vittum, Ph.D.
Scott Warnke, Ph.D.James Watson, Ph.D.Craig Weyandt, CGCS
Putting green soil profiles are frequently clas-sified into three general categories: USGA,California, and push-up style greens. The USGAand California profiles are purposely constructed
with each documented by written guidelines (2,10). On the other hand, push-up green soil pro-files have evolved from decades of sand topdress-ing applied to native soil. Whereas each has asandy surface layer, or rootzone, the thickness ofthis layer and the type of material underlying thesandy rootzone varies for each particular construction method.
There has long been an interest in howrootzone properties and soil material layeringinfluence water flow within contoured puttinggreens. Measurement of this water flow is oftenaccomplished by frequent monitoring soil watercontent using probes that are placed in the soilprofile (4, 7, 8). By examining the time sequenceof water contents following rainfall, irrigation, orturf water uptake, the rate and direction of waterflow can be inferred from water content changes.These studies have directly documented how lay-ered soils increase water retention within a sandyrootzone by the formation of perched water, the
Dynamics of Water Flow in PuttingGreens via Computer Simulation
Ed McCoy and Kevin McCoy
SUMMARY
Computer simulations of soil water flow were con-structed for a USGA, California, and push-up putting greenusing HYDRUS-2D. The simulations generated animationsof soil water content over a seven-day period for full-sizegreens having natural surface contours and supporting aclosely mown turfgrass stand. Also generated was drainagerate and actual turfgrass evapotranspiration (ETa). Rainfalland evapotranspiration scenarios were selected to challengethehydrologic response of these three putting greens and aturfgrass response protocol allowed the appraisal of waterrelated turfgrass stress.
The simulations demonstrate the utility of deeper root-zone, as seen in the USGA and California greens, in pro-viding a direct connection with subsurface drainage ele-ments and displacing perched water below turfgrass rooting.
Alternatively, the shallow rootzone of the push-up greenquickly became saturated during rain and remained nearlyso for 42 hours, leading to aeration stress of the turf.
During rain, the thickness of water perching was self-limited in the USGA green but continued to expand, form-ing a pattern relative to drainage spacing, in the Californiagreen.
The simulations show that perched water can form inboth USGA and California greens and, in both greens, mayserve as a reservoir for subsequent water uptake by the turf.This perched water was, however, locally short-lived inboth greens as down slope lateral flow removed it from thecrest of steeper slopes within each green.
The first appearance of drought stress was associatedwith the local absence of water perching in both the USGAand California greens, and appeared earlier in the Californiagreen due to the lesser water holding capacity of the root-zone.
ED MCCOY, Ph.D., Associate Professor; and KEVIN MCCOY,Software Technician; School of Natural Resources, The Ohio StateUniversity, Wooster, OH.
1
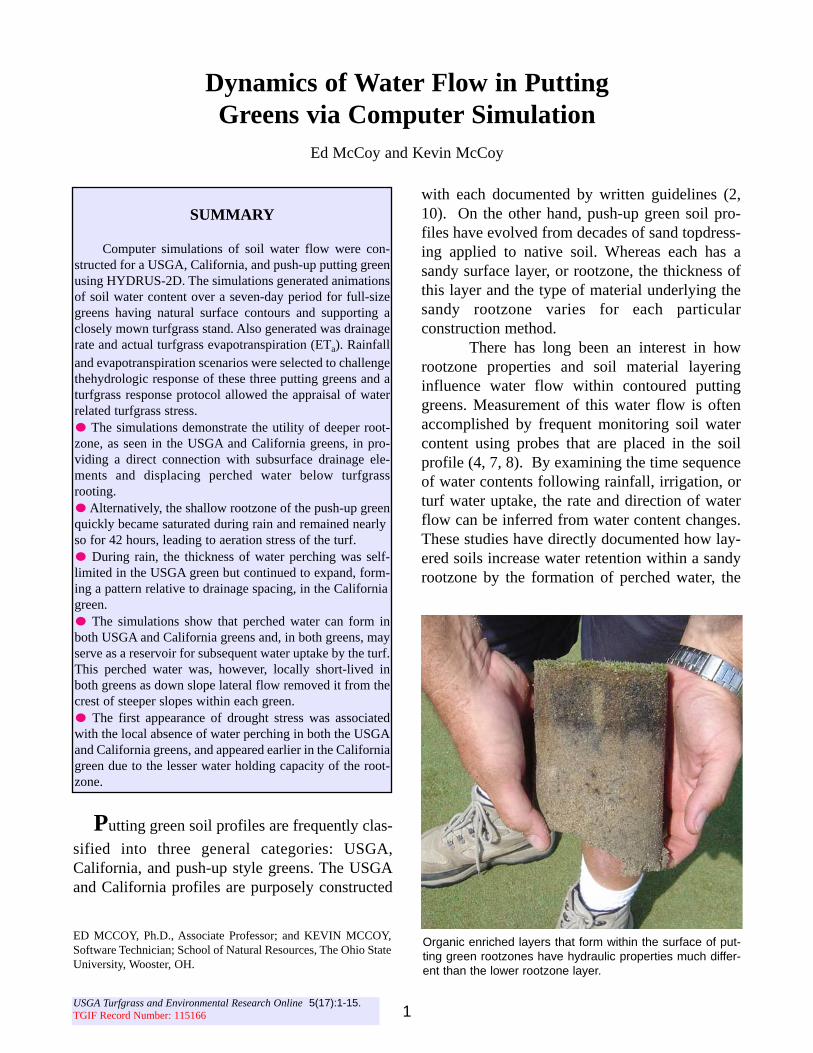
Organic enriched layers that form within the surface of put-ting green rootzones have hydraulic properties much differ-ent than the lower rootzone layer.
USGA Turfgrass and Environmental Research Online 5(17):1-15.TGIF Record Number: 115166
propensity of this water to migrate down slopecreating lateral non-uniform water contents, andhow organic and soil amendments in the rootzoneappear to modulate this response.
Experimental studies of water flow ingreens, however, have limitations due to the highcost of construction, maintenance, instrumenta-tion, and monitoring. Consequently, these studieshave employed less than full-size greens with rel-atively few sensors that capture data over widelyspaced time intervals and/or for a limited duration.The result is a somewhat incomplete picture thatcan miss a specific water flow process and/or gen-erate findings that only relate to the climate at thestudy location. Also, experimental studiesinevitably contain errors and require statisticalanlysis for proper interpertation of the results. Use
of statistical techniques substantially adds toexperimental costs due to the need for replicationand the possible inculsion of nonsensical treat-ments in order to isolate specific factors
Computer simulation of water flow in soilscan remove many of these experimental limita-tions. A simulation can be built to represent a full-size putting green and capture flow eventsthroughout the soil profile. Also, a simulationallows us to challenge the system under climaticscenarios that rarely occur at a specific location.And because simulations do not generate randomerrors, they need not be replicated. Yet the qualityof a simulation output is solely reliant on the qual-ity of the parameters used to describe the system.Much care must be taken in specifying the valuesfor these parameters.
2
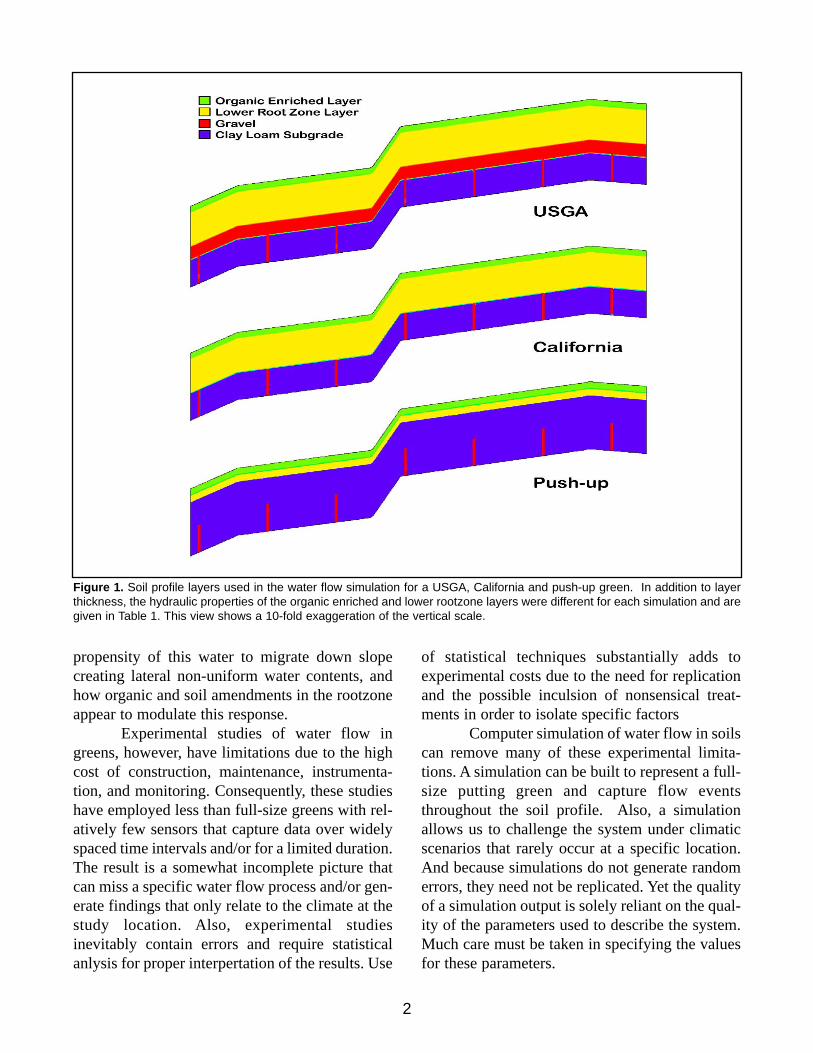
Figure 1. Soil profile layers used in the water flow simulation for a USGA, California and push-up green. In addition to layerthickness, the hydraulic properties of the organic enriched and lower rootzone layers were different for each simulation and aregiven in Table 1. This view shows a 10-fold exaggeration of the vertical scale.
The objective of this study was to generaterealistic simulations of water flow in USGA,California, and push-up style putting greens. Forthis we chose the software package HYDRUS-2D(9), which has been employed for a variety ofapplications including irrigation and drainagedesign, study of irrigated land salinization, trans-port of pesticides and toxic trace elements, andanalyses of riparian systems (11). We sought toconstruct simulations for mature, full-size greenshaving natural surface contours, built according topublished guidelines, and supporting a closelymown turfgrass stand. Rainfall and evapotranspi-ration scenarios were selected to challenge thehydrologic response of these three putting greens.
The Putting Green Soil Profiles
The simulations were designed to describewater flow through a two-dimensional slicethrough the center of a typical putting green. Toaccomplish this, we enlisted to help of Mr. JasonStraka, ASGCA, Senior Design Associate withHurdzan/Fry Design, Inc., who provided puttinggreen surface elevation data along a 100-ft tran-sect. The respective soil profiles corresponding toa USGA green, a California green, and a push-up
green were subsequently created below this sur-face. In each case, the putting surface consists ofa 10-ft false front at 5% slope, a 30-ft lower land-ing area at 1.5% slope, a 6-ft terrace face at 15%slope, a 41-ft upper landing area at 1.5% slope,and a 13-ft section falling away off the back of thegreen at 1% slope. Smooth curve transitions alsooccurred between each of these surfaces and thetotal elevation change across the green was 2.5 ft.
The USGA green soil profile (Figure 1)consisted of a 12-inch thick rootzone overlying a4-inch thick gravel layer placed upon an 8-inchthick clay loam subgrade soil. Gravel-filleddrainage trenches (6-inches wide by 8-inchesdeep) were placed in the subgrade and spaced 15feet apart. To represent the influence of turf root-ing and organic matter accumulation within thesurface layer of the rootzone (1), this 12-inchlayer was further subdivided into to a surface, a 2-inch thick organic enriched layer, and a 10-inchthick lower rootzone layer.
The California green soil profile (Figure1) consisted of a 12-inch thick rootzone overlyingan 8-inch thick clay loam subgrade soil. Gravel-filled drainage trenches (6-inches wide by 8-inch-es deep) were placed in the subgrade and spaced15 feet apart. Although maximum drain spacing is
3
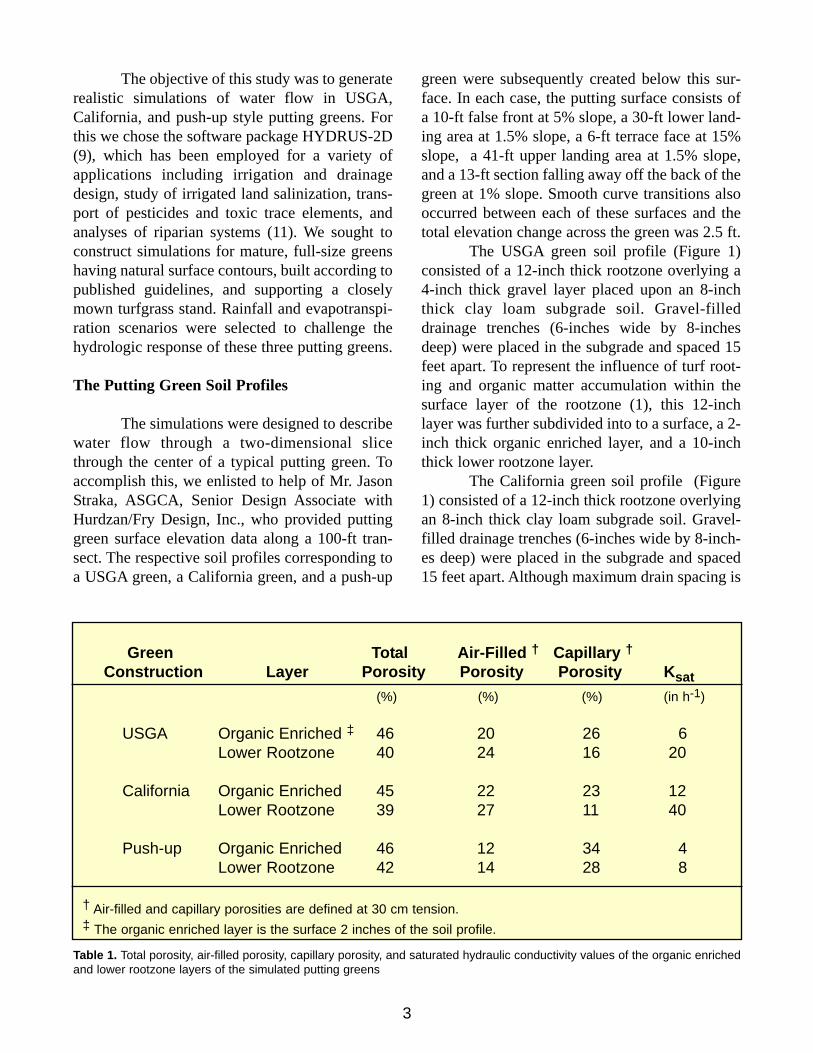
Table 1. Total porosity, air-filled porosity, capillary porosity, and saturated hydraulic conductivity values of the organic enrichedand lower rootzone layers of the simulated putting greens
Green Total Air-Filled † Capillary †Construction Layer Porosity Porosity Porosity Ksat
(%) (%) (%) (in h-1)
USGA Organic Enriched ‡ 46 20 26 6Lower Rootzone 40 24 16 20
California Organic Enriched 45 22 23 12Lower Rootzone 39 27 11 40
Push-up Organic Enriched 46 12 34 4Lower Rootzone 42 14 28 8
† Air-filled and capillary porosities are defined at 30 cm tension. ‡ The organic enriched layer is the surface 2 inches of the soil profile.
not specified for a California green, we chose thisdrainage system configuration to be consistentwith the USGA green scenario. Also, consistentwith the USGA green, the 12-inch rootzone wassubdivided into to a surface, a 2-inch thick organ-ic enriched layer, and a 10-inch thick lower root-zone layer.
The push-up green soil profile (Figure 1)consisted of a 4-inch thick rootzone overlying a16-inch thick clay loam soil. For consistency withthe other green designs, 6-inch wide by 8-inchdeep gravel-filled drainage trenches were spaced15 feet apart across the green with the upper sur-face of the drainage trench placed 10 inches belowthe surface of the green. As with the other scenar-ios, the 4-inch rootzone was subdivided into to a
surface, a 2-inch thick organic enriched layer, anda 2-inch thick lower rootzone layer.
Rootzone Properties
In addition to soil layer thickness and ori-entation, the water flow simulation requires infor-mation on the hydraulic properties of each layer.Specifically, this information consists of parame-ters of the water retention curve and the saturatedhydraulic conductivity. Our intention in this workwas to simulate water flow within greens thatadhered to the respective guidelines (when avail-able) but also placed more emphasis on watertransmission than on water retention. In otherwords, our aim was to generate hydraulic proper-
4
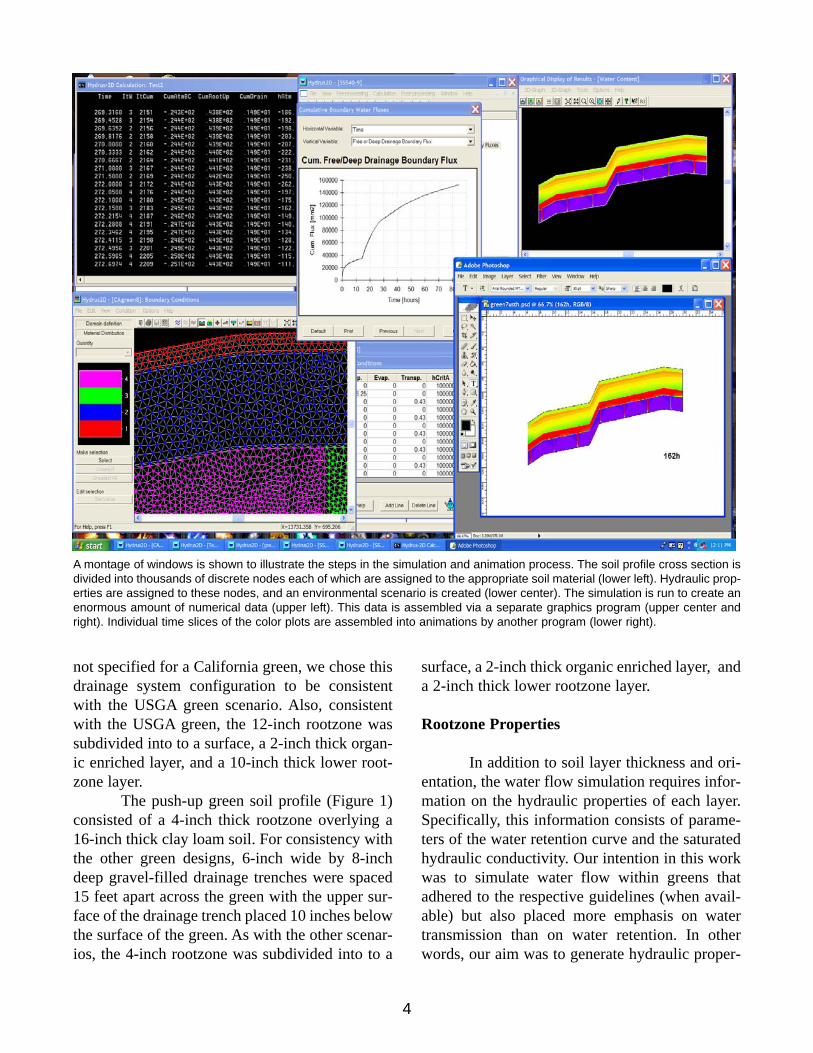
A montage of windows is shown to illustrate the steps in the simulation and animation process. The soil profile cross section isdivided into thousands of discrete nodes each of which are assigned to the appropriate soil material (lower left). Hydraulic prop-erties are assigned to these nodes, and an environmental scenario is created (lower center). The simulation is run to create anenormous amount of numerical data (upper left). This data is assembled via a separate graphics program (upper center andright). Individual time slices of the color plots are assembled into animations by another program (lower right).
ties that corresponded to a rootzone having sandparticle sizes on the coarse side of the acceptablerange. We did this for the lower rootzone layer ofthe USGA and California greens by generatinghydraulic properties of a construction rootzonemix since the lower rootzone layer of a maturegreen is expected to have hydraulic propertiessimilar to the rootzone mix of a newly built green(Dr. Norm Hummel and Mr. James Thomas, per-sonal communication). The organic enriched layerfor each green was intended to contain about 6%organic matter (by weight). Thus, the construc-tion rootzone mix properties for each green wereadjusted as to appropriately reflect this organicenrichment.
Finally, in order to supply the most realis-tic information to the simulation, we generatedcandidate hydraulic properties from in-house dataand then provided this information to Dr. NormHummel (Hummel & Co. Inc.) and Mr. JamesThomas (Thomas Turf Services, Inc.) for a criticalreview. Following their review, we adjusted the
hydraulic properties of both the organic enrichedand lower rootzone layers as appropriate. Ourapproach to generating hydraulic properties of thepush-up green rootzone was similar to that for theUSGA and California greens but was more sub-jective because there are no published descrip-tions of the most prevalent rootzone characteristics.
The hydraulic properties of the rootzonelayers for the USGA, California, and push-upgreens are given in Table 1. The USGA greenrootzone had hydraulic properties characteristic ofminimally amended and fairly uniform medium-coarse sand. This is indicated by small total andcapillary porosity values and large Ksat and air-filled porosity values, when compared to recom-mended UGSA guidelines. The California greenrootzone had hydraulic properties characteristic ofunamended and uniform medium sand withgreater Ksat and air-filled porosity values andsmaller total and capillary porosity values than theUSGA rootzone. The push-up green rootzone had
5
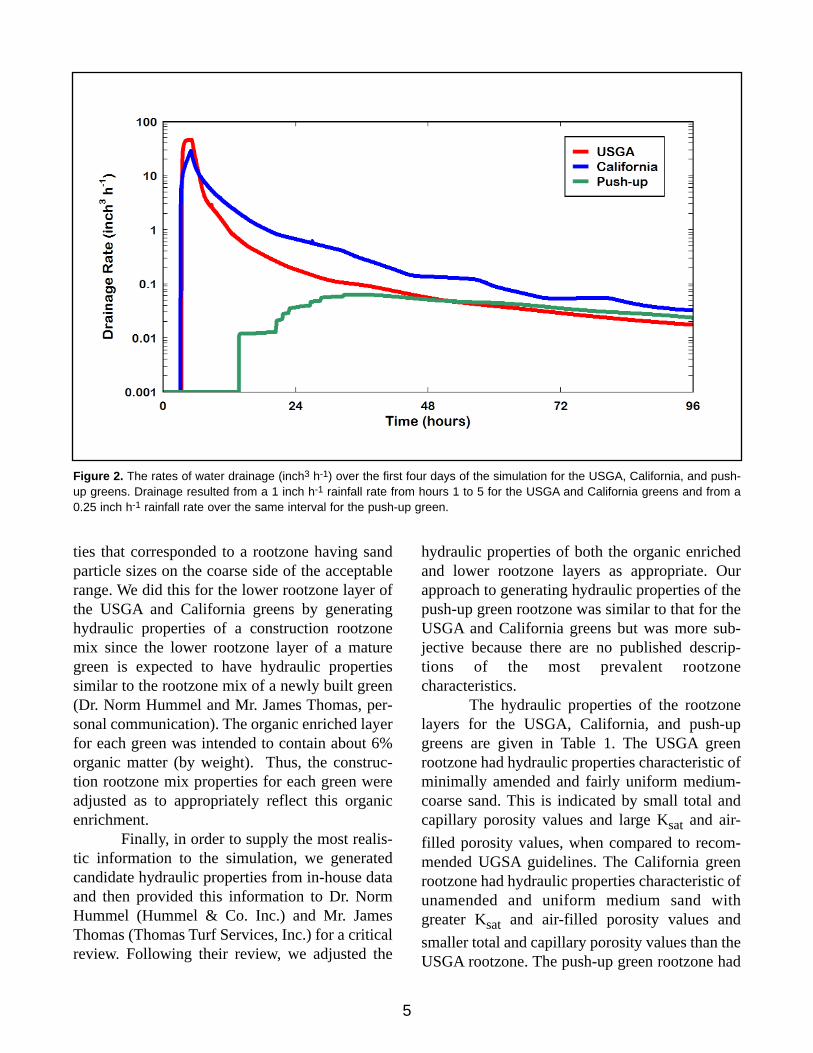
Figure 2. The rates of water drainage (inch3 h-1) over the first four days of the simulation for the USGA, California, and push-up greens. Drainage resulted from a 1 inch h-1 rainfall rate from hours 1 to 5 for the USGA and California greens and from a0.25 inch h-1 rainfall rate over the same interval for the push-up green.

hydraulic properties as would be expected fromyears of consistent and frequent topdressing usingquality topdressing sand.
In all cases, organic enrichment resulted inan increase in total and capillary porosity valuesand a reduction in air-filled porosity and Ksat val-ues. Finally, the clay loam subgrade had a Ksatvalue of 0.02 in h-1 and the gravel had a Ksat valueof 4700 in h-1 characteristic of these respectivematerials.
Turfgrass Rooting and Response Protocols
A powerful feature of HYDRUS 2D is theability to include in the simulation a plant that iscapable of responding to the soil water status. Inthis particular case study we included the bestavailable information corresponding to a closelymown turfgrass species. This included specifyingthe distribution of turfgrass rooting and indicatingat what soil water status the turf would sufferwater-related stress.
The turfgrass rooting information consist-ed of specifying the proportion of the total rootsystem that occurs within selected depth incre-ments. To isolate soil profile and rootzone proper-ty responses in this work, we chose to employ anidentical rooting pattern for each of the three
greens. In each case, 50% of the roots were pres-ent in the 0- to 1-inch increment, 32.5% in the 1-to 2-inch increment, 10% in the 2- to 4-inch incre-ment, 5% in the 4- to 5-inch increment, and 2.5%in the 5- to 6-inch increment. No roots were pres-ent below 6 inches depth and this same patternwas employed across the entire green surface.
In HYDRUS, drought stress is simulatedby the inability of turf roots to take up soil waterwhen the water content surrounding the root isless than some specified value. In this work, wechose a water content of 10% (by volume) asindicating the onset of reduced root water uptake.This is consistent with our field studies (5) where-in "footprinting" on experimental greens wasobserved to occur at this level of soil water con-tent. Further, as the local water content falls below10% (by volume), root water uptake is progres-sively reduced.
HYDRUS is also capable of simulatingsoil aeration stress on the root wherein wateruptake is limited via inadequate local air-filledporosity (defined as total porosity minus the localwater content). Another term for aeration stress is"wet wilt" as defined by Dernoeden (3). In thisstudy, wet wilt occurred when the local air-filledporosity was 10% (by volume) and water uptakewas progressively reduced as air-filled porositydeclined below this value.
6
Contoured surfaces found on most putting greens are an important feature that was considered in this analysis.
The Simulation Scenario
The simulation runs for 168 hours, begin-ning at 12:00 am and continuing for seven days.Initially (at hour 0), the soil profile is moist withequilibrium water contents corresponding to thepresence of a water table 0.5 inches below thedrainage trenches. At hour 1 rainfall occurs acrossthe USGA and California greens at a precipitationrate of 1.0 inch h-1 and continuing for four hours.This high intensity rainfall delivering four inchesof rain was selected to challenge the infiltrationand drainage capabilities of each green. Becausethe push-up green was incapable of infiltratingfour inches of rain, the precipitation rate for thisscenario was adjusted down to 0.25 inch h-1 yield-ing one inch of total rainfall. No additional pre-cipitation or irrigation occurred on any of thegreens after this initial event.
Subsequently, a diurnal evapotranspirationcycle was imposed on these greens and consistedof an atmospheric demand of 0.014 inch h-1
between the hours of 8:00 am and 8:00 pm with nowater uptake during the intervening hours. Thishourly ET rate over a 12-hour daylight periodyielded a daily atmospheric demand (referred toas ETcrop) of 0.17 inches of water.
Our choice of this value was based on thework of McCoy and McCoy (5) wherein dailyETcrop values corresponding to putting green turfwere generated for a 20-year period at each of sixlocations throughout the US. Examining the dis-tribution of the April-September daily ETcrop val-ues from this previous study indicated that ourselected rate of 0.17 inch day-1 was about onestandard deviation greater than the mean forPhoenix, AZ, two standard deviations greater thanthe mean for Boulder, CO,and three standard devi-ations greater than the mean for Columbus, OH.So our selected ETcrop value represents a moder-ately above-average drying event for Phoenix, andsomewhat extreme drying event for Boulder, anda severely extreme drying event for Columbus.
7
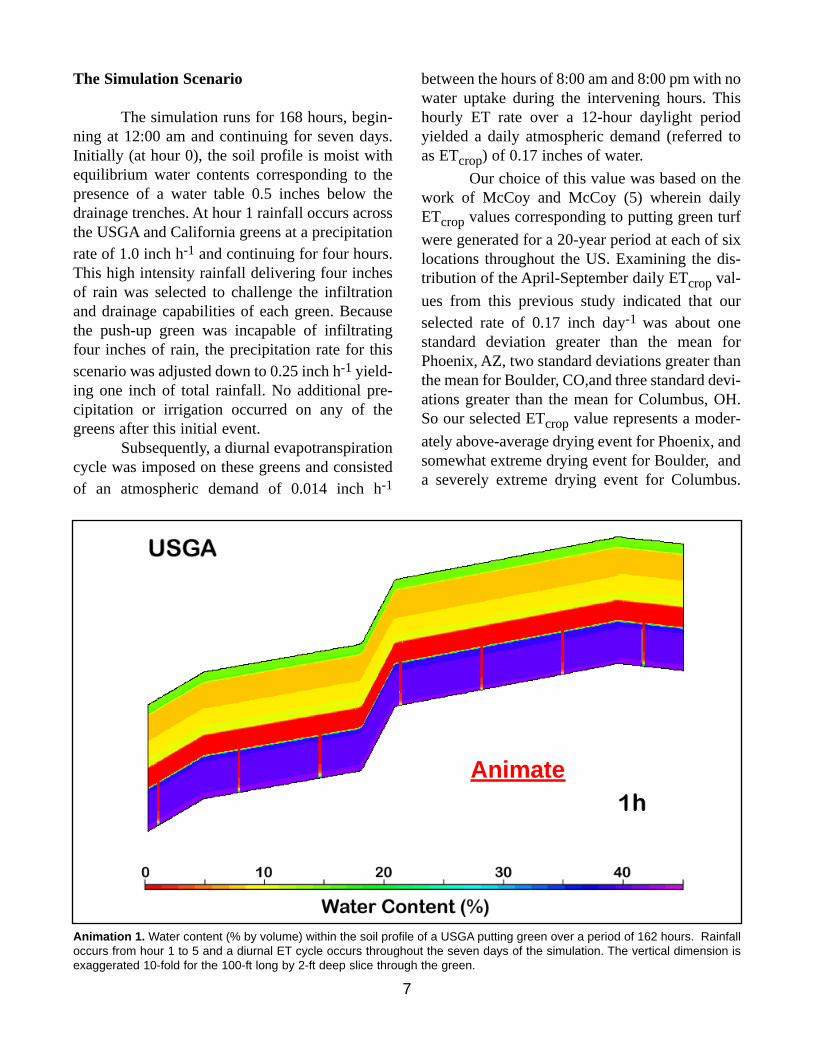
Animation 1. Water content (% by volume) within the soil profile of a USGA putting green over a period of 162 hours. Rainfalloccurs from hour 1 to 5 and a diurnal ET cycle occurs throughout the seven days of the simulation. The vertical dimension isexaggerated 10-fold for the 100-ft long by 2-ft deep slice through the green.
Animate
This was consistent with our goal to challenge thewater retention properties of the simulated greens.
Having supplied all required data for theproblem, each seven-day simulation was run on a3.4 gHz personal computer, requiring a run timeof about eight days and generating about 180 Mbof data. Output from the simulation includes vol-umetric soil water content, drainage rate, andactual turfgrass evapotranspiration (ETa) overseven days. The water content values are generat-ed for all soil depth and lateral distance valuesincluded in the problem (e.g. the entire area ofFigure 1).
The drainage rate values are the total forseven drainage trenches and the ETa values are theintegrated response across the green surface. It isimportant to note that the ETa values are the actu-al turfgrass evapotranspiration rates in response toan atmospheric demand. As such, if any portion ofthe root system is exposed to limiting water con-tent or air-filled porosity values this will reflectdrought or aeration stress and the ETa values asgenerated by the simulation will be less than the0.014 inch h-1 atmospheric demand used in thesimulation.
Results
Water Flow and Drainage in the USGA Green
A time sequence of volumetric soil watercontents within the USGA green soil profile isshown in Animation 1. In this view, the coloredarea is the entire soil profile of this simulation andwater contents within this soil profile are shownby a color scale. The time slices are spaced at 0.5hours during the early phases of the animation andprogressively increase to 12 hours at the end ofthe animation.
The first time slice of this animation iscoincident with the start of the rainstorm, so sub-sequent time slices (from 1.5 to 5 hours) showwater infiltration into the soil. Also shown is theaccumulation of perched water above the interfacebetween the lower rootzone and gravel layers
(from 3 to 3.5 hours). The upper surface of theperched water zone occurs at the interfacebetween green and blue, or at water contents ofabout 27% (by volume). This perched water, how-ever, accumulates only to a limited extent in aUSGA green so that the continued rainfall (from3.5 to 5 hours) simply displaces an equivalent vol-ume of water into the gravel layer. This impliesthat if the 1 inch h-1 rain rate were to continueindefinitely, there would be no further accumula-tion of water within the soil profile and an equiv-alent volume of water would just as rapidly bedrained from the soil.
Water flow through the gravel starting at3.5 hours is evident by the large water content val-ues within the gravel layer just above the interfacewith the subgrade. This distribution of water with-in the gravel layer reaches its maximum extent atfour hours with the characteristic pattern of lowerwater contents adjacent to the drainage trenchesand (within the flat reaches) higher water contentsin between. This pattern remains stationary duringthe final hour of rain indicating a steady rate ofwater flow from the gravel into the drain. Finally,during the rain period, the subgrade transitionsfrom very wet to nearly saturated.
Although there is a slight decline in root-zone water contents during the hour following therain, the results clearly show the establishment ofa uniformly thick perched water layer from hourssix to 12. This perched water layer appears to beonly about three inches thick, characteristic of thelesser water retaining rootzone employed in thissimulation. If the simulation were to have used arootzone mix with smaller air-filled porosity val-ues and greater capillary porosity values, thiswould have resulted in a thicker perched waterlayer. The uniformity of water perching across thegreen is, however, rather short-lived as downslope, lateral water flow in the more steeplysloped sections removes the perched water fromthe crest of these slopes. This becomes apparent at24 hours as evidenced by lower water contentsabove the rootzone/gravel interface at the crest ofthe terrace face and, to a lesser degree, at the highpoint of the green and the crest of the false front.Down slope lateral water flow in sloped, USGA
8
greens has been experimentally observed by bothPrettyman and McCoy (7) and Frank et al. (4).
After 24 hours, lateral flow has substan-tially slowed so that for the remaining hours of thesimulation (from 24 to 162 hours) the rootzonesimply becomes progressively drier due to wateruptake by the turf. It is interesting to observe dur-ing this period that the organic-enriched layermaintains greater water contents than the adjacentportion of the lower rootzone. This is because thesoil of the organic enriched layer has greater waterholding properties than the lower rootzone layer(Table 1). Also the progression of drying appearsto be independent of rootzone depth. This is inter-esting in that water uptake is shown to occur in the6- to 12- inch depth increment even though rootswere not present below six inches. Seemingly, thewater retained at these deeper depths was ade-quately "wicked" nearer the surface and taken upby the roots. Consequently, perched water occur-ring from 9- to 12-inches deep can apparentlyserve as a reservoir for subsequent turf uptake inthese systems.
Viewing the progression of drying acrossthe green, however, shows more intense rootzonedrying in regions of the green where the perchedwater was removed at 24 hours. Thus, the crest ofthe terrace slope, the high point of the green, andthe crest of the false front all show more extreme
drying throughout the rootzone than other areas ofthe green. This is consistent with experimentalobservation of putting green slope effects on root-zone water content by Prettyman and McCoy (8)and Frank et al. (4).
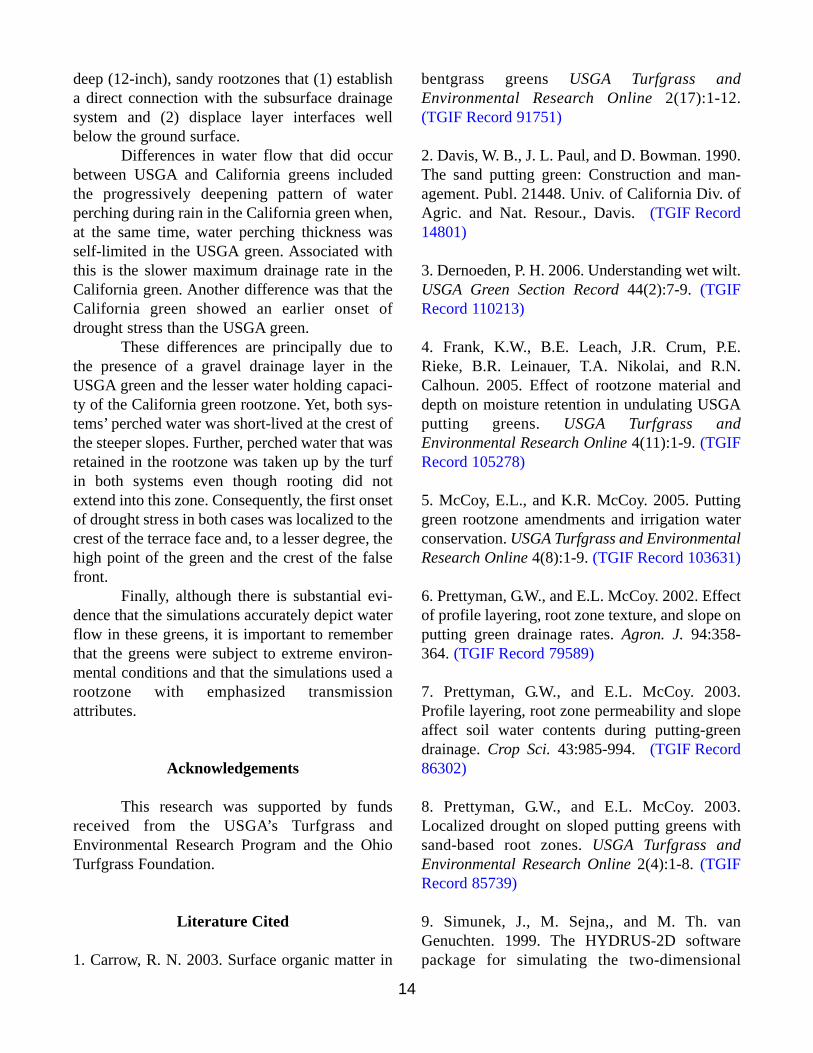
Drainage in the USGA green began a 3.4hours and within one hour increased to its maxi-mum rate of 45.8 inch3 h-1, for a 1-inch thick slicethrough the green (Figure 2). This rate remainedsteady till 15 minutes after rain stopped when thedrainage rate decreased, rapidly at first and thenmore slowly. Twelve hours after rain ended, thedrainage rate had decreased by over two orders ofmagnitude. In the USGA green, the maximumdrainage rate was comparable to the rainfall rateacross the green such that had this rain rate con-tinued indefinitely, water ponding on the surfaceand runoff would have never occurred.
Water Flow and Drainage in the CaliforniaGreen
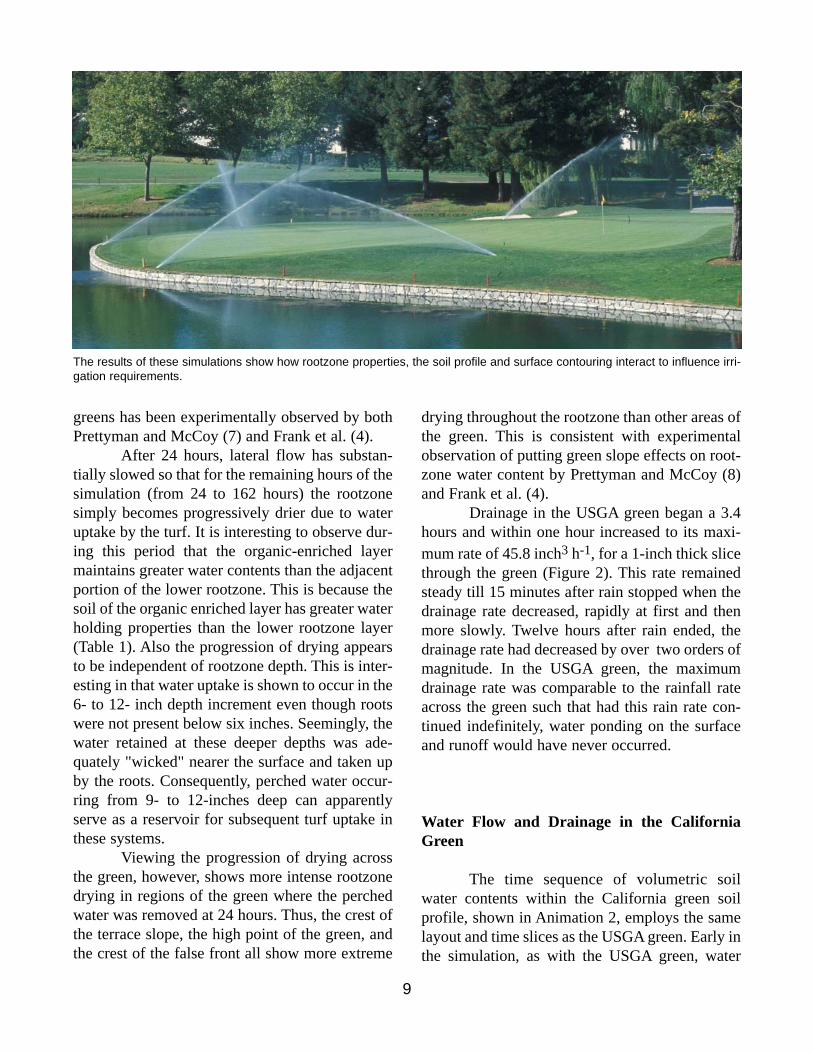
The time sequence of volumetric soilwater contents within the California green soilprofile, shown in Animation 2, employs the samelayout and time slices as the USGA green. Early inthe simulation, as with the USGA green, water
9
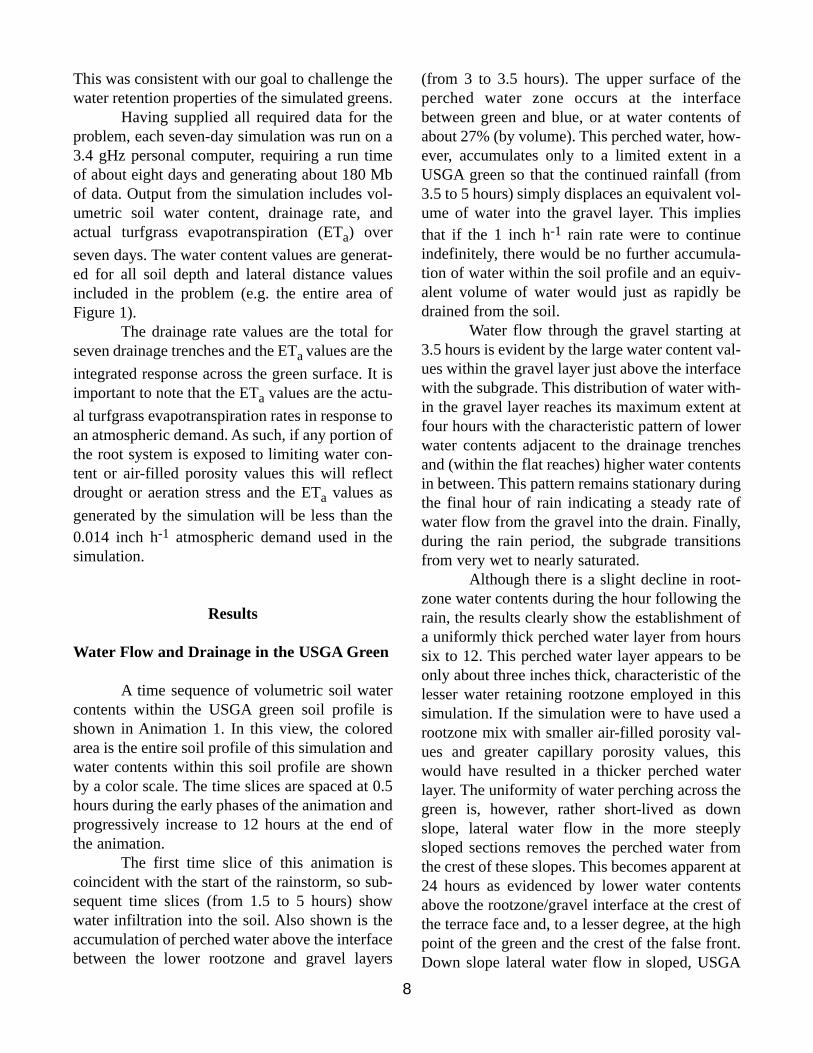
The results of these simulations show how rootzone properties, the soil profile and surface contouring interact to influence irri-gation requirements.
infiltration results in the formation of perchedwater, in this case occurring above therootzone/subgrade interface. Unlike the USGAgreen, however, continued rain results in theperched water zone progressively approaching thesoil surface till at the end of the rain the soil isnearly saturated to the surface. This progressivewetting of the rootzone, however, does not occuruniformly across the green but mostly forms a pat-tern relative to the gravel-filled drainage trenches.In this case, water perching approaches the greensurface mid-way between the drainage trenchesyet remains deeper over the trench.
A lateral pattern of water contents coinci-dent with drainage trenches in a California-stylegreen was also observed experimentally byPrettyman and McCoy (7). This pattern formsbecause a California green lacks a gravel layerunderlying the rootzone so that water must travellaterally rather long distances through the root-zone before entering a drainage trench.
Following the rain, however, the zone ofperched water recedes rapidly at first and thenmore slowly so that by 30 hours, the drain trench-induced pattern has disappeared and the perchedwater zone has a thickness of about three inchesdistributed somewhat uniformly across the green.The exception to this is the absence of perching atthe crest of the terrace face and a 5-inch thickperched water zone at the base of the terrace face.
For the remaining hours of the simulation(from 30 to 162 hours) the rootzone simplybecomes progressively drier due to water uptakeby the turf. During this period, the dynamics ofwater flow in the California green is similar to thatseen in the USGA green. The principal differencebetween these simulations is that the upper 6 inch-es of the California green is much drier for thesame time slice than the USGA green. This is dueto the smaller capillary porosity values andreduced water retention of the California rootzonesand as compared with the USGA rootzone mix.
10
Animation 2. Water content (% by volume) within the soil profile of a California putting green over a period of 162 hours.Rainfall occurs from hour 1 to 5 and a diurnal ET cycle occurs throughout the seven days of the simulation. The vertical dimen-sion is exaggerated 10-fold for the 100-ft long by 20-inch deep slice through the green.
Animate
Drainage in the California green began 3.1hours into the simulation and achieved its maxi-mum rate of 28.3 inch3 h-1 just as the rain ended(Figure 2). The drainage rate subsequentlydeclined, rapidly at first and then more slowly.The California green required 31 hours before thedrainage rate had slowed to at rate 2-orders ofmagnitude less than its peak. In the Californiagreen, the maximum drainage rate was about 60%of the rainfall rate implying that had this rain ratecontinued indefinitely, water would have pondedon the green. The slower maximum drainage ratein the California green than the USGA green is inagreement with the measurements of Prettymanand McCoy (6).
Water Flow and Drainage in the Push-upGreen
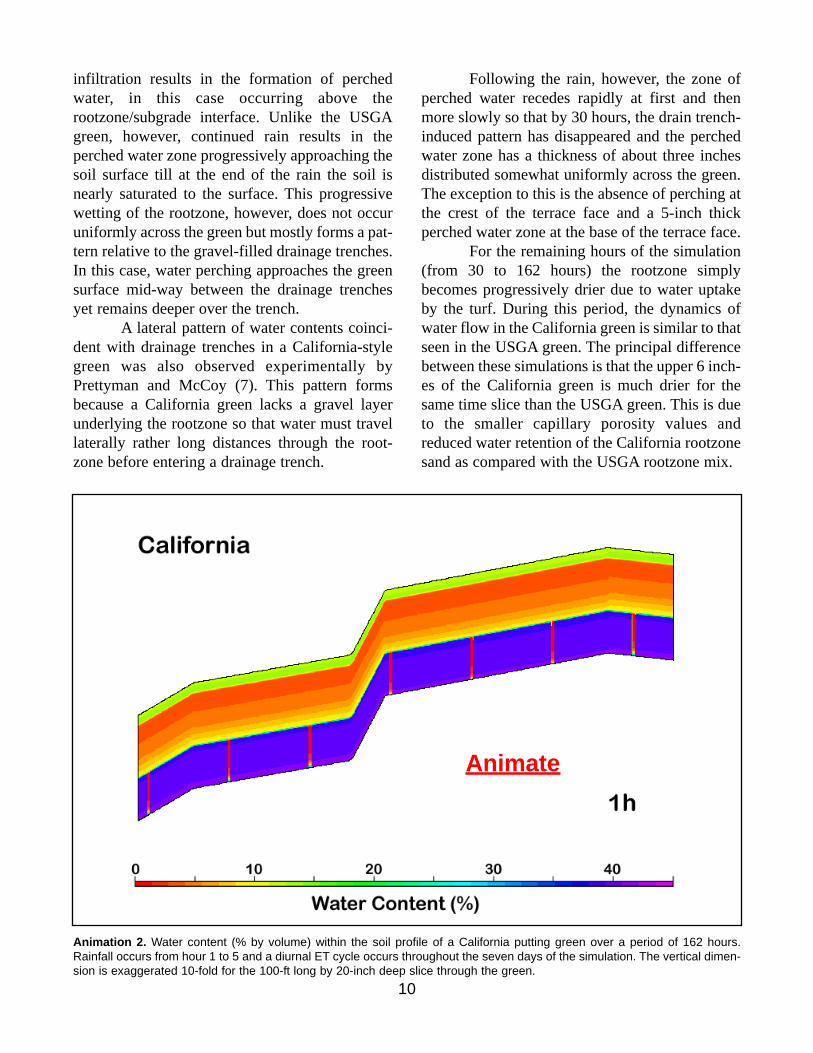
Water infiltration into the push-up greenand the interruption of flow at the rootzone/clayloam interface resulted in a virtually saturated soilprofile when the rain ended at hour 5 (Animation3). This situation remained virtually unchangeduntil hour 24 when water contents declined to the25-35% range at the crest of the terrace face. Itwas not until hour 42, however, before most of theremaining areas of the rootzone followed suit,opening up air-filled pore space for adequate soilaeration. The exception was the base of the terraceface and low point of the green where the soilremained wet.
This overall result is substantially different
11
Animation 3. Water content (% by volume) within the soil profile of a push-up putting green over a period of 162 hours. Rainfalloccurs from hour 1 to 5 and a diurnal ET cycle occurs throughout the seven days of the simulation. The vertical dimension isexaggerated 10-fold for the 100-ft long by 2-ft deep slice through the green.
Animate
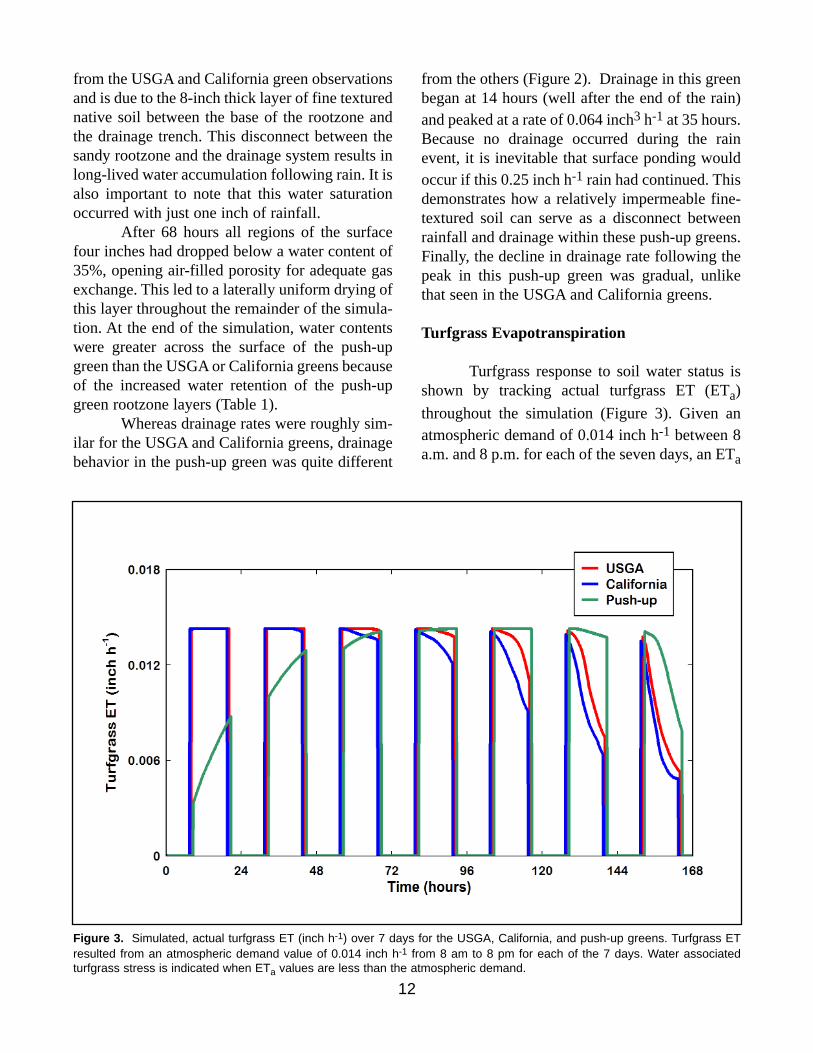
from the USGA and California green observationsand is due to the 8-inch thick layer of fine texturednative soil between the base of the rootzone andthe drainage trench. This disconnect between thesandy rootzone and the drainage system results inlong-lived water accumulation following rain. It isalso important to note that this water saturationoccurred with just one inch of rainfall.
After 68 hours all regions of the surfacefour inches had dropped below a water content of35%, opening air-filled porosity for adequate gasexchange. This led to a laterally uniform drying ofthis layer throughout the remainder of the simula-tion. At the end of the simulation, water contentswere greater across the surface of the push-upgreen than the USGA or California greens becauseof the increased water retention of the push-upgreen rootzone layers (Table 1).
Whereas drainage rates were roughly sim-ilar for the USGA and California greens, drainagebehavior in the push-up green was quite different
from the others (Figure 2). Drainage in this greenbegan at 14 hours (well after the end of the rain)and peaked at a rate of 0.064 inch3 h-1 at 35 hours.Because no drainage occurred during the rainevent, it is inevitable that surface ponding wouldoccur if this 0.25 inch h-1 rain had continued. Thisdemonstrates how a relatively impermeable fine-textured soil can serve as a disconnect betweenrainfall and drainage within these push-up greens.Finally, the decline in drainage rate following thepeak in this push-up green was gradual, unlikethat seen in the USGA and California greens.
Turfgrass Evapotranspiration
Turfgrass response to soil water status isshown by tracking actual turfgrass ET (ETa)throughout the simulation (Figure 3). Given anatmospheric demand of 0.014 inch h-1 between 8a.m. and 8 p.m. for each of the seven days, an ETa
12
Figure 3. Simulated, actual turfgrass ET (inch h-1) over 7 days for the USGA, California, and push-up greens. Turfgrass ETresulted from an atmospheric demand value of 0.014 inch h-1 from 8 am to 8 pm for each of the 7 days. Water associated turfgrass stress is indicated when ETa values are less than the atmospheric demand.

value less than this would indicate water associat-ed stress according to the simulation protocol.Further, stress observed early in the simulationfollowing the rainstorm is regarded as a soil aera-tion (or wet wilt) stress due to inadequate air-filledporosity within the soil where roots reside. Stressobserved late in the simulation is regarded asdrought stress due to inadequate soil water con-tents within the depth increment of turf rooting.
Soil aeration stress was observed from thesimulation results of the push-up green, occurringmostly throughout the first two days (Figure 3).During daylight hours of the first day, ETa aver-aged 42% of atmospheric demand and in the sec-ond day averaged 88%. The reduced severity ofaeration stress on the second day matches the pro-gressive opening of air-filled porosity as localizedwater contents dropped below 35% (Animation3). No soil aeration stress was observed from thesimulation results of either the USGA orCalifornia greens (Figure 3). Even though thewater content animations for these greens showedsubstantial differences in water perching, watercontents in both cases had sufficiently declinedthroughout the depth of rooting so as to provideadequate air-filled porosity. The ability of thesegreens to avoid aeration stress is likely due to thegravel layer of the USGA green and the excep-tionally high permeability of the California green,each leading to adequate drainage.
Drought stress, as defined in the simula-tion protocol, appeared on day 3 in the Californiagreen and on day 4 in the USGA green (Figure 3).Although drought stress increased in its severityon subsequent days, both greens showed a dailypattern of lesser stress in the morning with a deep-ening stress later in the afternoon. This suggestsan overnight replenishing of water within theregion of turfgrass rooting from the perched waterretained below this depth. Although this responsehas not been documented from experimentalwater content measurements, it is frequentlyobserved that turf showing drought stress in theafternoon appears to be sufficiently hydrated thefollowing morning.
As with the water content animationswhere values in the upper six inches of the
California green are much drier for the same timeslice than the USGA green, turf drought in theCalifornia green precedes that in the USGA green.This, again, is due to the lesser water retention ofthe California green rootzone sand (Table 1).Finally, drought stress was not observed till day 7of the push-up green simulation, even though thisgreen received 25% of the total rainfall of theother greens.
The results in Figure 3 show actual turf-grass ET across the entire green surface. Notapparent in this figure is the localized responsethat can be inferred from the water content anima-tions (Animations 1 to 3). Thus, the early onset ofdrought stress in the USGA and California greenswere isolated principally to the crest of the terraceface and, to a lesser degree, the high point of thegreen and the crest of the false front. These loca-tions are precisely where the perched water disap-peared first. Down slope versus upslope differ-ences in turf drought stress within high sand con-tent putting greens was observed experimentallyby Prettyman and McCoy (8).
Conclusions
Throughout the seven days of this simula-tion, 70, 63 and 9% of the total rainfall drainedfrom the USGA, California, and push-up greens,respectively. Thus, even though the amount ofrainfall occurring on the push-up green was 25%of the others, a disproportionate small fraction ofthe rainfall found its way to the drainage trenchesin the push-up green. Cumulative evapotranspira-tion over the seven-day simulation was 27% inboth the USGA and California greens as contrast-ed with 106% in the push-up green. The reasonwhy ET in the push-up green exceeded 100% wasbecause some water initially present in the soilprofile was used in evapotranspiration over theseven days.
These facts, together with the other simu-lation results, emphasize that water flow in USGAor California greens are relatively similar whencompared to a push-up green. This is principallybecause both USGA and California greens employ
13
deep (12-inch), sandy rootzones that (1) establisha direct connection with the subsurface drainagesystem and (2) displace layer interfaces wellbelow the ground surface.
Differences in water flow that did occurbetween USGA and California greens includedthe progressively deepening pattern of waterperching during rain in the California green when,at the same time, water perching thickness wasself-limited in the USGA green. Associated withthis is the slower maximum drainage rate in theCalifornia green. Another difference was that theCalifornia green showed an earlier onset ofdrought stress than the USGA green.
These differences are principally due tothe presence of a gravel drainage layer in theUSGA green and the lesser water holding capaci-ty of the California green rootzone. Yet, both sys-tems’ perched water was short-lived at the crest ofthe steeper slopes. Further, perched water that wasretained in the rootzone was taken up by the turfin both systems even though rooting did notextend into this zone. Consequently, the first onsetof drought stress in both cases was localized to thecrest of the terrace face and, to a lesser degree, thehigh point of the green and the crest of the falsefront.
Finally, although there is substantial evi-dence that the simulations accurately depict waterflow in these greens, it is important to rememberthat the greens were subject to extreme environ-mental conditions and that the simulations used arootzone with emphasized transmission attributes.
Acknowledgements
This research was supported by fundsreceived from the USGA’s Turfgrass andEnvironmental Research Program and the OhioTurfgrass Foundation.
Literature Cited
1. Carrow, R. N. 2003. Surface organic matter in
bentgrass greens USGA Turfgrass andEnvironmental Research Online 2(17):1-12.(TGIF Record 91751)
2. Davis, W. B., J. L. Paul, and D. Bowman. 1990.The sand putting green: Construction and man-agement. Publ. 21448. Univ. of California Div. ofAgric. and Nat. Resour., Davis. (TGIF Record14801)
3. Dernoeden, P. H. 2006. Understanding wet wilt.USGA Green Section Record 44(2):7-9. (TGIFRecord 110213)
4. Frank, K.W., B.E. Leach, J.R. Crum, P.E.Rieke, B.R. Leinauer, T.A. Nikolai, and R.N.Calhoun. 2005. Effect of rootzone material anddepth on moisture retention in undulating USGAputting greens. USGA Turfgrass andEnvironmental Research Online 4(11):1-9. (TGIFRecord 105278)
5. McCoy, E.L., and K.R. McCoy. 2005. Puttinggreen rootzone amendments and irrigation waterconservation. USGA Turfgrass and EnvironmentalResearch Online 4(8):1-9. (TGIF Record 103631)
6. Prettyman, G.W., and E.L. McCoy. 2002. Effectof profile layering, root zone texture, and slope onputting green drainage rates. Agron. J. 94:358-364. (TGIF Record 79589)
7. Prettyman, G.W., and E.L. McCoy. 2003.Profile layering, root zone permeability and slopeaffect soil water contents during putting-greendrainage. Crop Sci. 43:985-994. (TGIF Record86302)
8. Prettyman, G.W., and E.L. McCoy. 2003.Localized drought on sloped putting greens withsand-based root zones. USGA Turfgrass andEnvironmental Research Online 2(4):1-8. (TGIFRecord 85739)
9. Simunek, J., M. Sejna,, and M. Th. vanGenuchten. 1999. The HYDRUS-2D softwarepackage for simulating the two-dimensional
14

movement of water, heat, and multiple solutes invariably-saturated media. IGWMC-TPS 53,Version 2.0, International Ground Water ModelingCenter, Colorado School of Mines, Golden, Colo.
10. U.S. Golf Association Green Section Staff.1993. USGA recommendations for a method ofputting green construction. USGA Green SectionRecord 31(2):1-3. (TGIF Record 26681)
11. Wauchope, R.D., L.R. Ahuja, J.G. Arnold, R.Bingner, R. Lowrance, M.T. van Genuchten, andL.D. Adams. 2003. Software for pest-managementscience: computer models and databases from theUnited States Department of Agriculture -Agricultural Research Service. Pest ManagementScience 59:691-698. (TGIF Record 114068)
15