sra performance report 2014 - sugar research australia · the performance report is a...
TRANSCRIPT

SRA Performance Report 2014–15
TM

The industry controls $7.4 billion in land and $4.5 billion in infrastructure assets.
Over 32 million tonnes of sugarcane was crushed during the 2014 season, producing 4.6 million tonnes of sugar.
Australian sugar industry Quick facts
Australia’s sugar industry accounts for only 2% of world sugar production but is the world’s 3rd largest exporter of raw sugar.
There are about
4,000 cane farming businesses
They supply 24 mills owned by 8 milling companies
75% of Australia’s sugar exports are to South Korea, Japan and Indonesia.
To meet the industry target of 36 million tonnes or more by 2017, Australia’s sugarcane production will have to increase by more than 11%.
80% of Australian sugar is exported, with a yearly value of nearly $1.5 billion.

© Copyright 2015 by Sugar Research Australia Limited. All rights reserved. No part of the SRA Performance Report 2014/15 (this publication) may be reproduced, stored in a retrieval system, or transmitted in any form or by any means, electronic, mechanical, photocopying, recording, or otherwise, without the prior permission of Sugar Research Australia Limited.
Disclaimer: In this disclaimer a reference to ‘SRA’, ‘we’, ‘us’ or ‘our’ means Sugar Research Australia Limited and our directors, officers, agents and employees. Although we do our very best to present information that is correct and accurate, we make no warranties, guarantees or representations about the suitability, reliability, currency or accuracy of the information we present in this publication, for any purposes. Subject to any terms implied by law and which cannot be excluded, we accept no responsibility for any loss, damage, cost or expense incurred by you as a result of the use of, or reliance on, any materials and information appearing in this publication. You, the user, accept sole responsibility and risk associated with the use and results of the information appearing in this publication, and you agree that we will not be liable for any loss or damage whatsoever (including through negligence) arising out of, or in connection with the use of this publication. We recommend that you contact our staff before acting on any information provided in this publication.
Warning: Our tests, inspections and recommendations should not be relied on without further, independent inquiries. They may not be accurate, complete or applicable for your particular needs for many reasons, including (for example) SRA being unaware of other matters relevant to individual crops, the analysis of unrepresentative samples or the influence of environmental, managerial or other factors on production.
Table of contents
01 Executive summary
03 Introduction
04 Performance against plan for 2014/15
07 Snapshot of RD&E delivered in 2014/15
10 RD&E outcomes
22 Appendix 1: Acronyms
23 Appendix 2: 2013/14-2017/18 Strategic Plan Summary

01
SRA’s Genetically-Modified (GM) program for the development of Herbicide-Tolerant (HT) sugarcane continues to meet all milestones, as set by our commercial partner – although, it should be noted that there is currently no GM sugarcane in production in Australia.
Australia’s cane yield (t/ha) continues to out-perform that of the world’s top four sugarcane producing countries.
Significant milestone for SRA achieved with the release of the first SRA-branded varietiesSRA1, SRA2 and SRA3
Executive summary
SRA scores highly in its first-ever Grower Survey
Sugar Research Australia Limited Performance Report 2014–15
✓ 66% of growers rated SRA high in terms of their perception
of value/influence of SRA’s products and services.
SRA’s RD&E information products and services were rated,
on average, 3.6 out of 5.
Critical YCS research supported by the development of sugarcane metabolome and transcriptome databases.
SRA’s breeding program has led to more than 90% of Australia’s sugarcane crop now being resistant to smut.
SRA’s RD&E investments are yielding positive returns for investors.
Independent analyses of a selection of SRA projects produced an aggregated Benefit-Cost Ratio of 4 to 1.
Sustained genetic improvement in SRA’s breeding program shows the health of the SRA breeding program.
Highest rate of genetic gain ever achieved at a 30-year rolling average of 192 kg of sugar per hectare per year gain.
Yellow Canopy Syndrome (YCS) is #1 priority
Research has brought us one-step closer to identifying the cause of YCS by eliminating Nigrospora fungus, linear bugs, sugarcane yellow virus and soil nutrient deficiency as causal factors.

02
Breakthrough research identified the cause of Ramu Stunt Disease to be a virus transmitted by a planthopper.
Pest and disease resistance ratings developed for germplasm against exotic borers, Downy Mildew and Ramu Stunt.
Major scientific discovery by SRA with DNA sequencing used to identify a new type of pathogen as a causal agent of chlorotic streak.
Something that has baffled the world sugarcane community for 80 years.
Approximately 50% of sugarcane growers have attended SRA events.
Providing improved understanding of new research, technology
and best management practices.
58% of growers have changed farming practices over
past 2 years, with 40% acknowledging SRA as a key influencer of practice change.
63% of growers are using SIX EASY STEPS™ to calculate
their fertiliser use.
Nitrogen-Use Efficiency Review supports the principles of SIX
EASY STEPSTM as a robust BMP framework for
industry.
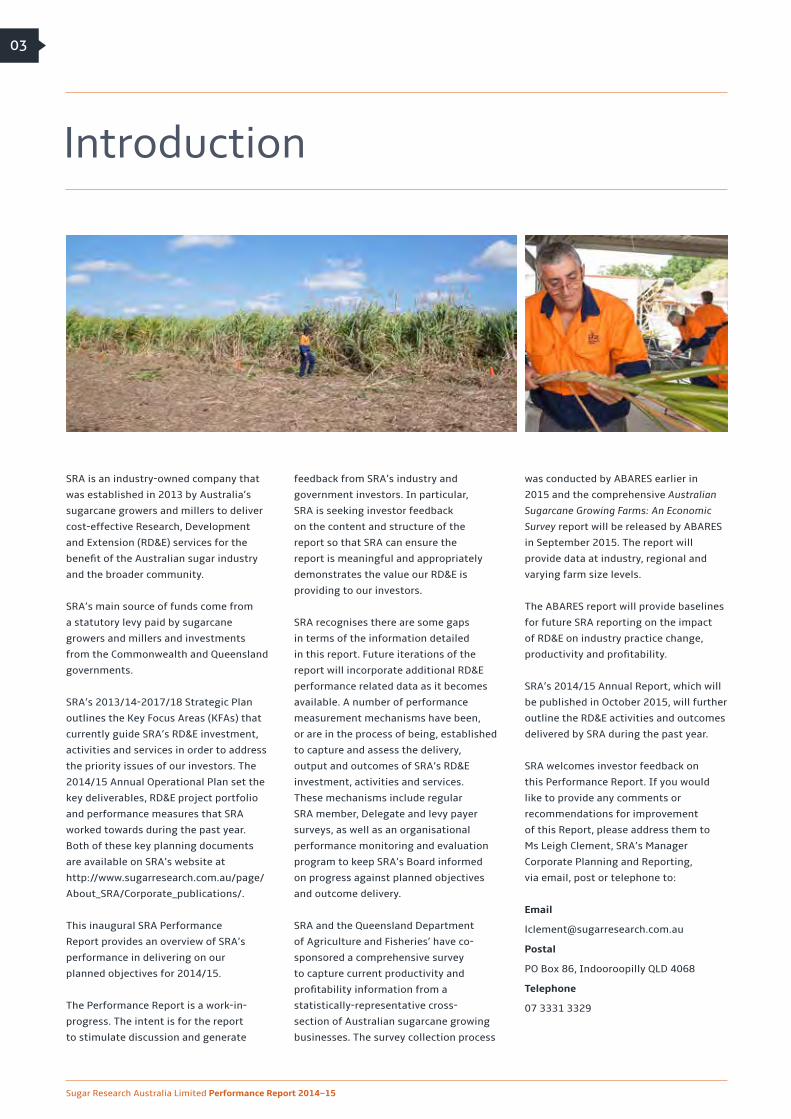
SRA is an industry-owned company that
was established in 2013 by Australia’s
sugarcane growers and millers to deliver
cost-effective Research, Development
and Extension (RD&E) services for the
benefit of the Australian sugar industry
and the broader community.
SRA’s main source of funds come from
a statutory levy paid by sugarcane
growers and millers and investments
from the Commonwealth and Queensland
governments.
SRA’s 2013/14-2017/18 Strategic Plan
outlines the Key Focus Areas (KFAs) that
currently guide SRA’s RD&E investment,
activities and services in order to address
the priority issues of our investors. The
2014/15 Annual Operational Plan set the
key deliverables, RD&E project portfolio
and performance measures that SRA
worked towards during the past year.
Both of these key planning documents
are available on SRA’s website at
http://www.sugarresearch.com.au/page/
About_SRA/Corporate_publications/.
This inaugural SRA Performance
Report provides an overview of SRA’s
performance in delivering on our
planned objectives for 2014/15.
The Performance Report is a work-in-
progress. The intent is for the report
to stimulate discussion and generate
feedback from SRA’s industry and
government investors. In particular,
SRA is seeking investor feedback
on the content and structure of the
report so that SRA can ensure the
report is meaningful and appropriately
demonstrates the value our RD&E is
providing to our investors.
SRA recognises there are some gaps
in terms of the information detailed
in this report. Future iterations of the
report will incorporate additional RD&E
performance related data as it becomes
available. A number of performance
measurement mechanisms have been,
or are in the process of being, established
to capture and assess the delivery,
output and outcomes of SRA’s RD&E
investment, activities and services.
These mechanisms include regular
SRA member, Delegate and levy payer
surveys, as well as an organisational
performance monitoring and evaluation
program to keep SRA’s Board informed
on progress against planned objectives
and outcome delivery.
SRA and the Queensland Department
of Agriculture and Fisheries’ have co-
sponsored a comprehensive survey
to capture current productivity and
profitability information from a
statistically-representative cross-
section of Australian sugarcane growing
businesses. The survey collection process
was conducted by ABARES earlier in
2015 and the comprehensive Australian
Sugarcane Growing Farms: An Economic
Survey report will be released by ABARES
in September 2015. The report will
provide data at industry, regional and
varying farm size levels.
The ABARES report will provide baselines
for future SRA reporting on the impact
of RD&E on industry practice change,
productivity and profitability.
SRA’s 2014/15 Annual Report, which will
be published in October 2015, will further
outline the RD&E activities and outcomes
delivered by SRA during the past year.
SRA welcomes investor feedback on
this Performance Report. If you would
like to provide any comments or
recommendations for improvement
of this Report, please address them to
Ms Leigh Clement, SRA’s Manager
Corporate Planning and Reporting,
via email, post or telephone to:
Postal
PO Box 86, Indooroopilly QLD 4068
Telephone
07 3331 3329
03
Sugar Research Australia Limited Performance Report 2014–15
Introduction
04
Performance against plan for 2014/15
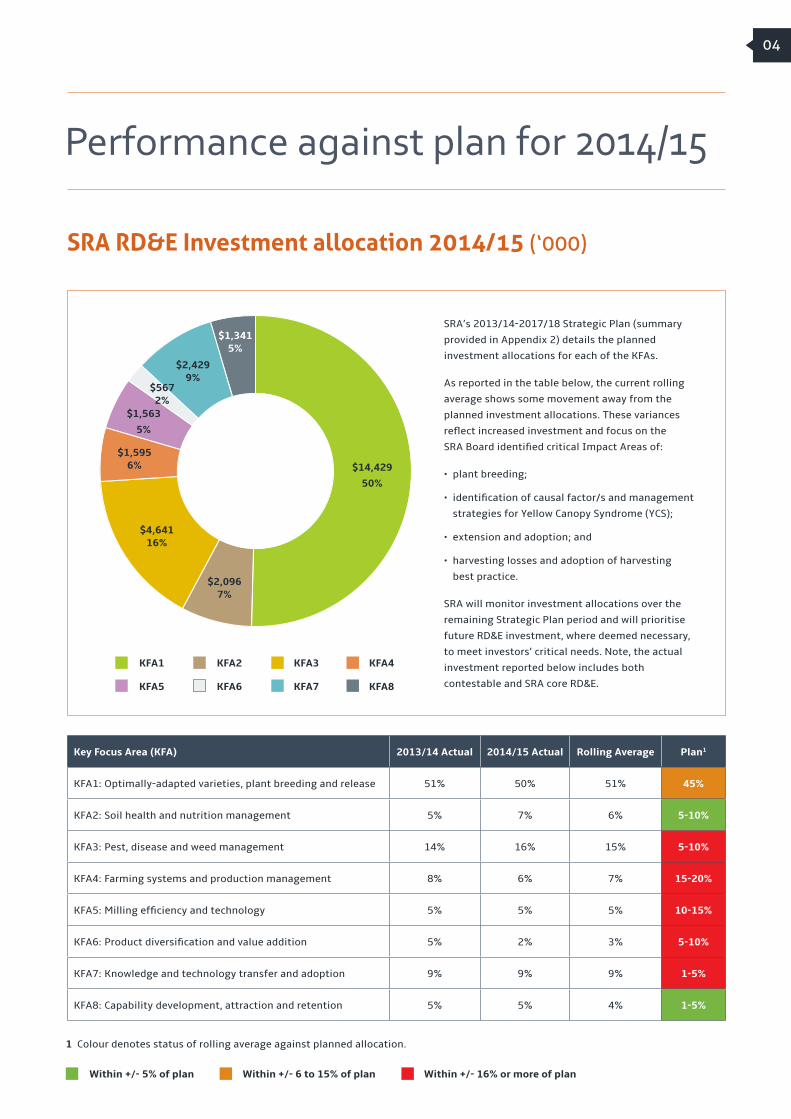
SRA RD&E Investment allocation 2014/15 (‘000)
SRA’s 2013/14-2017/18 Strategic Plan (summary
provided in Appendix 2) details the planned
investment allocations for each of the KFAs.
As reported in the table below, the current rolling
average shows some movement away from the
planned investment allocations. These variances
reflect increased investment and focus on the
SRA Board identified critical Impact Areas of:
• plant breeding;
• identification of causal factor/s and management
strategies for Yellow Canopy Syndrome (YCS);
• extension and adoption; and
• harvesting losses and adoption of harvesting
best practice.
SRA will monitor investment allocations over the
remaining Strategic Plan period and will prioritise
future RD&E investment, where deemed necessary,
to meet investors’ critical needs. Note, the actual
investment reported below includes both
contestable and SRA core RD&E.
KFA1
KFA2
KFA3
KFA4
KFA5
KFA6
KFA7
KFA8
$1,3415%
$2,4299%
$5672%
$1,563
5%
$1,5956%
$4,64116%
$2,0967%
$14,429
50%
KFA1
KFA5
KFA2
KFA6
KFA3
KFA7
KFA4
KFA8
1 Colour denotes status of rolling average against planned allocation.
Within +/- 5% of plan Within +/- 6 to 15% of plan Within +/- 16% or more of plan
Key Focus Area (KFA) 2013/14 Actual 2014/15 Actual Rolling Average Plan1
KFA1: Optimally-adapted varieties, plant breeding and release 51% 50% 51% 45%
KFA2: Soil health and nutrition management 5% 7% 6% 5-10%
KFA3: Pest, disease and weed management 14% 16% 15% 5-10%
KFA4: Farming systems and production management 8% 6% 7% 15-20%
KFA5: Milling efficiency and technology 5% 5% 5% 10-15%
KFA6: Product diversification and value addition 5% 2% 3% 5-10%
KFA7: Knowledge and technology transfer and adoption 9% 9% 9% 1-5%
KFA8: Capability development, attraction and retention 5% 5% 4% 1-5%

05 2014/15 Annual Operational Plan Measures Result Comments
KFA1: Optimally-adapted varieties, plant breeding and release
Release of improved varieties, with targeted 3 varieties per
5-year period.
3 varieties released in 2015.
Percent production from new varieties. Decreased with dominance of Q208A and KQ228A.
Rate of genetic gain (TCH, CCS, TSH). A 30-year rolling average of 192 kg sugar/ha/year gain -
the highest achieved.
Weighted average disease ratings for varieties in each region. >90% of crop resistant to smut, >97% at least intermediate
resistance to pachymetra root rot.
KFA 2: Soil health and nutrient management
Soil health indicators developed for sustainable sugarcane
production.
District-specific soil guides released for Isis and Mackay
regions.
Tools and/or varieties identified for increasing nutrient
use-efficiency.
R&D review conducted with future funding to be based
on review outcomes and further industry consultation.
Soil health guidelines and workshops delivered.
Tools developed for minimising chemical and nutrient losses
and understanding water quality.
Guidelines, workshops and industry updates provided.
Research program developed with EHP to examine
nutrient efficiency.
SIX EASY STEPS™ reviewed with improvements where necessary.
Review of nitrogen-use efficiency completed, with report
supporting SIX EASY STEPSTM as providing industry with a
robust BMP framework.
KFA 3: Pest, disease and weed management
Effective pest, disease and weed diagnostic capabilities and
awareness and training programs.
DNA diagnostics developed for Ramu stunt.
Development and adoption of packages for integrated
management of key pests, diseases and weeds.
New technology (e.g. suSCon® maxi Intel), guidelines and
workshops provided.
Weighted average disease ratings for varieties in each region. >90% of crop resistant to smut, >97% at least intermediate
resistance to pachymetra root rot.
Up-to-date dossiers to support contingency plans to minimise
threats and impacts of key exotics.
Dossiers, awareness and training programs revised for
borers, Ramu stunt and downy mildew.
Capability to provide entomology, pathology and weed expertise. All industry requests dealt with within 48 hours.
KFA 4: Farming systems and production management
Methodology for more rapid and efficient bulking of sugarcane
varieties.
Slow progress as DuPont is still developing the business
model to take the technology to ‘pilot scale’ testing.
Adoption of a better sugarcane planting technology. 37% increase between 2014 and 2015 in tissue culture
ordered to propagate clean seed.
Improved crop performance over longer cropping cycles.
Precision agriculture and technology aiding farm
management and production, e.g. yield forecasting using
satellite imagery.
Better crop management under conditions of water stress. System developed to compare varieties’ water logging
tolerances.
Guidelines for implementation of precision agriculture
developed.
Precision Agriculture manual produced.
Adoption of precision agriculture technology and techniques. Active usage in some areas, slow adoption in others.
Adoption of harvesting best-practice. Trial demonstrations underway. Impact area for increased
focus in 2015/16.

062014/15 Annual Operational Plan Measures Result Comments
KFA 5: Milling efficiency and technology
Adoption of improved or novel milling processes and
technology. Unknown
Adoption measurement and monitoring yet to be
established.
KFA 6: Product diversification and value addition
Sugar industry supply chain analysis completed.
Highest priority identified as harvest losses, planning
underway to further quantify losses and promote adoption
of Harvesting Best Practice.
Identification of new opportunities in product diversification
and innovation.
Some technologies identified and feasibility tested, but
remains low industry priority.
KFA 7: Knowledge and technology transfer and adoption
Joint planning of research translation and extension programs
with other stakeholders.
Joint plans under development.
Effective delivery of extension messages. Ongoing publication, communication and extension of R&D.
Increased awareness of technological innovations, locally
and internationally.
Practical manuals, guidelines, webinars and factsheets
released.
Research outputs’ key RD&E messages are promoted in a
timely manner through various channels.
SRA and industry communication tools and channels
improved.
Increased support for and participation in SRA delivery
networks, events and extension programs.
Baselines set 2014/15.
KFA 8: Capability development, attraction and retention
SRA participation and investment in relevant collaborative and
cross-sectoral RD&E programs.
Participation in numerous programs, e.g. climate change,
soils, water use, plant biosecurity, and biofuels and
bioenergy.
Increased availability of skilled industry personnel. Scholarship, training and extension programs provided.
SRA sponsored Young Industry Participants’ Forum held
annually.
SRA sponsored activity and support for Australian Cane
Farmers Association’s (ACFA’s) Next Gen program.
Development and uptake of new and existing knowledge
transfer or training programs or resources.
Various extension programs, guidelines and tools
developed.
Scholarships awarded to current and future industry
participants.
Scholarship, grant and support programs provided.
Summary performance to plan
73% 24% 3%of measures have been achieved
are on track with progress/improvement made but objective not yet fully achieved
has not been achieved and significant action is required to reach objective

07
Sugar Research Australia Limited Performance Report 2014–15
Snapshot of RD&E delivered in 2014/15
KFA1: Optimally adapted varieties, plant breeding and release
• First of SRA varieties released – SRA1, SRA2 and SRA3.
• New variety exchange program signed with Sri Lanka to increase genetic diversity in SRA’s breeding program.
• Generated sugarcane genomic sequence relevant to traits important to industry.
• SRA Board adopted recommendations of an independent review to enhance plant breeding in the Herbert region.
• GM program for the development of herbicide-tolerant sugarcane continues to meet all milestones, as set by SRA’s commercial
partner.
• Review of nitrogen-use efficiency in sugarcane completed, with the report recommendations supporting adoption of SIX EASY STEPS™.
• Conducted workshops in all sugarcane regions to improve industry understanding of environmental risks associated with recycling of
milling by-products on-farm.
• Released soil guides for Mackay and Isis regions, with more guides in the pipe-line to assist growers in managing production for
specific soil types.
• An applicator has been built by a grower group at Maryborough to allow soil amelioration (mill mud, compost) to be applied
sub-surface at a commercial scale, to improve productivity of marginal soils.
• Participated in the development of a cross-sectoral national Soils Strategy that aims to increase farm productivity and profitability
through enhanced soil mapping, management and understanding the role of soils in natural ecosystems.
• Yellow Canopy Syndrome (YCS) is SRA’s #1 priority – we have eliminated Nigrospora fungus, linear bugs, sugarcane yellow
leaf virus and soil nutrient deficiency as causal factors, bringing us one step closer to determining the cause and developing
management solutions.
• Research breakthrough showing the cause of Ramu Stunt Disease, a high-priority biosecurity issue, to be a virus transmitted by
a planthopper.
• DNA sequencing has identified a new type of pathogen as a causal agent of chlorotic streak – something that has baffled the
world sugarcane community for 80 years.
• Developed national diagnostic protocols for high-priority pests and diseases, e.g. a new diagnostic for ratoon stunting disease.
• In collaboration with CropCare Australia, SuSCon® maxi Intel has been registered for extended cane grub control.
KFA2: Soil health and nutrient management
KFA3: Pest, disease and weed management

08
• Satellite imagery used to develop predictions of average yield for regions during the 2014 growing season.
• System developed to compare the tolerance to water logging of different cane varieties.
• Released High-Yielding Cane, Irrigation and Harvesting Best Practice Manuals to highlight current research, innovations and best
management practice.
• Conducted harvesting performance trials in a number of regions to quantify the effects on crop yield of differing harvester
operational parameters, including performance at different ground speeds, fan speeds and basecutter heights. Trials will be
repeated to determine impact over time.
• Ongoing participation in cross-sectoral programs relating to managing climate variability, including research and the development
of climate forecasting tools to aid on-farm production management.
• A ‘whole of factory’ model (SysCAD) developed to provide dynamic simulation to assess advanced control options for improved
operational efficiency in mills.
• Completed review of wet scrubber technology in the sugar and non-sugar industries.
• Improved modelling capability to more accurately represent the various processes occurring in a tangential entry fixed-vane wet
scrubber.
• Completed performance assessment of vacuum belt press filters to process mill mud compared to common factory rotary vacuum
filters, with project results being useful to any mill considering replacing an existing filter or installing new ones.
• Developed training resources for traffic officer to improve efficiency of cane traffic operations.
• New technologies have been developed to produce biofuels, platform chemicals and other value-added products from the
thermochemical processing of bagasse.
• Novel materials have been identified as catalysts for the production of furan derivatives from sugar waste components.
• Research has demonstrated that zeolites, which have many and varied industrial uses, could be produced from bagasse ash.
• Secured funding to lead a cross-sectoral $6 million project researching bio-refineries for higher-value animal feed, chemicals
and fuel.
KFA4: Farming systems and production management
KFA5: Milling efficiency and technology
KFA6: Product diversification and value addition
09
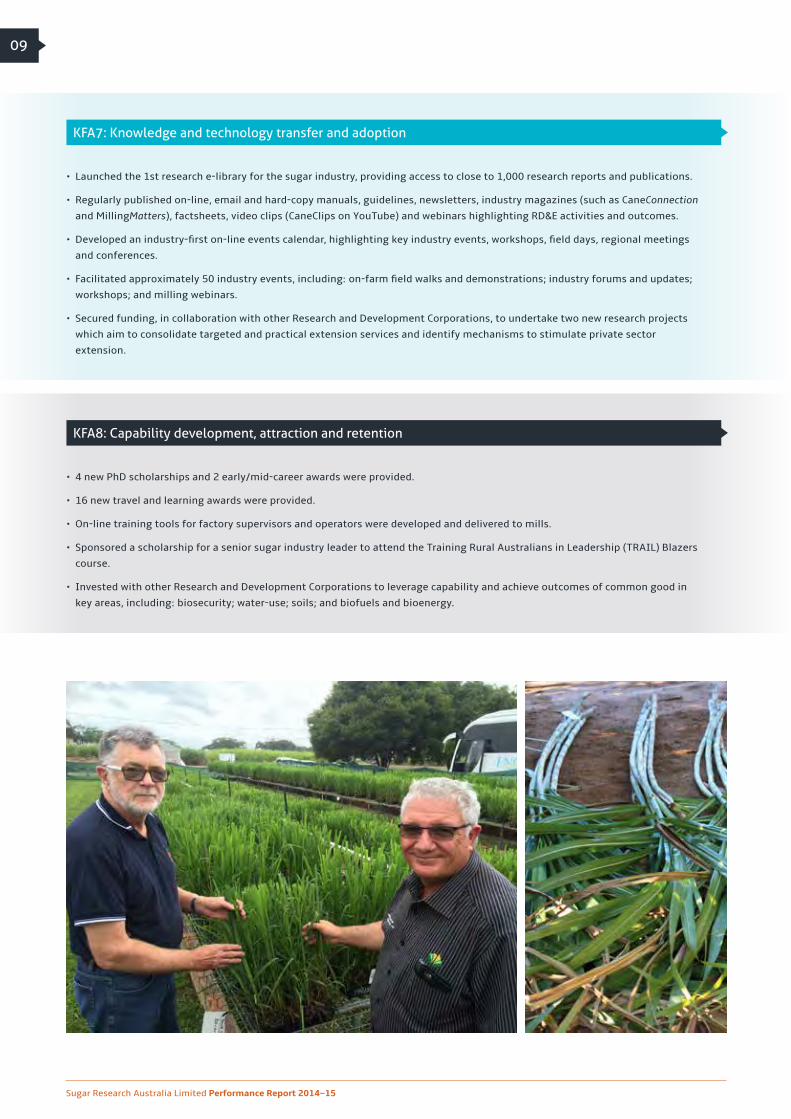
• Launched the 1st research e-library for the sugar industry, providing access to close to 1,000 research reports and publications.
• Regularly published on-line, email and hard-copy manuals, guidelines, newsletters, industry magazines (such as CaneConnection
and MillingMatters), factsheets, video clips (CaneClips on YouTube) and webinars highlighting RD&E activities and outcomes.
• Developed an industry-first on-line events calendar, highlighting key industry events, workshops, field days, regional meetings
and conferences.
• Facilitated approximately 50 industry events, including: on-farm field walks and demonstrations; industry forums and updates;
workshops; and milling webinars.
• Secured funding, in collaboration with other Research and Development Corporations, to undertake two new research projects
which aim to consolidate targeted and practical extension services and identify mechanisms to stimulate private sector
extension.
• 4 new PhD scholarships and 2 early/mid-career awards were provided.
• 16 new travel and learning awards were provided.
• On-line training tools for factory supervisors and operators were developed and delivered to mills.
• Sponsored a scholarship for a senior sugar industry leader to attend the Training Rural Australians in Leadership (TRAIL) Blazers
course.
• Invested with other Research and Development Corporations to leverage capability and achieve outcomes of common good in
key areas, including: biosecurity; water-use; soils; and biofuels and bioenergy.
KFA7: Knowledge and technology transfer and adoption
KFA8: Capability development, attraction and retention
Sugar Research Australia Limited Performance Report 2014–15

Global yieldsProductivity
10
RD&E outcomes
Australia is the 7th largest sugarcane producer in the world but continues to be the world leader in terms of sugarcane yields.
Australia’s yields are recovering after the impact of significant weather events during 2008-2011.
Source: Food and Agriculture Organisation of the United Nations, Statistics Division, http://faostat3.fao.org/home/E;
Sugar Year Book 2014, International Sugar Organisation, London, 2014.
45
50
55
60
65
70
75
80
85
90
95
2003 2004 2005 2006 2007 2008 2009 2010 2011 2012 2013
Can
e yi
eld
(t/ha
)
Global sugarcane yields (t/ha)
Australia Brazil China India Thailand

11
Australian cane & sugar yield
Australian cane crushed
Productivity
Productivity
Following a couple of seasons of relatively static production, cane production increased by 5% in 2014 and is forecast to
continue to steadily increase towards the industry goal of 36Mt. Area harvested has steadily increased after the impact of
weather in 2010 and timber plantation land returning to cane.
Source: Australian Sugar Milling Council.
SRA’s breeding program focusses on delivering the best economic value from both Commercial Cane Sugar (CCS) and cane yield.
Source: Australian Sugar Milling Council; Australian Sugar Year Book, Rural Press Ltd, Brisbane.
77.3
88.9
96.0
90.2
88.1
87.2
82.9
90.6
76.4
83.3
82.3
85.7
12.3 12.4
13.0
15.1
11.9 12.3
12.1 12.1
10.1
11.8 11.8 12.0
7.0
8.0
9.0
10.0
11.0
12.0
13.0
14.0
15.0
16.0
2003
2004
2005
2006
2007
2008
2009
2010
2011
2012
2013
2014
70.0
75.0
80.0
85.0
90.0
95.0
100.0
Suga
r yie
ld (t
/ha)
Can
e yi
eld
(t/ha
)
Cane and sugar yield
Cane yield (t/ha) Sugar yield (t/ha)
33.0
37.0
38.3
35.8
34.2
32.1
29.8
27.4
27.9
30.0
30.5
32.4
427,565
416,789
398,856 396,508 387,824
368,151 359,663
302,878
365,886 360,044
371,066 377,422
250,000
300,000
350,000
400,000
450,000
25
30
35
40
45
2003
2004
2005
2006
2007
2008
2009
2010
2011
2012
2013
2014
Are
a ha
rves
ted
(ha)
Can
e cr
ushe
d (M
t)
Cane crushed (Mt) and area harvested (ha)
Cane crushed (Mt) Area harvested (ha)

Breeding efficiency
Rate of genetic gain
12
Varieties & plant breeding
Varieties & plant breeding
The time taken for a variety to be released is one measure of breeding efficiency. The benchmark standard used is 12 years
(yellow line). This is a balance between releasing a new variety for industry to test commercially and accumulating trial
performance data. The average time to release is 12.5 years (red line). No new varieties were released in 2014 as the industry
Variety Approval Committees held over decisions until 2015 to await additional data to inform decisions. The paucity also
reflects the 2007-09 culling of much of the selection program because of smut susceptibility. Source: SRA.
The rate of genetic gain is based on a 30-year rolling average of measured potential gain in different production traits –
in this case sugar/ha. It is a measure of the ‘health’ of SRA’s breeding program. Continued positive gains (i.e. >0) mean
that the program is becoming more efficient in selecting high-value varieties.
Source: SRA.

New varieties in production (by region)Varieties & plant breeding
New varieties are those that have been released in the previous 7 years. It takes time for these to be bulked-up and used.
The uptake reflects the perceived extra value of the new variety over older varieties. The drop in 2013 was influenced by smut
impacts on varieties and breeding stocks and the move of Q208A and KQ228A to ‘old varieties’.
Source: Mill statistics; SRA.
Trial activity by region 201513 Varieties & plant breeding
The numbers represent the number of clones in each breeding trial stage. The large number of CATs in the Southern region
reflects the SmutBuster program, whilst the Burdekin FATs program reflects the integrated breeding program with Wilmar
Sugar.
Source: SRA.
MaxProp Stage 3
MaxProp Stage 2 MaxProp Stage
2
MaxProp Stage 1
MaxProp Stage 1
MaxProp Stage 1
Accelerated Stage 4
Accelerated Stage 8
Accelerated Stage 2
Accelerated Stage 5
Accelerated Stage 5
FAT Stage 136
FAT Stage 143
FAT Stage 319
FAT Stage 128
FAT Stage 131
FAT Stage 95
CAT Stage 1308
CAT Stage 1987
CAT Stage 1231
CAT Stage 1997
Trial Activity by Region - 2015
Northern
Herbert
Burdekin
Central
Southern
NSW
CAT – Clonal Assessment Trial
FAT – Final Assessment Trial
MaxProp – Maximum Propagation
0
10
20
30
40
50
60
70
80
90
100
2007 2008 2009 2010 2011 2012 2013 2014
% o
f new
var
iety
can
e ha
rves
ted
Percentage of new variety cane harvested - by region
Northern Hebert Burdekin Central Southern NSW
Northern
Herbert
Burdekin
Central
Southern
NSW
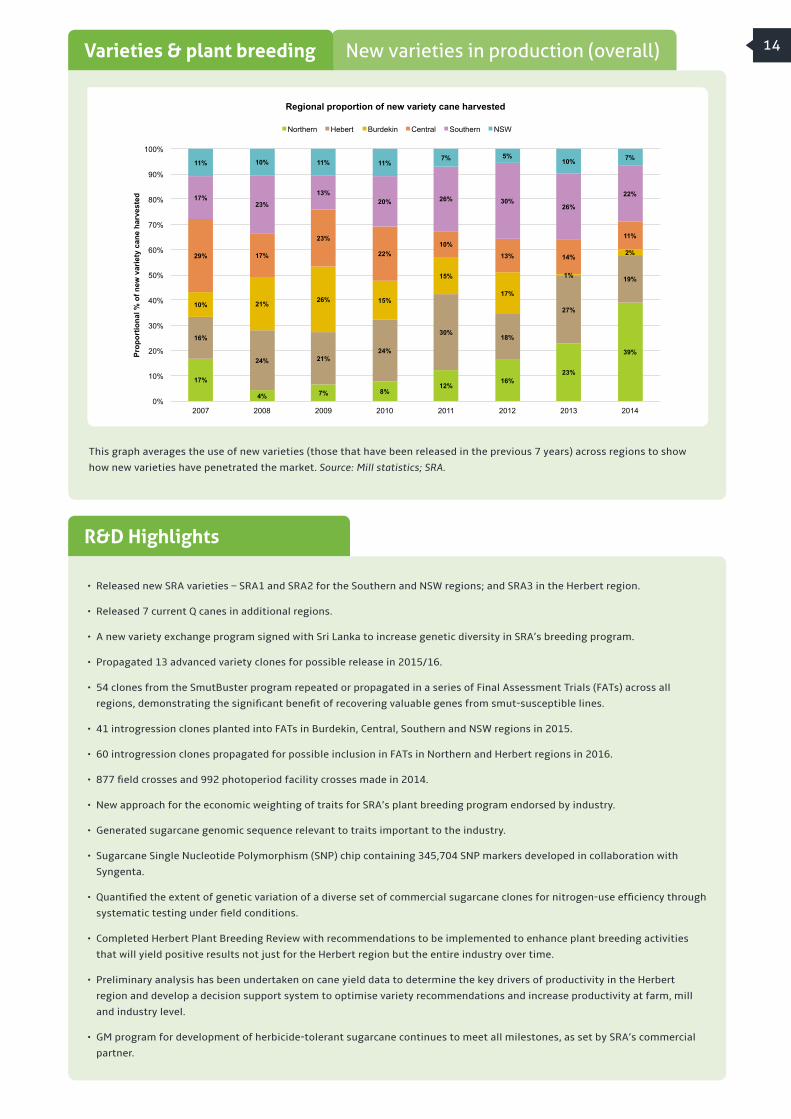
New varieties in production (overall)Varieties & plant breeding
R&D Highlights
This graph averages the use of new varieties (those that have been released in the previous 7 years) across regions to show
how new varieties have penetrated the market. Source: Mill statistics; SRA.
14
• Released new SRA varieties – SRA1 and SRA2 for the Southern and NSW regions; and SRA3 in the Herbert region.
• Released 7 current Q canes in additional regions.
• A new variety exchange program signed with Sri Lanka to increase genetic diversity in SRA’s breeding program.
• Propagated 13 advanced variety clones for possible release in 2015/16.
• 54 clones from the SmutBuster program repeated or propagated in a series of Final Assessment Trials (FATs) across all
regions, demonstrating the significant benefit of recovering valuable genes from smut-susceptible lines.
• 41 introgression clones planted into FATs in Burdekin, Central, Southern and NSW regions in 2015.
• 60 introgression clones propagated for possible inclusion in FATs in Northern and Herbert regions in 2016.
• 877 field crosses and 992 photoperiod facility crosses made in 2014.
• New approach for the economic weighting of traits for SRA’s plant breeding program endorsed by industry.
• Generated sugarcane genomic sequence relevant to traits important to the industry.
• Sugarcane Single Nucleotide Polymorphism (SNP) chip containing 345,704 SNP markers developed in collaboration with
Syngenta.
• Quantified the extent of genetic variation of a diverse set of commercial sugarcane clones for nitrogen-use efficiency through
systematic testing under field conditions.
• Completed Herbert Plant Breeding Review with recommendations to be implemented to enhance plant breeding activities
that will yield positive results not just for the Herbert region but the entire industry over time.
• Preliminary analysis has been undertaken on cane yield data to determine the key drivers of productivity in the Herbert
region and develop a decision support system to optimise variety recommendations and increase productivity at farm, mill
and industry level.
• GM program for development of herbicide-tolerant sugarcane continues to meet all milestones, as set by SRA’s commercial
partner.
17%
4% 7% 8% 12%
16% 23%
39%
16%
24% 21% 24%
30% 18%
27%
19%
10% 21% 26% 15%
15%
17%
1%
2% 29% 17%
23%
22% 10%
13% 14%
11%
17% 23%
13% 20% 26% 30%
26%
22%
11% 10% 11% 11% 7% 5%
10% 7%
0%
10%
20%
30%
40%
50%
60%
70%
80%
90%
100%
2007 2008 2009 2010 2011 2012 2013 2014
Prop
ortio
nal %
of n
ew v
arie
ty c
ane
harv
este
d
Regional proportion of new variety cane harvested
Northern Hebert Burdekin Central Southern NSW

New varieties pachymetra root rot ratingsPest & disease management
Most varieties now grown have at least intermediate resistance to pachymetra root rot. Moving the mix to even more
resistance is a priority in the SRA breeding program. Complementing SRA’s breeding program is the increasing use by industry
of SRA’s diagnostic services, with a 69% increase in testing since SRA’s establishment. Source: Mill statistics; SRA.
New varieties smut disease ratings15 Pest & disease management
There has been an almost complete replacement of smut-susceptible varieties with intermediate-resistant varieties since
smut was found in 2006.
Source: Mill statistics; SRA.
44.1%
67.2%
27.4%
5.7%
42.6% 3.3%
1.7%
0.7%
7.4%
10.8%
4.5%
2.6%
0.3%
9.7%
29.3%
52.4%
5.5% 9.0%
37.1% 38.7%
0%
10%
20%
30%
40%
50%
60%
70%
80%
90%
100% 20
00
2001
2002
2003
2004
2005
2006
2007
2008
2009
2010
2011
2012
2013
2014
Rat
ing
(%)
QLD & NSW smut ratings 2000 - 2014
Unknown Susceptible Intermediate - Susceptible Intermediate Intermediate - Resistant Resistant
8.5% 17.8%
9.0% 1.7%
52.5%
14.5%
4.7%
1.3%
5.8%
7.8%
56.0% 70.5%
16.1%
16.2%
5.7% 1.5%
17.1%
43.7%
24.5% 25.1%
0%
10%
20%
30%
40%
50%
60%
70%
80%
90%
100%
2000
2001
2002
2003
2004
2005
2006
2007
2008
2009
2010
2011
2012
2013
2014
Rat
ing
(%)
QLD & NSW pachymetra ratings 2000 - 2014
Unknown Susceptible Intermediate - Susceptible Intermediate Intermediate - Resistant Resistant

R&D Highlights 16
• Sugarcane metabolome and transcriptome databases developed for YCS research.
• In collaboration with Crop Care Australia, suSCon® maxi Intel has been registered for control of common cane grub species.
• Satellite imagery is being used to detect the extent of cane grub damage in a region, allowing risk maps to be developed to
enable growers to improve their management decisions. SRA’s validation work yielded overall damage detection accuracies
of at least 90%.
• Advanced introgression clones with high levels of resistance to pachymetra root rot and nematodes have been identified and
are being used as parents to introduce new sources of resistance to these diseases.
• Next-generation DNA sequencing has been used to identify a protozoan that is consistently associated with chlorotic streak.
• Assessment of the performance of new leaf sheath biopsy DNA diagnostic for ratoon stunting disease is progressing.
• Resistance ratings for important Australian germplasm and varieties against exotic borers, Downy Mildew and Ramu Stunt
disease have been identified and developed to improve industry preparedness against the incursion of exotic disease threats.
• An electronic nose, named DiagNose, classified 86% of ratoon stunting disease infected samples correctly at the CSIRO
laboratory in Canberra. It will be developed in Southern Queensland later in 2015 to validate results under field conditions.
This testing method, if successful, will give faster turn-around time and lower running costs than alternative detection
systems.
• Up-to-date dossiers have been prepared to support contingency plans to minimise threats and impacts of key exotics as well
as awareness and training programs.

SRA information, products & services17 Engagement
SRA provided the following information products, services and extension activities during 2014/15:
• MillingMatters magazine.
• 6 milling webinars showcasing advances in milling research and technology, including wet scrubbers; evaporators;
locomotive GPS; and traffic officer operations.
• Regional milling research seminars.
• 8 practical guides or manuals, including: regional Variety Guides; Soil Guides; Harvesting Manual; Irrigation Manual;
and High-Yielding Cane Booklet.
• 4 editions of CaneConnection.
• Regular email and on-line SRA Updates highlighting recent SRA activities and R&D developments.
• Regional grower updates, SRA industry updates and SRA Board meetings.
• Regional YCS updates.
• Regional harvesting forums.
• 8 regional field walks and bus tours.
• Workshops, including: Soil Health; High-yielding Cane; Sugar Advisors; Herbicide Application and Technology; and
Introductory and Advanced Disease and Identification Workshops.
• Sponsorship of industry conferences, including: Young Industry Participants’ Forum; Step-Up Conference; Women in Sugar
Conference; Australian Society of Sugarcane Technologists (ASSCT) Conference; and Canetrends Bundaberg.
Approximately 50% of growers have attended SRA updates, field days, workshops or conferences to gain information on
developments in research, technology and best management practices.
61% of growers use QCANESelect at least once per year, with usage more widespread in the Herbert and Burdekin regions –
providing growers with an on-line variety identification and decision-making tool.
63% of growers are using SIX EASY STEPS™ to calculate their fertiliser use – enabling growers to appropriately optimise their
nutrient inputs whilst enhancing environmental outcomes.
74% of growers have accessed SRA factsheets to learn more about industry issues and recommended management practices.
SRA management and Board regularly attended industry representative bodies’ Board meetings.
In response to industry concerns with respect to extension services, SRA instigated a review of its extension and adoption
model in 2014/15 and will continue to work with levy payers and extension service providers to facilitate an extension
framework that will ensure appropriate research and adoption pathways are established across all regions.
SRA’s Development and Adoption Officers will continue to strengthen relationships with industry Productivity Services
organisations and regional grower groups to facilitate the transfer of research knowledge and outcomes to growers and millers.
SRA will continue to plan and collaborate with industry advisors and extension officers on the communication, demonstration
and promotion of new technology and research outputs that will benefit the industry.
Source: SRA; SRA Grower Survey June 2015.
Satisfaction with SRA information, products & servicesEngagement
Satisfaction with the type, quality and usefulness of SRA’s RD&E information products and services was rated, on average,
3.6 out of a possible 5 points.
SRA’s updates, field days, workshops and conferences were rated at 3.8 points and SRA’s technical manuals and online tools
were rated at 3.7 points.
Source: SRA; SRA Grower Survey June 2015.

Practice change: SRA grower survey results
Main areas of practice change
Adoption
Adoption
58% of the 400 growers surveyed by SRA have reported to have changed farming practices, techniques or methods over the
past 2 years.
In addition to SRA, growers identified neighbours, family, other growers, own experience and trials as the other key influences
of practice change.
Among respondents not making changes over the past 2 years, satisfaction with the status quo and/or availability of financial
resources to change were given as the reasons or barriers to change.
Source: SRA Grower Survey June 2015.
The main areas of practice change relate to the application and management of fertiliser, herbicide, pesticides and other
chemicals. The ‘Other practice change’ includes new or upgraded machinery, row spacing, improved soil health, irrigation
upgrades and adoption of precision agriculture.
Source: SRA Grower Survey June 2015.
18
SRA influenced practice change Total
Region
Southern Central NSW Herbert Burdekin Northern
Changed farming practices over past 2 years 58% 53% 54% 43% 72% 65% 58%
SRA influenced practice change 40% 31% 36% 37% 52% 53% 40%
20%
17%
14%
10%
8%
6%
25%
0%
5%
10%
15%
20%
25%
30%
,Changed fer2liser applica2on or management
AUsed chemicals, sprays, herbicides or pes2cides more
efficiently
5Changed to or increased reduced 2llage or no 2llage
AAdopted controlled traffic using GPS and/or matched wheel spacing
WImplemented different crop rota2ons, planted alternate crops
or changed use of legumes
,Purchased or upgraded equipment or machinery
Other prac2ce change
% of survey respondents adop2ng prac2ce change
Prac%ce Change Adop%on Over the Last 2 Years

19
• Preliminary results of an SRA-led study in the Herbert region indicate growers who have adopted new farming management
practices and technology have significantly higher cane and sugar yields than those growers who continue to use traditional
management methods:
• Results from SRA’s Grower Survey show:
- 55% of growers now grow legume fallow crops (most widespread in NSW (87%) and Southern (76%) regions), with 75% of
these growers having reduced applications of nitrogen as a result;
- 56% of growers now apply mill mud with a resulting reduction of around 75% in the application of phosphate and nitrogen;
- Tillage has been reduced on 76% of cane farms over the last 5 years; and
- 57% of growers have at least 1 piece of machinery enabled with GPS or autosteer, providing growers with accurate planting,
fertilising and harvesting capability that minimises soil compaction and environmental impact, reduces wastage of
fertilisers or pesticides and provides data to inform on-farm management decisions.
• A 37% increase in tissue culture ordered for delivery between 2014 and 2015 demonstrates the increasing adoption
of tissue culture plants as a way to propagate clean seed. Tissue-cultured plantings are more uniform and produce more
sticks than conventional plantings so larger quantities of planting material are achieved. Earlier commercial-scale
production of more productive new varieties can be achieved when using tissue culture.
Source: SRA.
• During 2014/15, SRA commissioned a number of reviews and cost-benefit analyses for specific RD&E programs and projects.
• The reviews were undertaken to assess the progress, effectiveness and impact of the relevant RD&E projects so that SRA
can demonstrate to levy payers and government investors that the research investments made by SRA are delivering valued
impacts. The reviews also inform SRA management and Board regarding performance from past investments and provide
strategic guidance and an agreed roadmap for future allocation of RD&E investments. It should be noted that the reviews
included investments made before SRA existed and, as such, total funding assessment includes that from SRDC and BSES.
• Cost-benefit analyses were undertaken on four projects that were completed in 2013/14:
- New Farming Systems: Appropriate Nutrient Management;
- Best Practice Integrated Weed Management (IWM) for Sugarcane;
- Biomass Accumulation; and
- Harvesting Best Practice (HBP).
• Cost-benefit analyses were also completed on two mid-term projects:
- A Collaborative Approach to Precision Agriculture RD&E for the Australian Sugar Industry; and
- Preparing the Australian Sugar Industry for Exotic Threats.
• As detailed in the table to the right, five of the six projects analysed yielded positive returns on investment, with
Benefit-Cost Ratios (BCRs) ranging from 2.3 to 27.4 for the total investment in each project at the 30 year benefit horizon.
At an aggregated level, the six projects assessed produced a BCR of 4 to 1.
• The investment in HBP was the highest performing in terms of return to investment, due in the main to a combination of
the high proportion of the industry assumed to be adopting HBP, the high yield savings that could be gained and the relative
low cost of the project (compared to the other five projects assessed).
• The Biomass Accumulation project generated a BCR of 0 to 1 as it did not produce any impacts that could be valued. This
reflects the nature of the project outputs being knowledge generation that may inform future biomass work and, as such,
are difficult to assess in terms of future impact or value.
Impact of practice change: examples
Cost-benefit analyses
Adoption
Return on investment
New technology adopters Traditional management
t/ha CCS t/ha CCS
Plant crop (includes plough out replant) 92.7 12.7 86.6 12.1
First ratoon crop 87.0 11.6 80.2 10.7

20
BCR: Benefit-Cost Ratio is the ratio of present value of investment benefits to the present value of investment costs.
NPV: Net Present Value is the discounted value of the benefits of an investment less the discounted value of the costs,
i.e. present value of benefits – present value of costs.
• The specific RD&E project impacts that contributed to the positive return on investment include:
- New Farming Systems: Appropriate Nutrient Management: Increasing best practice for nutrient management, through
reductions in nitrogen and phosphate fertiliser applications under specific conditions, resulting in lower export of nutrient
to the environment and increasing profits for growers.
- Best Practice IWM: Improvements towards weed control in the sugarcane industry, increasing profitability from improved
nutgrass control, reductions in the use and costs of pre-emergent sprays to control weeds in green cane trash blanketing,
and potentially lowering the industry’s risk of environmental damage in the future.
- Biomass Accumulation: Cost-savings in future if biomass is pursued as an industry priority, and input into improved
decisions about whether to pursue biomass opportunities in the future.
- HBP: Reduction of in-field cane losses with an estimated average increase in cane recovery of 4 tonnes per hectare,
increasing net revenue for sugar cane millers and growers. Whilst this project yields a high return on investment, it is
recognised that the potential returns to industry will only be realised if HBP becomes widely-adopted across the industry.
To this end, HBP is a key impact area for SRA and will receive increased focus and investment during 2015/16 to assist
industry in understanding the benefits that HBP delivers.
- A Collaborative Approach to Precision Agriculture RD&E: Significant contributions towards zonal management
interventions, potentially increasing growers’ profits through reductions in the amounts of soil amendments, fertiliser
and chemicals required.
- Preparing the Australian Sugar Industry for Exotic Threats: Reduction in yield losses through faster diagnostic tests,
allowing for faster responses to incursions through improved information regarding varietal resistance, ultimately
limiting spread and better management of pest/diseases.
• In addition to the project-specific cost-benefit reviews that were undertaken, SRA commissioned the following three
program reviews:
- A review of the SRA investment in molecular breeding and marker discovery for implementation in the breeding program;
- Profit-based measures to capture, evaluate and prioritise genetic improvement of water efficiency and nitrogen-use
efficiency in sugarcane; and
- Review of precision agriculture in sugarcane in Australia.
• A further review of nitrogen-use efficiency in sugarcane was brokered by SRA on behalf of the Commonwealth Government
through funding from the Australian Government Reef Programme.
• When the reviews are completed, SRA will assess the recommendations and gain industry opinion prior to using review
outcomes for future RD&E planning and investment.
• SRA will continue to undertake regular reviews and cost-benefit evaluations at RD&E program and project levels.
The outcomes of these reviews will be reported on in future SRA Performance Reports.
Source: SRA; Economic Assessment of SRA Investment in Six RD&E Projects – Final Report, Agtrans Research, June 2015.
Project
Years from last year of investment
0 10 20 30
BCR NPV ($m) BCR NPV ($m) BCR NPV ($m) BCR NPV ($m)
New Farming Systems: Appropriate
Nutrient Management0.21 -2.71 1.39 1.34 1.96 3.29 2.31 4.48
Best Practice IWM for Sugarcane 0.05 -3.76 1.81 3.23 3.08 8.24 3.85 11.31
Biomass Accumulation 0 -0.29 0 -0.29 0 -0.29 0 -0.29
HBP 0.53 -0.25 13.03 6.31 21.93 10.99 27.40 13.86
A Collaborative Approach to
Precision Agriculture0 -3.53 0.67 -1.17 1.92 3.26 2.70 6.01
Preparing the Australian Sugar
Industry for Exotic Threats0 -1.94 1.82 1.58 3.56 4.95 3.56 4.95

21
Perception of new varietiesPerception of value
SRA RD&E Performance rating
93% of survey respondents planted a new variety in 2014 (i.e. planted a variety that was released in the previous seven years).
New varieties achieved a higher rating from growers for mid-season sugar than for early or late sugar. Ratings for smut
resistance are high but significantly lower for pachymetra. Soil type suitability is rated higher in some regions than others.
82% of growers surveyed indicated SRA’s primary area of focus should be on varieties.
Source: SRA Grower Survey June 2015.
Two-thirds of growers surveyed rated SRA fairly-high to very-high in terms of their perception of value/influence of SRA
information, tools, products and services. The main reasons provided were SRA’s work into new varieties and R&D generally,
as well as delivering information and products back to industry.
Source: SRA Grower Survey June 2015.
SRA performance rating Total
Region
Southern Central NSW Herbert Burdekin Northern
High 66% 62% 63% 67% 67% 67% 70%
Not high 27% 22% 33% 27% 28% 21% 25%
36%
19% 28%
23% 28% 29%
47%
63% 53%
70% 49%
61%
0%
10%
20%
30%
40%
50%
60%
70%
80%
90%
100%
Early season sugar Mid-‐season sugar Late season sugar Disease risk for Smut Disease risk for Pachymetra
Soil type suitability
Perc
enta
ge o
f sur
vey
resp
onde
nts
New varie)es grower ra)ng
Net Low Net High
Sugar Research Australia Limited Performance Report 2014–15

22
Appendix 1: Acronyms
Abbreviation In full
ABARES Australian Bureau of Agricultural and Research Economics
ACFA Australian Cane Farmers Association
BCR Benefit Cost Ratio
BMP Best Management Practice
CAT Clonal Assessment Trial
CCS Commercial Cane Sugar
DNA Deoxyribonucleic Acid
EHP Department of Environment and Heritage Protection (Queensland)
FAT Final Assessment Trial
GM Genetically Modified
GPS Global Positioning System
ha Hectares
HBP Harvesting Best Practice
HT Herbicide Tolerant
IWM Integrated Weed Management
KFAs Key Focus Areas
m Million
Mt Million tonnes
NPV Net Present Value
NSW New South Wales
QLD Queensland
R&D Research and Development
RD&E Research, Development and Extension
SNP Single Nucleotide Polymorphism
SRA Sugar Research Australia Limited
SRDC Sugar Research Development Corporation
t Tonnes
TCH Tonnes of Cane per Hectare
TSH Tonnes of Sugar per Hectare
YCS Yellow Canopy Syndrome

23Appendix 2: 2013/14-2017/18 Strategic Plan Summary
Delivering valued solutions for a growing Australian sugar industryOur
vi
sion
Our
pu
rpos
e
Undertaking targeted RD&E programs for the sugar industry
Our
key
fo
cus
area
sO
ur o
bjec
tive
sO
ur d
eliv
erab
les
Our
mea
sure
s of
suc
cess
1. Optimally-adapted varieties, plant breeding and release
2. Soil health and nutrient management
3. Pest, disease and weed management
4. Farming systems and production management
• World-class variety development.
• Enhanced variety breeding, selection and release.
• Collaborative, interdisciplinary and systems approach to RD&E.
• Locally-adapted cane varieties.
• Enhanced collaboration with growers, millers and productivity services groups.
• Increased regional trials and releases.
• Earlier communication and dissemination of information, including variety selection tools.
• Diagnostic and advisory services.
• Research collaborations.
• 3 varieties which meet the above expectations released per 5-year period for each region.
• Percent production from new varieties (<7 years since release).
• Rate of genetic gain (tonnes of cane per hectare (TCH), commercial cane sugar (CCS), tonnes of sugar per hectare (TSH)).
• Weighted average disease ratings for varieties in each region.
• Understood and improved soil health issues.
• Understood impacts of on-farm practices on water quality.
• Improved methods and tools to enable, or improve, cane production on poor performing or marginal soils.
• Identification of soil health factors. This will include R&D covering crop nutrition; soil biology; soil fertility; regional soil factors; chemical utilisation; and reduction of soil pathogens and nematodes.
• Practices to reduce chemical inputs and nutrient losses.
• Review of Six Easy Steps TM.
• Rapid soil screening technologies.
• Soil health indicators developed for sustainable sugarcane production.
• Guidelines, mechanisms and/or varieties identified for increasing nutrient use-efficiency within plant and ratoon crops.
• Guidelines and mechanisms developed for minimising chemical and nutrient losses and understanding water quality.
• SIX EASY STEPSTM nutrient management program reviewed with improvements made where necessary.
• Guidelines for implementation of PA developed.
• Enhanced biosecurity capability.
• Minimised economic and environmental impacts of pests, diseases and weeds through targeted research.
• Plant and molecular screening.
• Integrated pest and weed management systems.
• Pest and weed control strategies and technologies.
• Herbicide-resistant cane varieties.
• Alternative chemical treatments.
• Updated management dossiers on key exotic threats.
• Industry supported through effective pest, disease and weed diagnostic capabilities and awareness and training programs.
• Development and adoption of SRA-developed packages for integrated management of key pests, diseases and weeds.
• Weighted average disease ratings for varieties in each region.
• Up-to-date dossiers to support contingency plans to minimise threats and impacts of key exotics.
• Capability to provide entomology, pathology and weed expertise to meet the pest, disease and weed diagnostic and management needs of the industry.
• Research leading to the optimal use of inputs on-farm.
• Research on planting technologies, ratoonability, break-crop and fallow practices to optimise yields.
• Practical application of the value chain model to enhance grower, harvester and miller interfaces and improved adoption of harvesting best-practices.
• Precision-agriculture techniques and resources.
• Best-practice information.
• Improved planting technology and crop establishment.
• Harvesting best-practice regional trials and demonstration.
• Methodology for more rapid and efficient bulking of sugarcane varieties.
• Adoption of a better sugarcane planting technology.
• Improved crop performance over longer cropping cycles.
• Better crop management under conditions of water stress (too much and too little).
• Adoption of PA technology and techniques.
• Adoption of harvesting best-practice.
Indu
stry
ben
efits
• Increased cane and sugar yields.• Climate tolerant varieties.• Pest and disease resistance.• Reduced inputs.• Improved ratoonability.• Increased regional trials and
releases.• Faster varietal adoption.
• Improved soil health.
• Reduced impact of off-farm run-off.
• Improved production on marginal soils.
• Improved reputation and relationship with community and environmental groups.
• Enhanced capacity to deal with incursions of exotic pests, diseases and weeds.
• Minimised economic and environmental impacts.
• Adoption of agronomic and harvesting best-practices.
• Optimised yields.
• Optimised use of inputs.
• Reduced operational costs.

24
Our
val
ues
Investor satisfaction
Accountability
Innovation
Teamwork
Through adaptability, creativity and goal orientation
Through strategic alignment, active communication and commitment
Through personal accountability, including health and safety, honesty, active communication and integrity
Through shared goals, cooperation and trust
Our
key
fo
cus
area
sO
ur o
bjec
tive
sO
ur d
eliv
erab
les
Our
mea
sure
s of
suc
cess
Indu
stry
ben
efits
5. Milling efficiency and technology
6. Product diversification and value addition
7. Knowledge and technology transfer and adoption
8. Capability development, attraction and retention
• Review of logistics management to reduce operational costs and improve mill capacity utilisation.
• New or improved processes, technology and/or infrastructure to increase mill processing efficiency.
• Possible solutions to address quality issues.
• Optimised milling processes and technology.
• Adoption of improved or novel milling processes and technology.
• Ongoing research to identify and/or develop alternative products or uses for sugarcane and determine the basic requirements for adoption.
• Economic feasibility studies of identified industry by-products, their use and likely market viability.
• Industry supply chain analysis.
• Exploration of alternative processing options and products.
• Feasibility analysis of alternative products.
• Sugar industry supply chain analysis completed.
• Identification of new opportunities in product diversification and innovation.
• Coordinated extension that optimises innovation and adoption at the farm level and encourages research that meets the needs of the industry.
• Inclusion of extension mechanisms in research proposals.
• Enhanced communication and transfer tools to disseminate research findings to end-users and facilitate their uptake by growers and millers.
• Assessment of the uptake of developed technologies and evaluate the effectiveness of technology transfer tools.
• Translational research approach.
• Collaborative extension.
• Enhanced research and technology extension.
• Multi-media extension.
• Joint planning of research translation and extension programs with other stakeholders.
• Effective delivery of extension messages, as demonstrated through research uptake.
• Increased awareness of technological innovations, locally and internationally.
• Research outputs’ key RD&E messages are promoted in a timely manner through various channels.
• Increased support for and participation in SRA delivery networks, events and extension programs.
• Review of current and future RD&E skills and capacity needs for the sugarcane industry.
• Development and retention of current industry participants, as well as attraction of new participants to the sugarcane industry.
• Fostered collaboration for cross-industry and cross-sectoral skill development, innovation and networks.
• Industry RD&E skills and capability assessment.
• Scholarship program.
• Participative and collaborative partnerships.
• Succession planning.
• Performance management framework.
• Published results of industry RD&E skills and capability assessment and recommended strategies in National Sugarcane Industry RD&E Strategy.
• SRA participation and investment in relevant collaborative and cross-sectoral RD&E programs.
• Increased availability of skilled industry personnel.
• SRA sponsored Young Industry Participants’ Forum held annually.
• Development and uptake of new and existing knowledge transfer or training programs or resources.
• Scholarships awarded to current and future industry participants.
• Improved mill capacity utilisation.
• Improved mill processing efficiency.
• Improved quality.
• Optimised mill transport and logistics.
• Alternative products or uses for sugarcane.
• Economic feasibility of industry by-products.
• Skilled advisory sector that drives the adoption of new technology and practices.
• Improved collaboration and coordination of extension services.
• Improved communication, knowledge transfer and adoption.
• Attraction and retention of industry participants.
• Highly-skilled industry workforce.
• Cross-industry and cross-sectoral collaboration.
• Connected and respected.

Sugar Research Australia Limited
ABN 16 163 670 068
Head Office
50 Meiers Road
Indooroopilly QLD 4068
Australia
Postal Address
PO Box 86
Indooroopilly QLD 4068
Australia
Tel 07 3331 3333
Fax 07 3871 0383
Email [email protected]
Web sugarresearch.com.au