sr-12-05 functional approach to riparian restoration · a functional approach to riparian...
TRANSCRIPT

1
A functional approach to riparian restoration in Austin, Texas
Alex Duncan Water Resource Evaluation Environmental Resource Management Division Watershed Protection Department City of Austin
SR 12-05 January 17, 2012
Abstract
Introduction Riparian zones are dynamic systems that reflect the abiotic and biotic conditions of their watersheds. Hydrology, especially in the arid southwest, is the primary driving force dictating the vegetation community and ecosystem services provide by riparian systems (Richardson et al. 2007). Availability of water is the major limiting factor, particularly for woody riparian species, where by extended drought and flow modification related to impoundments, diversions, or groundwater pumping can lead to tree mortality (Richardson et al. 2007). Altered hydrological regimes have been shown to
A new functional paradigm is emerging in restoration ecology where focusing on ecosystem processes at both the local and landscape level is replacing natural species preservation. In an increasingly urbanized world, where human modified ecosystems are emerging to contain new species assemblages never before encountered, it becomes imperative to understand both the past and future successional patterns of these newly created “novel” systems. In order to guide riparian restoration in a growing urban center the City of Austin combined current literature reviews and successional theory with local vegetative knowledge to produce a theoretical framework for urban riparian restoration. Methods of invasion, ecosystem function, indicators of disturbance, and passive and active restoration are discussed. Results suggest that a restored riparian site will have improved water quality and aquatic life, increased cover and structural diversity of floodplain vegetation (native or exotic), a dominant hardwood community, natural soil conditions, a wide and continuous riparian buffer, limited channelization, improved bank stability, and in-stream aquatic habitat. We also demonstrate the advantages of passive restoration and help with identifying sites where spontaneous succession is appropriate. Understanding past disturbance mechanisms will help managers identify appropriate restoration techniques facilitating future succession patterns that promote maximum ecosystem function at the least economic cost.
C:\Documents and Settings\AtkinsT\My Documents\Riparian\Reports\SR-12-05 Functional approach to riparian restoration.doc
2
change riparian community composition, structure, and function, increasing both the encroachment of native (nonriparian) aggressive and non-native woody species (Huddle et al. 2011). Saltcedar stand density, a common exotic species in the southwestern United States, has been shown to increase in reaches where water flow was regulated compared with reaches where water flow was unregulated (Huddle et al. 2011). In Austin, increased urbanization has shifted the hydrology of riparian zones to that of decreased soil moisture and reduced groundwater levels (Sung et al. 2011). This has moved the vegetation in these urbanized riparian zones to one favorable to disturbance-tolerant exotics (Sung et al. 2011). Studies have shown that increased anthropogenic disturbance is associated with high abundance of exotic species (Pennington et al. 2010, Sung et al. 2011). Of the 12 riparian forest surveyed in Austin, plant invasion was most strongly correlated to % impervious cover within that sampling reach (Sung et al. 2011). As urbanization is expected to increase in Austin understanding the mechanisms behind exotic plant invasion becomes increasingly necessary. Methods of Invasion Recent studies have linked anthropogenic modified landscapes with increased exotic invasion potential (Moffatt and McLachlan 2004; Pennington et al. 2010; Sung et al. 2011). The invasion of exotic plant species generally follows passive distribution models whereby invaded communities are primarily structured by non-interactive factors (environmental change, dispersal limitation) that are less constraining on the exotics, which thus dominate. (MacDougall and Turkington 2005; Pennington et al. 2010; Sung et al. 2011). Successful invasion requires significant propagule pressure and beneficial abiotic and biotic conditions (Catford et al. 2009). High propagule pressure can intensify invasion by increasing genetic diversity and the likelihood of being introduced into a favorable environment (Catford et al. 2009). Anthropogenic disturbances can alter the abiotic and biotic conditions of an environment whereby creating novel conditions more appropriate to exotic species establishment (Davis 2009). Identifying the main disturbance driver is critical in determining the success of exotics and the impact on native plant communities (Lake and Leishman 2004). Research has shown that sites without any disturbance do not support exotic species invasion (Lake and Leishman 2004). Understanding the methods behind species invasion and associated impacts to ecosystem function is necessary prior to restoration and management of riparian ecosystems. Managing the environment and not individual species is necessary for effective invasive species control (Davis 2009). It’s important to remember that very few exotic species poses traits that allow them universal performance advantages over co-occurring natives; rather, increased resource availability and altered disturbance regimes associated with human activities increase the performance of invaders over natives (Daehler 2003). Based on 79 independent native-invasive plant comparisons, alien invaders were not statistically more likely to have higher growth rates, competitive ability, or fecundity than natives (Daehler 2003). Maintaining Ecosystem function Riparian systems provide a suite of ecosystem services including, but limited to, stabilized stream banks, clean water, diverse animal assemblages, and groundwater recharge (Richardson et al. 2007). The more degraded an ecosystem, the more fundamentally altered the basic services will become (Hobbs and Cramer 2008). Any change in plant composition will bring about shifts in ecosystem function. Dominant species exert the most influence, and thus the greatest functional changes will occur if the abundance of these species is altered (Richardson et al. 2007). The greater the difference in traits between the previously and currently dominant species (native or exotic), the greater will be the change in function (Richardson et al. 2007). Understanding the main functional goals of the restoration project as well as the trajectory of the dominant vegetation community will help managers decide what strategies to employ. Recent studies have emphasized that restoration efforts should focus on functional aspects of the ecosystem and should incorporate beneficial exotics (Richardson et al. 2007, Hobbs and Cramer 2008, Davis et al. 2011). Sogge
C:\Documents and Settings\AtkinsT\My Documents\Riparian\Reports\SR-12-05 Functional approach to riparian restoration.doc
3
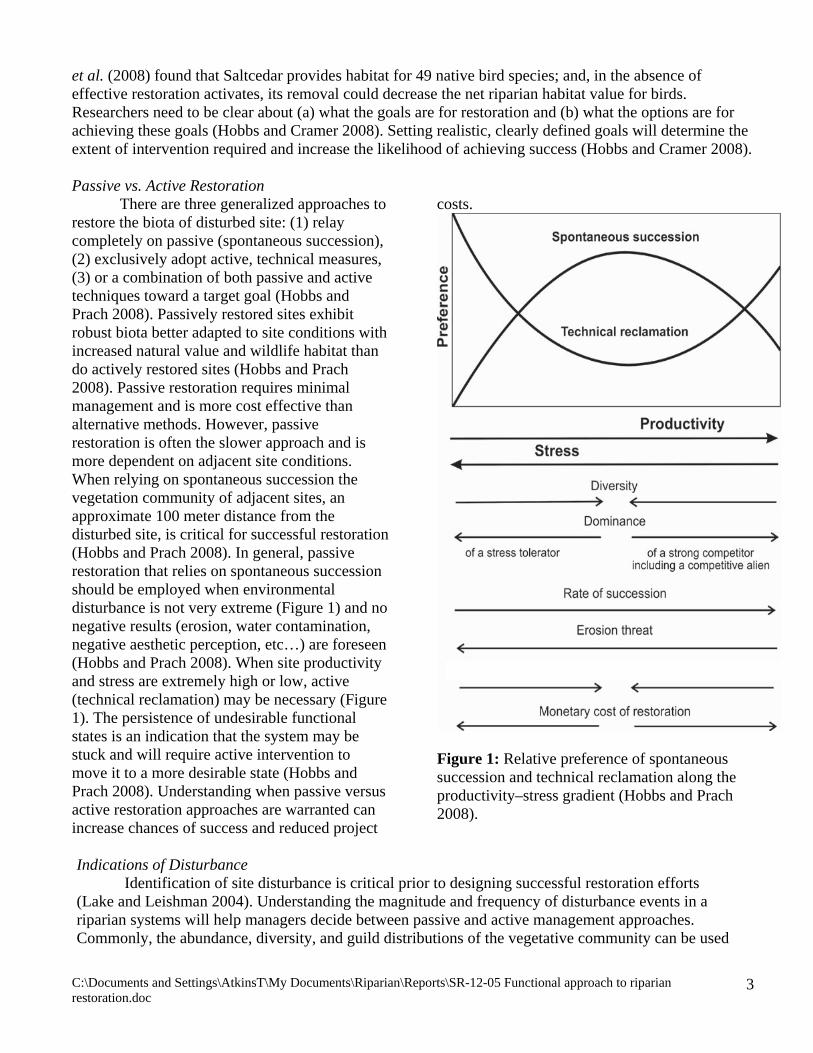
et al. (2008) found that Saltcedar provides habitat for 49 native bird species; and, in the absence of effective restoration activates, its removal could decrease the net riparian habitat value for birds. Researchers need to be clear about (a) what the goals are for restoration and (b) what the options are for achieving these goals (Hobbs and Cramer 2008). Setting realistic, clearly defined goals will determine the extent of intervention required and increase the likelihood of achieving success (Hobbs and Cramer 2008). Passive vs. Active Restoration There are three generalized approaches to restore the biota of disturbed site: (1) relay completely on passive (spontaneous succession), (2) exclusively adopt active, technical measures, (3) or a combination of both passive and active techniques toward a target goal (Hobbs and Prach 2008). Passively restored sites exhibit robust biota better adapted to site conditions with increased natural value and wildlife habitat than do actively restored sites (Hobbs and Prach 2008). Passive restoration requires minimal management and is more cost effective than alternative methods. However, passive restoration is often the slower approach and is more dependent on adjacent site conditions. When relying on spontaneous succession the vegetation community of adjacent sites, an approximate 100 meter distance from the disturbed site, is critical for successful restoration (Hobbs and Prach 2008). In general, passive restoration that relies on spontaneous succession should be employed when environmental disturbance is not very extreme (Figure 1) and no negative results (erosion, water contamination, negative aesthetic perception, etc…) are foreseen (Hobbs and Prach 2008). When site productivity and stress are extremely high or low, active (technical reclamation) may be necessary (Figure 1). The persistence of undesirable functional states is an indication that the system may be stuck and will require active intervention to move it to a more desirable state (Hobbs and Prach 2008). Understanding when passive versus active restoration approaches are warranted can increase chances of success and reduced project
costs.
Figure 1: Relative preference of spontaneous succession and technical reclamation along the productivity–stress gradient (Hobbs and Prach 2008).
Indications of Disturbance Identification of site disturbance is critical prior to designing successful restoration efforts (Lake and Leishman 2004). Understanding the magnitude and frequency of disturbance events in a riparian systems will help managers decide between passive and active management approaches. Commonly, the abundance, diversity, and guild distributions of the vegetative community can be used

C:\Documents and Settings\AtkinsT\My Documents\Riparian\Reports\SR-12-05 Functional approach to riparian restoration.doc
4
as indicators of disturbance. The relative proportion of generalists, opportunistic, and vulnerable plant species can be used to identify a gradient of disturbance (Moffatt and McLachlan 2004). Indicators of disturbed riparian forests are opportunistic plant species negatively correlated to diversity (Moffatt and McLachlan 2004). Whereas indicators of high-integrity riparian forests are vulnerable species positively correlated to overall site diversity (Moffatt and McLachlan 2004). Therefore sites with high overall plant diversity (either native or exotic) can be considered of high-value providing essential ecosystem services (Moffatt and McLachlan 2004, Richardson et al. 2007). Research suggests that ecosystem function declines when species diversity is reduced to very low levels (Richardson et al. 2007). Comparisons between the understory and overstory plant communities can also be of value. The understory (herb) community reflects a habitats current ecological condition, while overstory (tree) communities are reminders of past environmental condition (Woosley et al. 2005). Understanding if significant changes occur between the overstory and understory plant communities will help managers asses which plant species can successfully propagate under current site conditions and identify those species likely to become extirpated in the near future. Recent research by the City of Austin has revealed that relatively small changes in geographic location and drainage area can result in distinct shifts in plant species composition (COA 2011). Understanding these trends as well as which species define a specific region can help managers identify when a restored site has improved functional characteristics or when a degraded site requires some level of restoration (COA 2011). For example, a riparian restoration project on a headwaters stream in the Edwards Plateau region could be deemed to have successfully improved ecosystem function when species such as Trumpet vine, Silktassel, Yaupon holey, Maidenhair fern, etc… (Table 1) have successfully established (reproduced with multiple age classes). When a site can successfully support these defining plant species restoration practitioners can assume some level functional improvement. Conversely, sites where these defining species are absent could be an indication of disturbance and that restoration is needed (COA 2011). Other common indicators of disturbance in urban riparian environments are: (1) land-use and management, (2) soil health, (3) buffer width, (4) water quality, (5) species composition, and (6) hydrology. In Austin increased urbanization (percent impervious cover within the watershed) is related to changes in hydrology resulting in shifts in vegetation composition (Sung et al. 2011). Consequently, a certain level of site disturbance can be assumed in urbanized reaches with high percentage of impervious cover. Management strategies are often the most obvious form of disturbance. Mowing, planting, and tree and brush removal are frequent disturbances in urban riparian systems and must be considered prior to restoration planning. Often altering or removing a management disturbance may set an ecosystem on a successional trajectory towards improved ecosystem function (Kauffman et al. 1999). Modifications to soil quality can result in reduced ecosystem function and species loss. Soil pH, moisture, and compaction have all been shown to be significantly altered in degraded urban riparian environments (Moffatt et al. 2004; Pouyat et al. 2007; Gift et al. 2010). Adequate riparian buffer width has been shown to filter pollutants, control erosion, prevent flooding, and provide habitat and nutrient inputs into the stream (Barbour 1999; Fischer and Fischenich 2000). Riparian zones with minimal buffers will be unable to provide these essential ecosystem functions. Water quality, most often quantified by relative concentrations of nutrients within the stream, can be an indication of site impairment. Sites with impaired water quality often have excessive algae growth and reduced diversity of sensitive aquatic species (Stacey et al. 2006; Mabe 2007; King and Winemiller 2009). Both benthic macroinvertebrate and diatom diversity can be directly impacted by poor water quality (Stacey et al. 2006; King and Winemiller 2009). Overall, there is much evidence supporting the claim that maintaining high ecosystem function over time is enhanced by high local and regional species diversity (Duffy 2009). In riparian ecosystems restoration practitioners should focus on maintaining a diverse assemblage of both aquatic and terrestrial flora and fauna. Increased stream channel entrenchment (incision) can be an indication of altered hydrology of the riparian zone and reduced floodplain connectivity (Rosgen 1994). The Absence of floodplain connectivity lowers the water table, reduces
C:\Documents and Settings\AtkinsT\My Documents\Riparian\Reports\SR-12-05 Functional approach to riparian restoration.doc
5
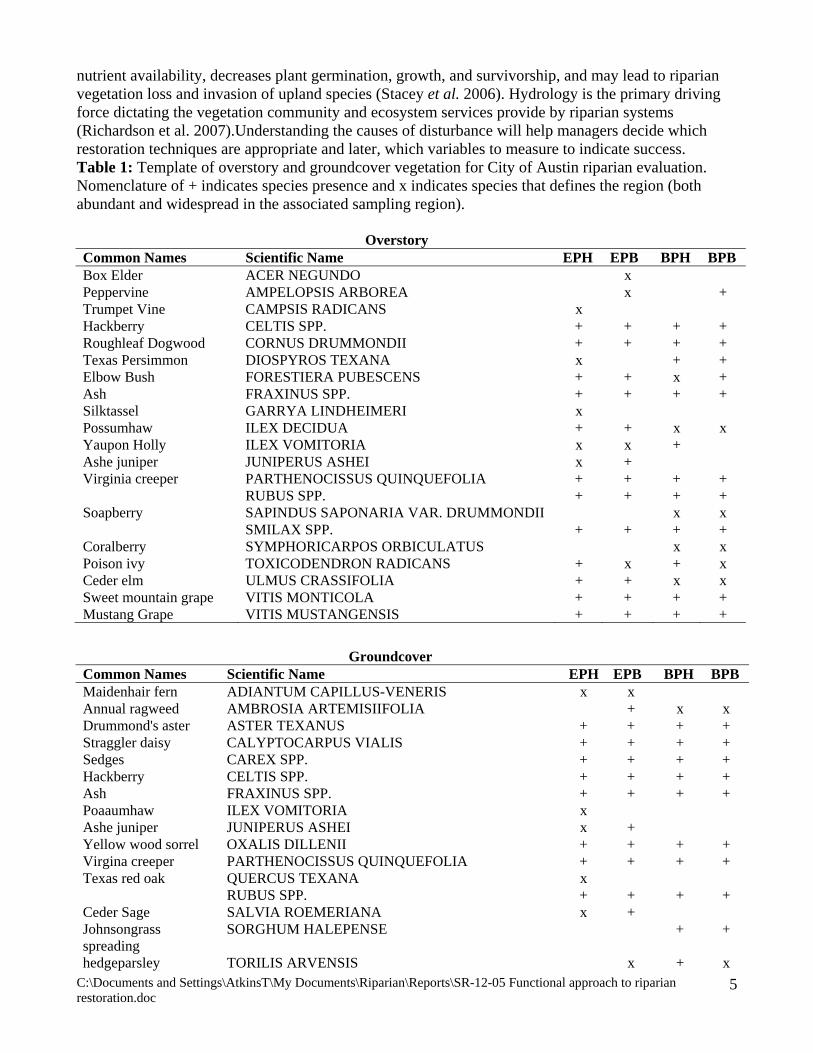
nutrient availability, decreases plant germination, growth, and survivorship, and may lead to riparian vegetation loss and invasion of upland species (Stacey et al. 2006). Hydrology is the primary driving force dictating the vegetation community and ecosystem services provide by riparian systems (Richardson et al. 2007).Understanding the causes of disturbance will help managers decide which restoration techniques are appropriate and later, which variables to measure to indicate success. Table 1: Template of overstory and groundcover vegetation for City of Austin riparian evaluation. Nomenclature of + indicates species presence and x indicates species that defines the region (both abundant and widespread in the associated sampling region). Overstory Common Names Scientific Name EPH EPB BPH BPB Box Elder ACER NEGUNDO x Peppervine AMPELOPSIS ARBOREA x + Trumpet Vine CAMPSIS RADICANS x Hackberry CELTIS SPP. + + + + Roughleaf Dogwood CORNUS DRUMMONDII + + + + Texas Persimmon DIOSPYROS TEXANA x + + Elbow Bush FORESTIERA PUBESCENS + + x + Ash FRAXINUS SPP. + + + + Silktassel GARRYA LINDHEIMERI x Possumhaw ILEX DECIDUA + + x x Yaupon Holly ILEX VOMITORIA x x + Ashe juniper JUNIPERUS ASHEI x + Virginia creeper PARTHENOCISSUS QUINQUEFOLIA + + + + RUBUS SPP. + + + + Soapberry SAPINDUS SAPONARIA VAR. DRUMMONDII x x SMILAX SPP. + + + + Coralberry SYMPHORICARPOS ORBICULATUS x x Poison ivy TOXICODENDRON RADICANS + x + x Ceder elm ULMUS CRASSIFOLIA + + x x Sweet mountain grape VITIS MONTICOLA + + + + Mustang Grape VITIS MUSTANGENSIS + + + +
Groundcover Common Names Scientific Name EPH EPB BPH BPB Maidenhair fern ADIANTUM CAPILLUS-VENERIS x x Annual ragweed AMBROSIA ARTEMISIIFOLIA + x x Drummond's aster ASTER TEXANUS + + + + Straggler daisy CALYPTOCARPUS VIALIS + + + + Sedges CAREX SPP. + + + + Hackberry CELTIS SPP. + + + + Ash FRAXINUS SPP. + + + + Poaaumhaw ILEX VOMITORIA x Ashe juniper JUNIPERUS ASHEI x + Yellow wood sorrel OXALIS DILLENII + + + + Virgina creeper PARTHENOCISSUS QUINQUEFOLIA + + + + Texas red oak QUERCUS TEXANA x RUBUS SPP. + + + + Ceder Sage SALVIA ROEMERIANA x + Johnsongrass SORGHUM HALEPENSE + + spreading hedgeparsley TORILIS ARVENSIS x + x

C:\Documents and Settings\AtkinsT\My Documents\Riparian\Reports\SR-12-05 Functional approach to riparian restoration.doc
6
Ceder elm ULMUS CRASSIFOLIA + + + + White crownbeard VERBESINA VIRGINICA + + + +
Methods and Results By combining current literature with ecological theory the City of Austin has designed a framework for diagnosing and later monitoring the improved ecological function of urban riparian systems following restoration activities. A restored riparian site will have improved water quality and aquatic life, increased cover and structural diversity of floodplain vegetation (native or exotic), a dominant hardwood community, minimal soil disturbance (characterized by soil compaction, moisture and pH), a wide and continuous riparian buffer, limited channelization, improved bank stability, and in-stream aquatic habitat. A complete list of each functional metric chosen and associated justification is presented in (Table 2). Detailed methodology is presented in this section and field sheets are available in appendix I. Table 2: City of Austin metrics for evaluating the functional condition of riparian zones.
Functional Metric Rational Macro-algae cover The percentage of macroalgae cover has been linked to the amount of
nutrients in the water column, type of substrate, and amount of available light at a site (Mabe 2007). Collecting this metric may allow restoration practitioners to monitor several key aspects of riparian function simultaneously.
Diatoms The City of Austin routinely measures and compiles biological integrity data into a single index value. This index combines macroinvertebrate and diatom community structure (COA 2002). Diatoms generally respond more quickly to changes in both their physical and chemical environments than macroinvertebrates and can potentially indicate low level changes in water quality (COA 2002). Specific species of diatoms have been linked to increased nutrients in the water column while other species have been linked to low concentrations of nutrients (King and Winemiller 2009). Community composition metrics will be calculated to help determine aquatic function in the study reach.
Canopy Cover Temperature heterogeneity within the stream channel is associated with increased aquatic species richness and ecosystem function (Woosley et al. 2005). The amount of solar shading provided by adjacent and in stream riparian vegetation is critical for maintain temperature refugia. Decreased streambank vegetation cover, increased channel width, and reduced stream depth increases exposure, raises water temperatures and impacts aquatic life (Stacey et al. 2006).
Plant cover and structural diversity
High cover and structural diversity of vegetation (groundcover, understory, and canopy) indicates a productive plant community, high species diversity, adequate food resources and habitat for wildlife, and reduced flood impacts along banks (Stacey et al. 2006). Structural diversity is often absent in riparian areas that have been heavily damaged by human activities and can result in native wildlife species being extirpated from the area (Stacey et al.
C:\Documents and Settings\AtkinsT\My Documents\Riparian\Reports\SR-12-05 Functional approach to riparian restoration.doc
7
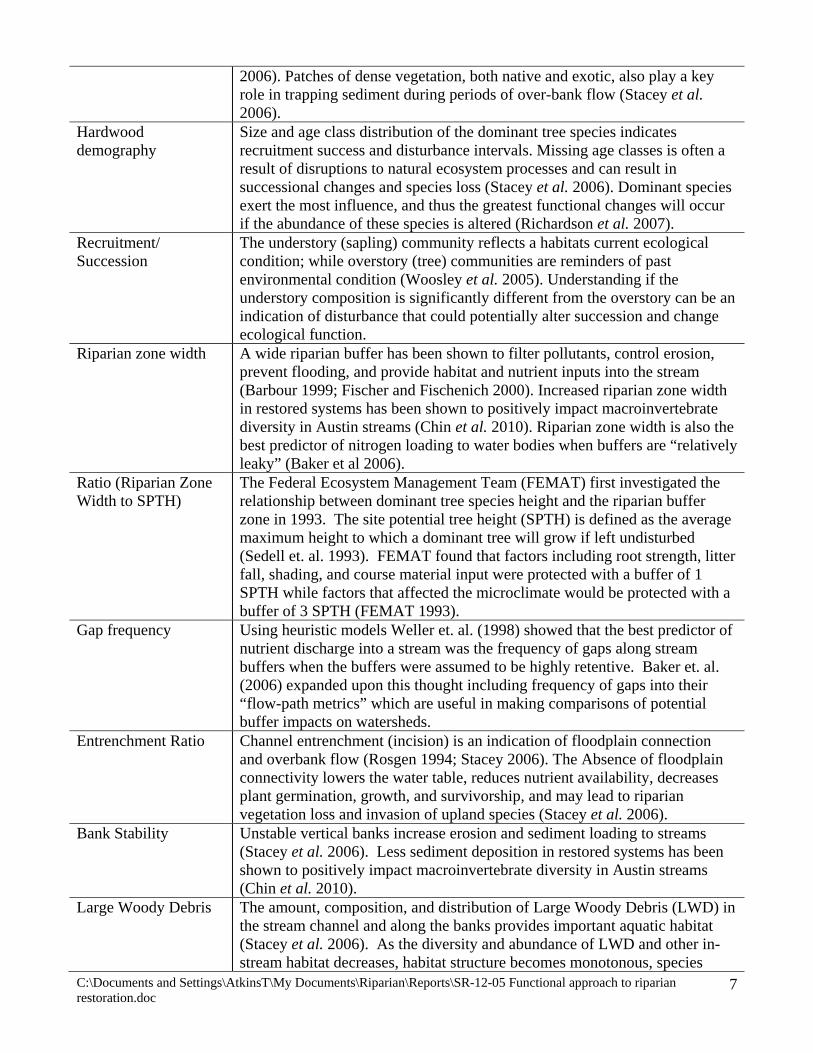
2006). Patches of dense vegetation, both native and exotic, also play a key role in trapping sediment during periods of over-bank flow (Stacey et al. 2006).
Hardwood demography
Size and age class distribution of the dominant tree species indicates recruitment success and disturbance intervals. Missing age classes is often a result of disruptions to natural ecosystem processes and can result in successional changes and species loss (Stacey et al. 2006). Dominant species exert the most influence, and thus the greatest functional changes will occur if the abundance of these species is altered (Richardson et al. 2007).
Recruitment/ Succession
The understory (sapling) community reflects a habitats current ecological condition; while overstory (tree) communities are reminders of past environmental condition (Woosley et al. 2005). Understanding if the understory composition is significantly different from the overstory can be an indication of disturbance that could potentially alter succession and change ecological function.
Riparian zone width A wide riparian buffer has been shown to filter pollutants, control erosion, prevent flooding, and provide habitat and nutrient inputs into the stream (Barbour 1999; Fischer and Fischenich 2000). Increased riparian zone width in restored systems has been shown to positively impact macroinvertebrate diversity in Austin streams (Chin et al. 2010). Riparian zone width is also the best predictor of nitrogen loading to water bodies when buffers are “relatively leaky” (Baker et al 2006).
Ratio (Riparian Zone Width to SPTH)
The Federal Ecosystem Management Team (FEMAT) first investigated the relationship between dominant tree species height and the riparian buffer zone in 1993. The site potential tree height (SPTH) is defined as the average maximum height to which a dominant tree will grow if left undisturbed (Sedell et. al. 1993). FEMAT found that factors including root strength, litter fall, shading, and course material input were protected with a buffer of 1 SPTH while factors that affected the microclimate would be protected with a buffer of 3 SPTH (FEMAT 1993).
Gap frequency Using heuristic models Weller et. al. (1998) showed that the best predictor of nutrient discharge into a stream was the frequency of gaps along stream buffers when the buffers were assumed to be highly retentive. Baker et. al. (2006) expanded upon this thought including frequency of gaps into their “flow-path metrics” which are useful in making comparisons of potential buffer impacts on watersheds.
Entrenchment Ratio Channel entrenchment (incision) is an indication of floodplain connection and overbank flow (Rosgen 1994; Stacey 2006). The Absence of floodplain connectivity lowers the water table, reduces nutrient availability, decreases plant germination, growth, and survivorship, and may lead to riparian vegetation loss and invasion of upland species (Stacey et al. 2006).
Bank Stability Unstable vertical banks increase erosion and sediment loading to streams (Stacey et al. 2006). Less sediment deposition in restored systems has been shown to positively impact macroinvertebrate diversity in Austin streams (Chin et al. 2010).
Large Woody Debris The amount, composition, and distribution of Large Woody Debris (LWD) in the stream channel and along the banks provides important aquatic habitat (Stacey et al. 2006). As the diversity and abundance of LWD and other in-stream habitat decreases, habitat structure becomes monotonous, species
C:\Documents and Settings\AtkinsT\My Documents\Riparian\Reports\SR-12-05 Functional approach to riparian restoration.doc
8
diversity decreases, and potential for recovery following disturbance is reduced (Barbour 1999). Streams with adequate LWD generally have greater habitat diversity, a more natural stream shape, and greater resistance to flood events (Stacey et al. 2006).
Soil Moisture Soil moisture has been shown to be negatively correlated to urban land-use (Moffatt et al. 2004; Gift et al. 2010). Hydrologic changes associated with urbanization often result in lower water tables and drier more aerobic soil conditions (Gift et al. 2010). These changes can result in reduced denitrification and altered plant species composition (Gift et al. 2010; Sung et al. 2011). Increasing soil moisture can improve nutrient cycling and biomass production in riparian systems.
Soil pH pH has been shown to be positively correlated to urbanization in riparian forest systems (Moffatt et al. 2004). Soil pH influences the solubility of nutrients, microbial decomposition, and most chemical transformations in the soil (USDA 1998). Elevated soil pH in urban environments could reduce microbial activity and alter nutrient dynamics (USDA 1998) potentially resulting in shifting plant species composition and reduced ecosystem function.
Soil Compaction Soil compaction or bulk density is one of the most discerning variables separating forest cover from turf grass (Pouyat et al. 2007). Increasing soil compaction can reduce the soil’s ability to function for structural support, water and solute movement, and restrict root growth (USDA 2008). Compaction can result in shallow rooted plants and poor plant growth, reduced vegetative cover, increased erosion, and reduction in water infiltration (USDA 2008). Improvements in soil compaction can be gained by reducing disturbance from vehicle and foot traffic and increasing soil organic matter content (USDA 2008).
Establishing sampling transect The majority of restoration sites within the City of Austin are small, averaging 0.5 stream kilometers or less. Therefore, a 100 meter in stream transect will be sufficient to document functional changes over time. In-stream transects should be selected to capture the range of site conditions that best characterize the restored reach. Transect starting points will be marked by tree tags or associated permanent marker to reference future evaluations. Make sure to denote which direction transect was run (upstream or downstream) on the data sheet (Appendix I). Photographs to illustrate the current conditions at the site should be taken at the upstream and downstream ends of the study reach, at 50 meters looking downstream and upstream, as well as any other location that would be valuable for future comparisons. Detailed Methods In order to complete the survey in a timely manner (2-3 hours), it is recommended that four participants separate into two teams (riparian and in-stream). The methodology chosen to evaluate each functional metric is listed below. The field data worksheets are separated between the riparian and in-stream teams and are available in appendix 1. Macro-algae cover Both macro-algae cover and dominant substrate will be recorded along the 100 meter in stream transect. A total of 50 points will be collected, approximately one sample every 2 meters, using a zig-
C:\Documents and Settings\AtkinsT\My Documents\Riparian\Reports\SR-12-05 Functional approach to riparian restoration.doc
9
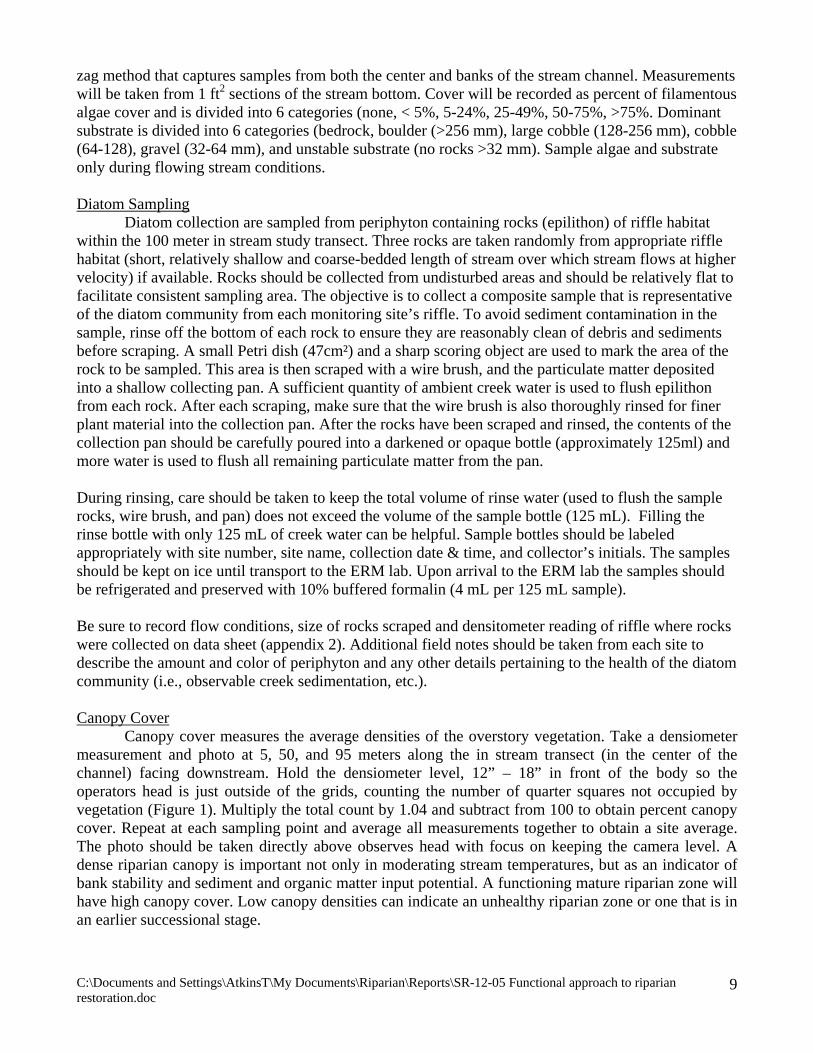
zag method that captures samples from both the center and banks of the stream channel. Measurements will be taken from 1 ft2 sections of the stream bottom. Cover will be recorded as percent of filamentous algae cover and is divided into 6 categories (none, < 5%, 5-24%, 25-49%, 50-75%, >75%. Dominant substrate is divided into 6 categories (bedrock, boulder (>256 mm), large cobble (128-256 mm), cobble (64-128), gravel (32-64 mm), and unstable substrate (no rocks >32 mm). Sample algae and substrate only during flowing stream conditions. Diatom Sampling Diatom collection are sampled from periphyton containing rocks (epilithon) of riffle habitat within the 100 meter in stream study transect. Three rocks are taken randomly from appropriate riffle habitat (short, relatively shallow and coarse-bedded length of stream over which stream flows at higher velocity) if available. Rocks should be collected from undisturbed areas and should be relatively flat to facilitate consistent sampling area. The objective is to collect a composite sample that is representative of the diatom community from each monitoring site’s riffle. To avoid sediment contamination in the sample, rinse off the bottom of each rock to ensure they are reasonably clean of debris and sediments before scraping. A small Petri dish (47cm²) and a sharp scoring object are used to mark the area of the rock to be sampled. This area is then scraped with a wire brush, and the particulate matter deposited into a shallow collecting pan. A sufficient quantity of ambient creek water is used to flush epilithon from each rock. After each scraping, make sure that the wire brush is also thoroughly rinsed for finer plant material into the collection pan. After the rocks have been scraped and rinsed, the contents of the collection pan should be carefully poured into a darkened or opaque bottle (approximately 125ml) and more water is used to flush all remaining particulate matter from the pan. During rinsing, care should be taken to keep the total volume of rinse water (used to flush the sample rocks, wire brush, and pan) does not exceed the volume of the sample bottle (125 mL). Filling the rinse bottle with only 125 mL of creek water can be helpful. Sample bottles should be labeled appropriately with site number, site name, collection date & time, and collector’s initials. The samples should be kept on ice until transport to the ERM lab. Upon arrival to the ERM lab the samples should be refrigerated and preserved with 10% buffered formalin (4 mL per 125 mL sample). Be sure to record flow conditions, size of rocks scraped and densitometer reading of riffle where rocks were collected on data sheet (appendix 2). Additional field notes should be taken from each site to describe the amount and color of periphyton and any other details pertaining to the health of the diatom community (i.e., observable creek sedimentation, etc.). Canopy Cover Canopy cover measures the average densities of the overstory vegetation. Take a densiometer measurement and photo at 5, 50, and 95 meters along the in stream transect (in the center of the channel) facing downstream. Hold the densiometer level, 12” – 18” in front of the body so the operators head is just outside of the grids, counting the number of quarter squares not occupied by vegetation (Figure 1). Multiply the total count by 1.04 and subtract from 100 to obtain percent canopy cover. Repeat at each sampling point and average all measurements together to obtain a site average. The photo should be taken directly above observes head with focus on keeping the camera level. A dense riparian canopy is important not only in moderating stream temperatures, but as an indicator of bank stability and sediment and organic matter input potential. A functioning mature riparian zone will have high canopy cover. Low canopy densities can indicate an unhealthy riparian zone or one that is in an earlier successional stage.
C:\Documents and Settings\AtkinsT\My Documents\Riparian\Reports\SR-12-05 Functional approach to riparian restoration.doc
10
Figure 1: Grid diagram for spherical densiometer. Each box contains four points for potential vegetation cover. If all squares contain vegetation site canopy cover = 100%.
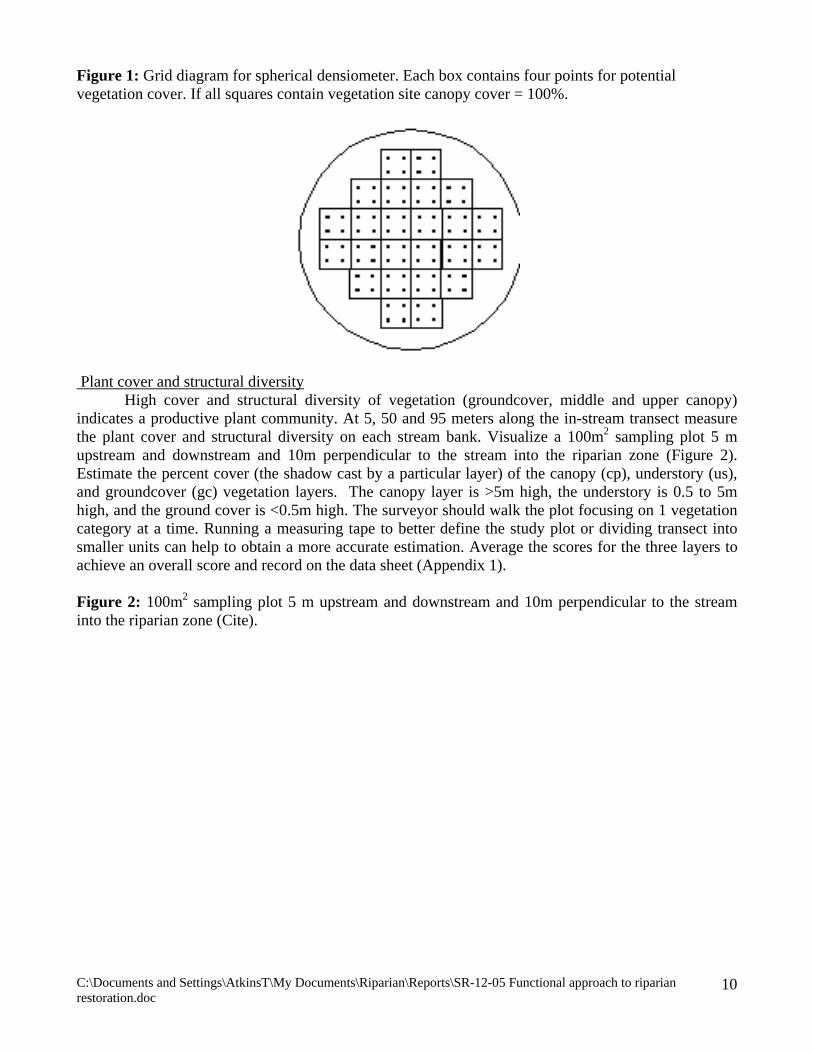
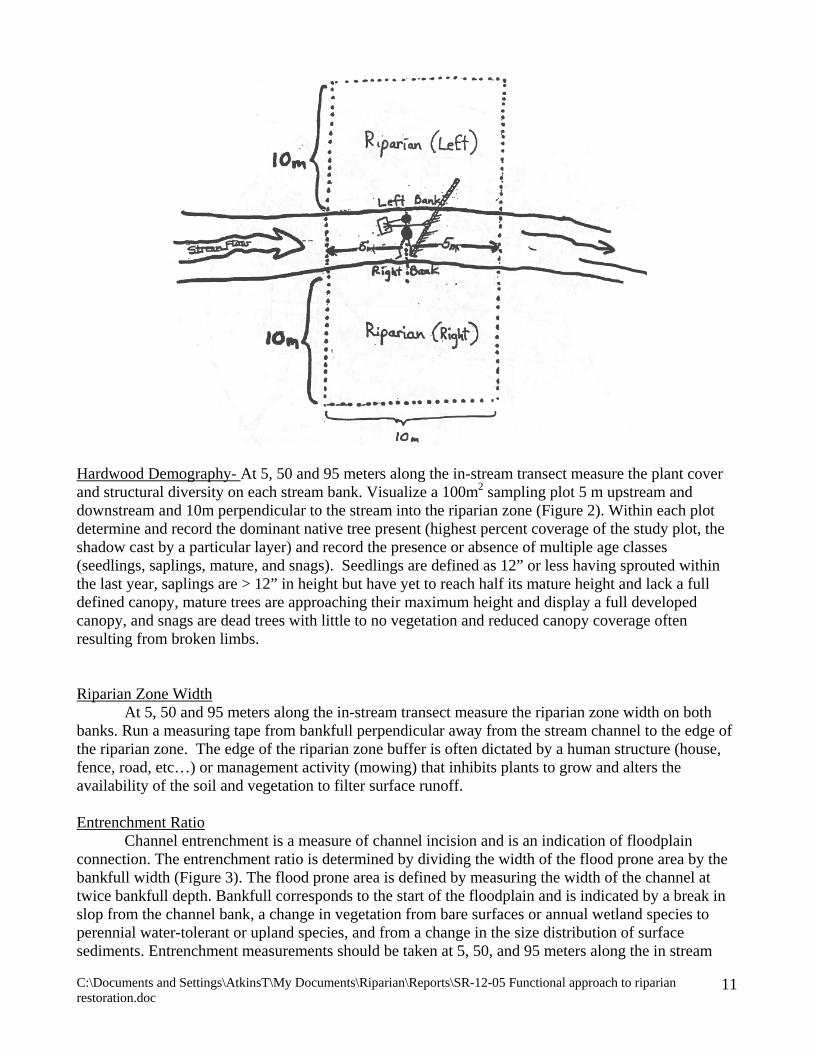
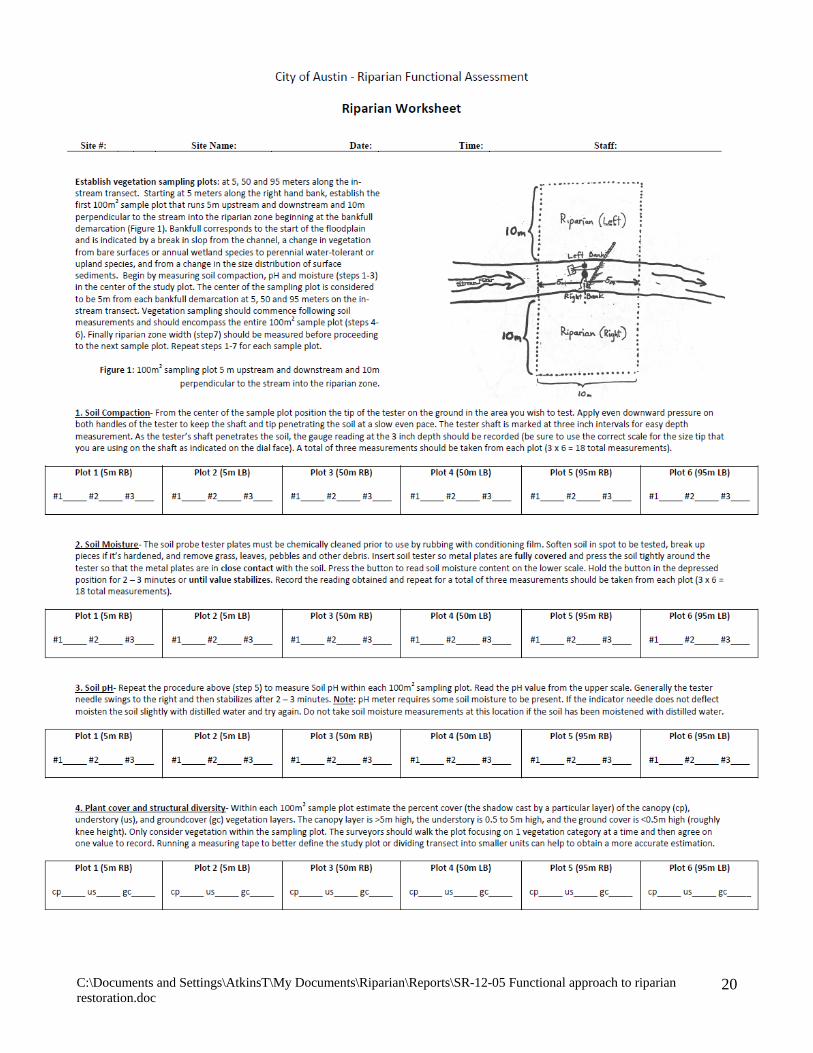
Plant cover and structural diversity High cover and structural diversity of vegetation (groundcover, middle and upper canopy) indicates a productive plant community. At 5, 50 and 95 meters along the in-stream transect measure the plant cover and structural diversity on each stream bank. Visualize a 100m2 sampling plot 5 m upstream and downstream and 10m perpendicular to the stream into the riparian zone (Figure 2). Estimate the percent cover (the shadow cast by a particular layer) of the canopy (cp), understory (us), and groundcover (gc) vegetation layers. The canopy layer is >5m high, the understory is 0.5 to 5m high, and the ground cover is <0.5m high. The surveyor should walk the plot focusing on 1 vegetation category at a time. Running a measuring tape to better define the study plot or dividing transect into smaller units can help to obtain a more accurate estimation. Average the scores for the three layers to achieve an overall score and record on the data sheet (Appendix 1). Figure 2: 100m2 sampling plot 5 m upstream and downstream and 10m perpendicular to the stream into the riparian zone (Cite).
C:\Documents and Settings\AtkinsT\My Documents\Riparian\Reports\SR-12-05 Functional approach to riparian restoration.doc
11
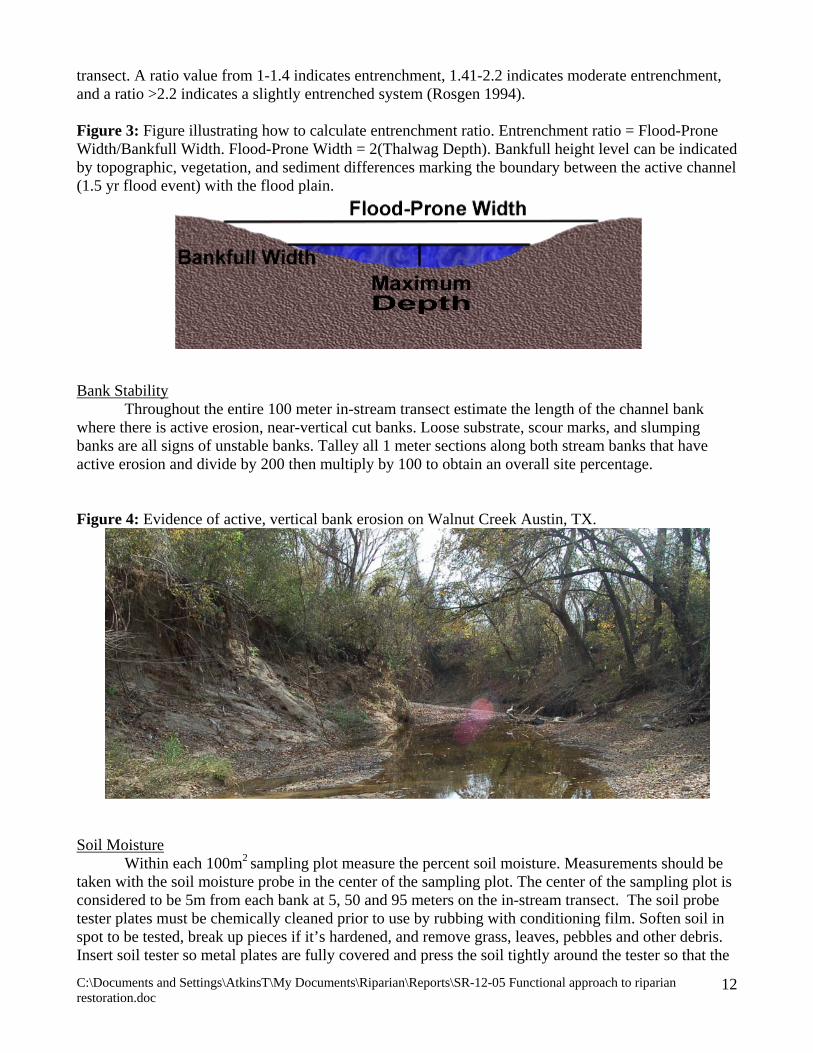
Hardwood Demography- At 5, 50 and 95 meters along the in-stream transect measure the plant cover and structural diversity on each stream bank. Visualize a 100m2 sampling plot 5 m upstream and downstream and 10m perpendicular to the stream into the riparian zone (Figure 2). Within each plot determine and record the dominant native tree present (highest percent coverage of the study plot, the shadow cast by a particular layer) and record the presence or absence of multiple age classes (seedlings, saplings, mature, and snags). Seedlings are defined as 12” or less having sprouted within the last year, saplings are > 12” in height but have yet to reach half its mature height and lack a full defined canopy, mature trees are approaching their maximum height and display a full developed canopy, and snags are dead trees with little to no vegetation and reduced canopy coverage often resulting from broken limbs. Riparian Zone Width At 5, 50 and 95 meters along the in-stream transect measure the riparian zone width on both banks. Run a measuring tape from bankfull perpendicular away from the stream channel to the edge of the riparian zone. The edge of the riparian zone buffer is often dictated by a human structure (house, fence, road, etc…) or management activity (mowing) that inhibits plants to grow and alters the availability of the soil and vegetation to filter surface runoff. Entrenchment Ratio Channel entrenchment is a measure of channel incision and is an indication of floodplain connection. The entrenchment ratio is determined by dividing the width of the flood prone area by the bankfull width (Figure 3). The flood prone area is defined by measuring the width of the channel at twice bankfull depth. Bankfull corresponds to the start of the floodplain and is indicated by a break in slop from the channel bank, a change in vegetation from bare surfaces or annual wetland species to perennial water-tolerant or upland species, and from a change in the size distribution of surface sediments. Entrenchment measurements should be taken at 5, 50, and 95 meters along the in stream
C:\Documents and Settings\AtkinsT\My Documents\Riparian\Reports\SR-12-05 Functional approach to riparian restoration.doc
12
transect. A ratio value from 1-1.4 indicates entrenchment, 1.41-2.2 indicates moderate entrenchment, and a ratio >2.2 indicates a slightly entrenched system (Rosgen 1994). Figure 3: Figure illustrating how to calculate entrenchment ratio. Entrenchment ratio = Flood-Prone Width/Bankfull Width. Flood-Prone Width = 2(Thalwag Depth). Bankfull height level can be indicated by topographic, vegetation, and sediment differences marking the boundary between the active channel (1.5 yr flood event) with the flood plain.
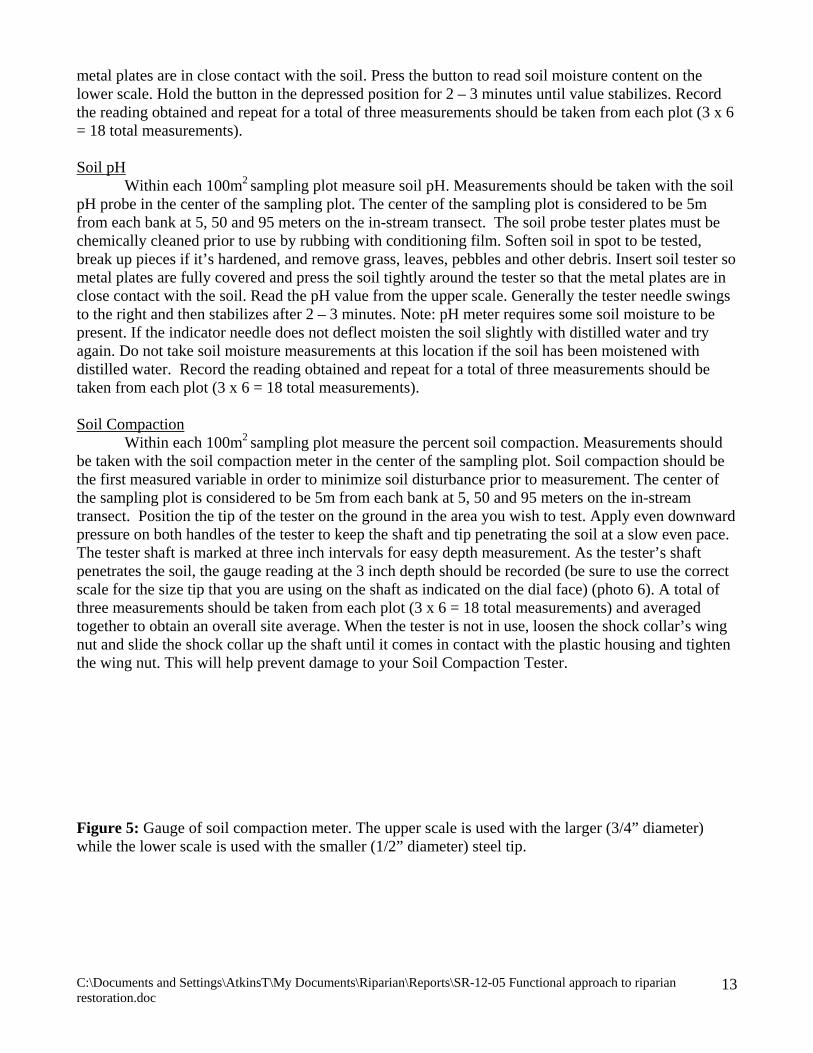
Bank Stability Throughout the entire 100 meter in-stream transect estimate the length of the channel bank where there is active erosion, near-vertical cut banks. Loose substrate, scour marks, and slumping banks are all signs of unstable banks. Talley all 1 meter sections along both stream banks that have active erosion and divide by 200 then multiply by 100 to obtain an overall site percentage. Figure 4: Evidence of active, vertical bank erosion on Walnut Creek Austin, TX.
Soil Moisture Within each 100m2 sampling plot measure the percent soil moisture. Measurements should be taken with the soil moisture probe in the center of the sampling plot. The center of the sampling plot is considered to be 5m from each bank at 5, 50 and 95 meters on the in-stream transect. The soil probe tester plates must be chemically cleaned prior to use by rubbing with conditioning film. Soften soil in spot to be tested, break up pieces if it’s hardened, and remove grass, leaves, pebbles and other debris. Insert soil tester so metal plates are fully covered and press the soil tightly around the tester so that the
C:\Documents and Settings\AtkinsT\My Documents\Riparian\Reports\SR-12-05 Functional approach to riparian restoration.doc
13
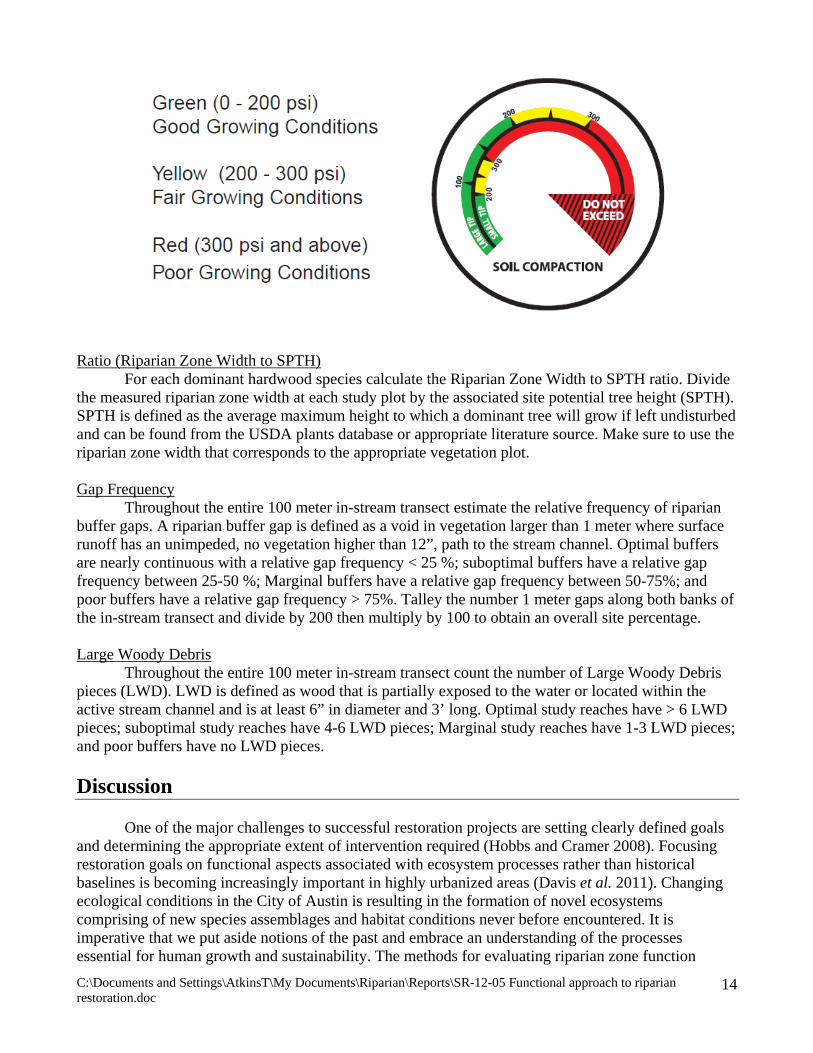
metal plates are in close contact with the soil. Press the button to read soil moisture content on the lower scale. Hold the button in the depressed position for 2 – 3 minutes until value stabilizes. Record the reading obtained and repeat for a total of three measurements should be taken from each plot (3 x 6 = 18 total measurements). Soil pH Within each 100m2 sampling plot measure soil pH. Measurements should be taken with the soil pH probe in the center of the sampling plot. The center of the sampling plot is considered to be 5m from each bank at 5, 50 and 95 meters on the in-stream transect. The soil probe tester plates must be chemically cleaned prior to use by rubbing with conditioning film. Soften soil in spot to be tested, break up pieces if it’s hardened, and remove grass, leaves, pebbles and other debris. Insert soil tester so metal plates are fully covered and press the soil tightly around the tester so that the metal plates are in close contact with the soil. Read the pH value from the upper scale. Generally the tester needle swings to the right and then stabilizes after 2 – 3 minutes. Note: pH meter requires some soil moisture to be present. If the indicator needle does not deflect moisten the soil slightly with distilled water and try again. Do not take soil moisture measurements at this location if the soil has been moistened with distilled water. Record the reading obtained and repeat for a total of three measurements should be taken from each plot (3 x 6 = 18 total measurements). Soil Compaction Within each 100m2 sampling plot measure the percent soil compaction. Measurements should be taken with the soil compaction meter in the center of the sampling plot. Soil compaction should be the first measured variable in order to minimize soil disturbance prior to measurement. The center of the sampling plot is considered to be 5m from each bank at 5, 50 and 95 meters on the in-stream transect. Position the tip of the tester on the ground in the area you wish to test. Apply even downward pressure on both handles of the tester to keep the shaft and tip penetrating the soil at a slow even pace. The tester shaft is marked at three inch intervals for easy depth measurement. As the tester’s shaft penetrates the soil, the gauge reading at the 3 inch depth should be recorded (be sure to use the correct scale for the size tip that you are using on the shaft as indicated on the dial face) (photo 6). A total of three measurements should be taken from each plot (3 x 6 = 18 total measurements) and averaged together to obtain an overall site average. When the tester is not in use, loosen the shock collar’s wing nut and slide the shock collar up the shaft until it comes in contact with the plastic housing and tighten the wing nut. This will help prevent damage to your Soil Compaction Tester. Figure 5: Gauge of soil compaction meter. The upper scale is used with the larger (3/4” diameter) while the lower scale is used with the smaller (1/2” diameter) steel tip.
C:\Documents and Settings\AtkinsT\My Documents\Riparian\Reports\SR-12-05 Functional approach to riparian restoration.doc
14
Ratio (Riparian Zone Width to SPTH) For each dominant hardwood species calculate the Riparian Zone Width to SPTH ratio. Divide the measured riparian zone width at each study plot by the associated site potential tree height (SPTH). SPTH is defined as the average maximum height to which a dominant tree will grow if left undisturbed and can be found from the USDA plants database or appropriate literature source. Make sure to use the riparian zone width that corresponds to the appropriate vegetation plot. Gap Frequency Throughout the entire 100 meter in-stream transect estimate the relative frequency of riparian buffer gaps. A riparian buffer gap is defined as a void in vegetation larger than 1 meter where surface runoff has an unimpeded, no vegetation higher than 12”, path to the stream channel. Optimal buffers are nearly continuous with a relative gap frequency < 25 %; suboptimal buffers have a relative gap frequency between 25-50 %; Marginal buffers have a relative gap frequency between 50-75%; and poor buffers have a relative gap frequency > 75%. Talley the number 1 meter gaps along both banks of the in-stream transect and divide by 200 then multiply by 100 to obtain an overall site percentage. Large Woody Debris Throughout the entire 100 meter in-stream transect count the number of Large Woody Debris pieces (LWD). LWD is defined as wood that is partially exposed to the water or located within the active stream channel and is at least 6” in diameter and 3’ long. Optimal study reaches have > 6 LWD pieces; suboptimal study reaches have 4-6 LWD pieces; Marginal study reaches have 1-3 LWD pieces; and poor buffers have no LWD pieces.
Discussion One of the major challenges to successful restoration projects are setting clearly defined goals and determining the appropriate extent of intervention required (Hobbs and Cramer 2008). Focusing restoration goals on functional aspects associated with ecosystem processes rather than historical baselines is becoming increasingly important in highly urbanized areas (Davis et al. 2011). Changing ecological conditions in the City of Austin is resulting in the formation of novel ecosystems comprising of new species assemblages and habitat conditions never before encountered. It is imperative that we put aside notions of the past and embrace an understanding of the processes essential for human growth and sustainability. The methods for evaluating riparian zone function
C:\Documents and Settings\AtkinsT\My Documents\Riparian\Reports\SR-12-05 Functional approach to riparian restoration.doc
15
presented in this document provide a foundation upon which to develop additional understanding and to better define restoration goals. The validity of these parameters need to be tested in the field and refined over time. With proper pre site evaluation and continued monitoring the City of Austin will be able to promote maximum ecosystem function at the least economic cost. Passive vs. active restoration As discussed earlier there are a positives and negatives associated with both passive and active restoration approaches. Being able to accurately diagnose a potential restoration site prior to implementation can increases chances of success and lower project costs (Holl and Aide 2010). Understanding if the main ecosystem disturbance driver is anthropogenic or natural can help restoration practitioners to decide between active and passive restoration. Active restoration is recommended for degraded sites where the primary disturbance regime is naturally reoccurring or a human alteration that the community is unable or unwilling to remedy. Passive restoration is recommended for sites where a rare natural disturbance event (extreme flood, drought, excessive rain, disease, etc…) has occurred or where a temporary (e.g. construction) or easily modified (e.g. mowing) human disturbance has taken place. Often altering or removing a management disturbance may set an ecosystem on a successional trajectory towards improved ecosystem function (Kauffman et al. 1999). The following site indicators can be used in the decision making process: 1. Age class distribution of dominant native and exotic tree species indicates recruitment success and
disturbance intervals. Missing age classes can indicate a disruption of natural ecosystem processes and can result in successional changes and species loss (Stacey et al. 2006). Dominant species exert the most influence, and thus the greatest functional changes will occur if the abundance of these species is altered (Richardson et al. 2007). Sites where the dominant native species has multiple age classes with seedlings or saplings having sprouted recently can rely on passive restoration. Conversely, dominant native species with minimal recruitment and missing age classes can be a sign of changing site conditions that may require management effort to improve ecosystem function. Removal of invasive exotic plant species can potentially be avoided on sites where only one age class is present and no seedlings or saplings have recently sprouted. Often, invasive exotic species will become established following a rare natural disturbance event or temporary human modification; however, their continued reproductive success will be hindered following the return of normal site conditions. Conversely, if the dominant exotic tree species has multiple age classes with recently sprouted saplings or concerns over seed dispersal to surrounding vulnerable habitats are a priority, then active exotic removal is warranted. Understanding the successional trends of the dominant native and exotic tree species will help managers’ asses which plants are likely to propagate under current site conditions and identify those species likely to become extirpated in the near future. If time allows it is recommended that following any change in anthropogenic disturbance, active restoration be postponed to allow sufficient time for native species response (Holl and Aide 2010). The understory community reflects a habitats current ecological condition and is a good indication of future succession trends (Woosley et al. 2005).
2. The surrounding vegetation community (Holl and Aide 2010). Source populations of desirable species in close proximity to the restored site are necessary for passive restoration approaches. In general the vegetation community within 100 meters of the site should be considered as the viable seed source (Hobbs and Prach 2008). In riparian restoration projects directly adjacent to an active stream channel, that receive regular flood waters, this range can be extended and all upstream vegetation can be considered as a viable seed source. Special caution should be considered in highly urbanized areas where over 60% of invasive woody species have a horticulture past and are distributed by highly mobile dispersal vectors (birds and wind) (Richardson and Rejmanek 2011).
3. Defining plant species can be used in minimally impacted riparian areas as an indication of functional improvements. Although the likely hood of returning a degraded site back to a
C:\Documents and Settings\AtkinsT\My Documents\Riparian\Reports\SR-12-05 Functional approach to riparian restoration.doc
16
previously defined historical baseline is becoming an increasingly difficult and often unnecessary restoration goal, the ability of a site to support a defining plant community (Table 1), that is characteristic of relatively pristine unaltered reference sites, can be used as an indication of improved ecological function. Studies performed by the City of Austin found distinct differences in the vegetation composition among relatively unaltered sites based on changes in ecological region and drainage size (COA 2011). In addition certain defining plant species (both abundant and widespread in the associated sampling region) were identified. The presence of these defining plant species at a site can be an indication that ecological conditions are relatively unaltered and that passive restoration techniques are appropriate (COA 2011). Conversely, the absence of these defining plant species could be an indication of disturbance and that active restoration is needed (COA 2011). Careful consideration must be taken in patchy environments where site conditions may be present but source populations of defining species are absent.
4. Soil integrity. Soil compaction or bulk density reflects the soil’s ability to function for structural support, water and solute movement, soil aeration, and can cause restriction to root growth (USDA 2008). Visual assessments of soil area integrity and soil compaction measurements can be used to assess a sites ability to support vegetation. A degraded site where soil compaction is high will likely require active restoration techniques to restore vegetative cover.
5. Hydrologic alteration. Interruptions in longitudinal or lateral connectivity of a stream are indications of disturbance that likely require active restoration measures to improve riparian zone function. The lack of lateral floodplain connectivity, often resulting from increased channel incision, can result in reductions in overbank flow, lowering of the water table, increased nitrogen availability, decreased plant germination, growth, and survivorship, and may lead to riparian vegetation loss and invasion of upland species (Rosgen 1994; Groffman et al. 2002; Stacey 2006). Groffman et al. (2002) found that hydrologic changes associated with urbanization (lowering of the water table) can cause riparian zones to be sources rather than sinks for nitrate. This increase in available nitrogen in urban riparian zones can result in increased invasion potential (Davis et al. 2000). Coffman’s (2007) work illustrates that Arundo donax may take advantage of anthropogenic enriched nitrogen levels in riparian ecosystems whereby outcompeting its native competitors. It is important to remember that deeply channelized streams can have riparian zones that function more like dry upland environments; no longer being able to support obligate and facultative wetland species. Stream systems lacking longitudinal connectivity due to upstream impoundments may also require active restoration. Impounded streams are subjected to a high degree of hydrologic disturbance (controlled water releases, draw downs, etc…) that results in increased disturbance, solute loading, nutrient enrichment, and unstable food webs (Havel et al. 2005). Increased nutrient enrichment, which is characteristic of urban reservoirs, coupled with the high degree of hydrologic disturbance results in unstable food webs and enhanced invisibility (Havel et al. 2005).
Recommendations Field testing of these riparian functional metrics is necessary prior to implementation as a routine site evaluation for restoration projects. Comparing sites with known degradation to those that are relatively pristine will guide the importance of each parameter. Additional research on the benefits of passive restoration in Austin and identifying disturbance mediated responses by invasive exotic species are needed. Understanding the likely disturbance drivers of species invasion will help managers decide on appropriate control and management actions. Often an exotic species is deemed invasive simply on anecdotal evidence or recommendations from other states whereby the ecological linkages of exotic species in Texas environments remains unknown. Being able to more appropriately rank the invasive threat of exotic species to the City of Austin, while better understanding the
C:\Documents and Settings\AtkinsT\My Documents\Riparian\Reports\SR-12-05 Functional approach to riparian restoration.doc
17
environmental mechanisms driving exotic spread, will allow monetary resources to be more appropriately allocated.
References Barbour, M.T., J. Gerritsen, B.D. Snyder, and J.B. Stribling. 1999. Rapid Bioassessment Protocols for Use in Streams and Wadeable Rivers: Periphyton, Benthic Macroinvertebrates and Fish. EPA 841-B-99-002 Baker, M.E., D.E. Weller, and T.E. Jordan, 2006. Improved Methods for Quantifying Potential Nutrient Interception by Riparian Buffers. Landscape Ecology 21:1327- 1345. Chin, A., Gelwick, F., Laurencio, D., Laurencio, L. R., Byers, M. S., and Scoggins, M. 2010. Linking Geomorphological and Ecological Responses in Restored Urban Pool-Riffle Streams. Ecological Restoration 28(4) 460 475 City of Austin Watershed Protection Department 2002. Environmental Integrity Index Methodology. COA-ERM 1999-01 City of Austin Watershed Protection Department 2011 Riparian reference condition: Using regional plant composition to guide functional improvements in the City of Austin. COA-ERM SR-11-13 Coffman, G. C. 2007. Factors Influencing Invasion of Giant Reed (Arundo donax) in Riparian Ecosystems of Mediterranean-type Climate Regions. PhD dissertation, University of California, Los Angeles. Curtis C. Daehler 2003. Performance Comparison of Co-Occurring Native and Alien Invasive Plants: Implications for Conservation and Restoration. Annu Rev. Ecol. Evol. Syst., 34:183-211 Davis, M. A., Chew, M. K., Hobbs, R. J., Lugo, A. E., Ewel, J. J., Vermeij, G. J., Brown J. H., Rosenzweig, M. L., Gardener, M. R., Carroll, S. P., Thompson, K., Pickett, S. T. A., Stromberg, J. C., Tredici, P. D., Suding, K. N., Ehrenfield, J. G., Grime, J. P., Mascaro, J., and Briggs, J. C. 2011. Don’t judge species on their origins. Nature, 474: 153–154. Davis, Mark A. 2009. Invasion Biology. Oxford University Press. Oxford, UK Davis, M. A., Grime, J. P., and Thompson, K. 2000. Fluctuating resources in plant communites: a general theory of invasion. Journal of Ecology, 88: 528-534. Duffy, E. J. 2009. Why biodiversity is important to the functioning of real-world ecosystems. Front Ecol. Environ. 7(8): 437-444. FEMAT, 1993. Forest ecosystem management: an ecological, economic, and social assessment, U.S. Government Printing Office, Washington, DC. Fischer, R.A. and Fischenich, J.C. 2000. Design recommendations for riparian corridors and vegetated buffer strips. U.S. Army Engineer Research and Development Center, Environmental Laboratory. Vicksburg, MS.Mayer, P. M., Reynolds Jr., S. K., and

C:\Documents and Settings\AtkinsT\My Documents\Riparian\Reports\SR-12-05 Functional approach to riparian restoration.doc
18
Gift, D. M., Groffman, P. M., Kaushal, S. S., and Mayer, P. M. 2010. Denitrification Potential, Root Biomass, and Organic Matter in Degraded and Restored Urban Riparian Zones. Restoration Ecology 18(1): 113–120 Havel, J. E., Lee, C. E., and Vander Zanden, M. J. 2005. Do Reservoirs Facilitate Invasions into Landscapes? BioScience 55 (6) 518-525. Hobbs, R. J., and Cramer, V. A. 2008. Restoration Ecology: Interventionist Approaches for restoration and Maintaining Ecosystem Function in the face of Rapid Environmental Change. Annu. Rev. Environ. Resourc., 33: 39-61. Hobbs, R. J., and Prach, K. 2008. Spontaneous Succession versus Technical Reclamation in the Restoration of Disturbed Sites. Restoration Ecology, Vol. 16, no. 3, pp. 363-366. Holl, H. D., Aide, T. M. 2010. When and where to actively restore ecosystems? Forest Ecol. Manage., doi:10.1016/j.foreco.2010.07.004 Huddle, J. A., Tala, A., Martin, D. L., Zhou, X., Pegg, S. E., and Josiah, S. J. 2011. Do Invasive Riparian Woody Plants Affect Hydrology and Ecosystem Processes. Great Plains Research, 21: 49-71. Karlen, D.L., M.J. Mausbach, J.W. Doran, R.G. Cline, R.F. Harris, and G.E. Schuman. 1997. Soil quality: A concept, definition, and framework for evaluation (a guest editorial). Soil Sci. Soc. Am. Journal 61: 4-10. King, R.S. and K.O. Winemiller. 2009. Development of Biological Indicators of Nutrient Enrichment for Application in Texas Streams. Texas Commission of Environmental Quality, Water QualityAssessment Program. Kaufmann, P.R. and E.G. Robison. 1998. Physical Habitat Characterizaton. pp 77- 118 In: J.M. Lazorchak, D.J. Klemm and D.V. Peck, eds., Environmental Monitoring and Assessment Program — Surface Waters: Field Operations and Methods for Measuring the Ecological Condition of Wadeable Streams. EPA/620/R-94/004F. Office of Research and Devel., U.S. Envir. Protect. Agency, Washington, D.C. pp 22-23. Kauffman, J. B., Beschta, R. L., Otting N., and Lytjen, D. 1997. An Ecological Perspective of Riparian and Stream Restoration in the Western United States. Fisheries vol. 22 No. 6. Mabe, J.A. 2007. Nutrient and Biological Conditions of Selected Small Streams in the Edwards Plateau, Central Texas, 2005-06, and Implications for Development of Nutrient Criteria. Scientific Investigations Report 2007-5195. U.S. Geological Survey. MacDougall, A. S., and Turkington, R. 2005. Are Invasive Species the Drivers or Passengers of Change in Degraded Ecosystems? Ecology, Vol. 86, No. 1, pp. 42-55 Moffatt, S. F., McLachlan, S. M., and Kenkel, N. C. 2004. Impacts of Land Use on Riparian Forest along an Urban-Rural Gradient in Southern Manitoba. Plant Ecology 174(1): 119-135
C:\Documents and Settings\AtkinsT\My Documents\Riparian\Reports\SR-12-05 Functional approach to riparian restoration.doc
19
Pouyat, R. V., Yesilonis, I. D., Ressell-Anelli, J., and Neerchal, N. K. 2007. Soil Chemical and Physical Properties That Differentiate Urban Land-Use and Cover Types. Soil Sci. Soc. Am. J. 71:1010-1019 Richardson, M. D., Holmes, P. M., Esler, K. J., Galatowitsch, S. M., Stromberg, J. C., Kirkman, S. P., Pysek, P., and Hobbs, R. J. 2007. Riparian vegetation: degradation, alien plant invasion, and restoration prospects. Diversity and Distributions, 13: 126-139. Sedell, J. R., P. A. Bisson, F. J. Swanson, and S. V. Gregory. 1993. What we know about large trees that fall into streams and rivers. Pages 47 – 82 in Maser et al editors. From the forest to the sea: a story of fallen trees. General Technical Report, PNW-GTR-299. Pacific Northwest Research Station, U.S. Dept. of Agriculture, Forest Service, Portland, OR Stacey, P. B., Jones, A., Catlin, J. C., Duff, D. A., Stevens, L. E., and Gourley, C. 2006. User's Guide for the Rapid Assessment of the Functional Condition of Stream- Riparian Ecosystems in the American Southwest. Wild Utah Project. www.unm.edu\biology\stacey Sung, C. Y., Ming-Han, L., Rogers, G. O., Volder, A., and Wang, Z. 2011. Investigating alien plant invasion in urban riparian forests in a hot and semi-arid region. Landscape and Urban Planning 100: 278–286. Tufekcioglu, A., J.W. Raich, T.M. Isenhart, and R.C. Schultz. 2001. Soil respiration within riparian buffers and adjacent crop fields. Plant and Soil 229: 117-124. USDA National Resources Conservation Service. 2008. Soil Quality indicators: Bulk Density. http://soils.usda.gov/sqi/assessment/files/bulk_density_sq_physical_indicator_sheet.pdf USDA National Resources Conservation Service. 1998. Soil Quality indicators: pH. http://soils.usda.gov/sqi/publications/files/indicate.pdf Weller, D.E., T.E. Jordan, and D.L. Correll, 1998. Heuristic Models for Material Discharge from Landscapes with Riparian Buffers. Ecological Applications 8:1156-1169. Woolsey, S., Capelli, F., Gonser, T., Hoehn, E., Hostmann, M., Junker, B., Paetzold, A., Roulier, C., Schweizer, S., Tiegs, S., Tockner, K., Webber, C., and Peter, A. 2007. A strategy to assess river restoration success. Freshwater Biology 52, 752–769 Woolsey, S., C. Weber, T. Gonser, E. Hoehn, M. Hostmann, B. Junker, C. Roulier, S. Schweizer, S. Tiegs, K. Tockner & A. Peter. 2005. Handbook for evaluating rehabilitation projects in rivers and streams. Publication by the Rhone-Thur project. Eawag, WSL, LCH-EPFL, VAW ETHZ. 108 pp.
Appendix 1
C:\Documents and Settings\AtkinsT\My Documents\Riparian\Reports\SR-12-05 Functional approach to riparian restoration.doc
20

C:\Documents and Settings\AtkinsT\My Documents\Riparian\Reports\SR-12-05 Functional approach to riparian restoration.doc
21

C:\Documents and Settings\AtkinsT\My Documents\Riparian\Reports\SR-12-05 Functional approach to riparian restoration.doc
22

C:\Documents and Settings\AtkinsT\My Documents\Riparian\Reports\SR-12-05 Functional approach to riparian restoration.doc
23

C:\Documents and Settings\AtkinsT\My Documents\Riparian\Reports\SR-12-05 Functional approach to riparian restoration.doc
24

C:\Documents and Settings\AtkinsT\My Documents\Riparian\Reports\SR-12-05 Functional approach to riparian restoration.doc
25

C:\Documents and Settings\AtkinsT\My Documents\Riparian\Reports\SR-12-05 Functional approach to riparian restoration.doc
26