flooding regime and restoration of riparian ecosystem integrity
DESCRIPTION
Flooding Regime and Restoration of Riparian Ecosystem Integrity. University of New Mexico Department of Biology J.F. Schuetz, M.C. Molles, Jr., C.N. Dahm and C.S. Crawford. Why are we studying the Middle Rio Grande riparian forest?. Damming and diversion of the river - PowerPoint PPT PresentationTRANSCRIPT

Flooding Regime and Restoration of Riparian Ecosystem Integrity
University of New Mexico
Department of Biology
J.F. Schuetz, M.C. Molles, Jr., C.N. Dahm and C.S. Crawford

• Damming and diversion of the river
• Altered volume and timing of the Rio Grande’s flow
• Isolated riparian forest (bosque)
• Reduced cottonwood germination; aging forest
• Invasion by exotic plants
• Limited scientific data to assess the ecological benefits of managed flooding
Why are we studying the Middle Rio Grande riparian forest?

iii) nativedetritivores
iii) net N mineralization
i) variation in water table depth ii) soil moisture
Cottonwoods
Forest Floor
Soils/Vadose Zone
Schematic Subsystems H°/predictions For flooded vs. nonfloodedsites:
i) interstitial DO Alluvial Aquifer ii) conductivity (salinity)
leaf litterwoody debris
water table
i) leaf decompositionii) forest floor respiration
ii) root growth/biomassi) C:N & C:P in new leaf tissue
iv) flowering iii) litterfall, C:N in litterfall
v) defoliation
Subsystems Under Study and Hypotheses

Study Sites

Total leaf biomassNative, non-cottonwood leaf biomassWood falling from the canopy
Preliminary Results

Average Annual Leaf Biomass Collected as Litterfallbars represent standard errors; * denotes significant difference
Leaf
Bio
mas
s (g
/m2 /y
r)
0
100
200
300
400
500
600
2000 2001*
Nonflood SitesFlood Sites
2002

Native and Exotic Leaf Biomass Excluding Cottonwood Leaves
Leaf
Bio
mas
s (g
/m2 /y
r)
0
10
20
30
40
50
60
Native leaf biomass excluding cottonwoodsExotic leaf biomass
Flood Nonflood
2000Flood Nonflood
2001Flood Nonflood
2002

*
Average Annual Woody Biomass Collected as Litterfallbars represent standard errors; * denotes significant difference
Woo
dy B
iom
ass
(g/m
2/y
r)
0
200
400
600
800
1000
1200
1400
1600
2000 2001 2002
Nonflood SitesFlood Sites

Coarse woody debris

Coarse Woody Debris (>2cm diameter) January 2002 and 2003bars represnet standard errors; * denotes significant difference
Ave
rage
Bio
mas
s of
Coa
rse
Woo
dy D
ebris
(M
g/ha
)
0
2
4
6
8
10
12
14
16
Nonflood SitesFlood Sites
2002* 2003

Pitfall traps – collecting ground arthropods
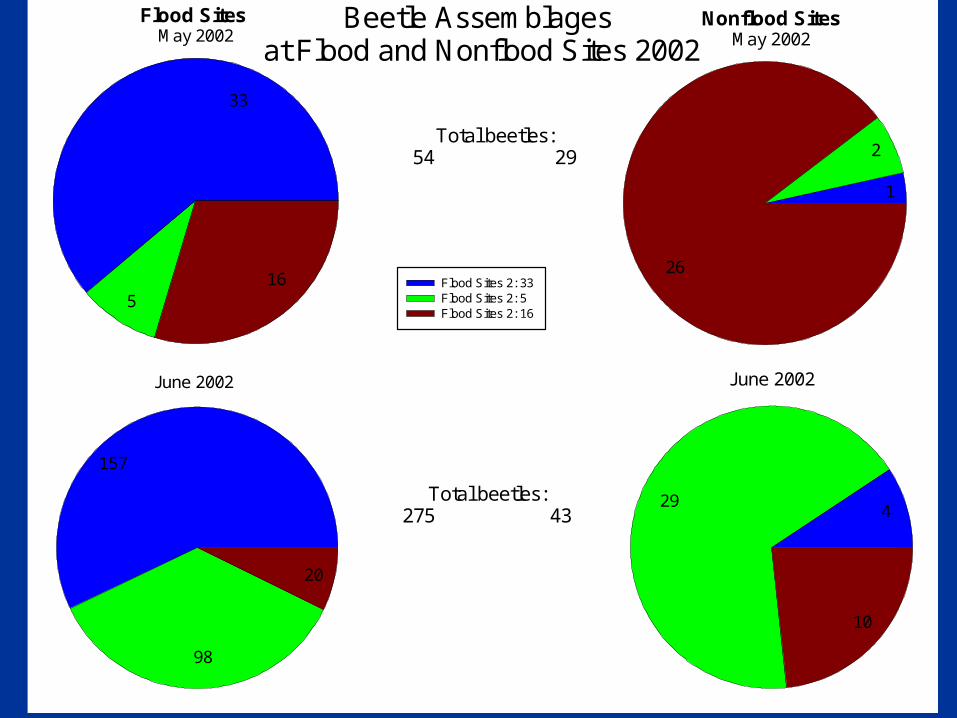
Beetle Assemblages at Flood and Nonflood Sites 2002
Total beetles:54 29
June 2002
157
20
98
Total beetles:275 43
June 2002
4
10
29
Flood Sites May 2002
Flood Sites 2: 33 Flood Sites 2: 5 Flood Sites 2: 16
33
516
Nonflood SitesMay 2002
2
1
26

Forest floor litter storage

Forest Floor Litter Storage (January 2002 and 2003)bars represent standard errors
Ash
-fre
e D
ry W
eigh
t of L
itter
Sto
rage
(g/
m2)
0
200
400
600
800
1000
1200
1400
1600
1800
Nonflood SitesFlood Sites
2002 2003

Soil moisture throughout a depth of 1 meter

Soil Moisture at Nonflood Sites (2001)
2001
Apr May Jun Jul Aug Sep Oct Nov DecV
olum
etric
wat
er c
onte
nt (
mL/
g so
il)
0.12
0.16
0.20
0.24
0.28
0.32
0.36
Rio
Gra
nde
Sta
ge a
t Ber
nard
o (f
t)
1
2
3
4
5
6
MonsoonrainsFlood pulse
Soil Moisture at Flood Sites (2001)
2001
Apr May Jun Jul Aug Sep Oct Nov Dec
Vol
umet
ric w
ater
con
tent
(m
L/g
soil)
0.12
0.16
0.20
0.24
0.28
0.32
0.36
Rio
Gra
nde
Sta
ge a
t Ber
nard
o (f
t)
1
2
3
4
5
6
25 cm below ground40 cm below ground55 cm below ground70 cm below ground85 cm below ground100 cm below groundMODAYYR vs Stage 01
MonsoonrainsFlood pulse

Net nitrogen mineralization

Net Nitrogen Mineralizationbars represnet standard errors; * denotes significant difference
Oct 01 Feb 02 Jun 02 Oct 02
ug N
O3-
+ N
H4+
/g s
oil
0
10
20
30
40
Flood Sites Nonflood Sites
Date Soils Collected
*
*

Groundwater levels

Depth to Water Table 2001* denotes significant difference
Jan Mar May Jul Sep Nov
Dep
th to
Wat
er T
able
(cm
)
20
40
60
80
100
120
140
160
180
Nonflood Sites
Flood Sites *
2001

• Contribute to the knowledge base of the scientific community – river restoration worldwide
• Provide local natural resource managers and water policy-makers with information to make decisions on the use of managed floods – costs and benefits
• Part of a larger initiative on restoring the river and bosque: Corps of Engineers, Bureau of Reclamation, Fish and Wildlife Service; Bosque Ecological Monitoring Project (BEMP); classes at UNM
What do we do with our results?

AcknowledgementsAcknowledgements
Funding agency: National Science Foundation Grant DEB-9903973
Undergraduate assistance: Karyth Becenti, Nate Bohls, Sam Gray, Leslie Barker, Joseph O’Connell, Nick Johnson, Ben Zimmerman
Cooperating agencies and institutions:Middle Rio Grande Conservancy DistrictBosque del Apache National Wildlife RefugeCity of Albuquerque Open Space DivisionNew Mexico State Land OfficeRio Grande Nature CenterGrinnell CollegeThe Nature Conservancy
Questions/Comments
http://sevilleta.unm.edu/~cdahm/Research/CRB/home/index.html