spss exercise 5 - sjsu.edu › people › carlos.e.garcia › courses...figure 5.3 is a simple...
TRANSCRIPT

SPSSExercise5CreatingandIndex
Due:Anindexisameasureofasinglegeneralconceptordimensionthatiscomposedofseveralindividualitems.Putanotherway,anindexisameasurethatismadewhentwoormoremeasuresarecombined.Objectives:
1. Learntocreateanindex2. Learntointerpretindexscores
SPSSProcedure:
1. FromthetoolbarselectTransform->ComputeVariable(SeeFigure5.1).ThiswillcauseawindowsimilartothatinFigure5.2toopen.
2. Under“TargetVariable”typeinthenameoftheindexabouttobecreated,“empathyINDEX”inthisinstance.NotethattheTargetVariablenameshouldneverhavespacesnorshoulditusespecialcharacters.
3. Correctthevariablestobeused.Notethisdirectionisonlyavailableinclass.4. Usethevariables“emapthy1”,“empathy3”,“empathy2R”,and“empathy4R”
tocreateanindextomeasureempathyamongtherespondentsinoursample.Under“NumericExpression”entertheformulatocreate.(empathy1+empathy3+empathy2R+empathy4R)/4.Theequationisdividedby4becausethatisthenumberofvariablesintheindex.
5. Hit“OK”6. RunafrequencydistributionforempathyINDX7. Notewhendescribinghowanindexismadeitisexpectedthatthe
variablesusedtocreatetheindexareexplicitlydiscussed.Thisincludesadescriptionofwhatisaskedandadiscussiononvariablesthathavebeentransformedandwhy.
ReadingtheOutput:Figure5.3isasimplefrequencydistribution.ItcanbereadasdiscussedinSPSSExercise2butthereareacoupleofthingstoknow.
1. Checktherangeofthevaluesbeingdisplayed.Ifthereisavalue/attributesmallerorlargerthaninoneoftheoriginalvariablesusedtocreatetheindextheremaybeaproblem.
2. Beclearonthedirectionofthevalues/attributes.Doesahighnumbermeanmoreorlessofwhattheindexismeasuring?Inthisinstance,thehigherthevaluethemoreempatheticrespondentsarerelativetooneanother.Forexample,ifapersonhadanempathyINDEXscoreof4.0wedon’treallyknowhowempatheticthatpersonisweonlyknowtheyaremoreempatheticthanapersonwhoscored3.75ontheindexandlessempatheticthansomeonewhoscoreda4.25.

DisplayingtheData&AnalyzingtheTable:InstructionforthisisavailableinSPSSExercise2Assignment:
1. Createanindexforempathyusingthevariablesandprocedurediscussedabove.
2. Writeareportwherethefollowingarediscussed:a. Whatanindexisforandwhattheyareusedfor.b. Describehowtheempathyindexwascreated.Dosoby:
i. Specifyingeachofthevariablesused.Don’tjustnameeachvariable;alsopresentwhateachquestionisasking.
ii. Discussanyrecodingofvariablesthatwasnecessaryfortheindexandwhyitwasneeded.
c. Answerthefollowingquestion:Dopeopleinthesampletendtohavehighorlowlevelsofempathy?Whatevidencedoyouhavetodrawthisconclusion?
3. SubmittheoutputforthefrequencydistributionofempathyINDEXandthecodeyouusedtocreateitwiththereport.
Figure5.1.
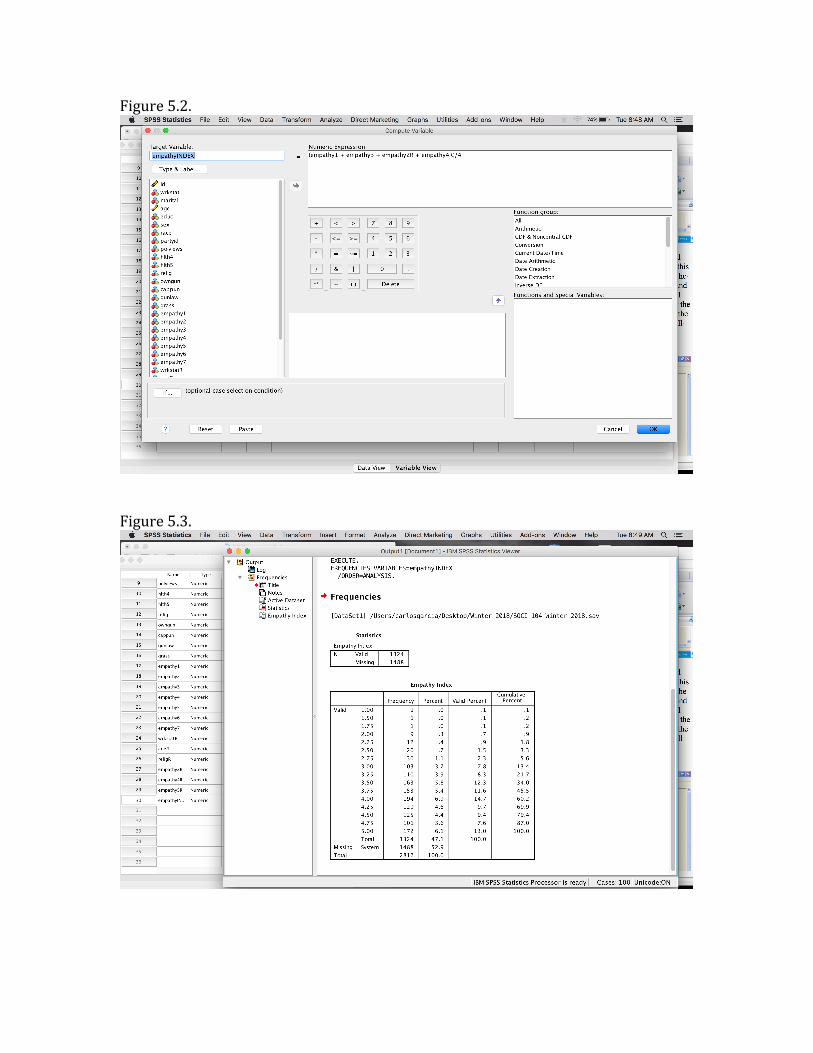
Figure5.2.
Figure5.3.