spss : data analysis - j. m. patel college€¦ · nominal mode ordinal median interval/ratio (not...
TRANSCRIPT
SPSS : DATA ANALYSIS
DR.PRADEEP MESHRAM
• “Statistical Package for the Social Sciences”
• It is also known by the name PASW (Predictive Analytics Software)
• It used for data analysis in research. Can be used for: – Processing Questionnaires
– Preparing Tables and Graphs
– Calculating & Analyzing: Means, Chi-square, Regression, …and much more..
Translate the Questionnaire into codes and enter data in SPSS
Questions in the questionnaire are mapped into Variables in SPSS
Important factors to consider before data entry into SPSS
• Question response formats
• Scale characteristics
• Levels of measurement
Question-response formats can be of the following types:
• Closed-Ended
• Open-Ended with numerical response
• Open-Ended with text response
• Multiple response questions
Convert all these formats into numeric or string (alphabet) data for entering into SPSS
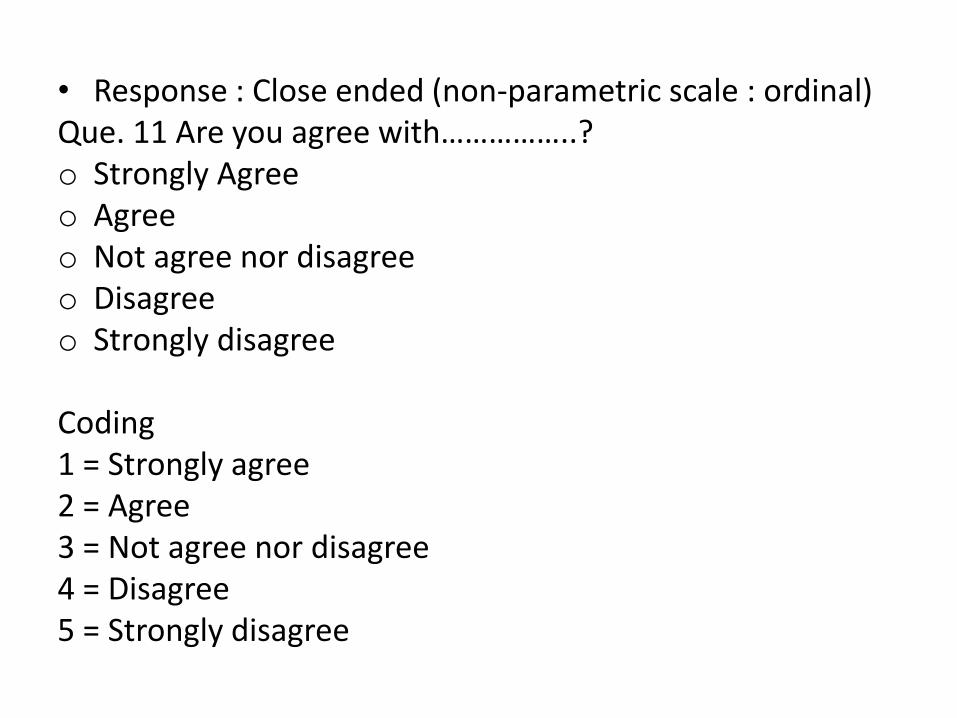
• Response : Close ended (non-parametric scale : ordinal) Que. 11 Are you agree with……………..? o Strongly Agree o Agree o Not agree nor disagree o Disagree o Strongly disagree Coding 1 = Strongly agree 2 = Agree 3 = Not agree nor disagree 4 = Disagree 5 = Strongly disagree
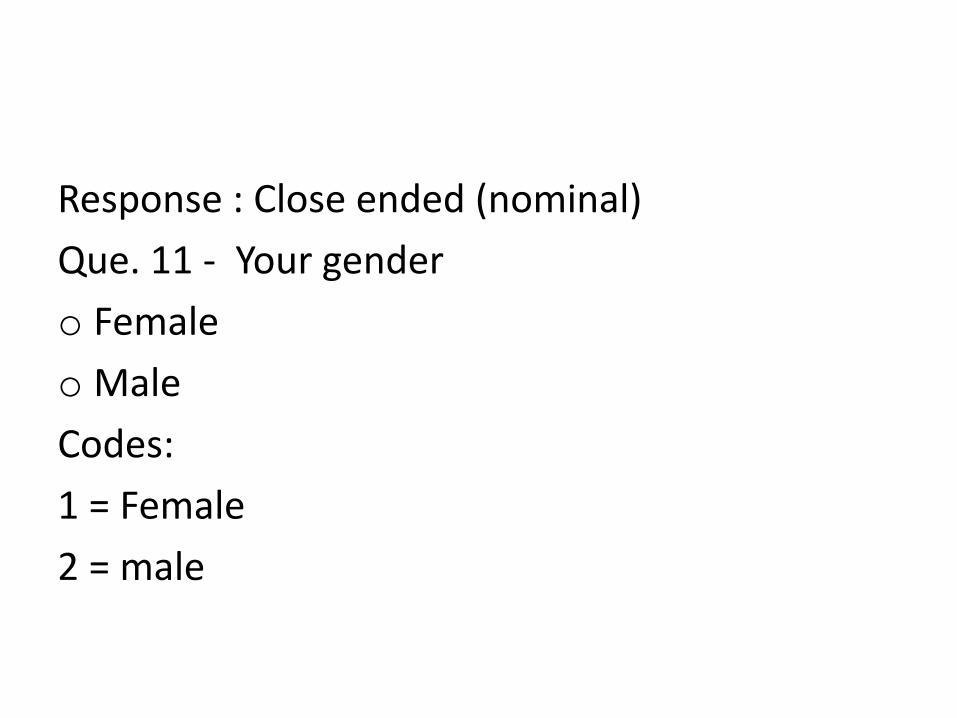
Response : Close ended (nominal)
Que. 11 - Your gender
o Female
o Male
Codes:
1 = Female
2 = male
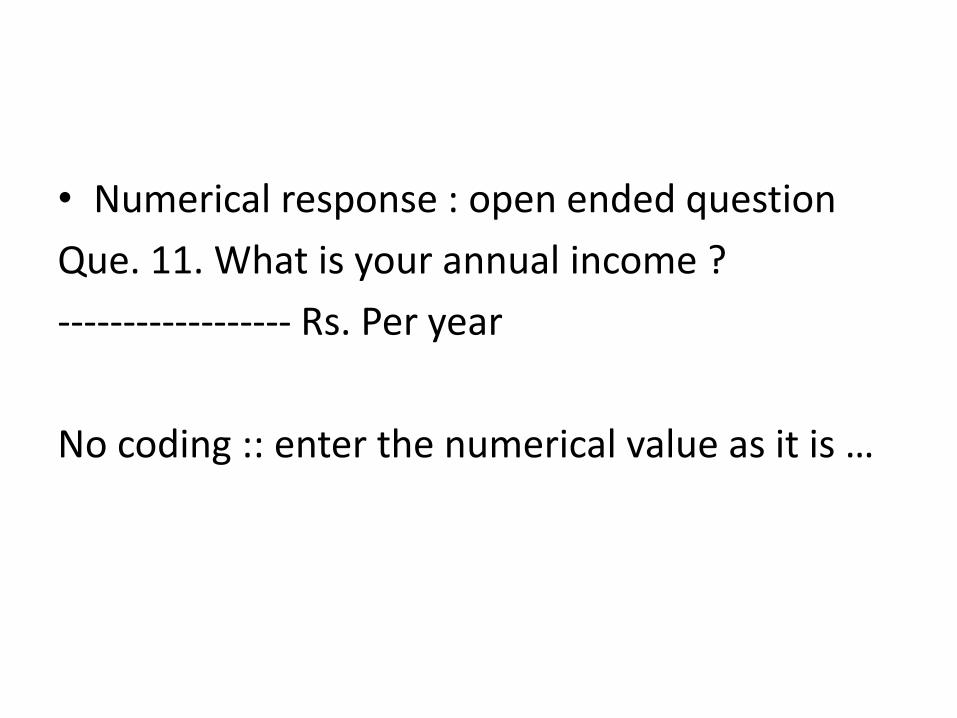
• Numerical response : open ended question
Que. 11. What is your annual income ?
------------------ Rs. Per year
No coding :: enter the numerical value as it is …
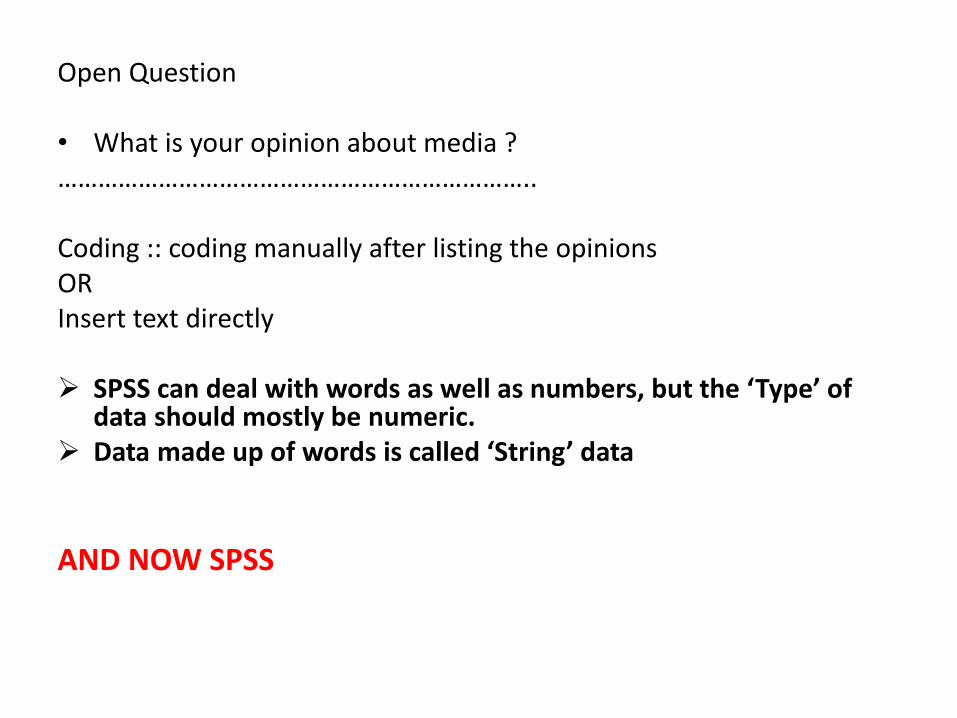
Open Question
• What is your opinion about media ? …………………………………………………………….. Coding :: coding manually after listing the opinions OR Insert text directly SPSS can deal with words as well as numbers, but the ‘Type’ of
data should mostly be numeric. Data made up of words is called ‘String’ data
AND NOW SPSS
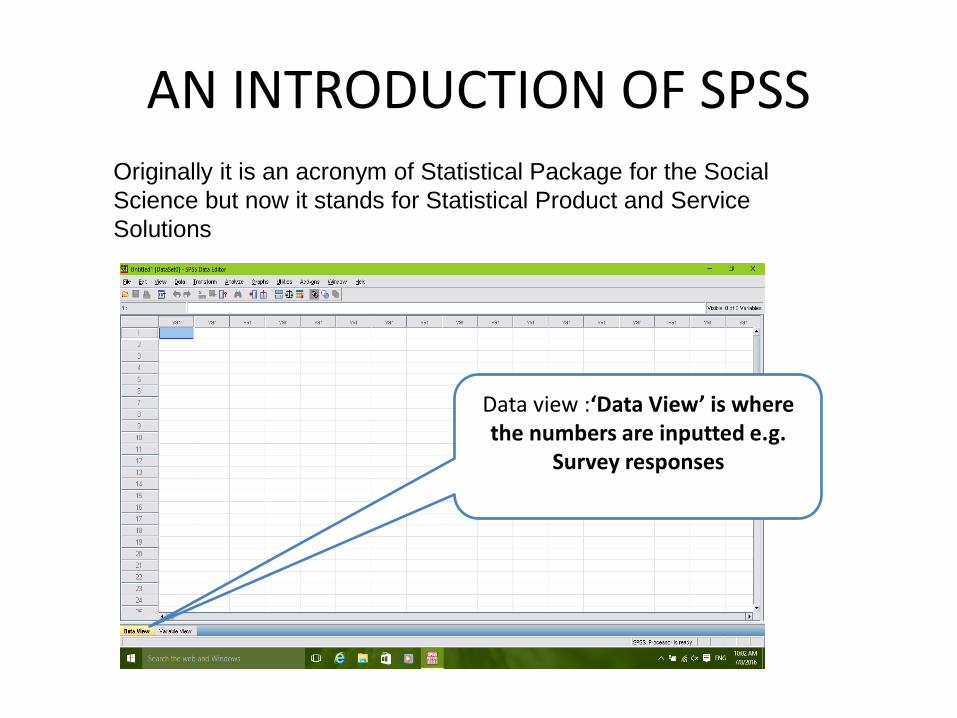
AN INTRODUCTION OF SPSS Originally it is an acronym of Statistical Package for the Social
Science but now it stands for Statistical Product and Service
Solutions
Data view :‘Data View’ is where the numbers are inputted e.g.
Survey responses
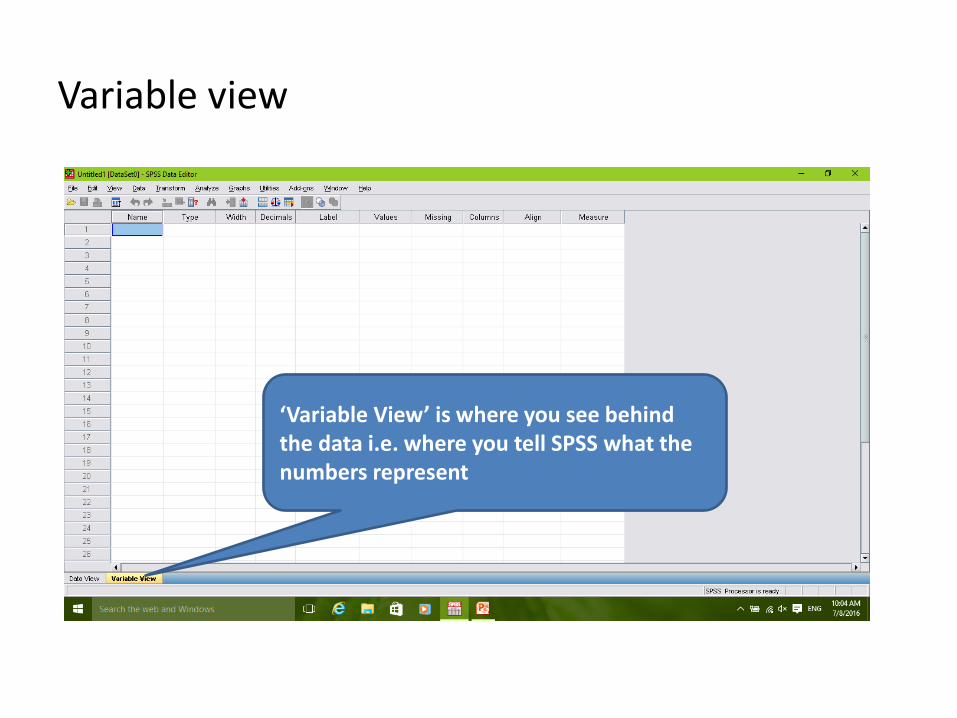
Variable view
‘Variable View’ is where you see behind the data i.e. where you tell SPSS what the numbers represent
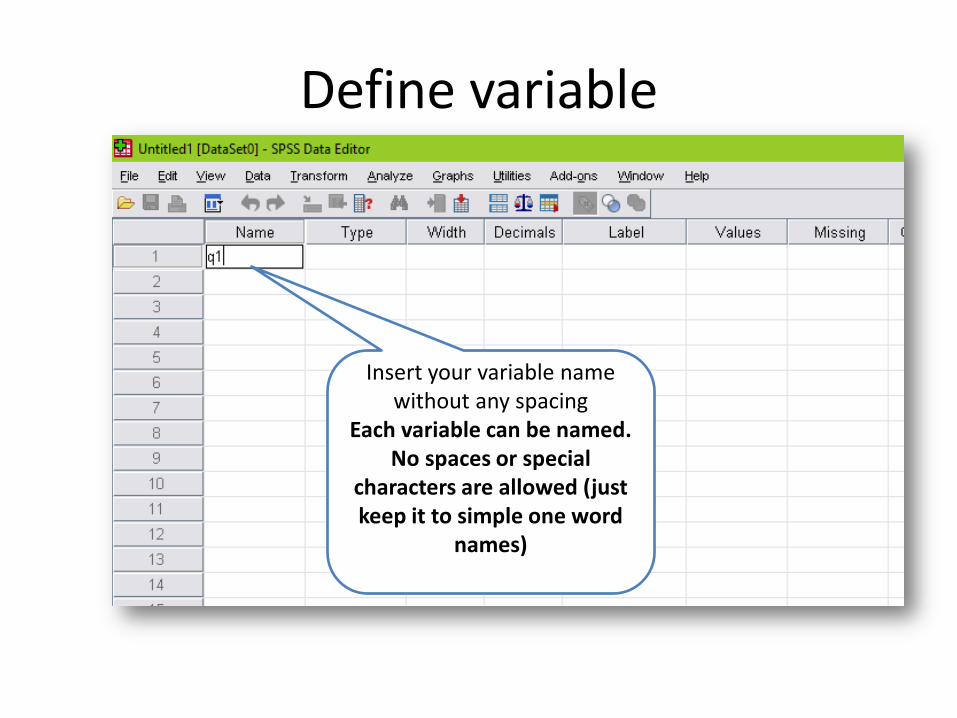
Define variable
Insert your variable name without any spacing
Each variable can be named. No spaces or special
characters are allowed (just keep it to simple one word
names)
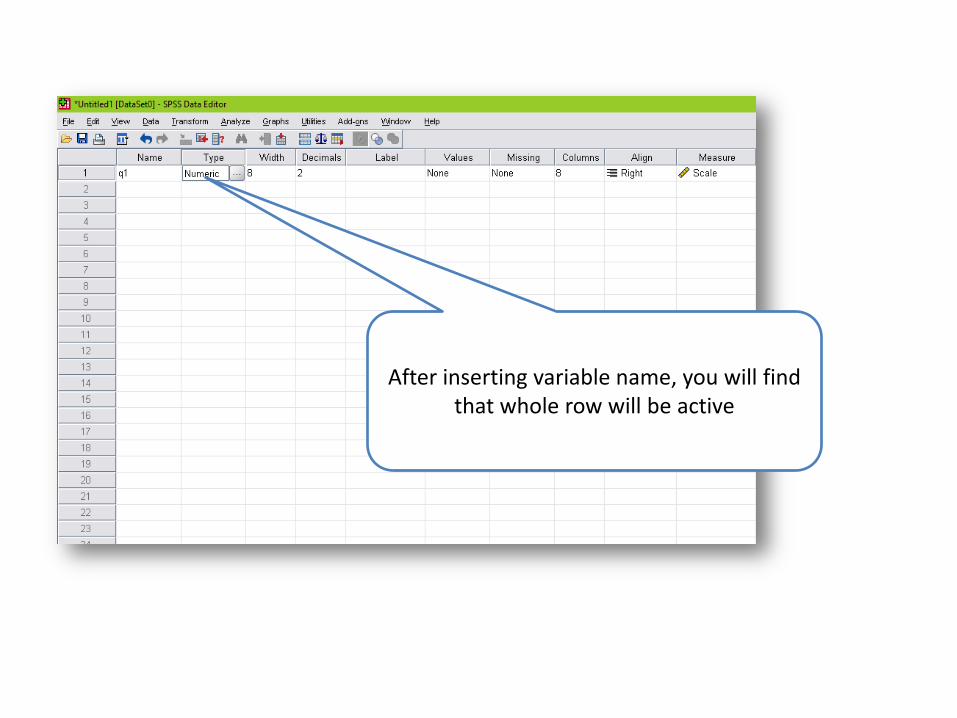
After inserting variable name, you will find that whole row will be active
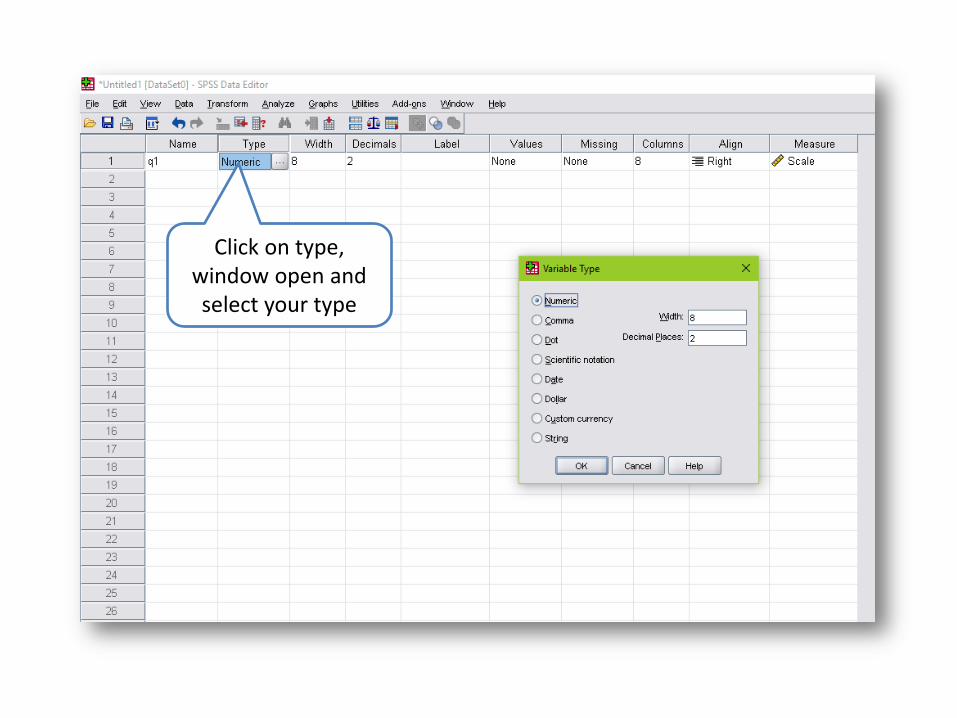
Click on type, window open and select your type
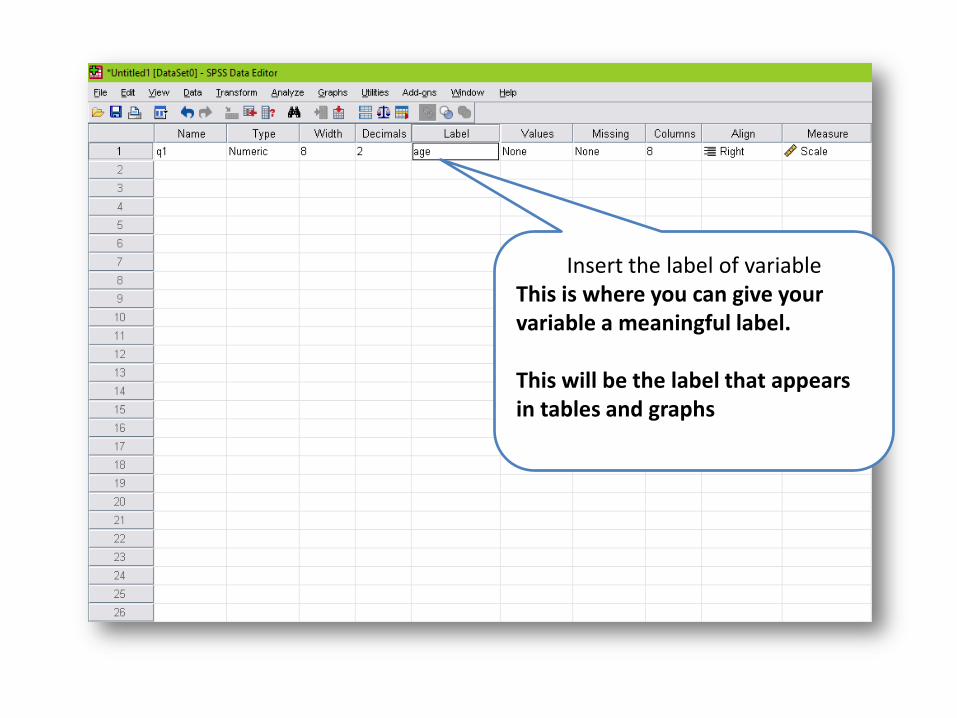
Insert the label of variable This is where you can give your variable a meaningful label. This will be the label that appears in tables and graphs
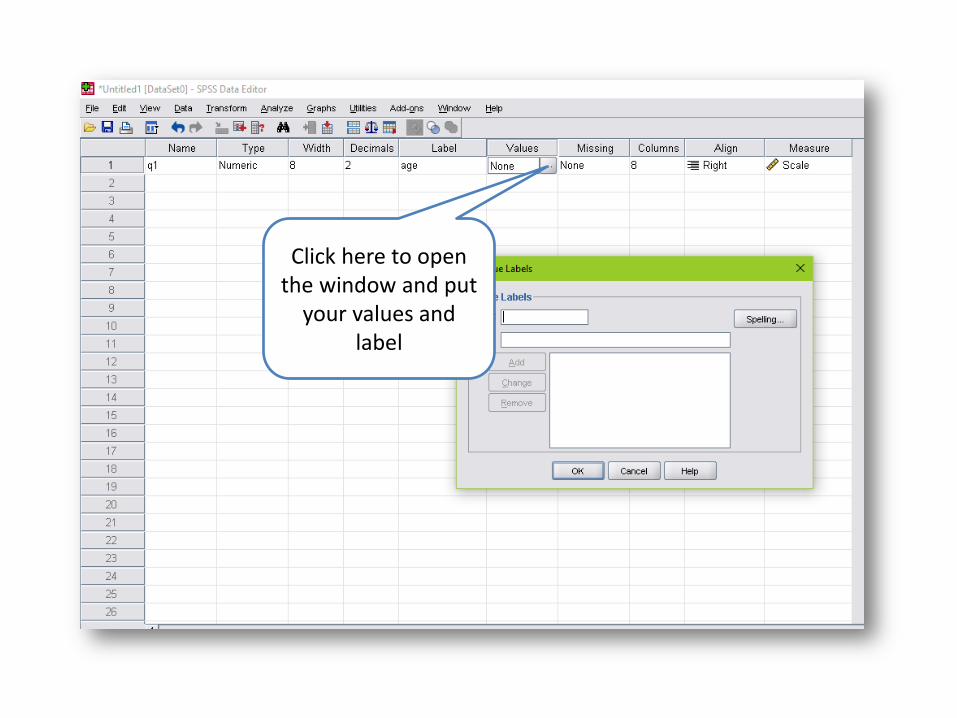
Click here to open the window and put
your values and label
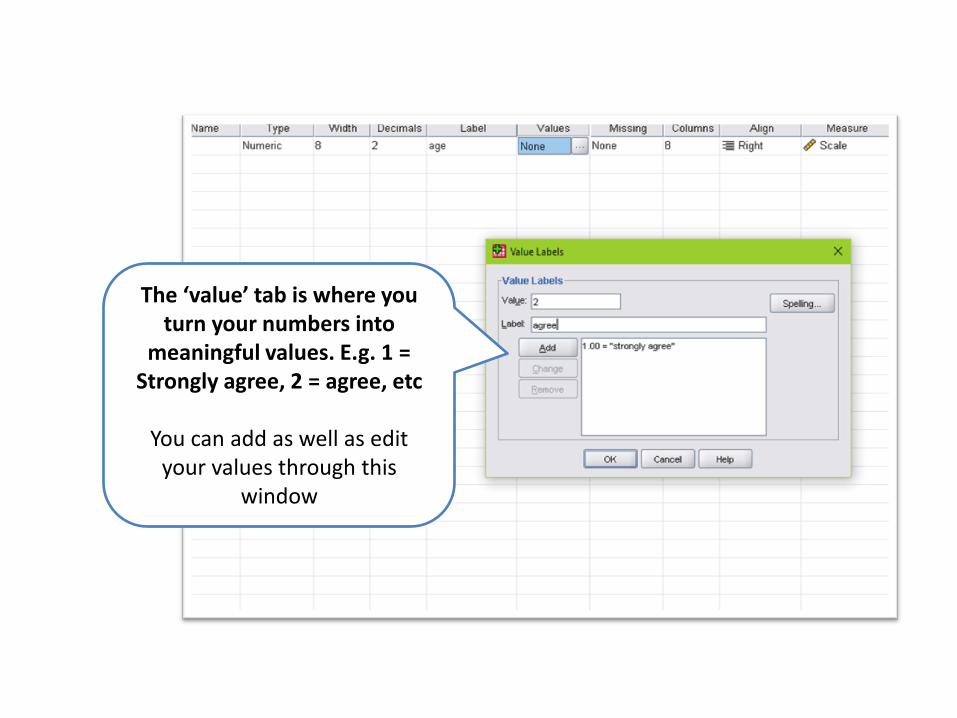
The ‘value’ tab is where you turn your numbers into
meaningful values. E.g. 1 = Strongly agree, 2 = agree, etc
You can add as well as edit
your values through this window
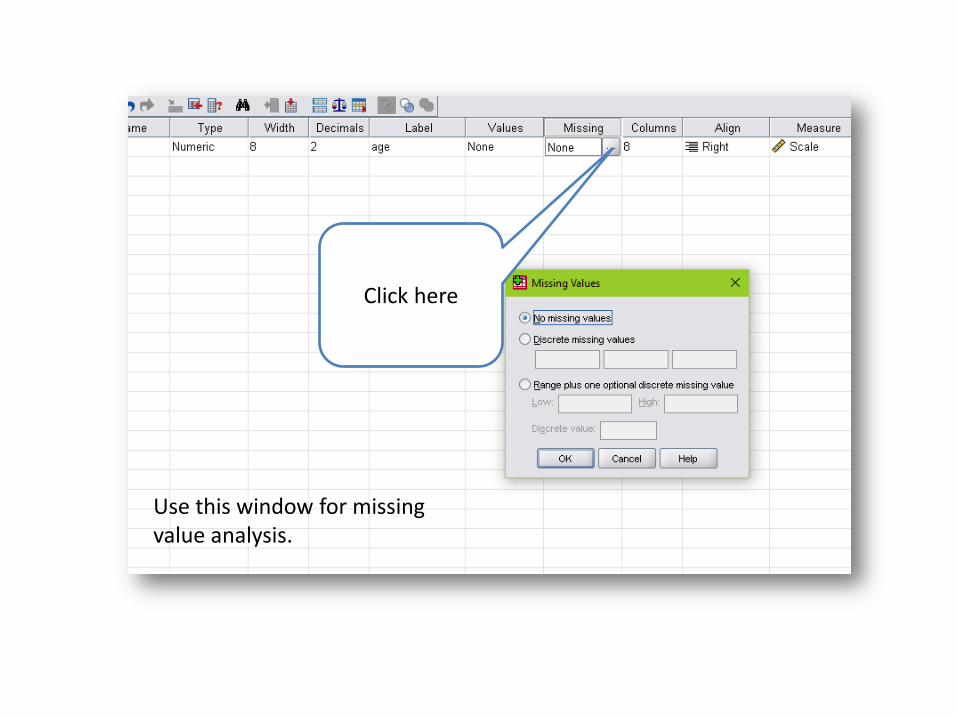
Use this window for missing value analysis.
Click here
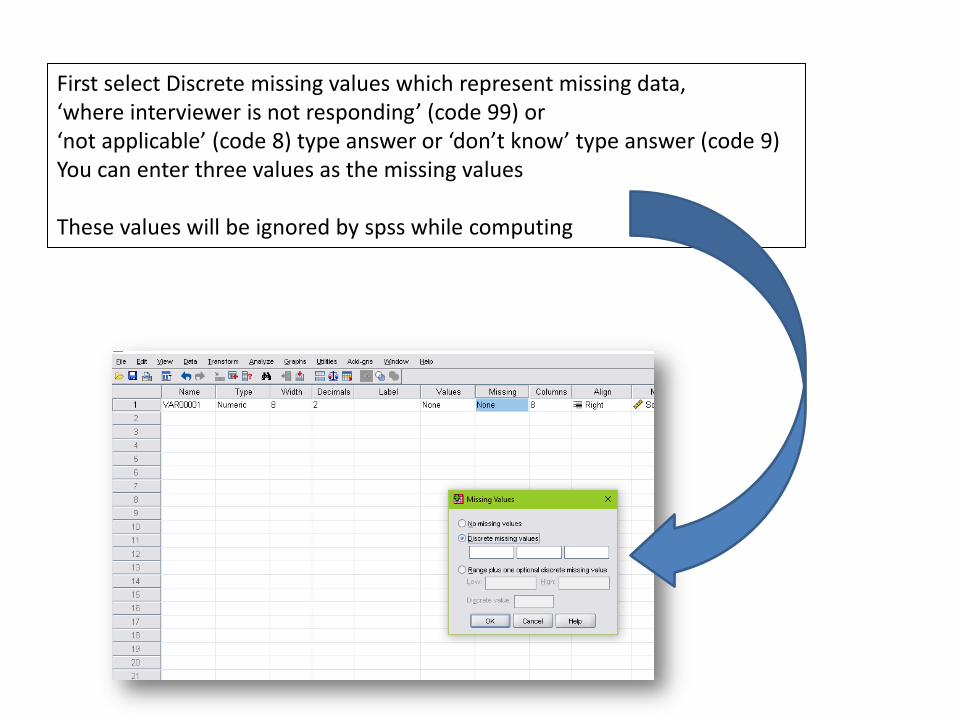
First select Discrete missing values which represent missing data, ‘where interviewer is not responding’ (code 99) or ‘not applicable’ (code 8) type answer or ‘don’t know’ type answer (code 9) You can enter three values as the missing values These values will be ignored by spss while computing
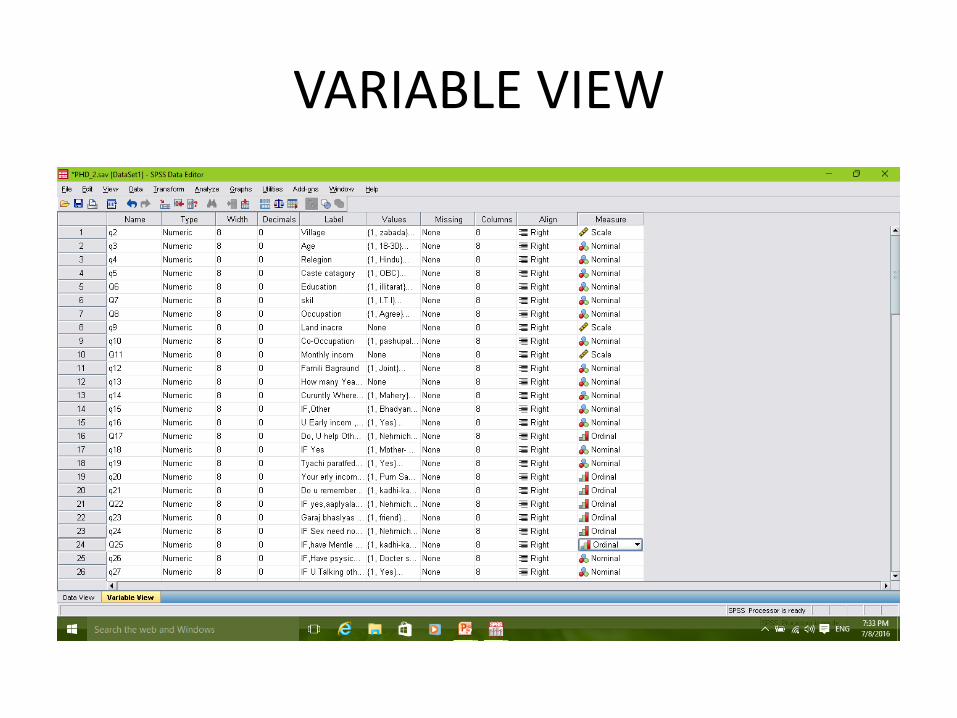
VARIABLE VIEW
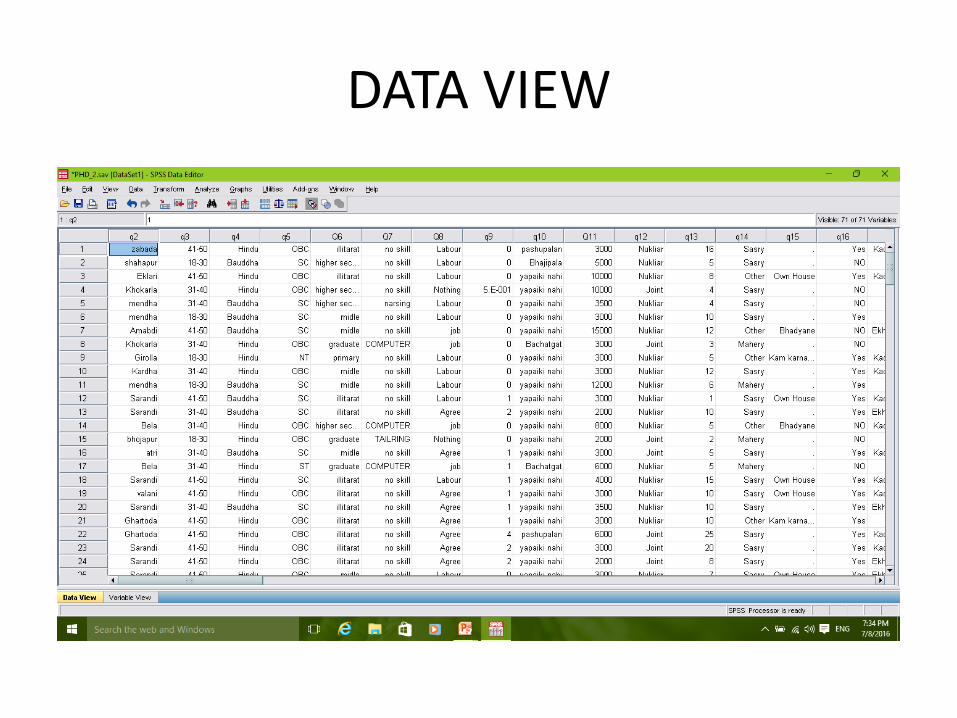
DATA VIEW
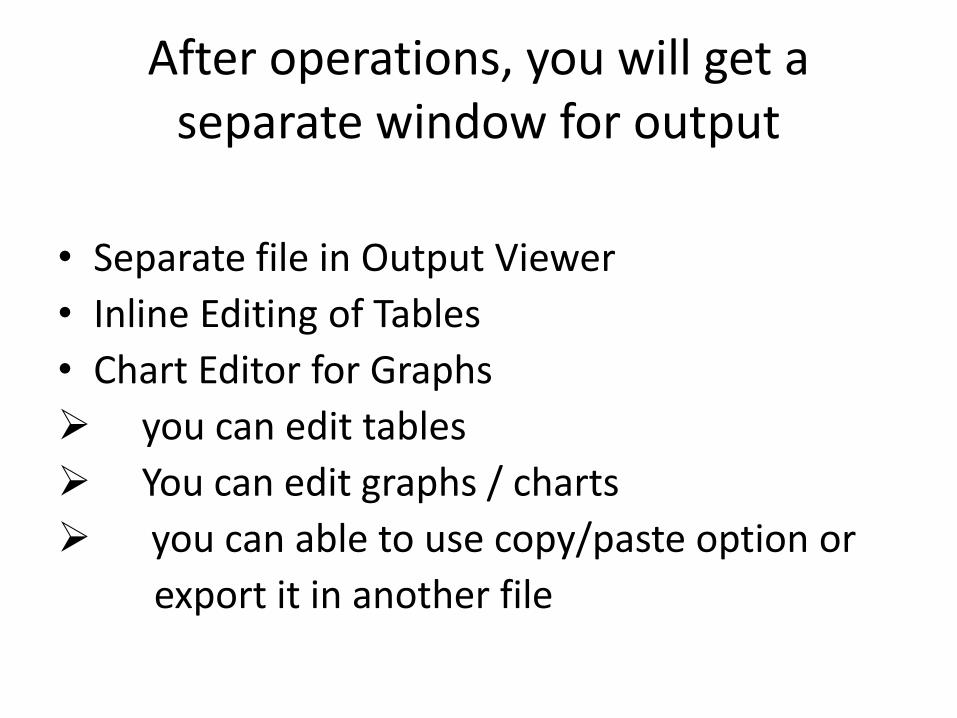
After operations, you will get a separate window for output
• Separate file in Output Viewer
• Inline Editing of Tables
• Chart Editor for Graphs
you can edit tables
You can edit graphs / charts
you can able to use copy/paste option or
export it in another file
Statistics……..?
• Statistics is a set of mathematical techniques used to:
• Summarize research data.
• Determine whether the data supports the researcher’s hypothesis.
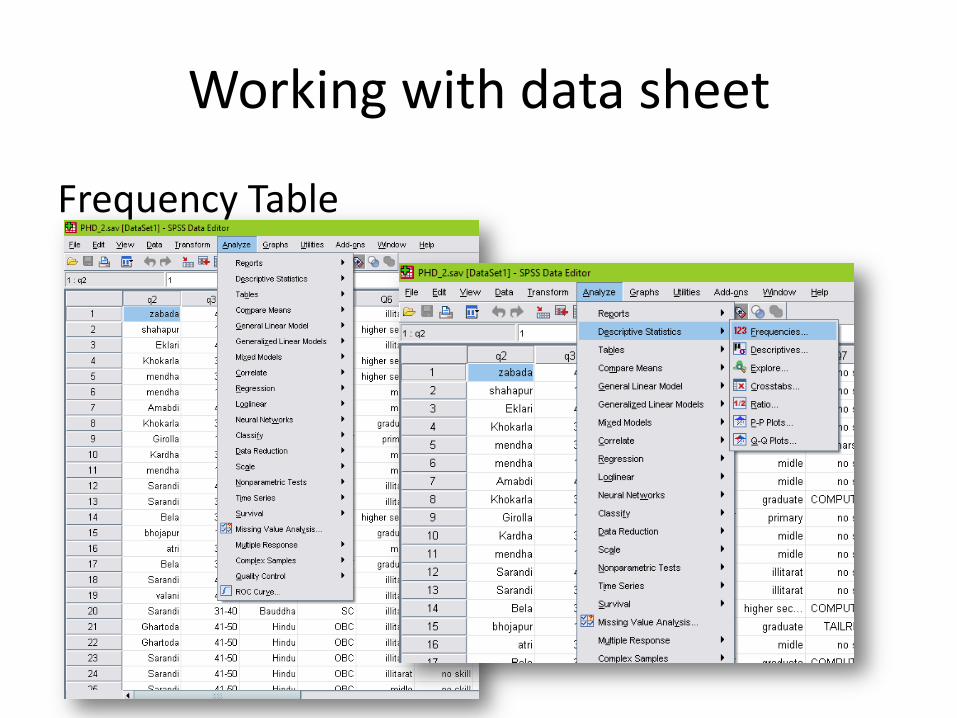
Working with data sheet
Frequency Table
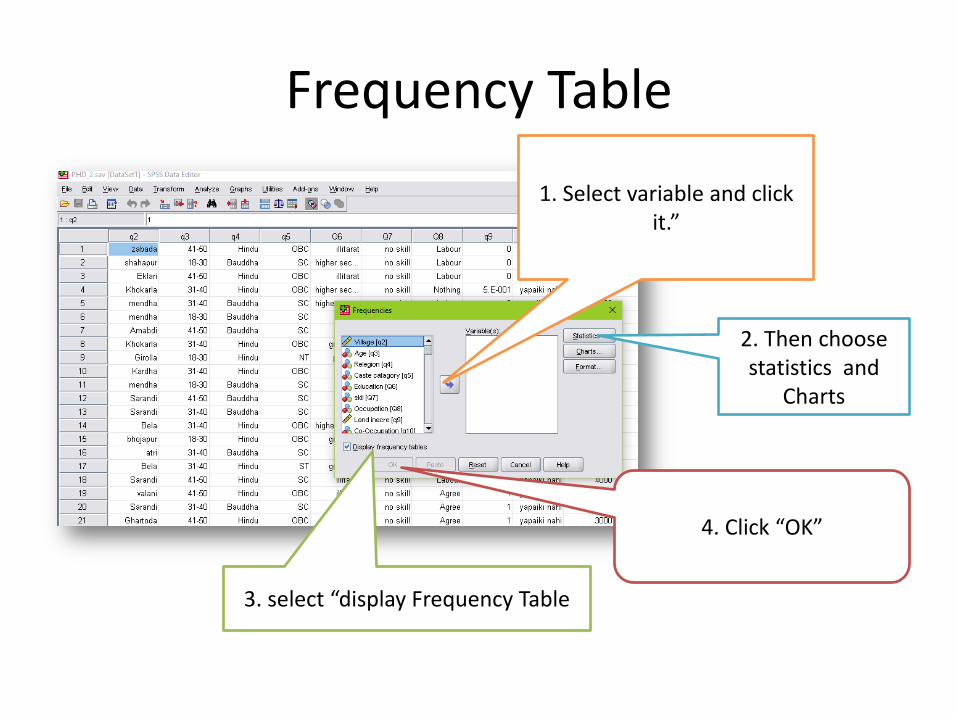
Frequency Table
1. Select variable and click it.”
2. Then choose statistics and
Charts
3. select “display Frequency Table
4. Click “OK”
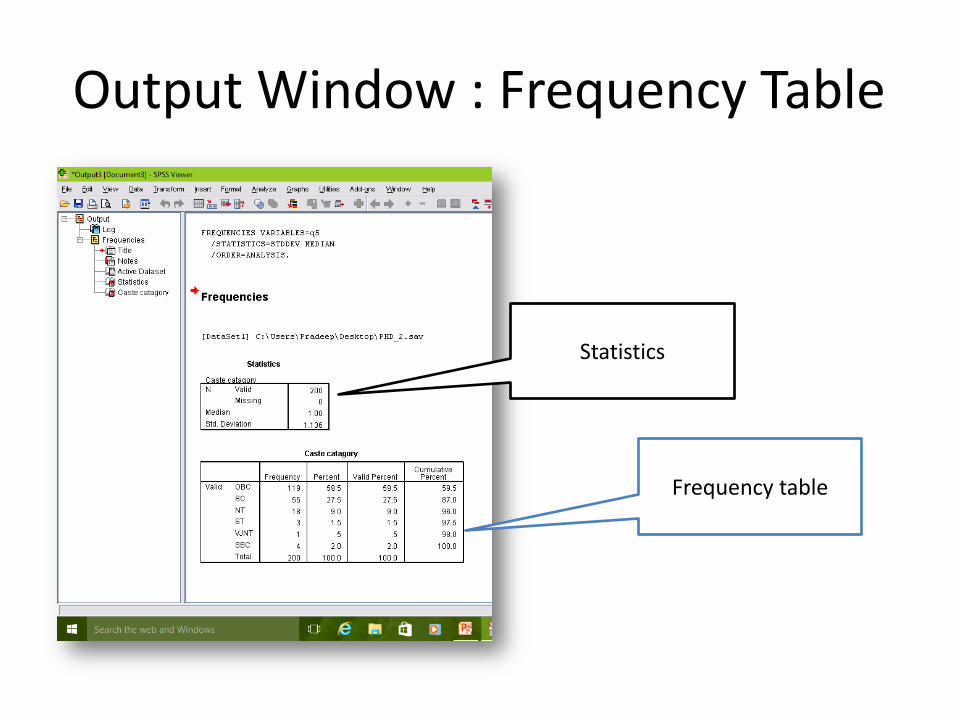
Output Window : Frequency Table
Statistics
Frequency table
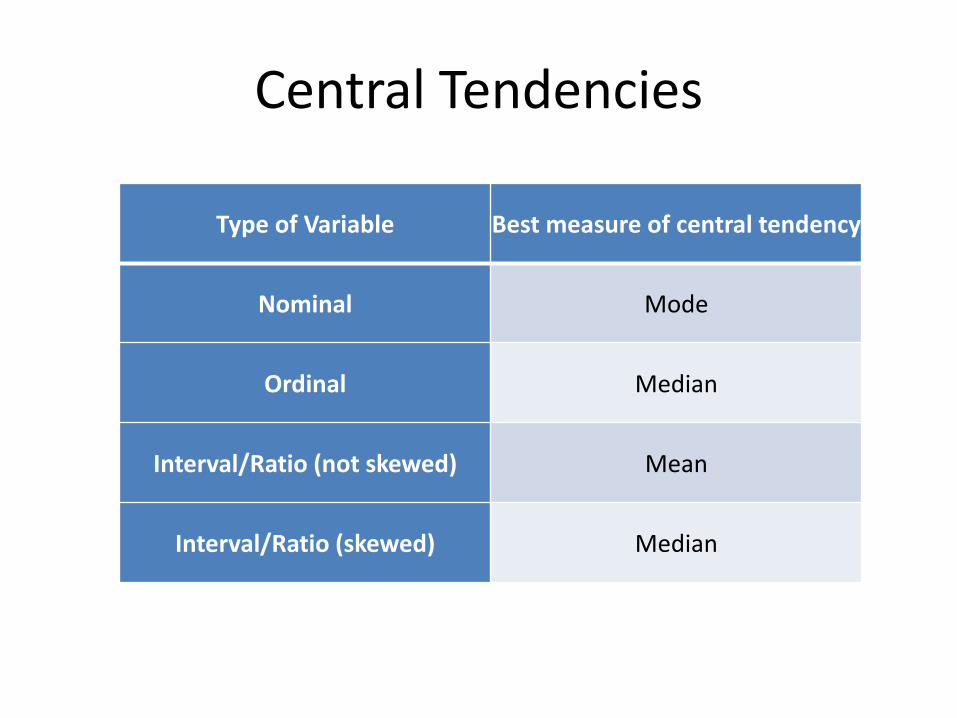
Central Tendencies
Type of Variable Best measure of central tendency
Nominal Mode
Ordinal Median
Interval/Ratio (not skewed) Mean
Interval/Ratio (skewed) Median
Dispersions • The standard deviation tells you if the majority of the scores fall
close to the mean value or are widely dispersed. When the standard deviation is large, the mean score is not a good descriptor of all respondents. If the standard deviation is small, most scores are close to the value of the mean and the mean is a good representation of the typical respondent.
• Skewness is a measure of symmetry, or more precisely, the lack of symmetry. A distribution, or data set, is symmetric if it looks the same to the left and right of the center point.
• Kurtosis is a measure of whether the data are heavy-tailed or light-tailed relative to a normal distribution. That is, data sets with high kurtosis tend to have heavy tails, or outliers (a value in statistical sample which does not fit a pattern that describes most other data points; especially a value that lies 1.5 IQR beyond the upper or lower quartile). Data sets with low kurtosis tend to have light tails, or lack of outliers. A uniform distribution would be the extreme case.
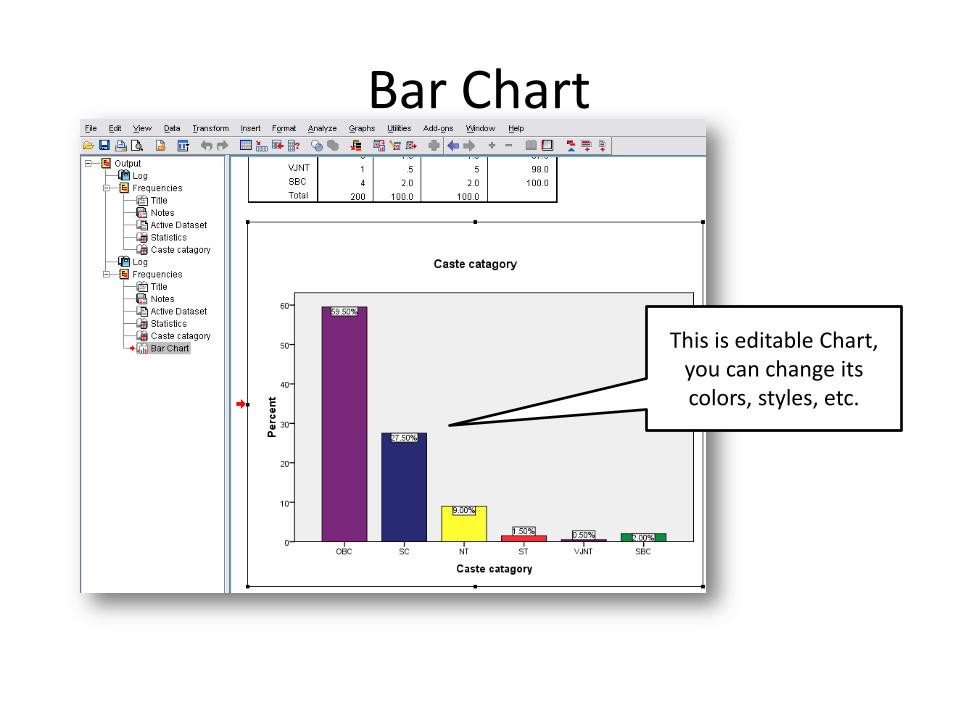
Bar Chart
This is editable Chart, you can change its colors, styles, etc.
Exporting Output
• Two methods to exporting outputs
1. Copy that table or graph and paste it in your destination file
2. Select that table or graph, and after “right click” choose “export”, then select destination file and save it
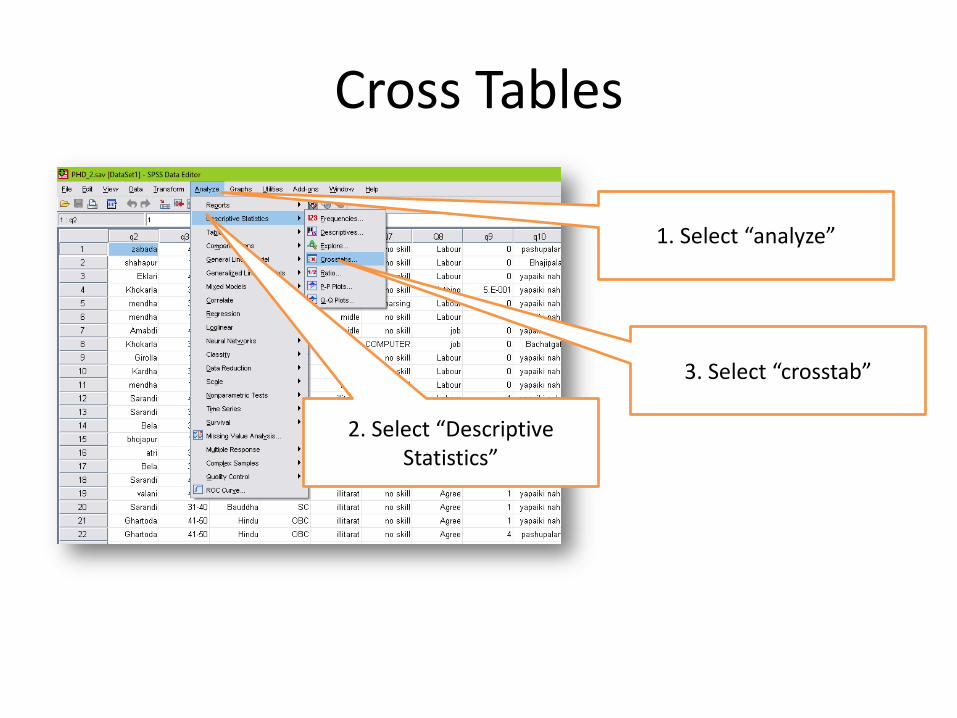
Cross Tables
1. Select “analyze”
2. Select “Descriptive Statistics”
3. Select “crosstab”
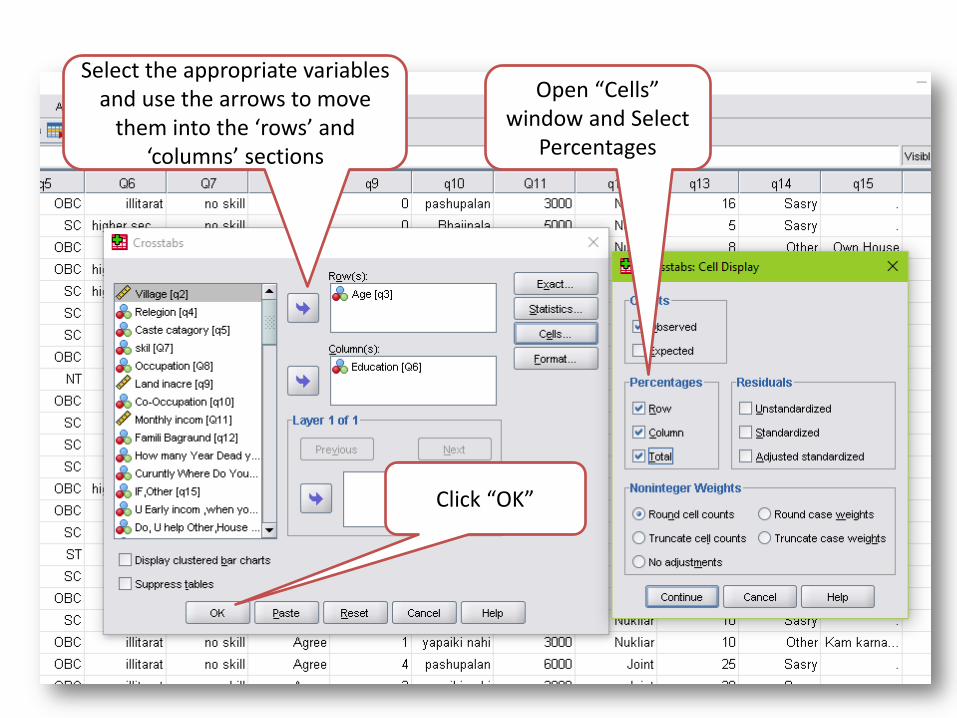
Select the appropriate variables and use the arrows to move
them into the ‘rows’ and ‘columns’ sections
Open “Cells” window and Select
Percentages
Click “OK”
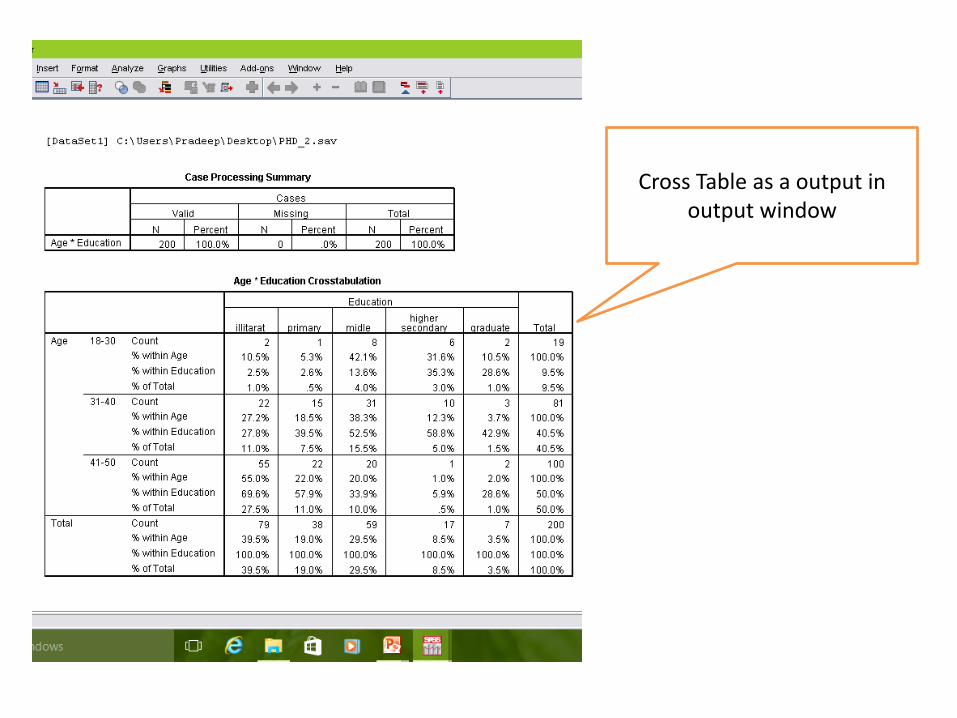
Cross Table as a output in output window
• Crosstabs are used to examine the relationship between two variables.
• It shows the intersection between two variables and reveals how the two interact with each other.
Which percentage can be use……within row? within column? or within total?
This will determined by your objects or hypothesis ….
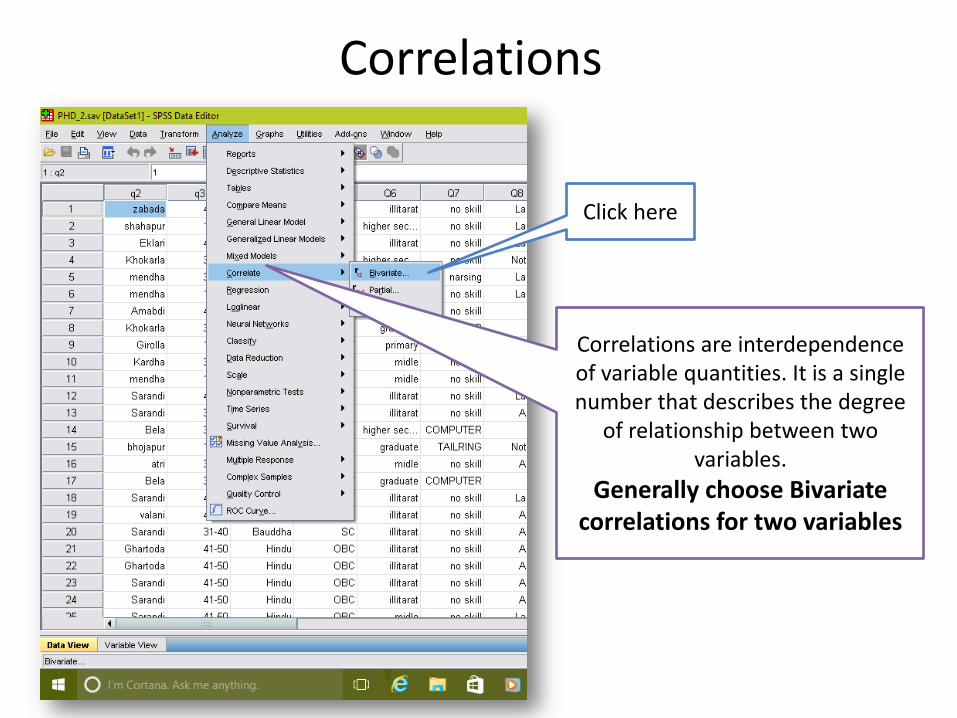
Correlations
Correlations are interdependence of variable quantities. It is a single number that describes the degree
of relationship between two variables.
Generally choose Bivariate correlations for two variables
Click here
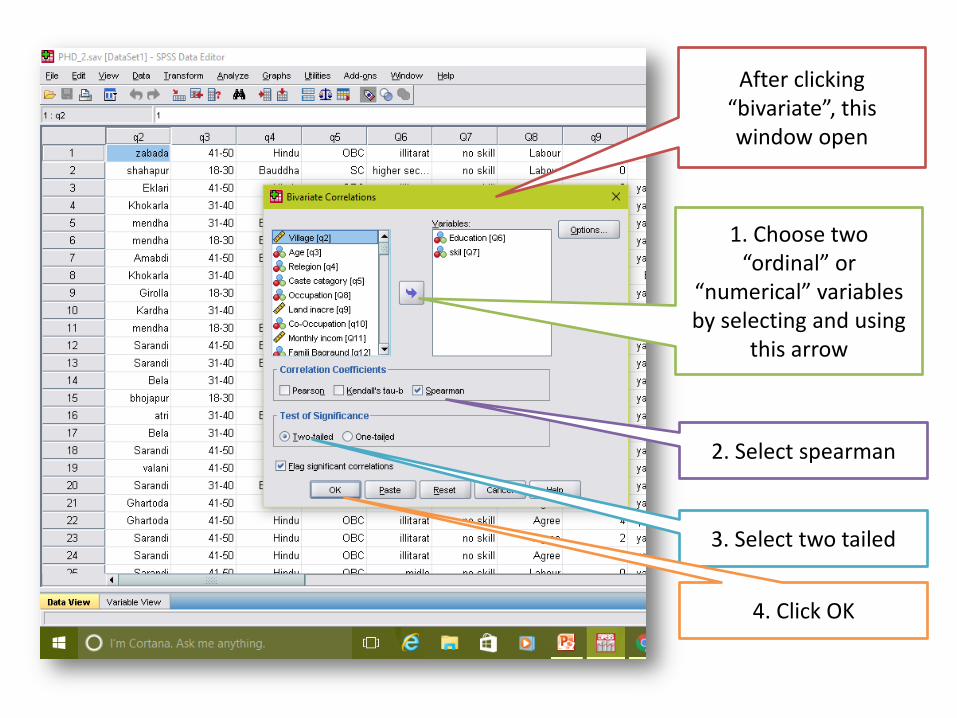
After clicking “bivariate”, this window open
1. Choose two “ordinal” or
“numerical” variables by selecting and using
this arrow
2. Select spearman
3. Select two tailed
4. Click OK
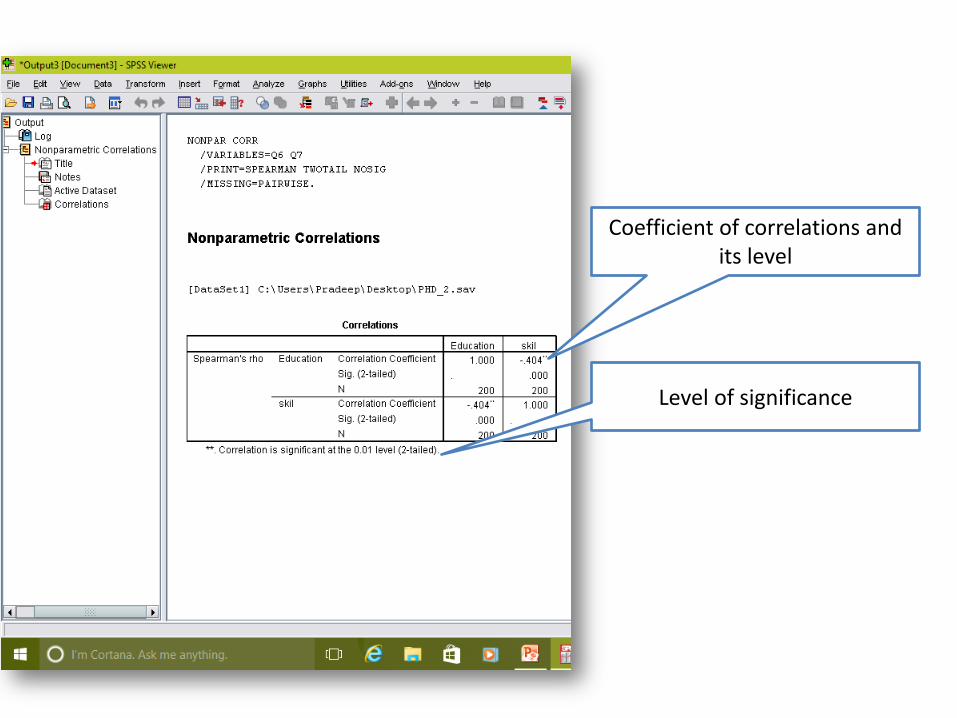
Coefficient of correlations and its level
Level of significance

Non-parametric test Spearman’s rho (r)
r = + 0.0 to 1.0
Magnitude
Direction
The strength of the linear relationship is determined by the distance of the correlation coefficient (r) from zero.
0.0 means no correlation and 1.0 is perfect correlation.
Negative means reciprocal relationship & positive means proportional relationship.
It replace to chi square test (chi square test not provide direction as well as strength. So Spearman’s rho replace to Pearson's chi square)
It use for testing of hypothesis where data is non-parametric