bellwork 1. if a distribution is skewed to the right, which of the following is true? a) the mean...
TRANSCRIPT

Bellwork
1. If a distribution is skewed to the right, which of the following is true? a) the mean must be less than the median b) the mean and median must be equal c) the mean must be greater than the median d) the mean is either equal to or less than the median
2. Which of the following statements are true? (Check one)
I. Categorical variables are the same as qualitative variables. II. Categorical variables are the same as quantitative variables. III. Quantitative variables can be continuous variables.
(A) I only (B) II only (C) III only (D) I and II (E) I and III

Graphical DisplaysComparing Distributions

Notes
✤ Population of Interest: Entire collection of individuals or objects about which information is desired
✤ Sample: Subset of the population, selected for the study
✤ Numerical (Quantitative): Observations are numbers
✤ Discrete: Isolated Points, counting numbers ex. price of textbooks
✤ Continuous: Entire Intervals, real numbers ex. actual weight/length
✤ Categorical (Qualitative): Observations are categories

Examples
1) The number of statistics students who do their homework each day
2) The area code of U of A student’s cell phone numbers
3) The amount of gas used to fill up a car

Dot Plots
✤ Dotplots:
✤ Quantitative Data
✤ Discrete or Continuous
Pie Chart
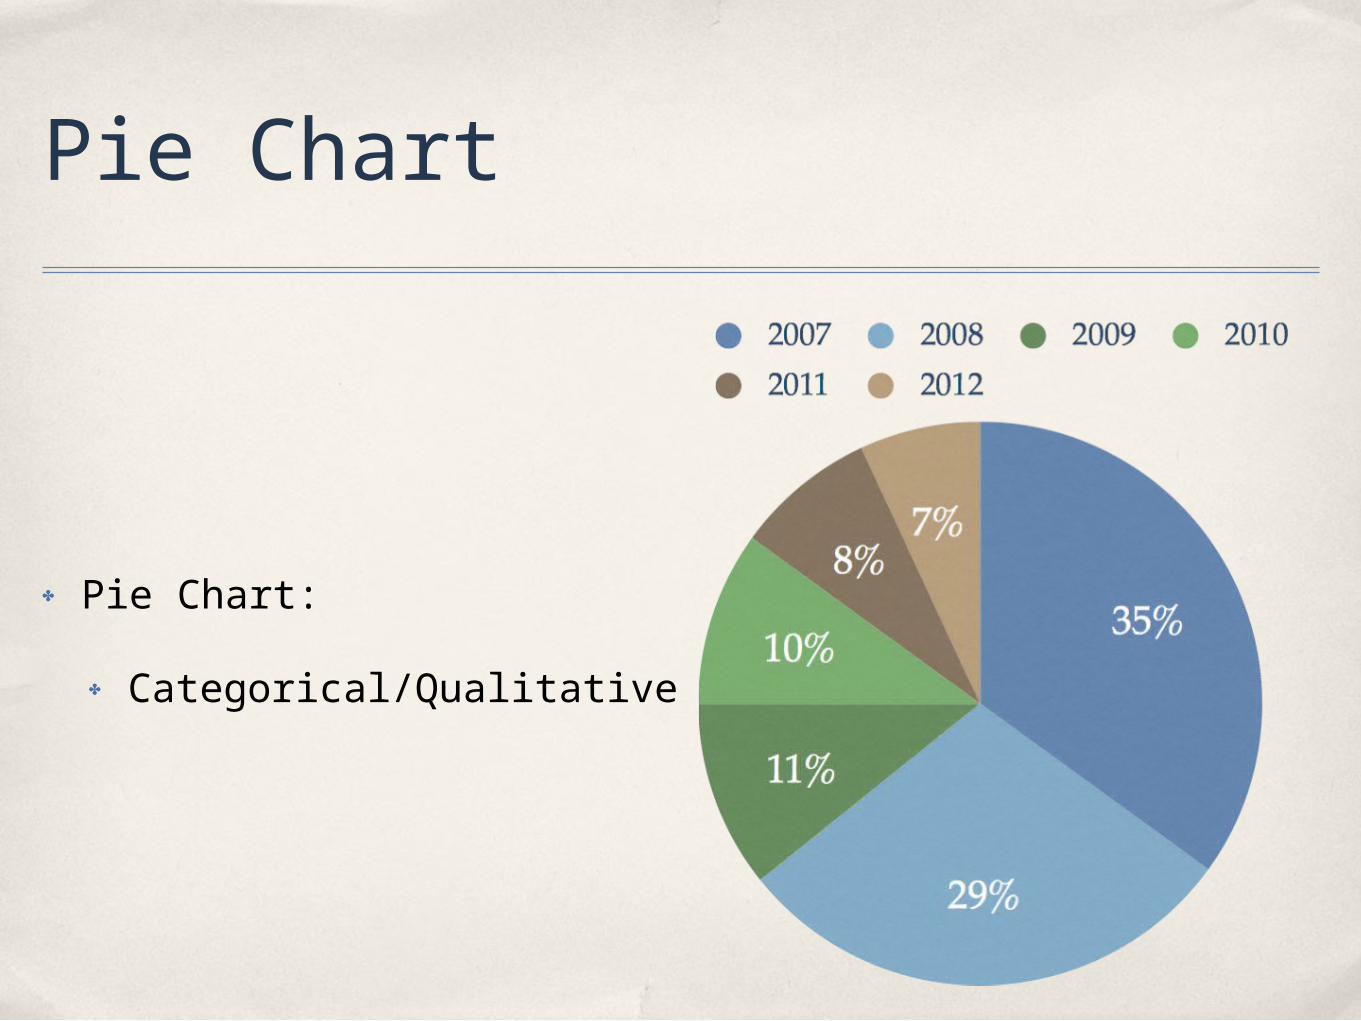
✤ Pie Chart:
✤ Categorical/Qualitative Data

Bar Chart
✤ Bar Chart:
✤ Used for categorical data
✤ The bars do not touch
✤ The bars should be the same width

Segmented Bar Graph
The table shows the maximum marks scored by grade 6, 7, and 8 students in math. Which of the following is the correct stacked bar graph for the table shown

Histogram
✤ Histogram:
✤ Used for quantitative data
✤ Bars often touch
✤ Bars represent a wide range of values
✤ Shape, center, and spread can be seen
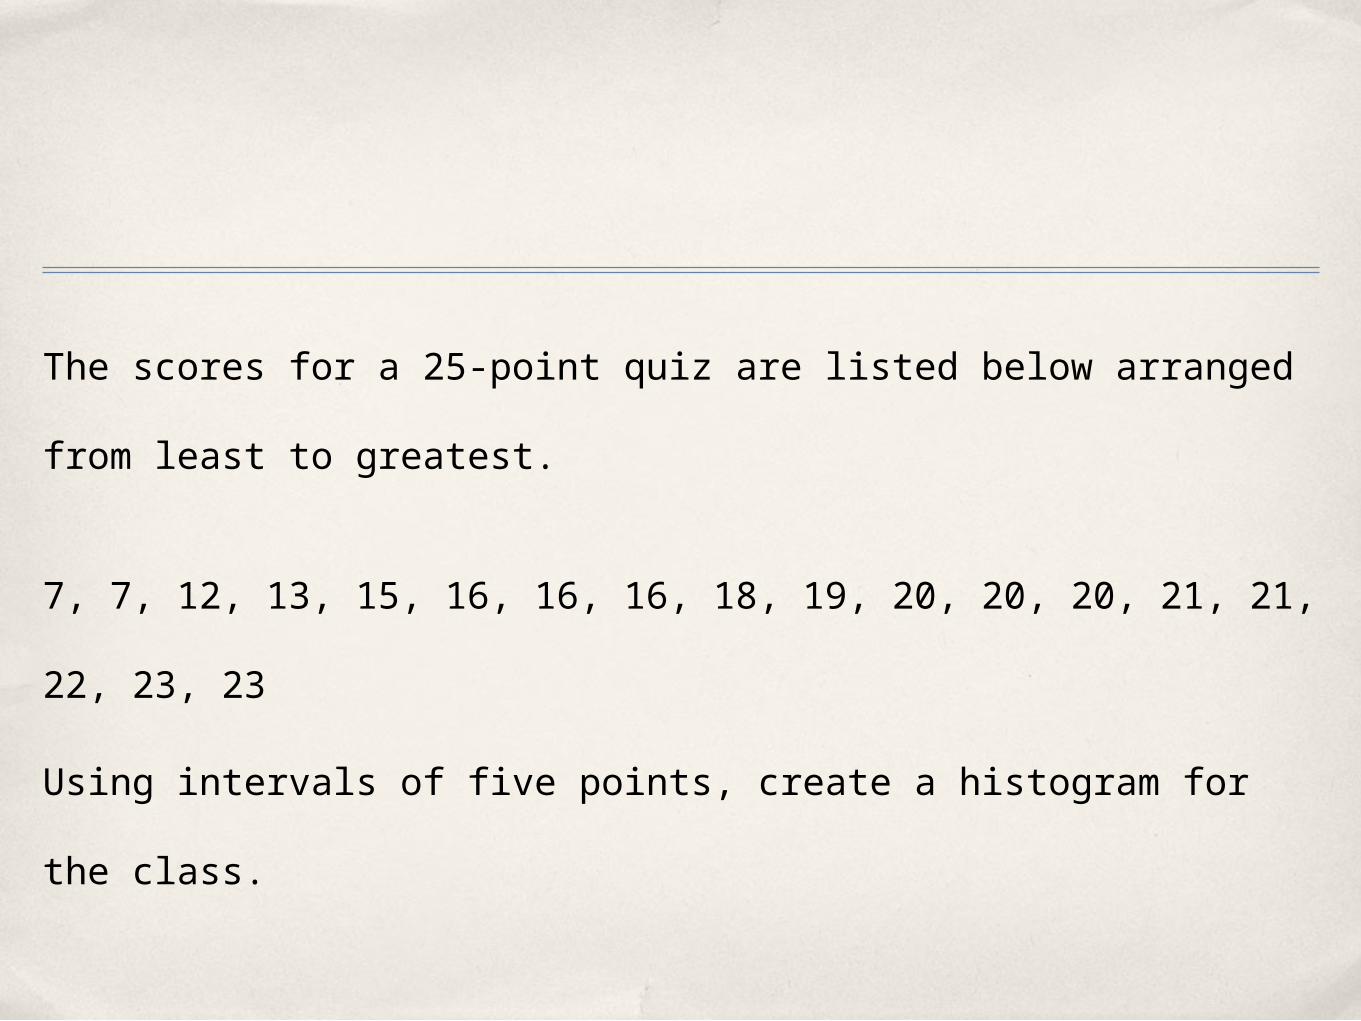
The scores for a 25-point quiz are listed below arranged from least to greatest.
7, 7, 12, 13, 15, 16, 16, 16, 18, 19, 20, 20, 20, 21, 21, 22, 23, 23
Using intervals of five points, create a histogram for the class.

Histogram Solution
7, 7
12, 13
15, 16, 16, 16, 18, 19
20, 20, 20, 21, 21, 22, 23, 23,

Mode
✤ Mode: The general shape of the histogram showing how many peaks there are in the data set
✤ Unimodal: One peak
✤ Bimodal: Two peaks
✤ Multimodal: Numerous peaks

Skewness
✤ Mean is pulled in the direction of the skew
✤ No Skew: Median, mean, and mode are equal
Steam and Leaf
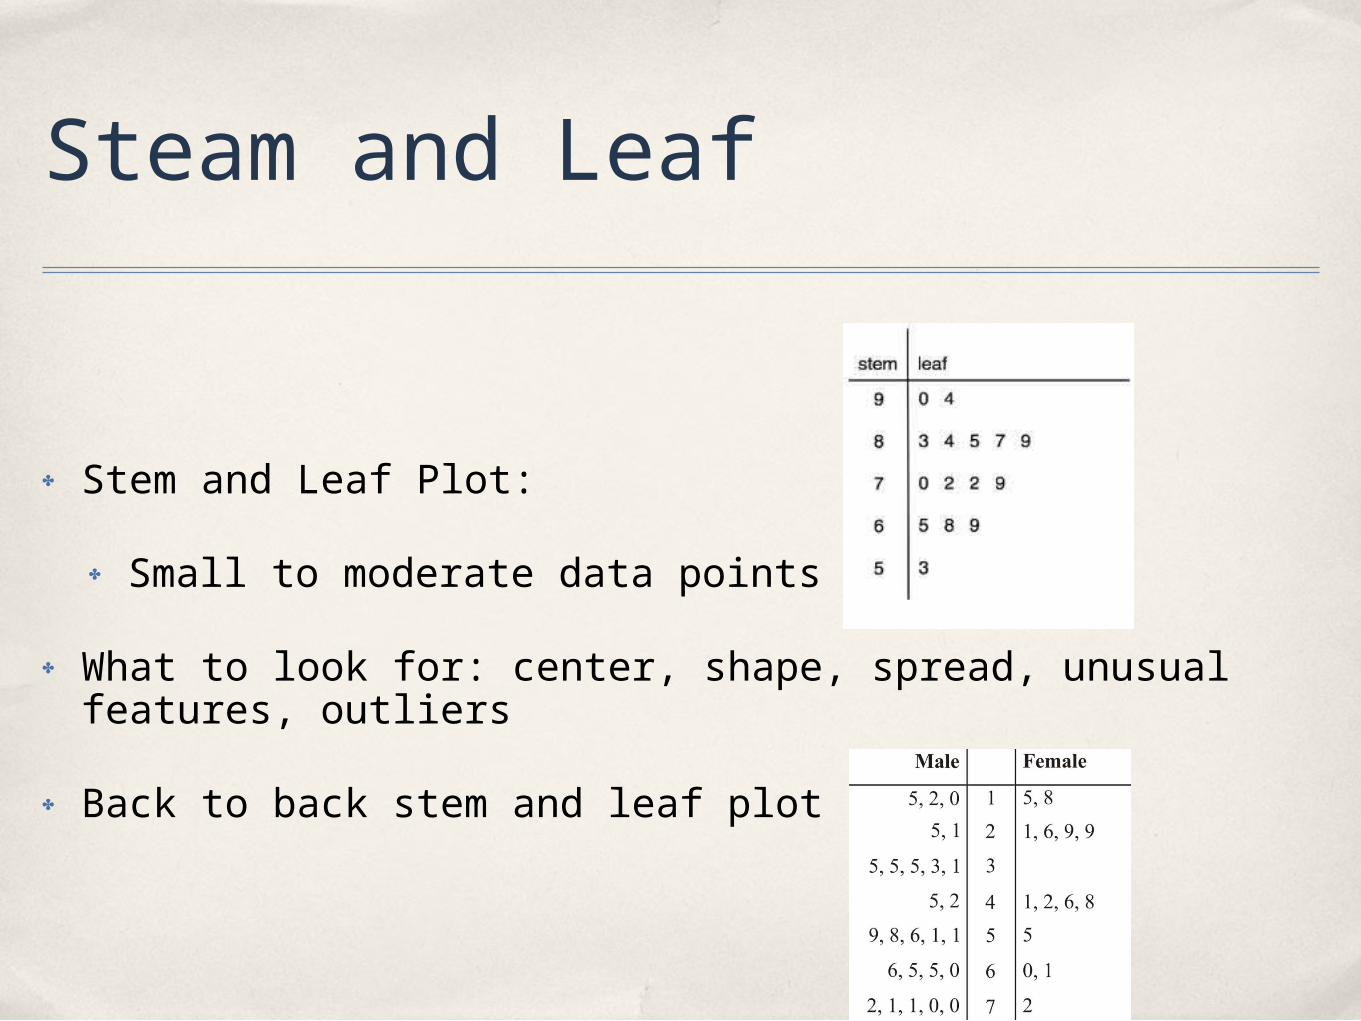
✤ Stem and Leaf Plot:
✤ Small to moderate data points
✤ What to look for: center, shape, spread, unusual features, outliers
✤ Back to back stem and leaf plot

Example:
Make a stem-and-leaf plot out of this set of data and analyze the center, shape and spread.
16, 22, 33, 41, 42, 41, 41, 40, 27, and 18

Box Plots
Skeletal Box Plot Parallel Box Plot

Outliers
✤ Interquartile Range:
✤ Mild Outlier:
✤ Q1 - (1.5)(IQR)
✤ Q3 + (1.5)(IQR)
✤ Extreme Outlier:
✤ Q1 - 3(IQR)
✤ Q3 + 3(IQR)
upper quartile - lower quartile =IQR

Check for outliers in the set of data and create a box plot. 21, 23, 24, 25, 29, 49, and 33.
Find the IQR. Since there are seven values in the list, the median is the fourth value, so Q2 = 25.
The first half of the list is 21, 23, 24, so Q1 = 23
The second half of the list is 29, 33, 49, so Q3 = 33.
IQR = 33 – 23 = 10.
Mild Outlier: below 8, above 38
Extreme Outlier: below -7, above 63


Frequency
Frequency: How many times something occurs
Relative Frequency: Ratio of times something occurs
92 people were asked how they got to work: 35 used a car, 42 took public transport, 8 rode a bicycle, 7 walked
The Relative Frequencies (to 2 decimal places) are:
•Car: 35/92 = 0.38
•Public Transport: 42/92 = 0.46
•Bicycle: 8/92 = 0.09
•Walking: 7/92 = 0.08