springfield to quantico enhanced public transportation
TRANSCRIPT

Springfield to Quantico Enhanced Public Transportation Feasibility Study Technical Advisory Committee Meeting #9August 26, 2021
Meeting Agenda
• Introductions / Welcome • Public and Stakeholder Outreach Status• Summary of Evaluation Results• Sensitivity Tests• Land Use Assessment• Next Steps – Future TAC Meetings
2

Study Technical Approach
3
Project Needs Statement
Which conditions are we trying to address?
Definition of Transit Alternatives
Alignment, Stations, Operations
Study Recommendations
Testing and Evaluation of Transit Alternatives
Ridership, Evaluation Measures, Costs
Publ
ic/A
genc
y Pa
rtic
ipat
ion
Prog
ram
Definition of Land Use Scenarios Planned Growth, Activity Centers,
Station Area Opportunities
Testing and Evaluation of Land Use Scenarios
Ridership Impacts, Fiscal Impacts

Study Schedule
4
Baseline Needs Assessment Alternatives Developmentand Evaluation
Study Recommendations
June 2021 - Sept. 2021

Public and Stakeholder Outreach
5

Outreach Status
6
• Completed Activities• Virtual Public Meeting (July
27th)• Upcoming Activities
• Elected Officials Briefing -September
• 3rd Round Virtual Public Meetings – September 21st
and 23rd
http://www.drpt.virginia.gov/transit/springfield-to-quantico/

September Public Meetings
• Key Objectives:o Summarize findingso Show impact of land
use assumptionso Provide context on next
steps for future investment
• Pop-ups will be held to distribute flyers
• Help us get the word out!
7

Summary of Evaluation Results
8

How will we evaluate feasibility?
9

Summary of Evaluation Results
10
* Additional Service Above Transforming Rail in Virginia Improvements Included in Baseline
Goal Measure
Additional Express Bus Service
BRT Extension
Additional VRE Service*
Metrorail Blue Extension
Metrorail Yellow Extension
Total Transit Boardings 71,000 80,600 69,900 77,900 76,900 New Transit Boardings 1,100 10,700 - 8,000 7,000 New Transit Trips 953 4,696 256 10,592 15,034 Change in Transit PMT 50,674 103,952 19,831 408,917 462,541
Congestion Mitigation Change in Congested VMT (25,617) (45,094) (18,607) (131,780) (180,391)
Walk Access to Population 31,796 62,038 18,014 37,288 72,486Walk Access to Jobs 20,431 37,555 12,051 41,827 34,285Change in Regional Job Accessi 0.0% 1.2% 0.4% 6.8% 7.2%Change in Access to Job Center 0.5% 5.4% 0.4% 12.0% 20.6%
New EEA Transit Trips 520 2,599 153 4,346 9,122 Change in EEA Job Accessibility 0.0% 2.2% 1.0% 7.1% 9.9%
Cost per Rider 4.58$ 40.19$ 342.87$ 159.50$ 103.69$ Cost per Transit PMT 0.13$ 1.89$ 7.09$ 5.24$ 4.74$
Ridership Potential
Regional Accessibility
Equity
Cost-Effectivness

Summary of Evaluation Results
11
Additional Express
Bus
BRTExtension
Additional VRE
Service*
Metrorail Blue
Metrorail Yellow
Ridership Potential
Congestion Mitigation
Regional Accessibility
Equity
Cost-Effectiveness
* Additional Service Above Transforming Rail in Virginia Improvements Included in Baseline

Sensitivity Tests
12
• Can we make the alternatives more cost efficient by shortening the alignment?
• What might happen to ridership if people keep teleworking?
• How would significant changes in land use change ridership forecasts?

Shorter Alignments
13

Shorter Alignments• Remember: Initial model results showed very low ridership for BRT and
Metrorail stations south of Potomac Town Center and low cost efficiency
14
Across all three alternatives, all stations south of Potomac Town Center have less than 700 daily boardings

Sensitivity Test: Truncated Yellow Line
15

Sensitivity Test: Truncated Blue Line
16

Sensitivity Test: Truncated BRT
17

Truncated Alignments
BRT Metrorail Blue Metrorail Yellow
Line Ridership -3,200 (-14%) -1,000 (-4%) -900 (-3%)
Total Corridor Transit Boardings
-3,100 (-4%) -- --
New Transit Trips in Study Corridor
-1,600 (-32%) -1,400 (-10%) -1,300 (-6%)
Cost per Rider +$0.67 (+2%) -$27.29 (-16%) -$20.17 (-18%)
18
Key Sensitivity ResultsChange as compared to Full Alignments
Can we make the alternatives more cost efficient by shortening the alignment?
Telework
19

Telework Assumptions – 2019 Base
2019 Base telework conditions – (MWCOG SOC Survey 2019)
• In 2019, 35% of regional workers teleworked regularly or occasionally vs 19% in 2007
• On a typical day in 2019, roughly 8.6% of regional workers teleworked
• 33% of Fairfax/Prince William workers teleworked 1.1 days/week, a similar frequency to other regional workers
20
0%
10%
20%
30%
40%
50%
2007 2010 2013 2016 2019
19%25% 27%
32% 35%

Telework Assumptions – 2045 Potential
• TW increased substantially during the pandemic – estimated that 60-65% of regional workers worked at home, similar to the theoretical potential from the 2019 SOC Survey.
• Regional/national data suggest post-pandemic TW will be higher than pre-pandemic, so 2045 telework likely will fall between the 2019 level and the 60% potential:
• 2045 assumptions lead to nearly three in ten work trips eliminated by TW: Survey data suggest an upper limit of 2 days per week average telework
frequency.
21

Telework Sensitivity Tests
22
Future Telework AssumptionBRT Alternative
Ridership Impact
Metrorail Alternatives
Ridership Impact
Low45% telework an average 1.1
days/wk -1,900 (-8%) -5,000 (-12%)
Medium50% telework an average 1.3
days/wk -2,800 (-12%) -7,200 (-18%)
High55% telework an average 1.5
days/wk -4,000 (-17%) -10,600 (-26%)
What might happen to ridership if people keep teleworking?
Key Sensitivity ResultsChange as compared to Initial Results
Land Use
23
Land Use Scenario Assumptions
• All of our initial model results used MWCOG Cooperative Land Use
Forecasts for 2045.
• This sensitivity analysis looked at two different land use scenarios that
increased densities around the station areas
24
How would significant changes in land use change ridership forecasts?
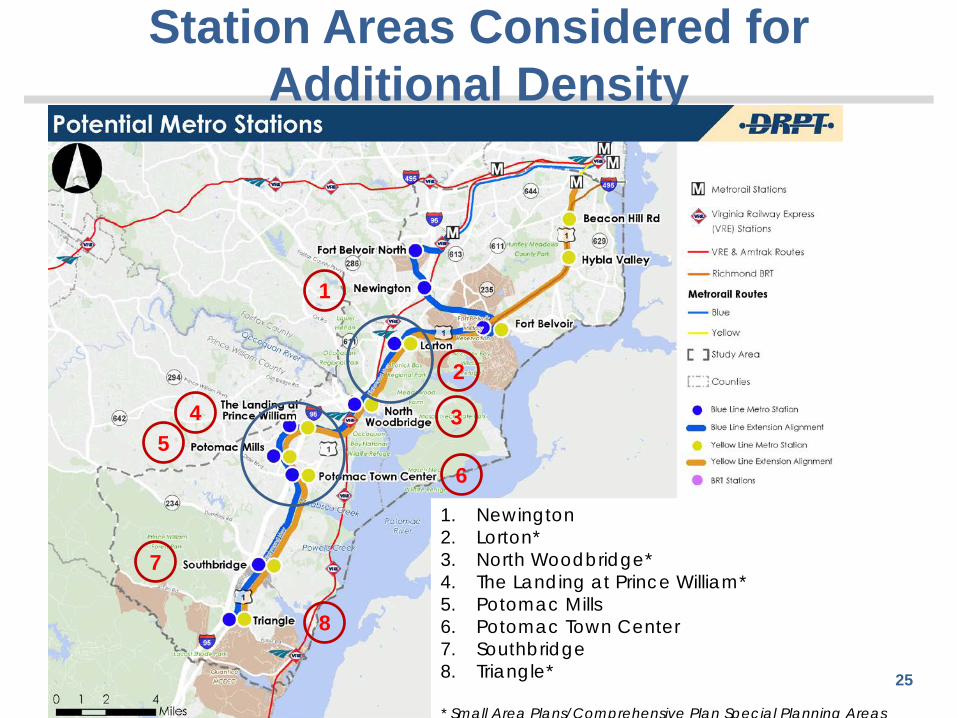
Station Areas Considered for Additional Density
7
65
4 3
1
2
1. Newington2. Lorton*3. North Woodbridge*4. The Landing at Prince William*5. Potomac Mills6. Potomac Town Center7. Southbridge8. Triangle*
* Small Area Plans/Comprehensive Plan Special Planning Areas
8
25

26
Density Assumptions and Place Type
Source: DRPT Multimodal System Design Guidelines (2020)
For each station area, identified current and planned (MWCOG Forecasts) place types based on activity density

WMATA Ridership Thresholds: Suburban Metrorail
27
Criteria MetricThresholds
Low Medium High
Density
Population Density (People per Acre) < 31.7 31.7 – 47.5 > 47.5
Employment Density (Jobs per Acre) < 19 19 – 26 > 26
Activity Density (People + Jobs) < 50.7 50.7 – 73.5 > 73.5
Ridership Ridership per Mile < 3,500 3,500 – 7,000 > 7,000
No. Station LocationPopulation Density
(1 Mile Radius)(People/Acre)
Employment Density
(1 Mile Radius)(People/Acre)
Activity Density (1 Mile Radius)
(People + Jobs/Acre)Place Type
1 Beacon Hill Road** Fairfax County, VA 10.6 1.8 12.4 P4
2 Hybla Valley** Fairfax County, VA 12.4 2.1 14.5 P4
3 Fort Belvoir Fairfax County, VA 2.4 0.7 3.1 P-MB
4 Fort Belvoir North Fairfax County, VA 4.0 2.4 6.4 P-MB
5 Newington Fairfax County, VA 3.9 5.7 9.6 P4
6 Lorton** Fairfax County, VA 6.8 1.5 8.3 P3
7 North Woodbridge** Prince William County, VA 6.0 1.3 7.3 (26.7 – 40.0)** P4
8 The Landing at Prince William** Prince William County, VA 7.1 2.5 9.6 (11.0 – 23.0)** P4
9 Potomac Mills Prince William County, VA 4.4 5.9 10.3 P4
10 Potomac Town Center Prince William County, VA 6.8 4.0 10.8 P3
11 Southbridge Prince William County, VA 4.2 0.9 5.1 P3
12 Triangle** Prince William County, VA 2.6 0.5 3.1 (6.7 – 18.0)** P3
** Higher Density proposed in Small Area Plans
Source: Transit Corridor Expansion Guidelines (2015)Ridership per Mile = Total Number of Daily Entries/Number of Miles of Extension
Existing (and Planned) Density at Potential Stations in Study Area

2828
Land Use Intensity Thresholds Inputs for Urban Footprints Scenario Modelling
Place Type & Transect Zone Description
Net floor area ratio (FAR)
Gross residential density (du/ac)
Gross population density (pop/ac)
Gross employment density (emp/ac)
Gross Activity Density (pop+emp
per ac)
Gross parking density (spcs/1000
sq ft)T-1Very low intensity 0.02 0.10 0.22 0.40 0.62 2.24T-2Low intensity 0.12 1.18 2.14 1.67 3.81 1.97T-3Moderate intensity 0.28 4.69 8.11 4.64 12.75 1.7T-3.5Moderate intensity 0.59 12.20 21.01 8.23 29.24 2.07T-4Moderate intensity 0.91 17.96 30.92 12.47 43.39 1.67T-4.5Moderate-to-high intensity 1.36 32.03 54.55 22.52 77.07 1.78T-5High intensity 1.75 42.79 72.88 29.52 102.40 1.66T-5.5High intensity 2.21 54.43 92.69 37.04 129.73 1.52T-6High intensity 3.15 76.59 129.84 59.98 189.82 1.27
Place type T-4.5 (or higher) achieves the Metro guideline of > 50 activity density.

29
Land Use Assumptions - BRT Scenario
BRT Scenario
BRT Scenario Place TypesNo. Station Name Place Type
Quarter Mile Quarter to Half Mile Half to One Mile1Newington T-4.5 T-4 T-42Lorton T-4.5 T-3.5 T-33North Woodbridge T-4 T-4 T-44The Landing at Prince William T-3.5 T-3.5 T-45Potomac Mills T-4.5 T-4 T-46Potomac Town Center T-4.5 T-4 T-47Southbridge T-3.5 T-3 T-28Triangle T-3 T-3 T-2

30
Land Use Assumptions - Metrorail Scenario
Metro Scenario
Metro Scenario Place TypesNo. Station Name Place Type
Quarter Mile Quarter to Half Mile Half to One Mile1 Newington T-4.5 T-4 T-42 Lorton T-5 T-4 T-33 North Woodbridge T-5 T-4.5 T-44 The Landing at Prince William T-4 T-4 T-45 Potomac Mills T-5 T-4 T-46 Potomac Town Center T-5 T-4 T-47 Southbridge T-4 T-3.5 T-38 Triangle T-4 T-3 T-3

Metrorail Scenario by Station
31
Station Name2045
Baseline Population
2045 Baseline
Jobs
Metrorail Scenario
Population
Population Increase
Metrorail Scenario Jobs
Jobs Increase
Metrorail Scenario
Activity Density
Newington 12,700 28,600 56,500 344% 26,700 -7% 27.3Lorton 18,400 6,100 25,200 37% 13,500 123% 7.8 North Woodbridge 28,200 5,700 47,700 69% 18,900 229% 27.6 The Landing at Prince William
26,300 10,00 55,200 110% 22,600 126% 30.3
Potomac Mills 15,400 14,800 43,800 185% 19,800 34% 29.9 Potomac Town Center
27,700 10,600 62,200 124% 23,400 121% 27.4
Southbridge 28,500 6,400 33,400 17% 11,900 86% 11.4 Triangle 11,300 1,300 12,000 6% 5,300 312% 8.2 Yellow Total 155,900 54,900 279,500 79% 115,400 110%Blue Total 168,600 83,500 336,000 99% 142,000 70%
WMATA’s threshold for Activity Density is 50.7

Land Use Impacts on Ridership
Residents Added to Station Areas
Jobs Added to Station Areas
Ridership Increase
Blue Line Alternative
167,000 (99%) 59,000 (70%) 16,700 (76%)
Yellow Line Alternative
124,000 (79%) 61,000 (110%) 12,600 (38%)
BRT Alternative 134,000 (79%) 45,000 (53%) 7,500 (33%)
32
Key Sensitivity ResultsChange as compared to Initial Results
How would significant changes in land use change ridership forecasts?

Land Use Assessment
33

Potomac Mills Multimodal District – Analysis
34
Multimodal District Basemap
Existing Land Use Existing Transit Network Existing Ped/Bike Facilities
Street Network Figure Ground – Building Footprints

Potomac Mills Multimodal District – TOD Framework
35

36
TOD Readiness Best Practices• Land Use & Zoning
o TOD supportive zoning + urban
design guidelines
o Design reviews
o Station Area Plans
• Transportationo Arterials as Multimodal Corridors
o Network of walkable streets with
small blocks
o Ped/Bike Network
o Feeder Transit/Shuttle Service
o Micromobility
o TDM + Shared Parking
• Implementation
o TOD Rezoning
o Project implementation through development
projects
o District-wide funding mechanisms
o Process/Framework for Property Consolidation

Case Studies
Tysons, Fairfax County, VA Dunn Loring + Mosaic District, Fairfax County, VA
37
Pike & Rose and White Flint, Montgomery County, MD Assembly Square, Sommerville, MA

Discussion & Meeting Wrap-Up
38

Schedule for Future TAC MeetingsTAC #
Month Topics to Be Covered
10 Sept/Oct 2021
• Summary of Transit Alternatives and Land Use Assessment• Draft Study Findings and Recommendations
39