spring training : correcting common mistakes regular season : cutting costs/become a hero
DESCRIPTION
Spring Training : Correcting Common Mistakes Regular Season : Cutting Costs/Become a Hero Post Season : Raising your Batting Average. Naomi Robins Consultant and seminar leader on effective data presentation Principal, NBR Phone : (973) 694 - 6009 e-mail : [email protected] - PowerPoint PPT PresentationTRANSCRIPT

Spring Training: Correcting Common Mistakes
Regular Season: Cutting Costs/Become a Hero
Post Season: Raising your Batting Average
Visual Analysis: The Value of Graphics for Risk Communications - RMG2111

Richard Denning President, Shelter Island Risk Services
Phone: (631) 749-1535 e-mail: [email protected]
Website: http://www.shelterislandrisk.com/
Libby Christman Vice President of Risk Management, Ahold USA
Phone: (717) 240 - 5573 e-mail: [email protected]
Website: http://www.Ahold.com/
Naomi RobinsConsultant and seminar leader on effective data presentationPrincipal, NBR
Phone: (973) 694 - 6009 e-mail: [email protected]
Website: http://www.NBR-Graphs.com/
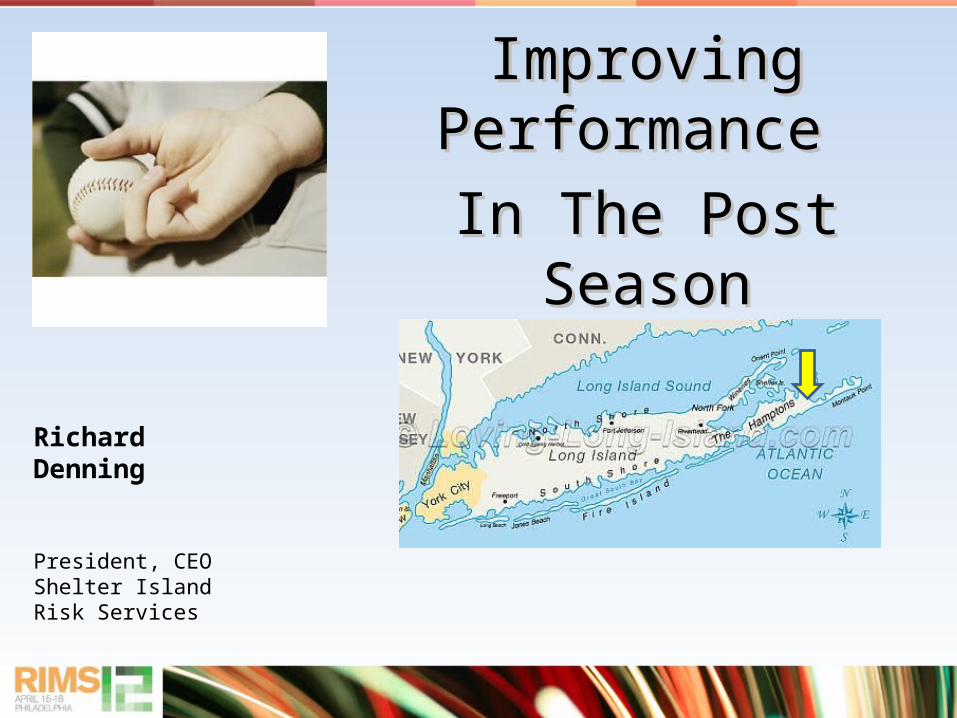
Improving Performance Improving Performance In The Post SeasonIn The Post Season
Richard Denning President, CEOShelter Island Risk Services

Adapted from T. H. Davenport, J. G. Harris, Competing on Analytics

Analytics Improve Your Batting Average
• A fool is a person who expects different results when you do the same thing over and over.

Visualization deserves to move from the bottom of the batting order to clean-up
Sloan Management Review: – 58% of organizations see analytics as a
competitive advantage (2011 survey) – Up from 37% in 2010

Data
Classes of Risk Data
DataClaim Measurements
HR info on all Employees
Critical Dates
Exposures (Fleet size, miles driven,
etc.
Organization

The Analytical Payoffs
• Time
• Control
• Confidence

Play Ball!
Play Data

It’s a Team Sport
• Bounce ideas off others who bring specialist skills and experience


The Danger of Numbers!
Assume that your four Divisions: A, B, C and D
All have the same average frequency rate of 5 claims per 100 employees

The Flaw of Averages

Inspiration for Better Graphics:Naomi B. Robbins, http://blogs.forbes.com/naomirobbinsWall Street Journal for financial reportingSports Reporting for creative displaysEdward R. Tufte, The Visual Display of Quantitative Information (two other volumes)
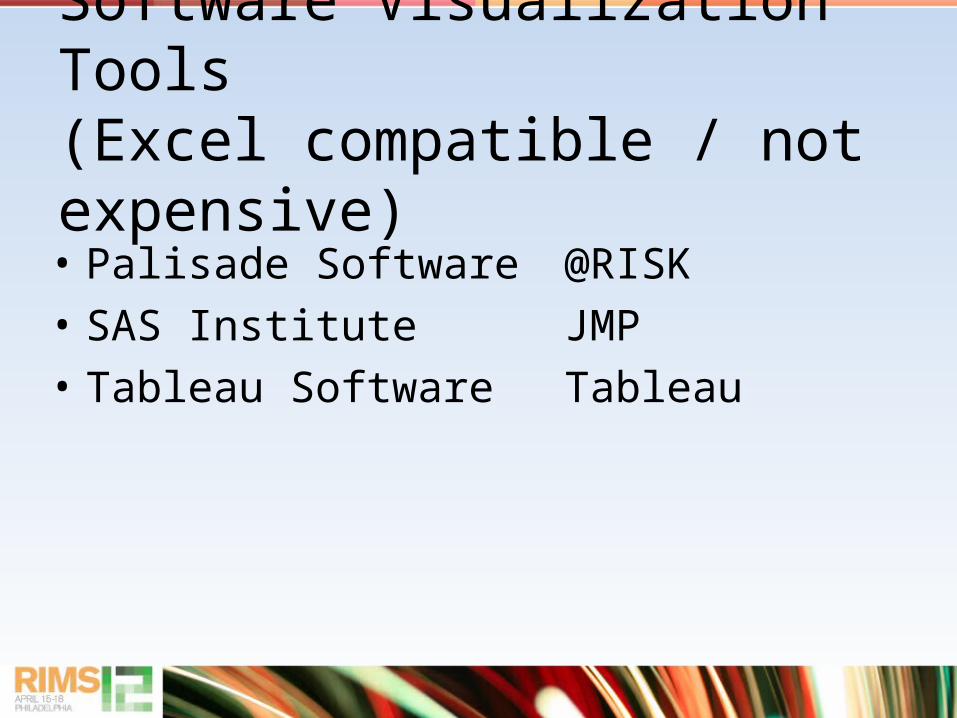
Software Visualization Tools (Excel compatible / not expensive)
• Palisade Software @RISK• SAS Institute JMP• Tableau Software Tableau

16
Concentrating information is precisely how our brains work best:
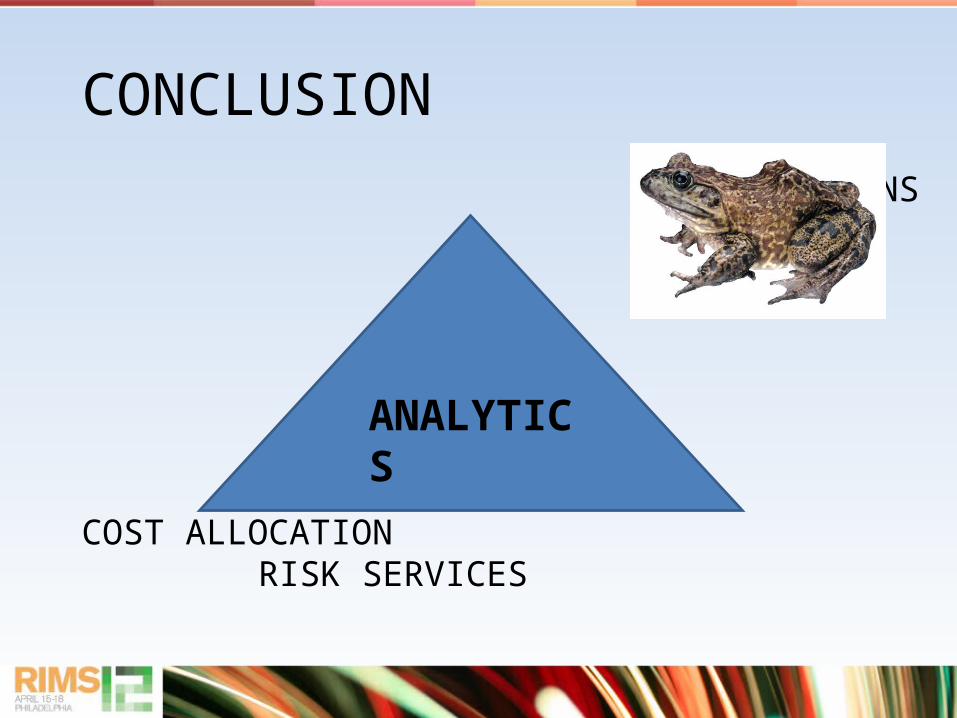
CONCLUSION
OPERATIONS
COST ALLOCATION RISK SERVICES
ANALYTICS
Questions and Answers
Visual Analysis: The Value of Graphics for Risk Communications - RMG2111