spray combustion cross-cut engine research · spray combustion cross-cut engine research lyle m....
TRANSCRIPT

Spray Combustion Cross-Cut Engine Research
Lyle M. Pickett, Scott A. SkeenSandia National Laboratories
Sponsor: DOE Vehicle Technologies OfficeProgram Managers: Gurpreet Singh and Leo Breton
FY 2017 DOE Vehicle Technologies Office Annual Merit ReviewProject ACS005, 11:30 AM, Wed. 7 June 2017
This presentation does not contain any proprietary, confidential, or otherwise restricted information.
Overview
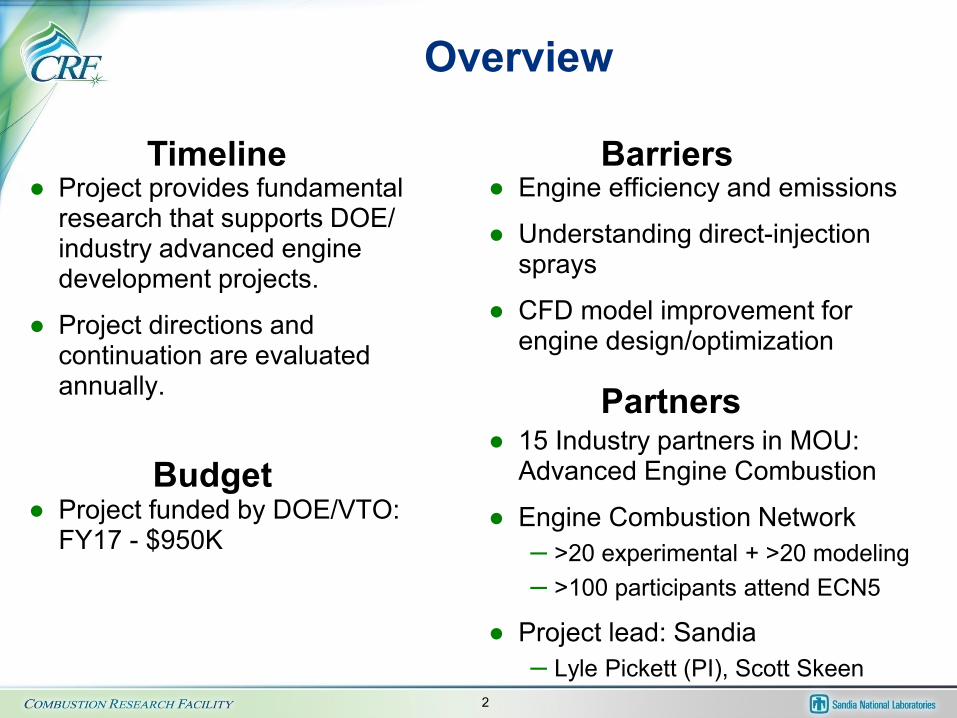
● Project provides fundamental research that supports DOE/ industry advanced engine development projects.
● Project directions and continuation are evaluated annually.
● 15 Industry partners in MOU: Advanced Engine Combustion
● Engine Combustion Network– >20 experimental + >20 modeling– >100 participants attend ECN5
● Project lead: Sandia – Lyle Pickett (PI), Scott Skeen
● Project funded by DOE/VTO:FY17 - $950K
Timeline
Budget
Barriers
Partners
● Engine efficiency and emissions
● Understanding direct-injection sprays
● CFD model improvement for engine design/optimization
2

Engine efficiency gains require fuel (DI spray) delivery optimization
● Barriers for high-efficiency gasoline– Particulate emissions– Engine knock– Slow burn rate or partial burn– Heat release control when using
compression ignition– Lack of predictive CFD tools
● Barriers for high-efficiency diesel– Particulate emissions– Heat release rate and phasing– Lack of predictive CFD, particularly for
short and multiple injections
8-hole, gasoline80° total angle
573 K, 3.5 kg/m3 573 K, 3.5 kg/m3
~15mm
θ=22.5°I/I0
0.8-1.0
High-speed microscopy at nozzle exit
3

Project Objectives – Relevance
● Provide fundamental understanding to make transient gasoline and diesel spray mixing and velocity predictive– Predictive combustion must be preceded by predictive mixing—still a weak link– Plume-plume interactions and aerodynamics leading to spray collapse– Focus on targets for with significant CFD activity as part of the Engine
Combustion Network● Provide a link between spray mixing and combustion
– Characterize vaporization, ignition, soot formation processes– Models are deficient in these areas with serious consequences on emissions
and efficiency– Guide model development and evaluation using quantitative, CFD-validation
datasets
Major objective: experimentation at engine-relevant spray conditions, allowing development of predictive computational tools used by industry
4

Experimental approach utilizes well-controlled conditions in constant-volume chamber
● Well-defined ambient conditions:– 300 to 1300 K– up to 350 bar– 0-21% O2 (EGR)
● Injector– single- or multi-hole injectors– diesel or gasoline (cross-cut)
● Full optical access– 100 mm on a side
● Boundary condition control needed for CFD model development and validation– Better control than an engine– Easier to grid
5
Approach
Project does not include a funded CFD activity
5

Responses to previous year reviewer comments
● How do your experiments actually affect CFD modeling tools:– “Better demonstration of how CVC data are used in CFD development”– “How diagnostic capabilities to quantify velocity are being used in CFD”– “How the spray data are being used in the CFD modeling should be demonstrated”– “Better specificity of precisely what data will be developed that the codes will predict should
be provided”● Clarify your collaboration in the Engine Combustion Network:
– “Many CFD collaborators are listed in the ECN but how is the “very tight coordination executed”?
– “Precise roles of the ECN collaborators were not evident”– “Are ECN participants free to define their own niche, and if not, how are they being steered
in ways that will create a synergistic whole?”● General:
– “Consider developing a diagnostics consortium across the national laboratories” – “What is being done in the area of flash-boiling sprays”?
6
Collaborative research through the Engine Combustion Network accelerates CFD model development
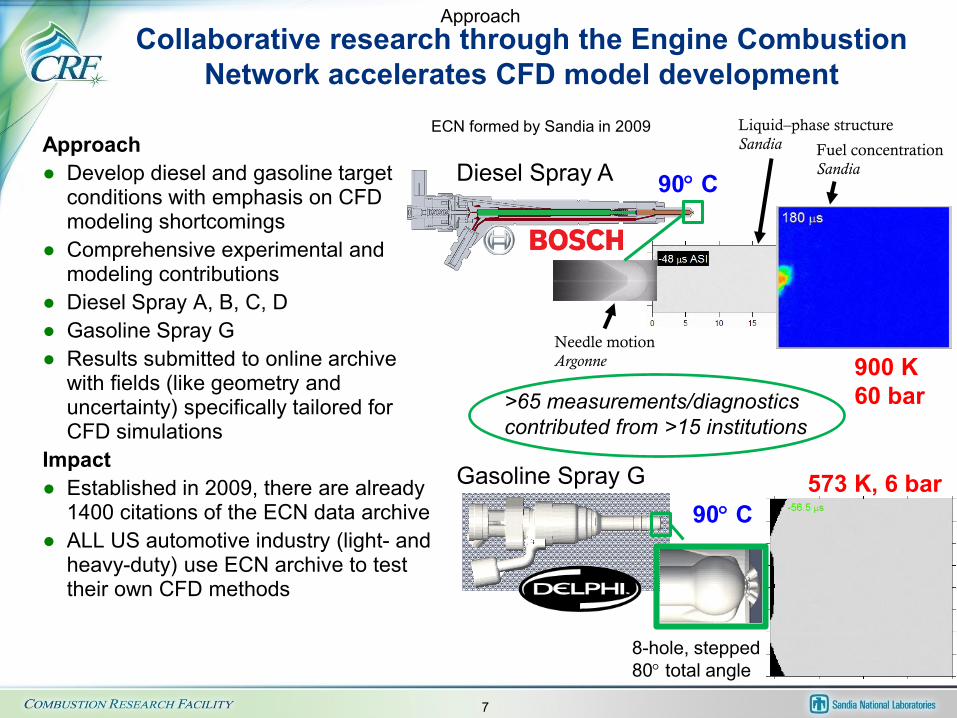
Approach● Develop diesel and gasoline target
conditions with emphasis on CFD modeling shortcomings
● Comprehensive experimental and modeling contributions
● Diesel Spray A, B, C, D ● Gasoline Spray G● Results submitted to online archive
with fields (like geometry and uncertainty) specifically tailored for CFD simulations
Impact ● Established in 2009, there are already
1400 citations of the ECN data archive● ALL US automotive industry (light- and
heavy-duty) use ECN archive to test their own CFD methods
8-hole, stepped80° total angle
Gasoline Spray G 573 K, 6 bar90° C
Needle motionArgonne
Fuel concentrationSandia
Liquid–phase structureSandia
Diesel Spray A 90° C
900 K60 bar>65 measurements/diagnostics
contributed from >15 institutions
Approach
ECN formed by Sandia in 2009
7

ECN Workshop Activities
● Most recent workshop: ECN5 held Apr 2017 at Wayne St. Univ. (Thank you to local host Marcis Jansons)
● Sandia contributes experimental data to all topics
● Topic organizers establish guidelines a year in advance of in-person workshop
● Organizers gather experimental and modeling data, perform analysis, understand differences, provide expert review
● Sandia PIs have deep, specific engagement in CFD efforts
● Monthly web meetings are held to provide individual institutions the opportunity to present their ECN work
Approach
ECN5 TopicsInternal flow dieselNear-nozzle dieselEvaporative dieselReactions and ignitionDiesel combustionSootMulti-hole dieselInternal flow gasolineEvaporative gasoline
Skeen
Pickett
Lagrangian or Eulerian simulations data request::- Priority for Spray G, G2, G6, G4 conditions- Provide liquid/vapor axial penetration with respect to time Liquid (liquid volume fraction = 0.1%) Vapor axial penetration (fuel mixture fraction = 0.01)At 0.1-2ms (or max) in 0.1 ms steps, provide at axial positions z=2,15,10 mm. 3 component gas and liquid velocities Total liquid and vapor fuel mixture fraction (mass of liquid fuel and vapor fuel/mass of all mixture) mass liquid fuel / volume (not liquid density) total mixture density (fuel and all other gases / volume) Sauter mean diameter droplet size- At 0.1-2ms (or max) in 0.1 ms steps provide at the side view “primary” and “secondary” cut planes (0-40 mm or domain max). ....
Snippet from Spray G“evaporative gasoline” guidelines
organizerrole
8

Approach - Milestones Jul 2016
Using high-speed and formaldehyde imaging, analyze the effects of cool flame on high-temperature ignition
Aug 2016Investigate effect of fuel type and blend on liquid structure at “supercritical” conditions
Sept 2016Apply extinction imaging to define plume centers and their interaction in multiple-injection gasoline direct injection scenarios
Nov 2016Research visit to continuous-flow chambers at GM & Caterpillar to obtain statistically resolved quantities of soot extinction, ignition, and lift-off length for CFD comparison
Dec 2016Analyze high-speed planar mixing measurements for mixture at ignition
Mar 2017Conduct ECN5, performing analysis of the state-of-the art experiment and CFD with respect to gasoline spray modeling and diesel (ignition & lift-off length) soot formation
● May 2017Apply filtered-Rayleigh scattering for Spray G (multi-hole gasoline) vapor concentration
● Jul 2017Use long-distance microscopy and high-speed imaging to investigate soot formation due to poorly atomized droplets and fuel films remaining on GDI injectors
9

Optimization and standardization of DBI setup for liquid and soot
New DBI setup performance
Liquid
Soot
(Sandia Spray A)
Liquid(Sandia Spray G)
Liquid
Soot
(Sandia Spray A)
(Sandia Spray G)
DBI: Diffused Back Illumination+0.15
-0.15
KL
+0.15
-0.15
KL
Old setup showsevidence of beam-steering
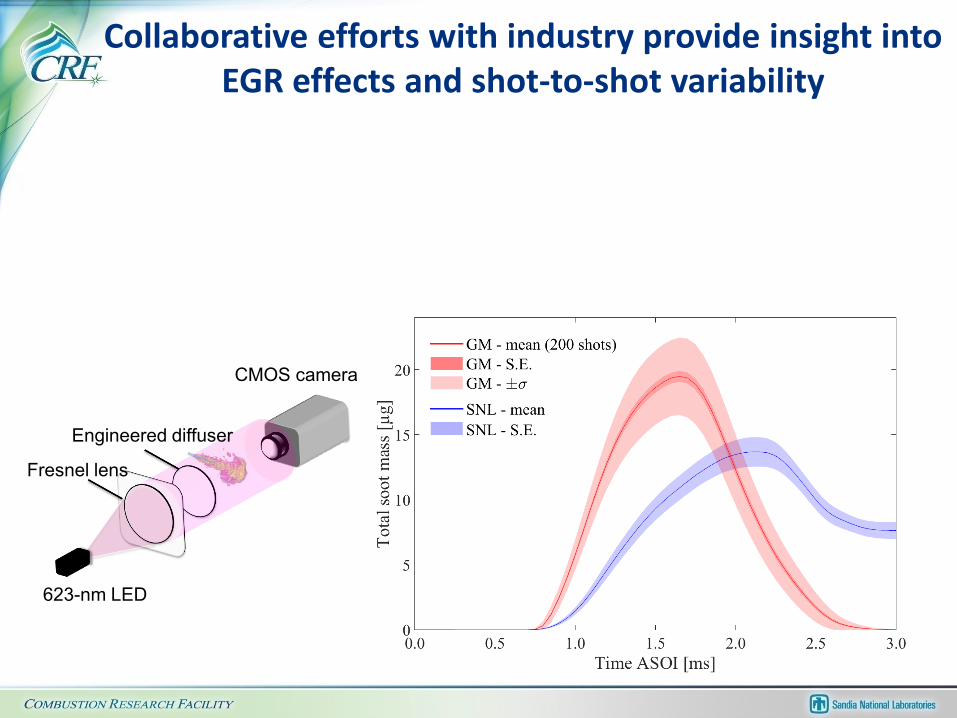
Collaborative efforts with industry provide insight into EGR effects and shot-to-shot variability
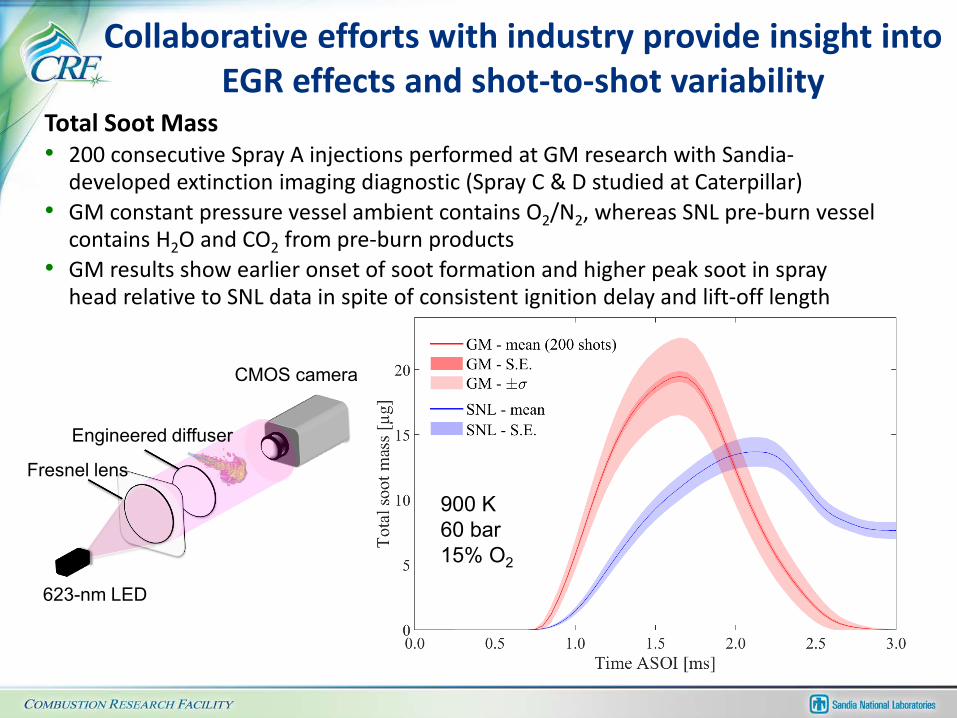
Total Soot Mass• 200 consecutive Spray A injections performed at GM research with Sandia-
developed extinction imaging diagnostic (Spray C & D studied at Caterpillar)• GM constant pressure vessel ambient contains O2/N2, whereas SNL pre-burn vessel
contains H2O and CO2 from pre-burn products• GM results show earlier onset of soot formation and higher peak soot in spray
head relative to SNL data in spite of consistent ignition delay and lift-off length
Fresnel lens
Engineered diffuser
CMOS camera
623-nm LED
900 K60 bar15% O2

Ignition delay
Minimum soot peak
Maximum soot peak
Shot-to-shot variability in total soot mass increases significantly before end of injection
Ignition delay• No correlation between ID for runs with
largest soot differences
Shot-to-shot variability• Standard Error (S.E.) with 200 consecutive injections ranges from <1% to approximately
5% of the mean transient soot mass during injection• Standard deviation begins to increase well before end-of-injection (EOI) with the largest
variability observed near (EOI)
End of Injection

Soot mass much greater for heavy-duty injectors – Spray C and D > 120 µg, partial sample; Spray A ~50 µg, near-full sample
Soot and liftoff both farther downstream for Spray D

Comparison of soot mass within consistent spatial bounds shows similar soot for cavitating or non-cavitating injectors
• Determine axial location where opticalthickness, KL, first exceeds 0.005 (99.5%transmission).
• Extend 30-mm downstream from thisposition and integrate total soot onlywithin these bounds
OH* boundaries
Cavitating - Spray C - redSmooth KS - Spray D - blue
• BUT, spatial location of flame is much different! This changes jet-jet interaction, penetration, wall interaction.

ECN5 152017
Example of ECN organizer role (Lyle Pickett)Contributors to “Lagrangian Spray G” session at ECN5
• Argonne National Laboratory – Radiography/tomography
measurements: Daniel Duke, Chris Powell, Katie Matusik, Alan Kastengren
• General Motors R&D– Rate of injection & – Droplet velocity/sizing: Scott Parrish
• Delphi– Patternation: Lee Markle
• Sandia National Laboratories– High-speed PIV gas-phase velocity:
Panos Sphicas (visiting from Imperial College), Scott Skeen, Lyle Pickett, Jonathan Frank
– Liquid and vapor penetration– Liquid extinction imaging
• Argonne National Lab. (ANL)– LES & RANS simulation, CONVERGE:
Kaushik Saha, Sibendu Som
• Politecnico di Milano (PoliMi)– RANS simulation, Open-FOAM: Tommaso
Lucchini, David Sinoir, Davide Paredi, Gianluca d’Errico
• KAUST-Hong G. Im, F. E. Hernandez Perez
Wisconsin - Chris Rutland, Hongjiang Li
AramCo - Jihad A. Badra, Jaeheon Sim– LES simulation, Open-FOAM
• ETH-Zurich– LES simulation, CD-adapco: Lucas Zeugin,
Yuri Wright
ModelingExperiment

37° Drill Angle
Plume cone angle
Full outer spray half angle
Plume direction
37° drill angle
~33°
ECN4: courtesy Bizhan Befrui, Delphi
VOF simulation of internal flow
Modeling Spray G via Lagrangianparticle tracking is complex/difficult
● Major “knobs” of adjustment– “Plume direction” angle relative to injector– Individual plume “cone angle”
Will one simulation consistently “best match” all experimental data?Which experimental data is the most useful for model tuning?

0 200 400 600 800 1000 1200 1400 1600 1800
time [ s]
-10
-5
0
5
10
15
20
25
30
35
40
Axi
al v
eloc
ity [m
/s]
15mm 573K 3.5kg/m 3
Gas velocity data between plumes is available for the first time as a metric to evaluate CFD
Upward motion (central recirculation)
Reversal time
Downward motion
Statistical uncertainty
Plumes mergeat center
ensemble-average axial velocity
challenging measurement position near injector and between plumes
Processing performed by Panos Sphicas, visitor from Imperial College London
End of injection
Sandia PIV
17

Compare simulations against experiments at the centerline, z = 15 mm location
● Central recirculation zone increases with higher plume direction, but does not meet level of experiment
0 0.5 1 1.5 2
Time ASI [ms]
-10
0
10
20
30
Axi
al v
eloc
ity [m
/s]
PIV exp.
20_9\
25_9\
30_9\
34_9\
37_9\
PoliMi RANS Plume direction _ Cone Angle
20°
37°
34°30°

0 0.5 1 1.5 2
Time ASI [ms]
-10
0
10
20
30A
xial
vel
ocity
[m/s
]
35/25
35/30
35/35
35/40
KAUST-WI-ARAMCO (KWA) LES picks up central recirculation zone and merge of jets at end of injection
35 degree plume direction plume direction / cone angle
25° cone
40° cone

KWA LES: Larger plume direction increases recirculation velocity
40 degree plume direction
0 0.5 1 1.5 2
Time ASI [ms]
-10
0
10
20
30A
xial
vel
ocity
[m/s
]
40/25
40/30
40/35
40/40
plume direction / cone angle

0 200 400 600 800 1000 1200
Time ASI [ s]
-10
-5
0
5
10
PIV
one-way
25 °30 °
35 °
40 °
Argonne LES: experiences a toggling/collapse with increased plume cone angle
35 degree plume direction
25° conez=15 mm
Mixture densityat 600 µs ASI See Sandia/Argonne/PoliMi publication: SAE 2017-01-0837

Profiles of velocity, density, mixture fraction used to identify plume center
● Nice agreement with measured liquid velocity● Plume center moves towards injector axis during injection● Plume center measured with DBI extinction imaging also consistent
Measured liquid velocity magnitude by phase-Doppler interferometry (GM)
Plume center from Sandia extinction imagingAverage of all 8 plumes, and averageof 5 LES realizations

Larger plume direction is unrealistic
● Some combinations of plume direction angle and cone angle provided decent fits to centerline gas velocity or penetration, but this practice cannot be justified when considering measured plume center

ECN5 Spray G Lagrangian model observations
● Advisable to tune plume cone angle over plume direction ● A single cone-angle/plume direction simulation does consistently provide
“best match” against detailed gas and liquid data● LES models inherently show better capacity to track central recirc. zone● Dispersion of plume appears to have little correlation with input cone angle
– RANS very dispersive, requiring small cone-angle inputs– LES implementation not consistent with different platforms
● Other concerns identified:– Large differences in velocity slip between liquid and gas– Lack of correct trends with increased temperature (vaporization)– Do not predict large SMD at the end of injection
24

Future work
● Comprehensive investigation of particulate formation for gasoline direct-injection systems– Investigate the fate of soot from large droplets expelled at EOI– Use multiple injections, to limit liquid penetration and wall wetting but
also to understand bulk gas and droplet mixing● Diesel research activities (FY18)
– Investigate the (miscible) structure of fuel sprays with fuel blends and realistic diesel fuel, including the use of cavitating fuel injectors
– Perform high-speed planar imaging of ignition and mixing (using custom 100 kHz pulse burst laser
– Quantify ignition and sooting characteristics of diesel certification fuel and proposed surrogates
● Expanding to a new high-throughput laboratory (funded via Co-Optima) will improve the efficiency of this research– Available during FY18– Achieves flash-boiling conditions– Heated chamber allows 300x speedup– Model validation datasets will have lower uncertainty
25

Presentation Summary
● Project is relevant to the development of high-efficiency, low-emission engines, which all use direct-injection sprays– Observations in controlled environment lead to improved understanding/models
for engine development– We address specific challenges facing current injection systems as well as future
concepts● FY17 approach addresses deficiencies in spray combustion modeling
– Unique, quantitative soot datasets available, coupled to in-depth knowledge of ignition/combustion behavior.
– Advanced gasoline direct-injection experiments show consistency, and highlight needs for future CFD development
● Collaboration through the ECN used as a tool to accelerate research and provide a pathway for improved CFD tools used by industry
● Future plans will continue research in gasoline and diesel sprays using unique tools and facilities
26

Technical Backup Slides
27

Nozzle inlet shape effect on spray development and combustion investigated
-1 -0.8 -0.6 -0.4 -0.2 0 0.20.1
0.15
0.2
0.25
0.3
0.35
0.4E
ffect
ive
Dia
met
er [m
m]
Axial Distance [mm]
K0 Spray C #37
KS1.5 nozzle Spray D #134Rounded inlet
ECN Spray D #134ECN Spray C #37
Flow directionInternal 3D geometry available at: http://www.sandia.gov/ecn/cvdata/targetCondition/SpCNozGeo.php
Technical Accomplishments
28

Comparison of C and D nozzle flow rates
(Spray D) (Spray C)Serial number 209134D 210037C[μm] (specified) 186 200(measured) 186 187[μm] (measured) 193 188[μm] (measured) 186 208K-factor [-] (specified) 1.5 0K-factor [-] (measured) 0.55 -2.3Nozzle shaping/hyroerosion to Cd = 0.86 5%[g/s] (150 – 6 MPa) 11.96 10.12[N] (150 – 6 MPa) 7.13 5.83
[-] Discharge coefficient. , where and 0.97 0.81
Area-contraction coefficient Ca =
*Ca > 1 is not physical but is most likely reflective of experimental uncertainties to derive its value
1.03* 0.89
● Specification called for larger cylindrical (K0) nozzle diameter for Spray C to account for smaller flow coefficients and match flow rate of Spray D– But actual minimum diameter was
only slightly larger● Mass and momentum flow rate
measurements (provided by CMT, Valencia, Spain) confirm lower flow rates, lower flow coefficients– Effective nozzle diameter is smaller
for Spray C compared to Spray D– This issue addressed during
analysis of results
29

6) Spray measurements - PIV- Macro-PIV videoUnique high-speed velocity diagnostic applied
● Custom pulse-burst laser system developed– 100 kHz pulse pairs– 500 pulse pairs (5 ms burst)– 15 mJ/pulse at 532 nm– Funded by internal Sandia
project (PI J. Frank)
● Applied PIV– 1 µm zirconia seed in gas phase– 200 kHz imaging on high-speed
CMOS camera– Liquid-phase avoided by probing
between plumes and moving downstream
30
Technical Accomplishments
1 8
7
654
3
2
Spray Gfuel: iso-octane, 200 bargas: 573 K, 6 bar

ECN Spray B nozzle
● Has the same size and KS specification as Spray A, but with a shorter length
● Side hole with ψ = 72.5° (145° full included angle) ● Plume 3, opposite the fuel tube, is the plume of
interest
Spray B
Spray A
Technical Accomplishments
31

Close collaboration and pathway to better CFD toolsCFD codes usedCONVERGEStar CDOpen FOAMKIVAANSYS Fluent & CFXFORTERAPTORother research codes…
Collaboration
CFD approachesRANSLESHigh-fidelity LESEulerian-EulerianEulerian-LagrangianDense fluidmany spray and combustion variants…
ModelingsubmissionsSandiaArgonneIFPENCMTPoliMiUMassUNSWPenn St.TU/eUW-MadisonPurdueETH-ZurichAaltoAachenDTUCambridgeGeorgia TechChalmersGM…
ExperimentSandiaArgonneIFPENCMTCATGMDelphiBoschTU/eIst. Motori
ECN organization● Monthly web meetings● Workshop organizers gather experimental and modeling data,
perform analysis, understand differences, provide expert review● Very tight coordination because of target conditions
Most industry use ECN data to
test their CFD practices
Mich. Tech.MeijiInfineumChalmersKAISTAachenMelbourneBrightonMichigan
Simulation contributions for ECN5
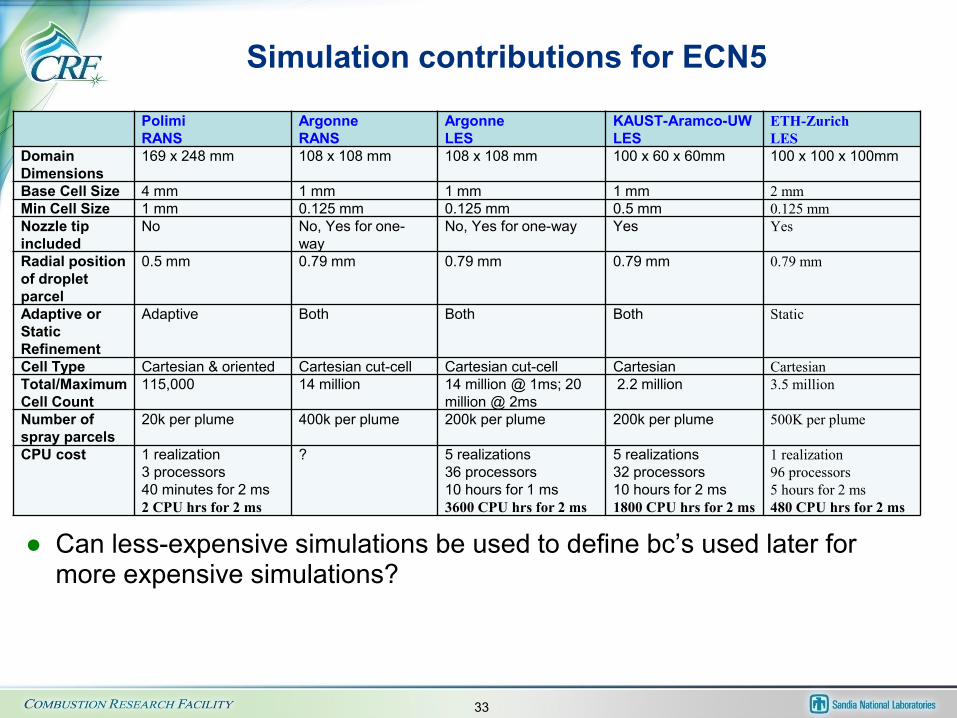
● Can less-expensive simulations be used to define bc’s used later for more expensive simulations?
PolimiRANS
ArgonneRANS
ArgonneLES
KAUST-Aramco-UWLES
ETH-ZurichLES
Domain Dimensions
169 x 248 mm 108 x 108 mm 108 x 108 mm 100 x 60 x 60mm 100 x 100 x 100mm
Base Cell Size 4 mm 1 mm 1 mm 1 mm 2 mmMin Cell Size 1 mm 0.125 mm 0.125 mm 0.5 mm 0.125 mmNozzle tip included
No No, Yes for one-way
No, Yes for one-way Yes Yes
Radial position of droplet parcel
0.5 mm 0.79 mm 0.79 mm 0.79 mm 0.79 mm
Adaptive or Static Refinement
Adaptive Both Both Both Static
Cell Type Cartesian & oriented Cartesian cut-cell Cartesian cut-cell Cartesian CartesianTotal/Maximum Cell Count
115,000 14 million 14 million @ 1ms; 20 million @ 2ms
2.2 million 3.5 million
Number of spray parcels
20k per plume 400k per plume 200k per plume 200k per plume 500K per plume
CPU cost 1 realization3 processors40 minutes for 2 ms2 CPU hrs for 2 ms
? 5 realizations36 processors10 hours for 1 ms3600 CPU hrs for 2 ms
5 realizations32 processors10 hours for 2 ms1800 CPU hrs for 2 ms
1 realization96 processors5 hours for 2 ms480 CPU hrs for 2 ms
33

Summary of models and setup
PolimiRANS
ArgonneRANS
ArgonneLES
KAUST-UW-AramcoLES
ETH-ZurichLES
CFD Code OpenFOAM + Lib-ICE CONVERGE CONVERGE OpenFOAM Star-CDTurbulence Model Standard k-ε Standard k-ε LES – dynamic
structureLES dynamic structure with spray source/sink
LES – sub-grid k model
Injection Model Lagrangian/Huh Lagrangian/Blob Lagrangian/Blob Lagrangian/Blob Lagrangian/BlobPrimary Break-up Model
Huh-Gosman Kelvin-Helmholtz (KH) Kelvin-Helmholtz (KH) KH (Cb = 1.0, B1= 35) Kelvin-Helmholtz (KH)
Secondary Break-up Kelvin Helmholtz (KH) + Rayleigh Taylor (RT)
Rayleigh-Taylor (RT) Rayleigh-Taylor (RT) KH/RT competing Rayleigh-Taylor (RT)
Vaporization Spalding Number-based (mass-based)
Frössling Frössling Spalding Number-based (mass-based)
Heat Transfer Ranz-Marshall O’Rourke Ranz-Marshall Ranz-MarshallCollision None NTC None O’RourkeDroplet Drag Dynamic without
spherical correctionDynamic Dynamic without
spherical correctionStandard
Initial gas turbulence u’ = 1 m/s; Li = 2 mm
TKE=1.0;EPS=100.0
TKE=7.9e-3 (35° PD)TKE = 1.6e-4(40° PD)
TKE=7.9e-3
Plume direction 34°, 37° 35° 35°, 40° 33°Plume cone angle Calculated from Huh-
Gosman as 9°25°- 40°, “one-way” 25°- 40°, “one-way” 25°, 30°, 35°, 40° 17°

Ignition mechanism in high-pressure sprayssee Dahms, Paczko, Skeen, Pickett. ProCI 36(2), 2017
→ Turbulence generates steep gradients and, hence, strong diffusion fluxes
Conclusion:a) Species & temperature diffusion into neighbored mixture triggers 1st-stage ignitionb) Continuous reactions & diffusion leads to cool flame wave propagation
ϕ≈1
ϕ≈5
Note: Pei & Gong (both using 3D LES, homogenous reactor) and Krisman (2D DNS) show cool flame accelerating rich ignition. But they must use limited chemistry or TCI assumptions. Our analysis uses full detailed chemistry and makes no sub-grid scale TCI assumptions.
35

New insights into the role of turbulence chemistry interactions (TCI) on diesel ignition
First-principles analysis of turbulent ignition• High-turbulence, high-pressure, complex kinetics, large domains and time span
• Revisiting Peters’ derivation for burning flamelets (1984, 2000) and resolving all time and diffusion length scales & chemical pathways via LLNL kinetics
3D reactive Navier-Stokes eqs.
1D flamelet eqs. in equivalence ratioTwo-scale asymptotic
True solution (!) of Navier-Stokes eqs. while asymptotic is valid → Da=tD/tc>>1
Chemical time scales from CEMA (Law et al., JFM, 2010)
Diffusion time scales (≠χ!) derived fromindividual species profiles
Complete LLNL kinetics for n-dodecane(2755 species; 11,173 reactions)
Asymptotic holds during entire ignition event!

Characteristic time scales in high-pressure spray flame ignition
1. t1 (~190 µs): Initial period of chemical activitywith first ignition in hot lean mixture
2. t2 (~200 µs): Turbulent cool flame wave leads tocool-flame ignition of entire mixture
3. t3 (~50 µs):Localized hot ignition in rich mixturewhere delay between 1st and 2nd
stage of ignition is minimal
4. t4 (~30 µs):Auto-igniting flame front propagation
• Changes in p, T, χ, etc. modifyt1-t4 time scales
Characteristic sequence of phenomena remains largely unaffected over wide range of conditions
37
Collaborative efforts with industry provide insight into EGR effects and shot-to-shot variability
Fresnel lens
Engineered diffuser
CMOS camera
623-nm LED

CollaborativeeffortswithindustryprovideinsightintoEGReffectsandshot-to-shotvariability
TotalSootMass• 200consecutiveSprayC/DinjectionsperformedatCaterpillarresearchwith
Sandia-developedhigh-speedextinctionimagingdiagnostic• CATconstantpressurevesselambientcontainsO2/N2,whereasSNLpre-burnvessel
containsH2OandCO2 frompre-burnproducts• CAT resultsshowearlieronsetofsootformation,butSNLdatahashigherpeaksoot
insprayheadeventhoughIDandLOLareconsistent.
Fresnel lens
Engineered diffuser
CMOS camera
623-nm LED