spr, washington dc, may 26 2005 trajectories of smoking among college freshmen: data from the uptern...
TRANSCRIPT

Trajectories of Smoking Among College Freshmen:
Data from the UpTERN Study
Brian R. Flay, Eisuke Segawa, Donald Hedeker, Craig Colder
and TERN members
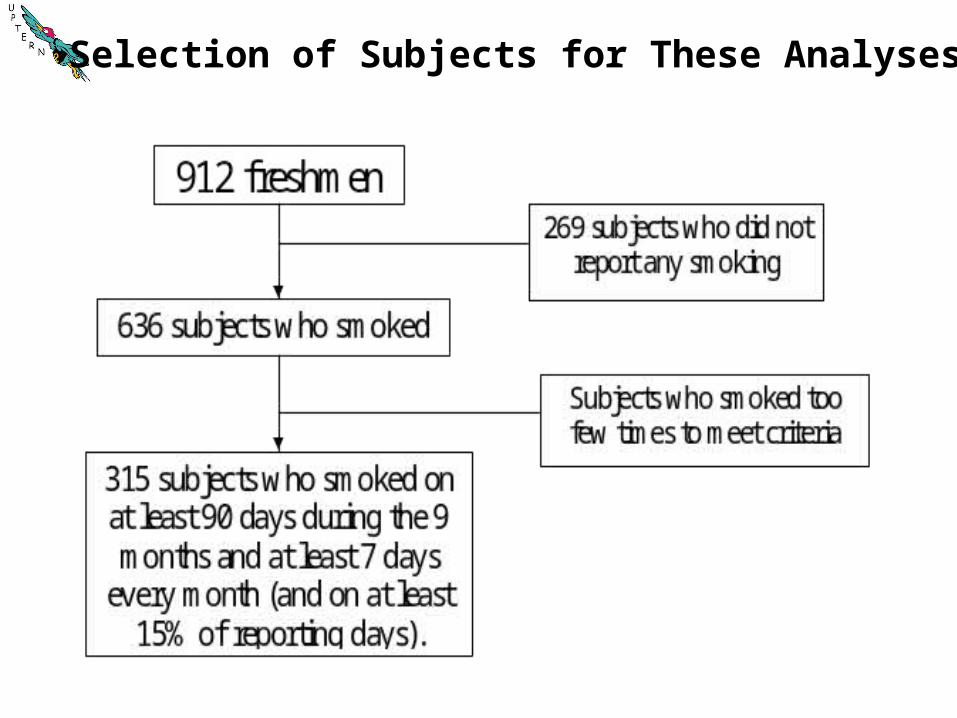
Selection of Subjects for These Analyses
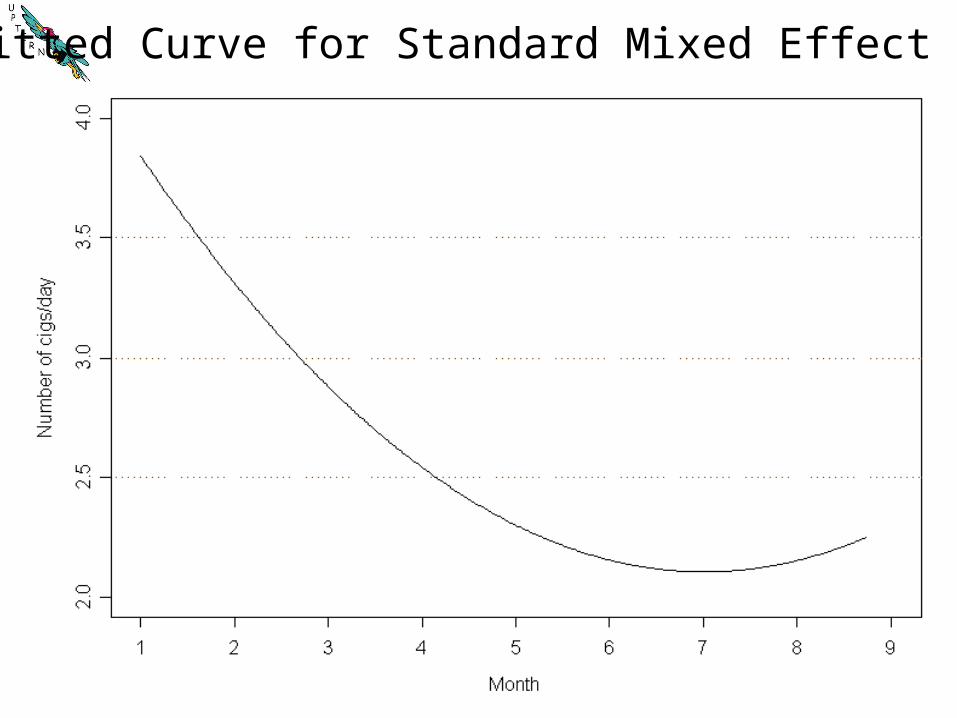
Fitted Curve for Standard Mixed Effect Model
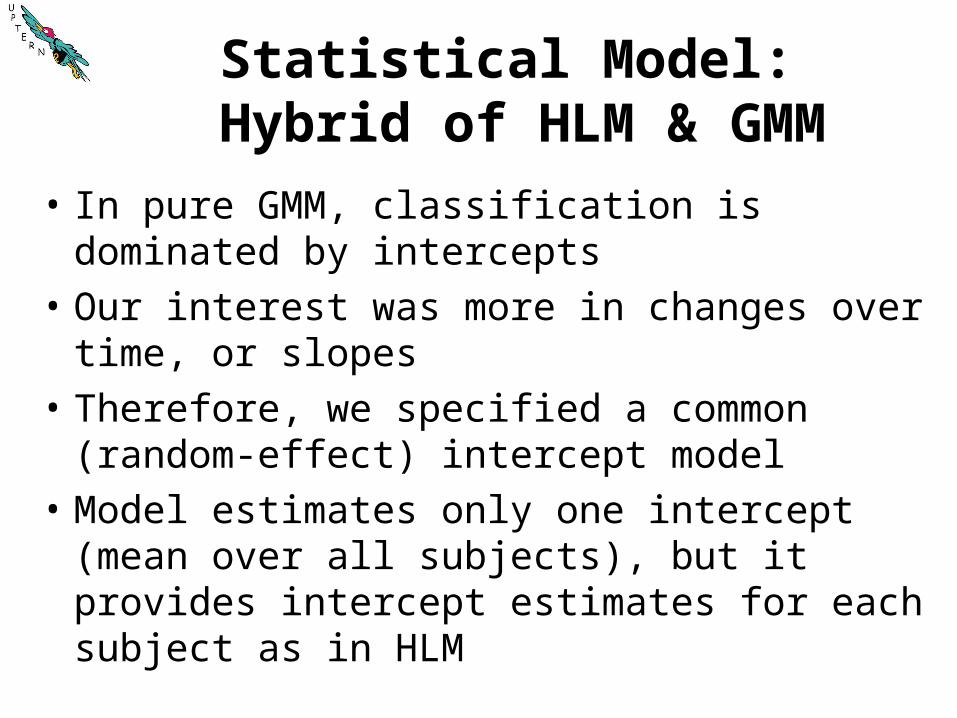
Statistical Model: Hybrid of HLM & GMM
• In pure GMM, classification is dominated by intercepts
• Our interest was more in changes over time, or slopes
• Therefore, we specified a common (random-effect) intercept model
• Model estimates only one intercept (mean over all subjects), but it provides intercept estimates for each subject as in HLM
Overall Class 1 Class 2 Class 3 Class 4 Class 5 Class 6 Class 7
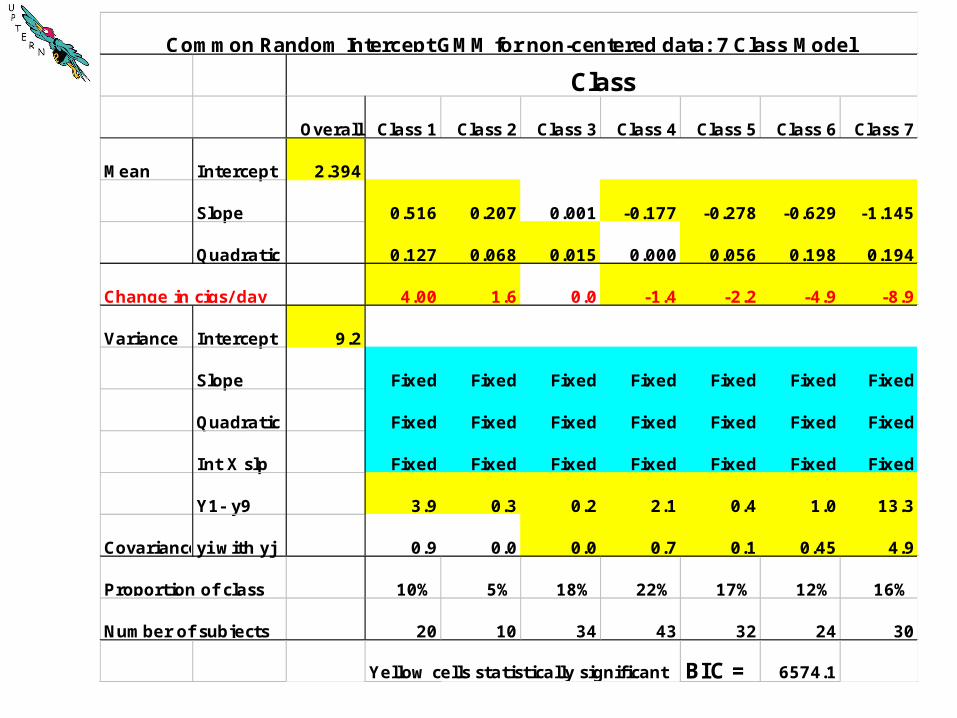
Mean Intercept 2.394
Slope 0.516 0.207 0.001 -0.177 -0.278 -0.629 -1.145
Quadratic 0.127 0.068 0.015 0.000 0.056 0.198 0.194
4.00 1.6 0.0 -1.4 -2.2 -4.9 -8.9
Variance Intercept 9.2
Slope Fixed Fixed Fixed Fixed Fixed Fixed Fixed
Quadratic Fixed Fixed Fixed Fixed Fixed Fixed Fixed
Int X slp Fixed Fixed Fixed Fixed Fixed Fixed Fixed
Y1- y9 3.9 0.3 0.2 2.1 0.4 1.0 13.3
Covarianceyi with yj 0.9 0.0 0.0 0.7 0.1 0.45 4.9
10% 5% 18% 22% 17% 12% 16%
20 10 34 43 32 24 30
Yellow cells statistically significant BIC = 6574.1
Change in cigs/ day
Proportion of class
Number of subjects
Common Random Intercept GMM for non-centered data: 7 Class Model
Class
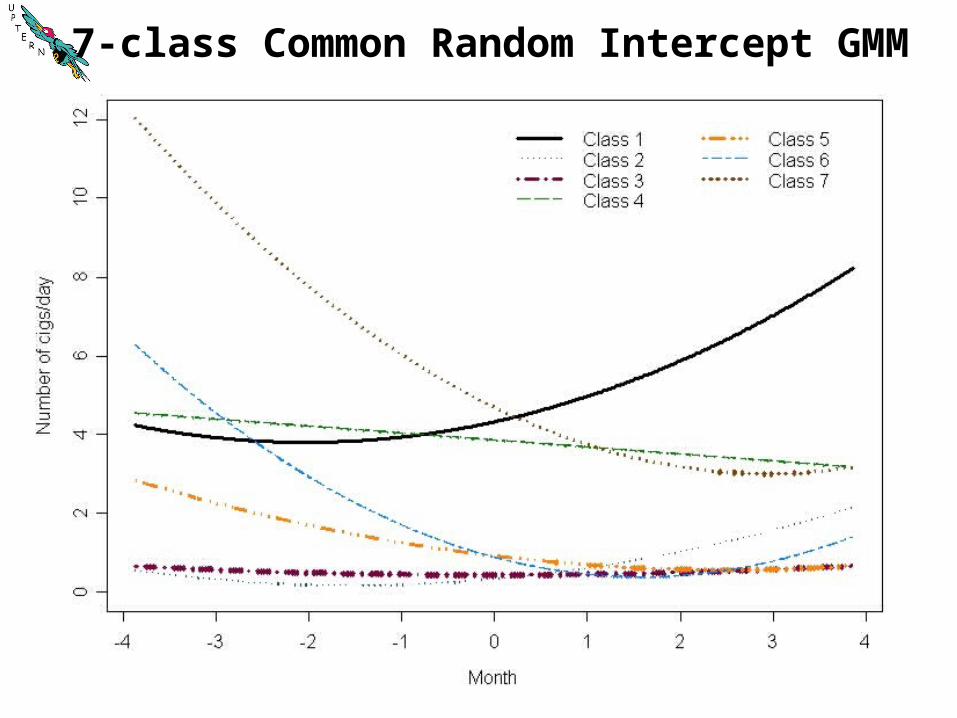
7-class Common Random Intercept GMM
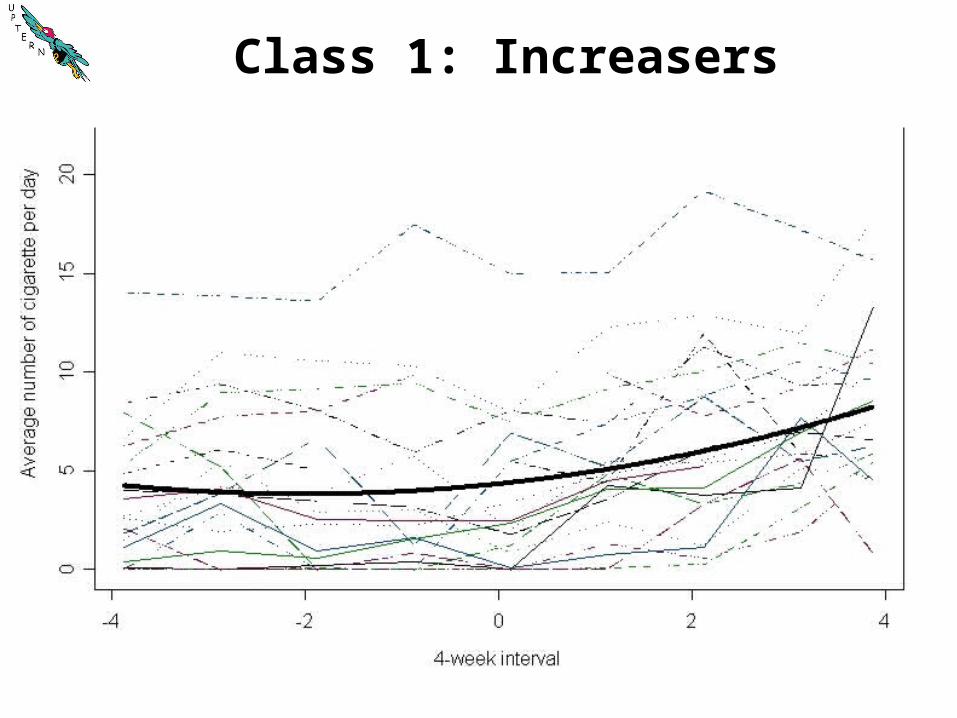
Class 1: Increasers
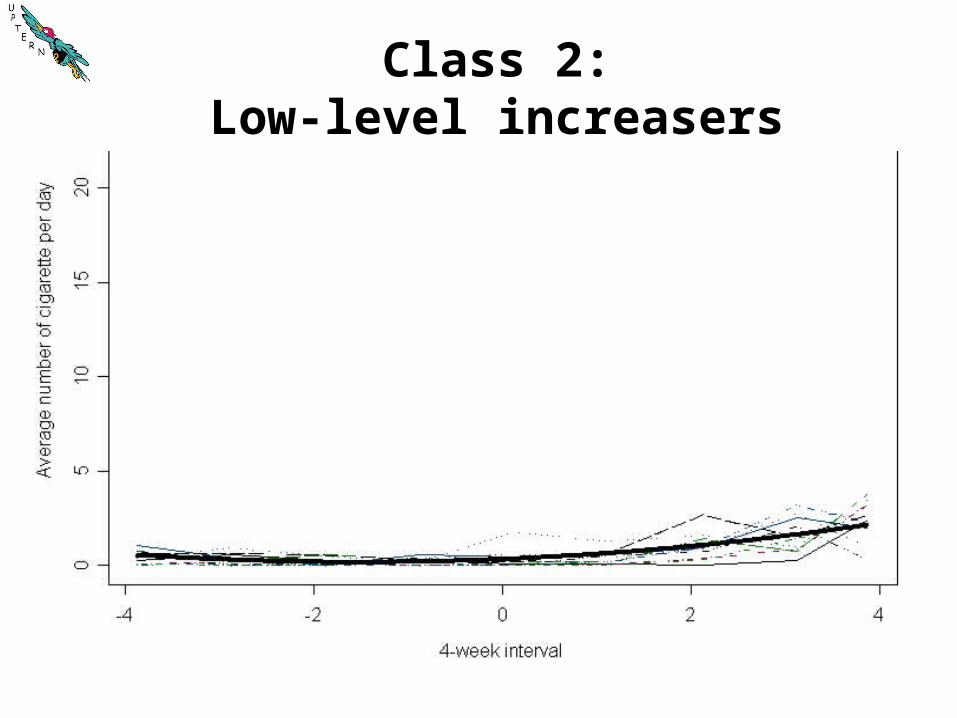
Class 2:Low-level increasers
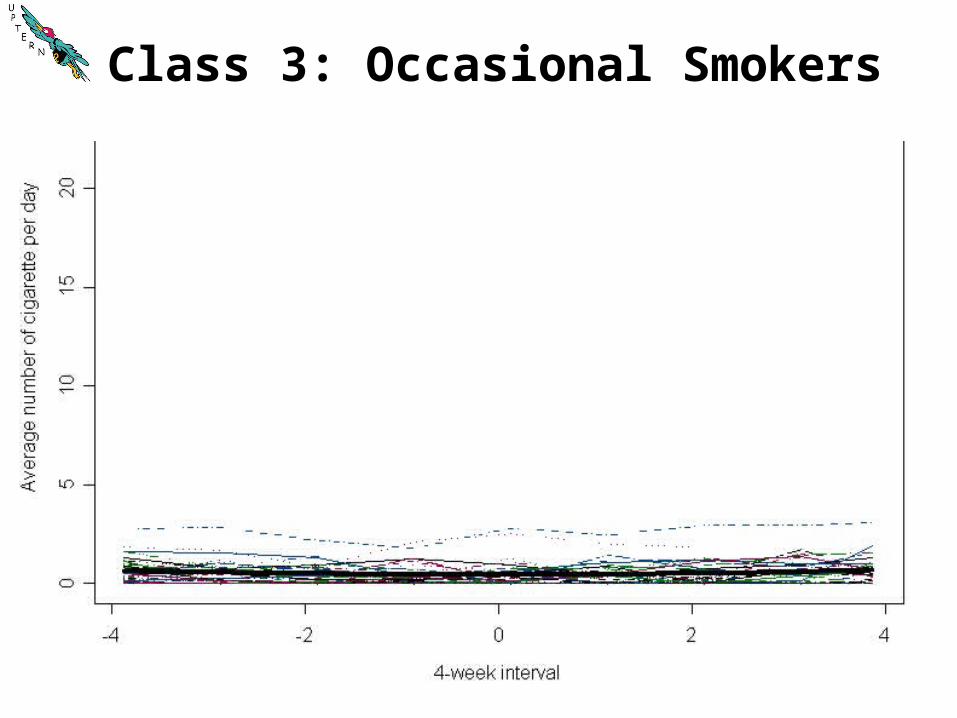
Class 3: Occasional Smokers
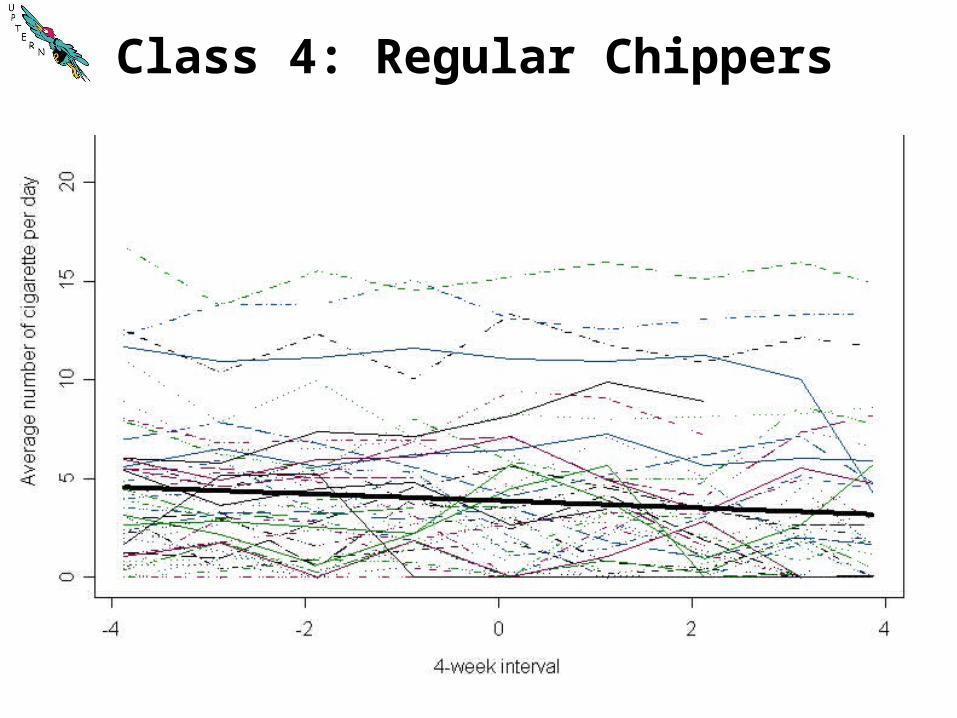
Class 4: Regular Chippers
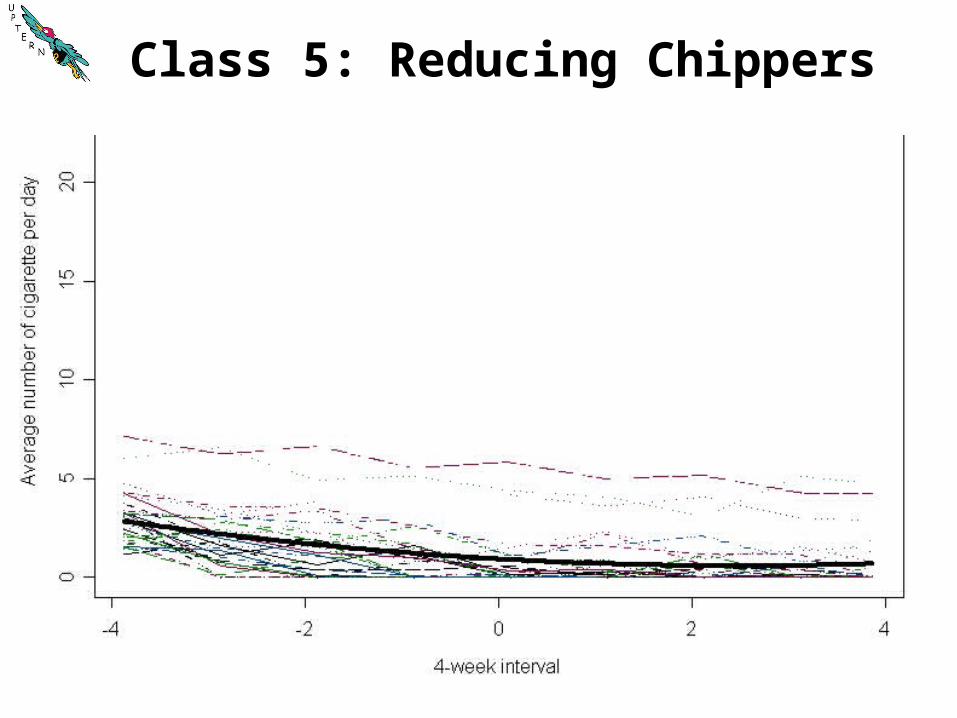
Class 5: Reducing Chippers
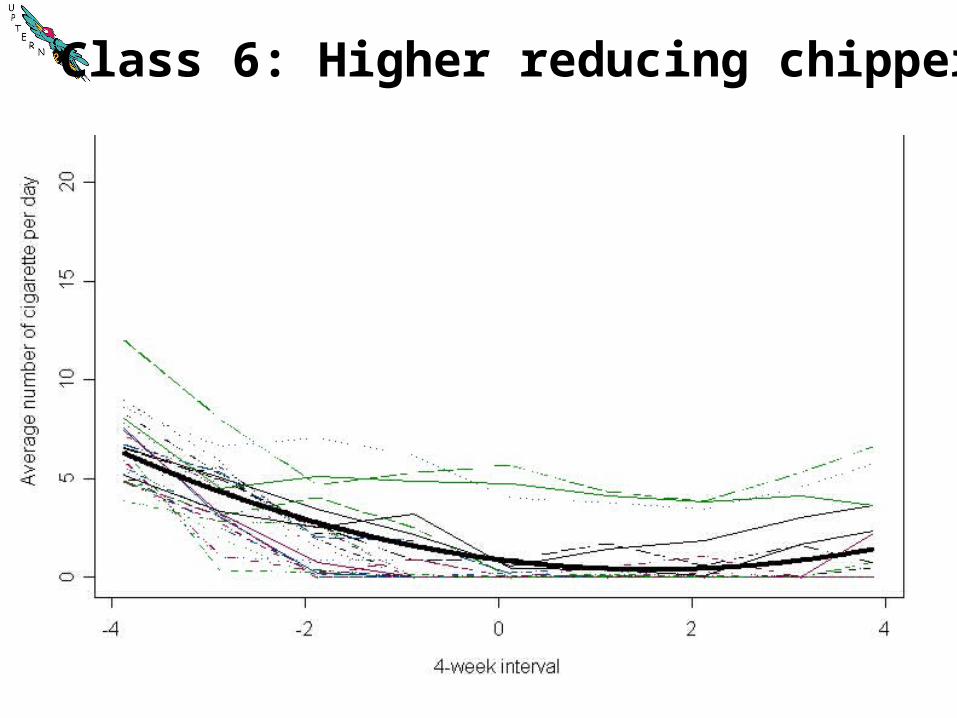
Class 6: Higher reducing chippers

Class 7: High variation decreasers
Change Subjects Subjects
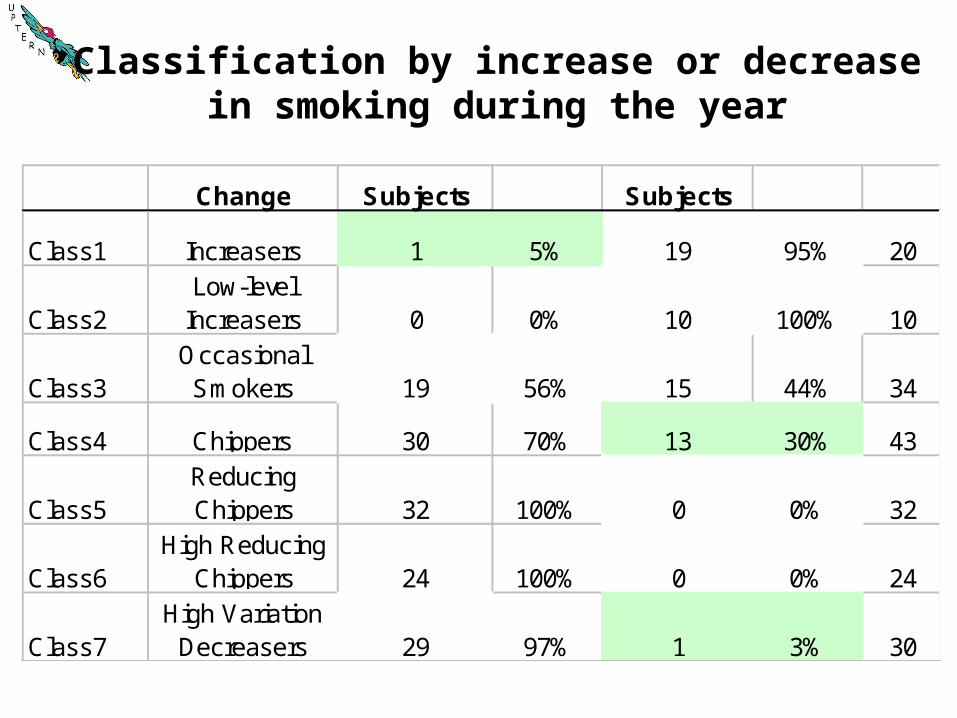
Class1 Increasers 1 5% 19 95% 20
Class2Low-level
Increasers 0 0% 10 100% 10
Class3Occasional Smokers 19 56% 15 44% 34
Class4 Chippers 30 70% 13 30% 43
Class5Reducing Chippers 32 100% 0 0% 32
Class6High Reducing
Chippers 24 100% 0 0% 24
Class7High Variation
Decreasers 29 97% 1 3% 30
Classification by increase or decreasein smoking during the year
9 month+follow up
Ave
rag
e n
um
be
r o
f cig
are
tte p
er
da
y
0 5 10 15 20
02
46
81
01
2
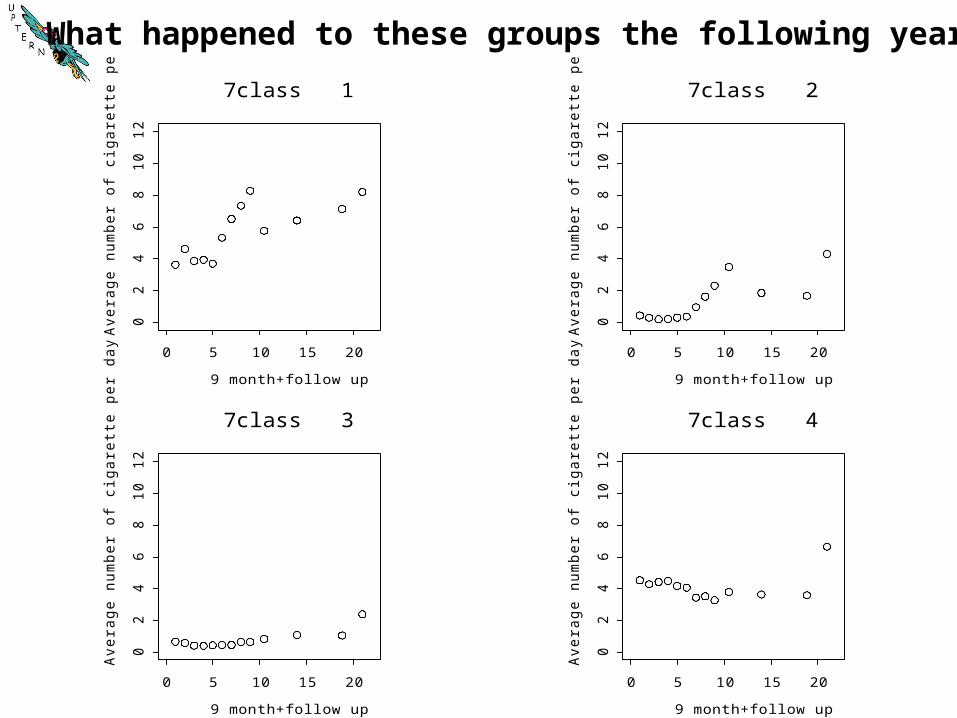
7class 1
9 month+follow up
Ave
rag
e n
um
be
r o
f cig
are
tte p
er
da
y
0 5 10 15 20
02
46
81
01
2
7class 2
9 month+follow up
Ave
rag
e n
um
be
r o
f cig
are
tte p
er
da
y
0 5 10 15 20
02
46
81
01
2
7class 3
9 month+follow up
Ave
rag
e n
um
be
r o
f cig
are
tte p
er
da
y
0 5 10 15 20
02
46
81
01
2
7class 4
What happened to these groups the following year?

What happened to these groups the following year?
9 month+follow up
Ave
rag
e n
um
be
r o
f cig
are
tte
pe
r d
ay
0 5 10 15 20
02
46
81
01
2
7class 5
9 month+follow up
Ave
rag
e n
um
be
r o
f cig
are
tte
pe
r d
ay
0 5 10 15 20
02
46
81
01
2
7class 6
9 month+follow up
Ave
rag
e n
um
be
r o
f cig
are
tte
pe
r d
ay
0 5 10 15 20
02
46
81
01
2
7class 7
Conclusions• The overall levels of smoking among
college students are lower than expected
• Nevertheless, some students increased their rates of smoking and others decreased
• Hybrid HLM and Growth Mixture Analysis provided a meaningful grouping of students that described their patterns of smoking during freshman year
• All smokers are at risk of increasing or maintaining their smoking levels!