spotlight on highway safety pedestrian traffic fatalities ... · to address pedestrian safety,...
TRANSCRIPT

19906,482 2018*
6,227
20094,109
20004,763
19945,489
2018 PRELIMINARY DATA
by StateTraffic FatalitiesPedestrian
Governors Highway Safety Association
www.ghsa.org
@GHSAHQ
®
Highway SafetySpotlight on
* 2018 is projected to have the highest number of pedestrian fatalities in the U.S. since 1990.

Spotlight on Highway Safety | Governors Highway Safety Association | ghsa.org | @GHSAHQ
Pedestrian Traffic Fatalities by State2018 PRELIMINARY DATA
2
CONTENTS
3 EXECUTIVE SUMMARY
5 INTRODUCTION
6 2018 PRELIMINARY PEDESTRIAN FATALITY DATA
13 2017 PEDESTRIAN FATALITY DATA
22 WHAT ABOUT CITIES?
23 EFFORTS TO REDUCE PEDESTRIAN FATALITIES AND INJURIES
26 DISCUSSION
32 APPENDIX: WHAT STATES ARE DOING
ACKNOWLEDGEMENTS
Richard Retting, Sam Schwartz Consulting, researched and wrote the report.
Madison Forker, Communications Manager, GHSA, oversaw the report. Russ Martin, Director of Policy and Government Relations, GHSA, and Kara Macek, Senior Director of Policy and Programs, GHSA, edited the report.
Creative by Tony Frye Design. / Published February 2019

Spotlight on Highway Safety | Governors Highway Safety Association | ghsa.org | @GHSAHQ
Pedestrian Traffic Fatalities by State2018 PRELIMINARY DATA
3
EXECUTIVE SUMMARY
In recent years, the number of pedestrian fatalities in the United States has grown sharply. During the 10-year period from 2008 to 2017, the number of pedestrian fatalities increased by 35 percent (from 4,414 deaths in 2008 to 5,977 deaths in 2017); meanwhile, the combined number of all other traffic deaths declined by six percent. Along with the increase in the number of pedestrian fatalities, pedestrian deaths as a percentage of total motor vehicle crash deaths increased from 12 percent in 2008 to 16 percent in 2017.
Earlier studies by the Governors Highway Safety Association (GHSA), based on preliminary data reported by State Highway Safety Offices (SHSOs), were the first to predict recent increases in pedestrian fatalities. The present study, based on preliminary data from all 50 states and the District of Columbia (DC), found the alarming rise in pedestrian deaths observed in both 2015 and 2016 appears to have resumed in 2018, although at a lesser pace. For the first six months of 2018 GHSA found a three percent increase in the reported number of pedestrian fatalities compared with the first six months of 2017. However, after adjusting for anticipated underreporting in the preliminary state data and considering the historic trends in pedestrian fatalities during the first and second halves of the year, GHSA estimates the nationwide number of pedestrians killed in motor vehicle crashes in 2018 was 6,227, an increase of four percent from 2017. This projection represents a continuation of an increasing trend in pedestrian deaths going back to 2009 and would be the largest annual number of pedestrian fatalities in the U.S. since 1990.
GHSA’s latest analysis of preliminary pedestrian fatality data also indicates the following:
●● States reported a range of changes in the number of pedestrian fatalities in the first half of 2018 compared with the same period in 2017:
i 25 states (and DC) had increases in pedestrian fatalities;
i 23 states had decreases; and
i Two states remained the same.
●● States differ widely in fatality numbers:
i The estimated number of pedestrian deaths for the first half of 2018 ranged from one in New Hampshire to 432 in California.
i Seven states (California, Florida, Texas, Georgia, Arizona, New York and North Carolina – in rank order) are each expected to have more than 100 pedestrian deaths – an increase of two states from 2017.
i Five states (Arizona, California, Florida, Georgia and Texas) accounted for almost half — 46 percent — of all pedestrian deaths.
i New Mexico had the highest rate of pedestrian deaths per resident population, while New Hampshire had the lowest.
GHSA estimates the nationwide number of pedestrians killed in motor vehicle crashes in 2018 was 6,227, an increase of four percent from 2017.

Spotlight on Highway Safety | Governors Highway Safety Association | ghsa.org | @GHSAHQ
Pedestrian Traffic Fatalities by State2018 PRELIMINARY DATA
4
●● States use various combinations of engineering, enforcement and education countermeasures to address pedestrian safety, including targeted enforcement in conjunction with public outreach and education.
Many factors outside the control of state and local traffic safety officials contribute to annual changes in the number of pedestrian fatalities, including economic conditions, population growth, demographic changes, weather conditions, fuel prices, vehicle miles traveled and the amount of time people spend walking.
The increasing shift in U.S. vehicle sales away from passenger cars to light trucks (with light trucks generally causing more severe pedestrian impacts than cars) is also a factor. Although passenger cars are the largest category of vehicles involved in fatal pedestrian crashes, the number of pedestrian fatalities involving SUVs increased at a faster rate — 50 percent – from 2013 to 2017 compared to passenger cars, which increased by 30 percent.
Increases in pedestrian fatalities are occurring largely at night. From 2008 to 2017 the number of nighttime pedestrian fatalities increased by 45 percent, compared to a much smaller 11 percent increase in daytime pedestrian fatalities.
Additionally, increases in pedestrian fatalities may be linked to population growth in specific cities and states. For example, the 10 states with the highest population growth from 2017 to 2018 – Arizona, Colorado, Florida, Idaho, North Carolina, Nevada, South Carolina, Utah, Texas and Washington State – had an overall five percent increase in the number of pedestrian fatalities during the first six month of 2018 compared with the same period in 2017.1
Another possible factor contributing to the recent rise in the overall number of pedestrian fatalities could be the large growth in smartphone use over the past decade, which can be a significant source of distraction for all road users.
Despite the overall increase in pedestrian deaths, there is some good news in the 2018 preliminary data:
●● Pedestrian fatalities during the first half of 2018 declined in 23 states compared with the same period in 2017.
●● Six states (Alabama, Indiana, Michigan, Nevada, Oklahoma and Wisconsin) reported double-digit declines in both the number and percent change in pedestrian fatalities from the same period in 2017.
●● Three states (Iowa, New Hampshire and Utah) reported two consecutive years of declining numbers of pedestrian fatalities.
●● The number of pedestrian fatalities in the 10 largest cities declined 15 percent in 2017. The decline was especially sharp in New York city, providing evidence of local successes that may not be reflected in statewide data.
1 https://www.census.gov/newsroom/press-releases/2018/estimates-national-state.html

Spotlight on Highway Safety | Governors Highway Safety Association | ghsa.org | @GHSAHQ
Pedestrian Traffic Fatalities by State2018 PRELIMINARY DATA
5
INTRODUCTION
Walking is the most basic, inexpensive and environmentally-friendly form of human transportation. Walking provides essential connections between residential, retail, and commercial land uses as well as access to public transit, especially in urban and suburban areas. But unfortunately, walking has become increasingly risky in recent years, whether walking the dog, traveling to work or school, exercising or simply taking a stroll.
During the 10-year period of 2008 to 2017, the number of pedestrian fatalities in the U.S. increased by 35 percent, from 4,414 deaths in 2008 to 5,977 deaths in 2017 (Figure 1 and Table 1). This translates into more than 1,500 additional pedestrian deaths in 2017 compared with 2008. At the same time that pedestrian deaths have been increasing, the number of all other traffic deaths combined decreased by six percent.
Table 1 Pedestrian Fatalities and Percent of Total Traffic Fatalities, 2008 - 2017
Source: National Highway Traffic Safety Administration (NHTSA) Fatality Analysis Reporting System (FARS)
Year Pedestrian Fatalities
All Other Traffic Fatalities
CombinedTotal Traffic
FatalitiesPedestrian Deaths as
a Percent of Total Traffic Fatalities
2008 4,414 33,009 37,423 12%
2009 4,109 29,774 33,883 12%
2010 4,302 28,697 32,999 13%
2011 4,457 28,022 32,479 14%
2012 4,818 28,964 33,782 14%
2013 4,779 28,115 32,894 15%
2014 4,910 27,834 32,744 15%
2015 5,495 29,990 35,485 15%
2016 6,080 31,726 37,806 16%
2017 5,977 31,156 37,133 16%
Source: FARS

Spotlight on Highway Safety | Governors Highway Safety Association | ghsa.org | @GHSAHQ
Pedestrian Traffic Fatalities by State2018 PRELIMINARY DATA
6
Figure 1 Numbers of U.S. Traffic Deaths in 2008 and 2017
Along with the increase in the number of pedestrian fatalities, pedestrian deaths as a percentage of total motor vehicle crash deaths increased from 12 percent in 2008 to 16 percent in both 2016 and 2017. This is due to the simultaneous trends of increasing numbers of pedestrian deaths and general declines in the number of occupant fatalities. Declines in occupant deaths are attributed in part to steady enhancements in vehicle crashworthiness and crash avoidance technology, whereas by contrast, pedestrians remain just as susceptible to sustaining serious or fatal injuries when struck by a motor vehicle.
2018 PRELIMINARY PEDESTRIAN FATALITY DATA
Tables 2-4 demonstrate the number of pedestrian fatalities projected in each state for the first half of 2018, sorted by state (Table 2), percentage (Table 3) and number of fatalities (Table 4). The preliminary data provided by State Highway Safety Offices have been adjusted based on historical trends to achieve the most accurate projection.
Sou
rce:
NH
TSA
FA
RS

Spotlight on Highway Safety | Governors Highway Safety Association | ghsa.org | @GHSAHQ
Pedestrian Traffic Fatalities by State2018 PRELIMINARY DATA
7
Table 2
Pedestrian Fatalities by State, Jan-June 2017 & 2018
Source: State Highway Safety Offices
Sorted by State
State Jan-June 2017
Jan-June 2018(Preliminary
Adjusted)
% Change from 2017 to 2018
# %
Alabama 59 40 -19 -32%
Alaska 7 5 -2 -29%
Arizona 112 125 + 13 + 12%
Arkansas 25 23 -2 -8%
California 468 432 -36 -8%
Colorado 37 34 -3 -8%
Connecticut 19 29 + 10 + 53%
Delaware 13 7 -6 -46%
DC 7 8 + 1 +14%
Florida 326 330 + 4 +1%
Georgia 101 133 + 32 + 32%
Hawaii 1 19 + 18 + 1800%
Idaho 7 4 -3 -43%
Illinois 67 80 + 13 + 19%
Indiana 61 42 -19 -31%
Iowa 10 9 -1 -10%
Kansas 12 16 + 4 + 33%
Kentucky 38 33 -5 -13%
Louisiana 69 77 + 8 + 12%
Maine 5 3 -2 -40%
Maryland 48 60 + 12 + 25%
Massachusetts 35 38 + 3 + 9%
Michigan 72 58 -14 -19%
Minnesota 18 14 -4 -22%
Mississippi 31 44 + 13 + 42%
Missouri 42 44 + 2 + 5%
Montana 5 6 + 1 + 20%
Nebraska 7 12 + 5 + 71%
Nevada 43 31 -12 -28%
New Hampshire 5 1 -4 -80%
New Jersey 67 73 + 6 + 9%
New Mexico 32 47 + 15 + 47%
New York 112 117 + 5 + 4%
North Carolina 83 102 + 19 +23%
North Dakota 3 3 0 0%
Ohio 55 63 + 8 +15%
Oklahoma 33 22 -11 -33%
Oregon 34 28 -6 -18%
Pennsylvania 64 90 + 26 + 41%
Rhode Island 10 4 -6 -60%
South Carolina 69 74 + 5 + 7%
South Dakota 2 5 + 3 + 150%
Tennessee 57 52 -5 -9%
Texas 266 298 + 32 + 12%
Utah 18 13 -5 -28%
Vermont 2 2 0 0%
Virginia 45 53 + 8 + 18%
Washington 46 44 -2 -4%
West Virginia 10 7 -3 -30%
Wisconsin 29 18 -11 -38%
Wyoming 3 4 + 1 + 33%
U.S. Total 2,790 2,876 + 86 + 3%

Spotlight on Highway Safety | Governors Highway Safety Association | ghsa.org | @GHSAHQ
Pedestrian Traffic Fatalities by State2018 PRELIMINARY DATA
8
Sorted by Percentage Change
State Jan-Jun 2017Jan-Jun 2018
(Preliminary Adjusted)
Change from 2017 to 2018
# %
Hawaii 1 19 + 18 + 1800%
South Dakota 2 5 + 3 + 150%
Nebraska 7 12 + 5 + 71%
Connecticut 19 29 + 10 + 53%
New Mexico 32 47 + 15 + 47%
Mississippi 31 44 + 13 + 42%
Pennsylvania 64 90 + 26 + 41%
Kansas 12 16 + 4 + 33%
Wyoming 3 4 +1 + 33%
Georgia 101 133 + 32 + 32%
Maryland 48 60 + 12 + 25%
North Carolina 83 102 + 19 + 23%
Montana 5 6 + 1 + 20%
Illinois 67 80 +13 + 19%
Virginia 45 53 + 8 + 18%
Ohio 55 63 + 8 + 15%
DC 7 8 + 1 + 14%
Arizona 112 125 + 13 + 12%
Louisiana 69 77 + 8 + 12%
Texas 266 298 + 32 + 12%
Massachusetts 35 38 + 3 + 9%
New Jersey 67 73 + 6 + 9%
South Carolina 69 74 + 5 + 7%
Missouri 42 44 + 2 + 5%
New York 112 117 + 5 + 4%
Florida 326 330 + 4 + 1%
North Dakota 3 3 0 0%
Vermont 2 2 0 0%
Washington 46 44 -2 -4%
Arkansas 25 23 -2 -8%
California 468 432 -36 -8%
Colorado 37 34 -3 -8%
Tennessee 57 52 -5 -9%
Iowa 10 9 -1 -10%
Kentucky 38 33 -5 -13%
Oregon 34 28 -6 -18%
Michigan 72 58 -14 -19%
Minnesota 18 14 -4 -22%
Nevada 43 31 -12 -28%
Utah 18 13 -5 -28%
Alaska 7 5 -2 -29%
West Virginia 10 7 -3 -30%
Indiana 61 42 -19 -31%
Alabama 59 40 -19 -32%
Oklahoma 33 22 -11 -33%
Wisconsin 29 18 -11 -38%
Maine 5 3 -2 -40%
Idaho 7 4 -3 -43%
Delaware 13 7 -6 -46%
Rhode Island 10 4 -6 -60%
New Hampshire 5 1 -4 -80%
U.S. Total 2,790 2,876 + 86 + 3%
Table 3
Pedestrian Fatalities by State, Jan - June 2017 & 2018
Source: State Highway Safety Offices
Percen
tage C
han
ge U
pP
ercentag
e Ch
ang
e Do
wn

Spotlight on Highway Safety | Governors Highway Safety Association | ghsa.org | @GHSAHQ
Pedestrian Traffic Fatalities by State2018 PRELIMINARY DATA
9
Sorted by Number of Fatalities
StatePedestrian Fatalities
(Preliminary Adjusted)
California 432
Florida 330
Texas 298
Georgia 133
Arizona 125
New York 117
North Carolina 102
Pennsylvania 90
Illinois 80
Louisiana 77
South Carolina 74
New Jersey 73
Ohio 63
Maryland 60
Michigan 58
Virginia 53
Tennessee 52
New Mexico 47
Mississippi 44
Missouri 44
Washington 44
Indiana 42
Alabama 40
Massachusetts 38
Colorado 34
Kentucky 33
Nevada 31
Connecticut 29
Oregon 28
Arkansas 23
Oklahoma 22
Hawaii 19
Wisconsin 18
Kansas 16
Minnesota 14
Utah 13
Nebraska 12
Iowa 9
DC 8
Delaware 7
West Virginia 7
Montana 6
Alaska 5
South Dakota 5
Idaho 4
Rhode Island 4
Wyoming 4
Maine 3
North Dakota 3
Vermont 2
New Hampshire 1
Total 2,876
Table 4
Pedestrian Fatalities by State, Jan - June 2018
Source: State Highway Safety Offices

Spotlight on Highway Safety | Governors Highway Safety Association | ghsa.org | @GHSAHQ
Pedestrian Traffic Fatalities by State2018 PRELIMINARY DATA
10
As illustrated in Figure 2, five states (Arizona, California, Florida, Georgia, and Texas) accounted for almost half — 46 percent — of all pedestrian deaths during the first six months of 2018. By comparison, these five states represented approximately 33 percent of the U.S. population according to the 2018 U.S. Census.
Figure 2 5 States Comprising 46% of Pedestrian Deaths, Jan - June 2018
TexasFlorida
GeorgiaArizona
California
Sou
rce:
SH
SO
s

Spotlight on Highway Safety | Governors Highway Safety Association | ghsa.org | @GHSAHQ
Pedestrian Traffic Fatalities by State2018 PRELIMINARY DATA
11
Sorted by State
StatePedestrian Fatalities per 100K Population
Alabama 0.82
Alaska 0.64
Arizona 1.74
Arkansas 0.78
California 1.09
Colorado 0.60
Connecticut 0.82
Delaware 0.73
DC 1.14
Florida 1.55
Georgia 1.27
Hawaii 1.36
Idaho 0.22
Illinois 0.63
Indiana 0.63
Iowa 0.28
Kansas 0.54
Kentucky 0.73
Louisiana 1.66
Maine 0.22
Maryland 1.00
Massachusetts 0.55
Michigan 0.59
Minnesota 0.25
Mississippi 1.46
Missouri 0.72
Montana 0.56
Nebraska 0.62
Nevada 1.01
New Hampshire 0.07
New Jersey 0.82
New Mexico 2.26
New York 0.60
North Carolina 0.98
North Dakota 0.39
Ohio 0.54
Oklahoma 0.56
Oregon 0.66
Pennsylvania 0.71
Rhode Island 0.40
South Carolina 1.46
South Dakota 0.57
Tennessee 0.77
Texas 1.04
Utah 0.41
Vermont 0.37
Virginia 0.62
Washington 0.59
West Virginia 0.39
Wisconsin 0.32
Wyoming 0.69
U.S. Average 0.88
Sorted by Fatality Rate
StatePedestrian Fatalities per 100K Population
New Mexico 2.26
Arizona 1.74
Louisiana 1.66
Florida 1.55
Mississippi 1.46
South Carolina 1.46
Hawaii 1.36
Georgia 1.27
DC 1.14
California 1.09
Texas 1.04
Nevada 1.01
Maryland 1.00
North Carolina 0.98
Alabama 0.82
Connecticut 0.82
New Jersey 0.82
Arkansas 0.78
Tennessee 0.77
Kentucky 0.73
Delaware 0.73
Missouri 0.72
Pennsylvania 0.71
Wyoming 0.69
Oregon 0.66
Alaska 0.64
Indiana 0.63
Illinois 0.63
Nebraska 0.62
Virginia 0.62
Colorado 0.60
New York 0.60
Washington 0.59
Michigan 0.59
South Dakota 0.57
Montana 0.56
Oklahoma 0.56
Massachusetts 0.55
Ohio 0.54
Kansas 0.54
Utah 0.41
Rhode Island 0.40
North Dakota 0.39
West Virginia 0.39
Vermont 0.37
Wisconsin 0.32
Iowa 0.28
Minnesota 0.25
Maine 0.22
Idaho 0.22
New Hampshire 0.07
U.S. Average 0.88
Table 5
Pedestrian Fatalities by State per 100,000 Population, Jan - June 2018
Source: State Highway Safety Offices and U.S. Census Bureau
Table 5 shows the rate of pedestrian fatalities per 100,000 population by state for the first six months of 2018. New Mexico had the highest rate (2.26), while New Hampshire had the lowest (0.07). Twelve states and D.C. had pedestrian fatality rates of 1.0 or higher per 100,000 population.

Spotlight on Highway Safety | Governors Highway Safety Association | ghsa.org | @GHSAHQ
Pedestrian Traffic Fatalities by State2018 PRELIMINARY DATA
12
Based on the preliminary number of pedestrian fatalities during the first six months of 2018 along with historic data regarding the annual numbers and proportions of pedestrian deaths that occurred during the first and second halves of the year, GHSA projects there were 6,227 pedestrian fatalities in 2018, an estimated four (4) percent increase from 2017.
As shown in Figure 3, the projected number of 6,227 pedestrian fatalities in 2018 represents a continuation of an increasing trend in pedestrian deaths going back to 2009 and would be the largest annual number of pedestrian fatalities in the U.S. since 1990.
Figure 3 U.S. Pedestrian Fatalities: 1990 - 2018
* 2018 estimate based on preliminary data and historical trendsS
ourc
e: S
HS
Os
and
FAR
S
Spotlight on Highway Safety | Governors Highway Safety Association | ghsa.org | @GHSAHQ
Pedestrian Traffic Fatalities by State2018 PRELIMINARY DATA
13
2017 PEDESTRIAN FATALITY DATA
In addition to analyzing preliminary pedestrian fatality data for the first six months of 2018, GHSA also examined pedestrian fatality data for the most recent complete calendar year (2017) as published by NHTSA through FARS. The following crash factors were examined:
●● Population
●● Light Level
●● Location
●● Alcohol and Other Drugs
●● Vehicle Type
PopulationTable 6 and Figures 4 through 15 provide analysis of the most recent pedestrian fatality data available from FARS.
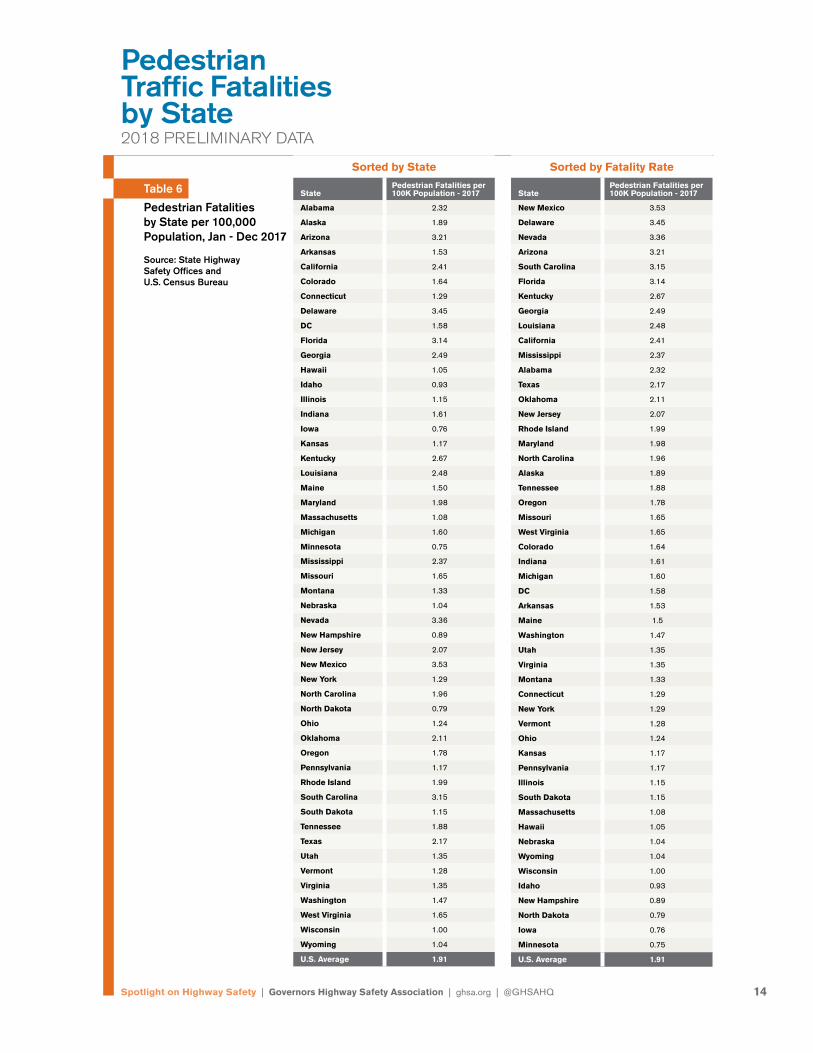
Table 6 shows the rate of pedestrian fatalities per 100,000 population by state for 2017 based on the number of pedestrian fatalities reported by FARS and U.S. Census population data.
●● New Mexico had the highest pedestrian fatality rate (3.53), while Minnesota had the lowest (0.75).
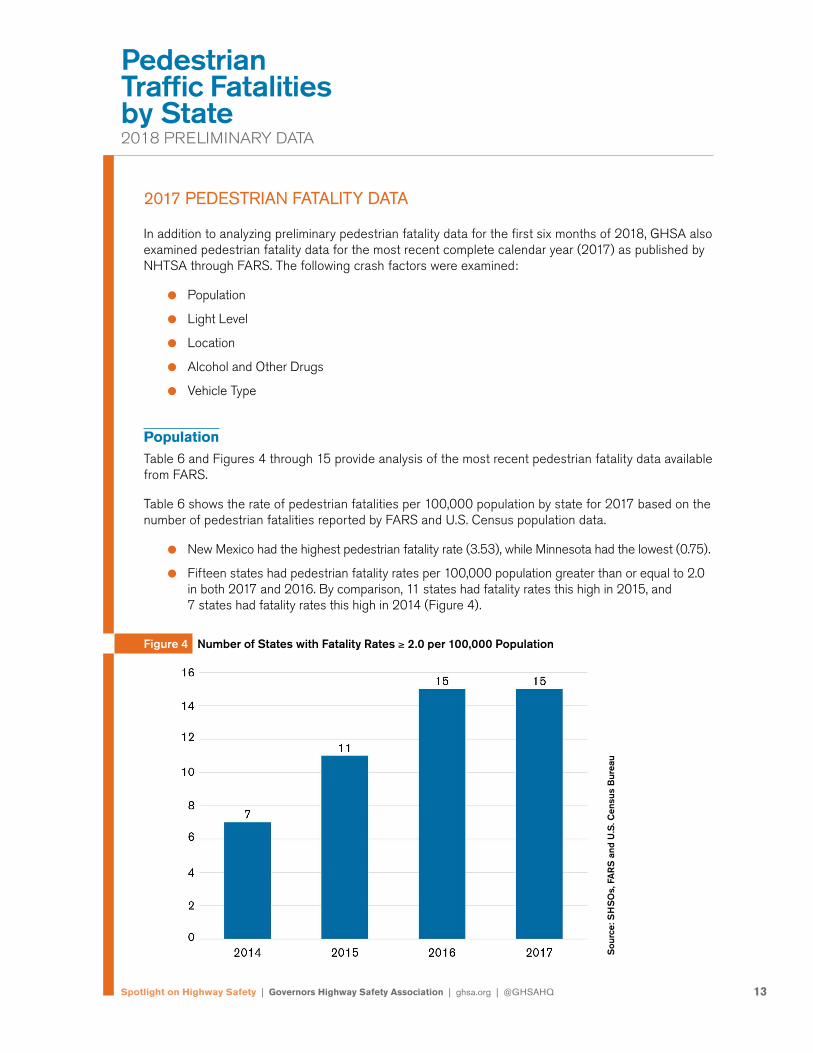
●● Fifteen states had pedestrian fatality rates per 100,000 population greater than or equal to 2.0 in both 2017 and 2016. By comparison, 11 states had fatality rates this high in 2015, and 7 states had fatality rates this high in 2014 (Figure 4).
Figure 4 Number of States with Fatality Rates ≥ 2.0 per 100,000 Population
Sou
rce:
SH
SO
s, F
AR
S a
nd U
.S. C
ensu
s B
urea
u
Spotlight on Highway Safety | Governors Highway Safety Association | ghsa.org | @GHSAHQ
Pedestrian Traffic Fatalities by State2018 PRELIMINARY DATA
14
Sorted by State
StatePedestrian Fatalities per 100K Population - 2017
Alabama 2.32
Alaska 1.89
Arizona 3.21
Arkansas 1.53
California 2.41
Colorado 1.64
Connecticut 1.29
Delaware 3.45
DC 1.58
Florida 3.14
Georgia 2.49
Hawaii 1.05
Idaho 0.93
Illinois 1.15
Indiana 1.61
Iowa 0.76
Kansas 1.17
Kentucky 2.67
Louisiana 2.48
Maine 1.50
Maryland 1.98
Massachusetts 1.08
Michigan 1.60
Minnesota 0.75
Mississippi 2.37
Missouri 1.65
Montana 1.33
Nebraska 1.04
Nevada 3.36
New Hampshire 0.89
New Jersey 2.07
New Mexico 3.53
New York 1.29
North Carolina 1.96
North Dakota 0.79
Ohio 1.24
Oklahoma 2.11
Oregon 1.78
Pennsylvania 1.17
Rhode Island 1.99
South Carolina 3.15
South Dakota 1.15
Tennessee 1.88
Texas 2.17
Utah 1.35
Vermont 1.28
Virginia 1.35
Washington 1.47
West Virginia 1.65
Wisconsin 1.00
Wyoming 1.04
U.S. Average 1.91
Sorted by Fatality Rate
StatePedestrian Fatalities per 100K Population - 2017
New Mexico 3.53
Delaware 3.45
Nevada 3.36
Arizona 3.21
South Carolina 3.15
Florida 3.14
Kentucky 2.67
Georgia 2.49
Louisiana 2.48
California 2.41
Mississippi 2.37
Alabama 2.32
Texas 2.17
Oklahoma 2.11
New Jersey 2.07
Rhode Island 1.99
Maryland 1.98
North Carolina 1.96
Alaska 1.89
Tennessee 1.88
Oregon 1.78
Missouri 1.65
West Virginia 1.65
Colorado 1.64
Indiana 1.61
Michigan 1.60
DC 1.58
Arkansas 1.53
Maine 1.5
Washington 1.47
Utah 1.35
Virginia 1.35
Montana 1.33
Connecticut 1.29
New York 1.29
Vermont 1.28
Ohio 1.24
Kansas 1.17
Pennsylvania 1.17
Illinois 1.15
South Dakota 1.15
Massachusetts 1.08
Hawaii 1.05
Nebraska 1.04
Wyoming 1.04
Wisconsin 1.00
Idaho 0.93
New Hampshire 0.89
North Dakota 0.79
Iowa 0.76
Minnesota 0.75
U.S. Average 1.91
Table 6
Pedestrian Fatalities by State per 100,000 Population, Jan - Dec 2017
Source: State Highway Safety Offices and U.S. Census Bureau

Spotlight on Highway Safety | Governors Highway Safety Association | ghsa.org | @GHSAHQ
Pedestrian Traffic Fatalities by State2018 PRELIMINARY DATA
15
Light LevelDarkness poses an especially high risk for those traveling by foot. On a national basis, about 75 percent of pedestrian fatalities in 2017 occurred after dark (Figure 5).
Figure 5 2017 Pedestrian Fatalities by Light Level
Figures 6 and 7 show trends in the numbers of daytime and nighttime pedestrian fatalities. From 2008 to 2017 the number of nighttime pedestrian fatalities increased by 45 percent, compared to a much smaller 11 percent increase in daytime pedestrian fatalities. Over this 10-year period, nighttime crashes accounted for more than 90 percent of the total increase in pedestrian deaths.
Figure 6 Number of Daytime and Nighttime Pedestrian Fatalities, 2008 - 2017
Nightime
Daytime
Sou
rce:
FA
RS
Sou
rce:
FA
RS

Spotlight on Highway Safety | Governors Highway Safety Association | ghsa.org | @GHSAHQ
Pedestrian Traffic Fatalities by State2018 PRELIMINARY DATA
16
Figure 7 Percentage of All Pedestrian Fatalities that Occurred in the Dark, 2008-2017
LocationAs illustrated in Figure 8, the largest category of roads on which pedestrian fatalities occurred in 2017 was local streets, followed by state highways. A surprisingly large number of pedestrian fatalities – ten percent of the total – occurred on Interstates. Some of the pedestrian fatalities on Interstates involve motorists who are struck while standing outside of their cars due to mechanical issues or minor crashes.
Figure 8 Pedestrian Fatalities by Roadway Type, 2017
Sou
rce:
FA
RS
Sou
rce:
FA
RS

Spotlight on Highway Safety | Governors Highway Safety Association | ghsa.org | @GHSAHQ
Pedestrian Traffic Fatalities by State2018 PRELIMINARY DATA
17
On a national basis, about 26 percent of pedestrian fatalities in 2017 occurred at intersections or were intersection-related (Figure 9). The majority of pedestrian fatalities occurred at non-intersection locations.
Figure 9 2017 Pedestrian Fatality Locations
Sou
rce:
FA
RS

Spotlight on Highway Safety | Governors Highway Safety Association | ghsa.org | @GHSAHQ
Pedestrian Traffic Fatalities by State2018 PRELIMINARY DATA
18
Alcohol and Other DrugsAlcohol impairment — for the driver and/or pedestrian — was reported in about half of traffic crashes that resulted in pedestrian fatalities in 2017. An estimated 32 percent of fatal pedestrian crashes involved a pedestrian with a Blood Alcohol Concentration (BAC) of 0.08 grams per deciliter (g/dL) or higher; an estimated 17 percent of drivers involved in these crashes had a BAC of 0.08 or higher (Figure 10).
Even in cases where the pedestrian’s or driver’s alcohol consumption may not be identified by police as a contributing factor to the crash, a pedestrian or driver with a BAC of .08 or higher has diminished faculties that could impact judgment, decision-making, and reaction time.
Figure 10 Percent of Pedestrians and Drivers with BACs ≥ 0.08 g/dL in Fatal 2017 Pedestrian Crashes
Sou
rce:
FA
RS
Spotlight on Highway Safety | Governors Highway Safety Association | ghsa.org | @GHSAHQ
Pedestrian Traffic Fatalities by State2018 PRELIMINARY DATA
19
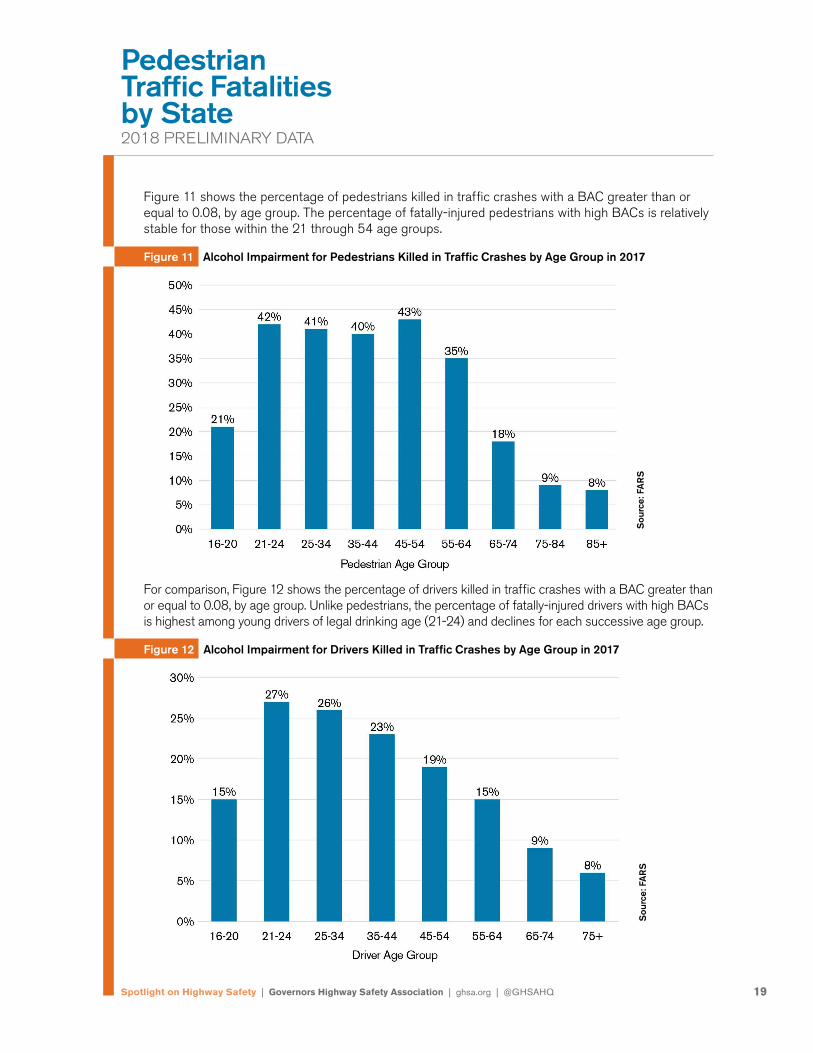
Figure 11 shows the percentage of pedestrians killed in traffic crashes with a BAC greater than or equal to 0.08, by age group. The percentage of fatally-injured pedestrians with high BACs is relatively stable for those within the 21 through 54 age groups.
Figure 11 Alcohol Impairment for Pedestrians Killed in Traffic Crashes by Age Group in 2017
For comparison, Figure 12 shows the percentage of drivers killed in traffic crashes with a BAC greater than or equal to 0.08, by age group. Unlike pedestrians, the percentage of fatally-injured drivers with high BACs is highest among young drivers of legal drinking age (21-24) and declines for each successive age group.
Figure 12 Alcohol Impairment for Drivers Killed in Traffic Crashes by Age Group in 2017S
ourc
e: F
AR
S
Sou
rce:
FA
RS

Spotlight on Highway Safety | Governors Highway Safety Association | ghsa.org | @GHSAHQ
Pedestrian Traffic Fatalities by State2018 PRELIMINARY DATA
20
In addition to alcohol, both drivers and pedestrians involved in traffic fatalities can be under the influence of other drugs, although the best available data is incomplete. For example, if alcohol is present, tests may not be administered for other drugs. Also, caution should be exercised in assuming that drug presence implies impairment. Drug tests do not necessarily indicate impairment at the time of the test. In some cases, drug presence can be detected for a period of days or weeks after ingestion.
Figure 13 shows the percent of (tested) fatally-injured pedestrians that had police-reported drug involvement for pedestrians ages 18-35 and for all those ages 18+. The most commonly-reported drug was methamphetamine. Because fatally-injured pedestrians that test positive for drugs can also have BACs greater than or equal to 0.08, combining the percentages in figures 10 and 13 would result in an overcount.
Figure 13 Percent of (Tested) Fatally-Injured Pedestrians with Police-Reported Drug Involvement, 2017
Sou
rce:
FA
RS

Spotlight on Highway Safety | Governors Highway Safety Association | ghsa.org | @GHSAHQ
Pedestrian Traffic Fatalities by State2018 PRELIMINARY DATA
21
Vehicle TypeFigure 14 shows the number of pedestrians killed in single-vehicle crashes by vehicle type in 2017. The largest category of striking vehicles (42 percent of the total) was passenger cars.
Figure 14 Number of Pedestrians Killed in Single-Vehicle Crashes by Vehicle Type in 2017
Figure 15 shows trends in the numbers of pedestrians killed in single-vehicle crashes involving passenger cars and SUVs from 2013 to 2017. Although passenger cars account for a larger number of pedestrian deaths, the number of pedestrian fatalities involving SUVs increased at a greater rate — 50 percent — during this 5-year period compared to passenger cars, which increased by 30 percent.
Figure 15 Number of Pedestrians Killed in Single-Vehicle Crashes Involving Passenger Cars and SUVs, 2013 - 2017
Sou
rce:
FA
RS
S
ourc
e: F
AR
S

Spotlight on Highway Safety | Governors Highway Safety Association | ghsa.org | @GHSAHQ
Pedestrian Traffic Fatalities by State2018 PRELIMINARY DATA
22
WHAT ABOUT CITIES?
Because most pedestrian fatalities occur in urban areas, GHSA also examined changes in the number of pedestrian fatalities for the ten most populous U.S. cities.
The total number of pedestrian fatalities for the ten largest cities decreased by about 15 percent, from 2016 to 2017, but remained about 9 percent higher than in 2015 (Figure 16).
Figure 16 Pedestrian Deaths in the 10 Largest U.S Cities – 2015 - 2017
Figure 17 shows the number of pedestrian fatalities for each of the ten largest cities in 2015, 2016, and 2017. Several cities had substantial reductions in pedestrian fatalities in 2017, including New York, Los Angeles, San Antonio and San Diego.
Figure 17 Pedestrian Deaths in the 10 Largest U.S Cities – 2015 - 2017
Sou
rce:
FA
RS
S
ourc
e: F
AR
S

Spotlight on Highway Safety | Governors Highway Safety Association | ghsa.org | @GHSAHQ
Pedestrian Traffic Fatalities by State2018 PRELIMINARY DATA
23
EFFORTS TO REDUCE PEDESTRIAN FATALITIES AND INJURIES
Achieving robust and sustained progress toward reducing – and someday eliminating — pedestrian fatalities and injuries requires a comprehensive approach to pedestrian safety that combines:
●● Enforcement;
●● Engineering;
●● Education; and
●● Emergency medical response.
Programs should incorporate the latest advances in technology and best practices and must be tailored to the needs of state and local communities.
Federal Safety Programs and Resources Federal government resources available to help states reduce pedestrian fatalities and serious injuries include the following:
i Section 402. The State and Community Highway Safety Grant Program is the cornerstone of state behavioral highway safety strategies. It provides the greatest flexibility for states to target resources to meet their most pressing needs. Eighteen states responding to GHSA’s questionnaire for this report indicated they currently use Section 402 funds to support pedestrian safety programs.
i Pedestrian and Bicycle Safety Focus States and Cities. Since 2004, the Federal Highway Administration’s (FHWA’s) Safety Office has been working aggressively to reduce pedestrian deaths by focusing extra resources on the cities and states with the highest numbers of pedestrian fatalities and/or fatality rates. Part of this effort has included How to Develop a Pedestrian Safety Action Plan, which helps state and local officials know where to begin to address pedestrian safety issues.
i Section 403. Under this program, NHTSA has conducted a series of education and enforcement efforts in pedestrian focus cities, including demonstration projects in Louisville, New York City, and Philadelphia. In addition, funds were awarded to the Safe States Alliance for a project on injury prevention for pedestrians.
i Section 405. The FAST Act, enacted on December 15, 2015, created a new National Priority Safety Program, Section 405(h) Nonmotorized Safety, to provide approximately $70 million annually through Federal Fiscal Year (FFY) 2020 for eligible states to decrease pedestrian and bicyclist crash fatalities. Under the nonmotorized safety grant program, NHTSA awarded approximately $14 million to 22 states for FFY 2017, 23 states for FFY 2018, and has determined 25 states to be eligible for grants being awarded this year for FFY 2019. A state is eligible if its bicyclist and pedestrian fatalities exceed 15% of its total annual crash fatalities based on the most recent year of FARS data available. Funds may be used to train law enforcement officials on bicyclist/pedestrian traffic laws, for bicyclist/pedestrian safety enforcement of these laws, and for education campaigns promoting bicyclist/pedestrian traffic laws. Congress could provide states more flexibility in the kinds of programs these funds can be used for, such as public education on safe bicyclist and pedestrian practices generally, not just traffic laws, on the safe use of
Spotlight on Highway Safety | Governors Highway Safety Association | ghsa.org | @GHSAHQ
Pedestrian Traffic Fatalities by State2018 PRELIMINARY DATA
24
infrastructure, to aggregate more data on non-motorized safety, and to expand programs to more classes of non-motorized road users.
i Highway Safety Improvement Program (HSIP). The goal of this program is to achieve a significant reduction in traffic fatalities and serious injuries on all public roads, including non-state-owned public roads and roads on tribal lands. The HSIP requires a data-driven, strategic approach to improving highway safety, focusing on the application of proven engineering countermeasures to significantly reduce fatal and serious-injury crashes. Although prior federal transportation legislation allowed HSIP funds to be spent on public education and law enforcement efforts – and several states leveraged this opportunity – this option was eliminated in the latest reauthorization bill.
What States Are Doing SHSOs are committed to improving the safety of all road users by focusing on behavioral issues that lead to traffic crashes such as impaired, distracted and aggressive driving; seat belt use; child passenger, pedestrian, bicyclist and motorcyclist safety; and teen and older driver issues. SHSOs are typically tasked with addressing behavioral safety issues via education and enforcement initiatives. SHSOs administer federal highway safety grants (including Sections 402 and 405 as outlined above) and produce annual state Highway Safety Plans (HSPs) as required by the U.S. Department of Transportation. In some states, SHSOs are responsible for traffic records coordination and Safe Routes to School programs.
Many factors that contribute to pedestrian crashes are outside of the control of SHSOs. For example, traffic engineering considerations such as roadway design, traffic signal design, sidewalk construction, and street lighting fall under the purview of the engineering divisions of state and local DOTs. SHSOs work with their state DOT counterparts to align behavioral solutions with engineering efforts. SHSOs provided the following examples of strategies they and their partners employ to reduce pedestrian fatalities and serious injuries:
●● Targeted law enforcement efforts.
i For example, Massachusetts provided funding to 84 local police departments across the state to conduct overtime enforcement patrols aimed at reducing pedestrian and bicyclist injuries and fatalities.
●● Public information campaigns.
i For example, Connecticut introduced the “Watch for Me CT” campaign, which is a statewide educational community outreach campaign involving media components and community engagement in partnership with CT Children’s Medical Center.
●● Educational outreach in high-risk areas.
i For example, the Georgia Office of Highway Safety has grantees in cities with significant increases in pedestrian fatalities that are working on educational programs. These programs have been focused on areas where there are significant numbers of people who walk as a primary form of transportation.

Spotlight on Highway Safety | Governors Highway Safety Association | ghsa.org | @GHSAHQ
Pedestrian Traffic Fatalities by State2018 PRELIMINARY DATA
25
●● Safe Routes to School programs.
i For example, Ohio DOT administers funding that can be used to improve the design of pedestrian facilities, such as the Safe Routes to School program, which provides $4 million annually to communities looking to improve the safety of K-8 students who walk or bike to school.
●● Focusing enforcement in high-risk zones.
i For example, the Delaware Office of Highway Safety partners with law enforcement agencies in high crash locations to educate pedestrians and give citations when necessary.
●● Pedestrian safety assessments/road safety audits.
i For example, New York State DOT is conducting pedestrian safety site evaluations at approximately 2,000 unsignalized midblock crosswalks and 2,400 signalized crosswalks on state-maintained routes in urban areas.
●● Support for engineering countermeasures, including some that target high-risk pedestrian crossing intersections and corridors.
i For example, Florida allocated $100 million to lighting improvements in 2,500 priority locations across the state to increase the visibility of pedestrians using the roadway at night.
●● Adoption of Complete Streets policies, which direct transportation planners and engineers to routinely design and operate the entire right of way to enable safe access for all users, regardless of age, ability, or mode of transportation.
●● Inclusion of pedestrian safety action items in Strategic Highway Safety Plans (SHSPs).
Every state is addressing pedestrian safety using a combination of engineering, education and enforcement. Specific SHSO-reported activities are provided in the Appendix. This list does not represent the full spectrum of activities happening across the country.

Spotlight on Highway Safety | Governors Highway Safety Association | ghsa.org | @GHSAHQ
Pedestrian Traffic Fatalities by State2018 PRELIMINARY DATA
26
DISCUSSION
2 https://www.fhwa.dot.gov/policyinformation/travel_monitoring/18juntvt/
3 Insurance Institute for Highway Safety. 2018. Subaru crash avoidance system cuts pedestrian crashes Status Report, Vol. 53, No. 3 | May 8, 2018
In recent years, pedestrian fatalities in the U.S. have risen at an alarming and unprecedented rate:
●● During the 10-year period 2008-2017 the number of pedestrian fatalities increased by 35 percent, while the number of all other traffic deaths combined decreased by six percent.
●● GHSA projects 6,227 pedestrians were killed in traffic crashes 2018, representing a four percent increase from 2017 and the largest annual number of pedestrian fatalities in the U.S. since 1990.
●● Pedestrian deaths as a percent of total motor vehicle crash deaths increased from 12 percent in 2008 to 16 percent in both 2016 and 2017. Pedestrians now account for the largest proportion of traffic fatalities in more than 30 years.
●● The number of states with pedestrian fatality rates >2.0 per 100,000 population more than doubled from seven in 2014 to 15 in both 2016 and 2017.
Many factors outside the control of traffic safety officials contribute to the observed year-to-year changes in the number of pedestrian fatalities, including economic conditions, population growth demographic change, weather, fuel prices, the amount of motor vehicle travel, and the amount of time people spend walking. Travel monitoring data published by FHWA indicates that motor vehicle travel on all roads and streets increased by 0.3 percent for the first half of 2018 as compared with the same period in 2017.2 The increase in motor vehicle travel was smaller on non-interstate urban arterials (0.2 percent) and other urban roads (0.1 percent) where most pedestrian fatalities occur. Unfortunately, comparable exposure data for nationwide pedestrian activity is not available.
Other factors contributing to the recent rise in the overall number of pedestrian fatalities could include the increasing shift in U.S. vehicle sales away from passenger cars to light trucks (with light trucks generally causing more severe pedestrian impacts than cars), and the large growth in smartphone use (which can be a significant source of distraction for all road users).
Figure 18 shows U.S. retail sales (in thousands) of passenger cars and light trucks from 2008-2017, indicating a sharp increase in sales of light trucks accompanied by a decline in sales of passenger cars. Figure 19 shows a correspondingly steady increase in light trucks as a percent of total light vehicle sales.
Light trucks – as well as passenger cars – can be made safer by installing automatic emergency braking systems that can detect and brake for pedestrians. This technology uses information from forward-looking sensors to automatically apply or supplement the brakes when the system determines a pedestrian is in imminent danger of being struck. A recent study found that automatic emergency braking technology installed by one vehicle manufacturer was associated with a 35 percent reduction in the rate of likely pedestrian-related insurance claims.3
https://www.fhwa.dot.gov/policyinformation/travel_monitoring/18juntvt/

Spotlight on Highway Safety | Governors Highway Safety Association | ghsa.org | @GHSAHQ
Pedestrian Traffic Fatalities by State2018 PRELIMINARY DATA
27
Figure 18 Retail Sales (in thousands) of Passenger Cars and Light Trucks, 2008-2017
Figure 19 Light Trucks as a Percent of Total U.S. Light Vehicle Sales, 2008-2017
Sou
rce:
U.S
. Dep
artm
ent o
f Com
mer
ce B
urea
u of
Eco
nom
ic A
naly
sis
(BE
A)
Sou
rce:
U.S
. Dep
artm
ent o
f Com
mer
ce B
EA

Spotlight on Highway Safety | Governors Highway Safety Association | ghsa.org | @GHSAHQ
Pedestrian Traffic Fatalities by State2018 PRELIMINARY DATA
28
Regarding cellphone use, the reported number of smartphones in active use in the U.S. more than quintupled from 2010 to 2017, and the amount of wireless data usage over this period increased by about 4,000 percent (Figures 21 and 22).4
Figure 21 Number of Smartphones in Active Use
Figure 22 Annual Wireless Data Traffic (Billions of MB)
4 Chakravarthy, B.; Anderson, C.L.; Ludlow, J.; Lotfipour, S.; and Vaca, F.E. 2010. The Relationship of Pedestrian Injuries to Socioeconomic Characteristics in a Large Southern California County. Traffic Injury Prevention 11/5.
Spotlight on Highway Safety | Governors Highway Safety Association | ghsa.org | @GHSAHQ
Pedestrian Traffic Fatalities by State2018 PRELIMINARY DATA
29
Analysis of data from the National Electronic Injury Surveillance data base shows the number of cell-phone-related Emergency Department visits is increasing in parallel with the prevalence of cell phone use in the United States.5 Many of these injuries are sustained while the user is engaged in text messaging rather than conventional telephone conversation, and this trend appears to have contributed to a sharper increase in the number of incidents in recent years.
Although the surge in smartphone use coincides with a sharp rise in pedestrian fatalities during the same period, there is a lack of evidence to establish a definitive link. This may be due in part to the inability of police crash investigators to accurately capture momentary distraction caused by smartphones, many of which are mounted on vehicle dashboards and windshields.
That pedestrian deaths as a percent of total motor vehicle crash deaths have increased steadily in recent years (from 12 percent to 16 percent) could reflect, in part, the fact that passenger vehicles have become increasingly safer for vehicle occupants through design changes and supplemental safety equipment, thereby decreasing the chance of fatal injuries. Pedestrians, on the other hand, do not benefit from occupant-oriented vehicle crashworthiness improvements, and thus could account for an increasing share of total traffic fatalities. The movement toward equipping more vehicles with automatic braking and pedestrian detection technologies could help reduce pedestrian collisions.
The welcome decrease of 15 percent in pedestrian fatalities in the nation’s 10 largest cities from 2016 to 2017 might be attributable in part to aggressive traffic safety initiatives such as Vision Zero, which has a principal aim of reducing the number of pedestrian and bicyclists fatalities, with the long-term goal of bringing these numbers to zero.
This report provides insights into crash factors documented in FARS that can help inform the efforts of state and local safety officials to reduce pedestrian fatalities. For example:
●● About 75 percent of pedestrian fatalities occur after dark, and increases in pedestrian fatalities are occurring largely at night. From 2008 to 2017 the number of nighttime pedestrian fatalities increased by 45 percent, compared to a much smaller, 11 percent increase in daytime pedestrian fatalities. The growing prevalence of nighttime pedestrian fatalities suggests a need to prioritize engineering and enforcement countermeasures that can improve safety at night (e.g., improved street lighting, nighttime enforcement patrols).
●● About 60 percent of pedestrian fatalities occur on local streets and state highways. Challenging crossing locations such as multilane urban arterials often have bus stops or land use patterns that require pedestrians to cross busy roads. Countermeasures such as rectangular rapid flashing beacons, curb extensions, and pedestrian refuge islands can improve pedestrian safety in these environments.
●● Alcohol impairment is a major factor. An estimated 32 percent of fatal pedestrian crashes involved a pedestrian with a BAC of 0.08 or higher, and an estimated 17 percent of drivers involved in these crashes had a BAC of 0.08 or higher. Pedestrian safety can be addressed by conducting high visibility impaired driving enforcement in areas with robust nighttime pedestrian activity.
●● The majority of pedestrian fatalities occur at non-intersection locations. Although it is impossible to make all non-intersection locations safe or suitable for pedestrian activity, there are
5 Saltos, A.; Smith, D.; Schreiber, K.; Lichtenstein, S.; and Lichtenstein, R. 2015. Cell-Phone Related Injuries in the United States from 2000-2012Journal of Safety Studies ISSN 2377-3219 2015, Vol. 1, No. 1.

Spotlight on Highway Safety | Governors Highway Safety Association | ghsa.org | @GHSAHQ
Pedestrian Traffic Fatalities by State2018 PRELIMINARY DATA
3030
opportunities to improve pedestrian safety at midblock locations through speed enforcement and management along with increased street lighting.
●● Pedestrians struck by a large SUV are twice as likely to die as those struck by car.6 Design changes such as softer vehicle fronts, pedestrian detection systems, and replacing the blunt front ends of light trucks with sloping, more aerodynamic (car-like) designs can reduce the risk of pedestrian deaths in the event of a crash. In the short-run, local efforts to reduce speed limits and speeding in pedestrian zones can help reduce the severity of light truck-pedestrian crashes. As previously mentioned, the number of pedestrian fatalities involving SUVs increased by 50 percent from 2013 to 2017, significantly more than did passenger cars (which continue to be the largest category of vehicles involved in fatal pedestrian crashes).
Despite the overall increase in pedestrian deaths, there is some good news in the 2018 preliminary data. Twenty three states saw declines in pedestrian fatalities for the first half of 2018 compared to 2017, with six states reporting double-digit declines and three states reporting consecutive years of declines. Further, the sharp decrease in pedestrian fatalities in some cities suggests progress in urban centers that may not be reflected in state-level data.
SHSOs in all 50 states and territories continue to actively engage with their partners to implement a wide range of educational, enforcement and engineering initiatives aimed at reducing the numbers of pedestrian fatalities and serious injuries. Along with critical funding support provided through federal partners, states will continue to focus their efforts on effective countermeasures to reverse the trend of increasing pedestrian fatalities. In addition, some communities have seen a localized rise in pedestrian activism and pedestrian-centered safety planning, such as Vision Zero initiatives and the preparation of pedestrian action plans, while other communities lack this type of coordinated advocacy or planning.
The national footprint of pedestrian safety is not uniform, and there are many reasons for differing pedestrian fatality rates among states, including land use patterns, roadway designs, vehicle speeds, population density and demographics. The physical environment in which pedestrians walk has a profound influence on safety outcomes, and roadway design practices have been evolving over time to increasingly accommodate pedestrians, including those with disabilities. There is a significant time lag, however, in achieving roadway design improvements through roadway construction and land development projects.
6 Lefler, D.E. and Gabler, H.C. 2004. The fatality and injury risk of light truck impacts with pedestrians in the United States. Accident Analysis & Prevention Volume 36, Issue 2, Pages 295-304.

Spotlight on Highway Safety | Governors Highway Safety Association | ghsa.org | @GHSAHQ
Pedestrian Traffic Fatalities by State2018 PRELIMINARY DATA
3131
Socioeconomic status (SES) – in particular, poverty — is another strong risk factor for pedestrian crashes. For example, Canadian researchers analyzed the influence of SES levels on rates of death from unintentional injury among Canadian children from 1971 to 1998 and found that for each unit change in income quintile, from highest to lowest, the risk of death from pedestrian collisions increased by 13 percent.7 A California study found that pedestrian crashes are four times more frequent in poor neighborhoods and that neither age of the population, education, English language fluency, nor population density explained the effect of poverty.8
Although this pedestrian fatality analysis has focused on statewide data, pedestrian safety problems must also be considered on the local level, in the settings where pedestrian fatalities and serious injuries occur. States along with their local/regional partners should engage in robust data analyses and field assessments to identify high-risk corridors, allocate resources where they are most needed, and implement evidence-based pedestrian safety improvements on a systemic basis.
States should also continue to work with local law enforcement partners to address chronic driver violations that contribute to pedestrian crashes such as speeding, impaired driving and distracted driving.
Enhancing pedestrian safety is in all of our best interest: almost everyone is a pedestrian at some point in their day, whether just a short walk to the car, one’s primary form of transportation or somewhere in between. As fatal pedestrian crashes have come to represent a higher percentage of all traffic deaths, it is clear that this issue needs to be a continued priority for states and their partners in the effort to reach zero fatalities. While improvements to infrastructure are essential, educational campaigns and law enforcement have crucial roles to play in supporting and bolstering pedestrian safety. Together, we can implement proven countermeasures to achieve our shared goals.
7 Birken, C.S.; Parkin, P.C.; To, T.; and Macarthur, C. 2006. Trends in rates of death from unintentional injury among Canadian children in urban areas: influence of socioeconomic status. CMAJ 175(8).
8 Chakravarthy, B.; Anderson, C.L.; Ludlow, J.; Lotfipour, S.; and Vaca, F.E. 2010. The Relationship of Pedestrian Injuries to Socioeconomic Characteristics in a Large Southern California County. Traffic Injury Prevention 11/5.

Spotlight on Highway Safety | Governors Highway Safety Association | ghsa.org | @GHSAHQ
Pedestrian Traffic Fatalities by State2018 PRELIMINARY DATA
3232
APPENDIX: WHAT STATES ARE DOING
Every state is addressing pedestrian safety using a combination of engineering, education and enforcement. Specific SHSO-reported activities are provided. This list does not represent the full spectrum of activities happening across the country.
Alaska
Engineers have adopted internal policies on the use of refuge islands and divided traffic ways when applicable to new road construction. Some jurisdictions have adopted the Complete Streets concept.
Arizona
Arizona law enforcement agencies concentrate on enforcement, education and awareness when it comes to pedestrian safety, focusing on the habits of the pedestrian and the driver. Pedestrians are reminded to walk on a sidewalk facing traffic, cross at intersections or within crosswalks, be visible at night by wearing light colors, and avoid distractions like cell phone use. Drivers are reminded to look for pedestrians everywhere, always stop for them in crosswalks, never pass vehicles stopped at a crosswalk, and slow down around pedestrians, especially in neighborhoods and school zones.
California
California has implemented proven countermeasures such as:
●● Classroom and community group safety presentations;
●● Positive reinforcement citations for children demonstrating safe pedestrian behavior;
●● A Safetyville mock city to practice safe behavior;
●● Walking school bus activities;
●● Enforcement of safe driving behavior at crosswalks; and
●● Efforts to educate the community on how to interact with new types of infrastructure.
In addition, Section 402 funds were used in Lancaster to purchase utility box wraps with pedestrian safety messaging, as well as for the Southern California Association of Governments to promote community outreach and traditional countermeasures.
Colorado
The Colorado Highway Safety Office funds two large metro pedestrian enforcement grants and one community education grant. The City and County of Denver has highlighted pedestrian safety in its Vision Zero plan.
Connecticut
Connecticut introduced the “Watch for Me CT” campaign, which is a statewide educational community outreach campaign that involves media components and community engagement in partnership with CT Children’s Medical Center. Section 402 funds were used for the “Watch for Me CT” campaign, law enforcement training and the development of public information and education rack cards.
Spotlight on Highway Safety | Governors Highway Safety Association | ghsa.org | @GHSAHQ
Pedestrian Traffic Fatalities by State2018 PRELIMINARY DATA
3333
The first non-motorized safety course for law enforcement was held in 2018.
A statewide signage project was recently completed to ensure pedestrian signage was up to date with current standards, including near schools and bus stops.
On the public information and education front, track cards were developed with CT laws and safe driving tips related to pedestrian safety.
Delaware
The Delaware Office of Highway Safety partners with enforcement agencies in high crash locations to educate pedestrians and give citations when necessary. Delaware DOT conducts roadway safety audits, performs roadway diets, adds pedestrian lighting and builds sidewalks, among other pedestrian safety measures. Section 402 funds are used for education and enforcement efforts, as well as paid media.
District of Columbia
DC employed improvements in infrastructure; development and implementation of safety plans (i.e. SHSP, Vision Zero); behavioral safety programs; and technology enhancements that have helped to control the rate of change of pedestrian fatalities. Section 402 funds were used to target outreach to smaller geographic areas by Ward and – even at a lower level – zip code to engage the community and understand their concerns.
Florida
Florida uses a combination of education, enforcement, engineering and emergency response countermeasures that are data-driven and context-sensitive to improve pedestrian safety.
●● GIS maps are used to track the coordinated effort and to ensure that all elements work together comprehensively to ensure success.
●● Behavioral components include enforcement as a first line of education during high visibility enforcement sweeps in areas with higher representation of pedestrian-involved traffic crashes, as well as paid media and grassroots activities to educate the public on traffic laws and provide safety tips and information.
●● First responders are educated on the most common types of injuries sustained in crashes so they are prepared to provide the best possible response to crash victims. Additional education is provided in the trauma centers during the recovery process to crash victims, their families and friends.
●● Engineering components include Complete Streets and context-sensitive solutions to ensure that pedestrians have safe and accessible routes. This is overlaid with enforcement advice to engineers on how a pedestrian or motorist may use the selected countermeasure to ensure the state is putting the right elements in the right places based on the context of the community.
●● Florida allocated $100 million to lighting improvements in 2,500 priority locations across the state to increase the visibility of pedestrians using the roadway at night.

Spotlight on Highway Safety | Governors Highway Safety Association | ghsa.org | @GHSAHQ
Pedestrian Traffic Fatalities by State2018 PRELIMINARY DATA
3434
●● Educational materials are developed based on the context of the community to ensure that all messages resonate with the state’s diverse audiences. A new 4-hour classroom-based law enforcement training class was implemented in 2018, which all officers participating in high visibility pedestrian safety enforcement are required to attend.
●● Florida engages “brand ambassadors” to share safety messages and shift the safety culture. More than 70 federal, state and local partners, stakeholders and safety advocates on Florida’s Pedestrian and Bicycle Safety Coalition are committed to reducing fatalities with a goal of zero.
Florida uses a variety of funding sources to improve pedestrian safety, including 402 funds. For example, the University of South Florida Center for Urban Transportation Research (CUTR) was the subrecipient of a grant to implement a Florida Bicycle/Pedestrian educational paid media campaign, as well as a grant for facilitation and support of the functions of Florida’s Comprehensive Pedestrian and Bicycle Safety Program and Coalition.
Georgia
The Georgia Office of Highway Safety has grantees in cities with significant increases in pedestrian fatalities that are working on educational programs. These programs have been focused on areas where there are significant numbers of people who walk as a primary form of transportation. Much of the focus has been on school children. Georgia is also increasing the number of crosswalks with audible directions and countdowns. With regard to Section 402 programs, the City of Macon had one of the highest per capita fatality rates for pedestrians. City leaders including the mayor, council, sheriff and school system have worked on educational programs for all pedestrians.
Hawaii
Hawaii continued educational presentations to remind drivers and pedestrians about pedestrian safety. The state also used NHTSA funds for pedestrian enforcement efforts focused on drivers and pedestrians. As for infrastructure, Hawaii began installing “gateway” treatments in the Nuuanu area of Oahu, and Hawaii DOT has begun to display traffic safety messages on Dynamic Message Signs on Oahu’s highways. Section 402 funds are used for media, educational presentations and pedestrian enforcement.
Idaho
Idaho funds $2 million per year of bicycle and pedestrian infrastructure improvements and educational programs through the Transportation Alternatives Program. The Idaho Office of Highway Safety is working with the Idaho Walk and Bike Alliance to develop PSAs about walking and bicycling in Idaho.
Indiana
Indiana DOT is addressing pedestrian safety through emphasis on walkways, lighting, and audible signals. Section 402 funds are being used for a pedestrian and bicyclist safety program, and the agency will be implementing a new Stop Arm Violation Enforcement (SAVE) program to help enforcement focus on catching school bus stop arm violators to protect children getting on or off the school bus.

Spotlight on Highway Safety | Governors Highway Safety Association | ghsa.org | @GHSAHQ
Pedestrian Traffic Fatalities by State2018 PRELIMINARY DATA
3535
Kansas
Kansas’ primary focus has been on education, including small mini-grants to a number of cities. The primary countermeasures have been education efforts, distribution of brochures and creation of radio advertising.
Louisiana
The Louisiana Highway Safety Commission (LHSC) funds behavioral programs that educate young people on the pedestrian laws and how to be safe when walking. This is accomplished through safety towns, bike rodeos, and one-on-one education. The Department of Transportation and Development (DOTD) initiated three new pedestrian and bicycle planning projects in different jurisdictions, kicked off a statewide analysis of pedestrian and bicyclist crashes to identify risk factors and influence countermeasure prioritization, and supported an MPO project that provided safety equipment to schools and shelters along with a data-driven media campaign encouraging “safe streets for everyone.” From a broader perspective, DOTD has continued implementing its Complete Streets policy to ensure the safety and infrastructure needs of pedestrians are considered on every project.
LHSC has used 402 funds for behavioral projects to educate young people on ways to safely walk and increase their knowledge of Louisiana laws. The educational projects conduct classroom presentations, coordinate safety towns, administer pre- and post-tests to gauge knowledge change, and coordinate community outreach events. Another project utilizing 402 funds works with schools in the greater New Orleans area to develop travel safety plans that include pedestrian and bicycle safety. Students are taught about pedestrian safety through a curriculum and a safety town.
Maine
The Maine Bureau of Highway Safety, with Maine DOT and designated partners, conducts an extensive and targeted public education program and outreach campaign aimed at pedestrians and motor vehicle safety. Print materials for pedestrians and drivers are distributed to businesses and community centers in locations identified by Maine DOT. Maine uses multiple media venues to promote the “Heads Up! Safety is a Two-Way Street” campaign. Media efforts concentrate in the top 10 community clusters with the highest pedestrian fatality rates. The focus of the media campaign is to educate the walking and motoring public about pedestrian hazards.
Targeted enforcement serves to increase compliance with appropriate traffic laws by both pedestrians and motorists. Behavioral pedestrian safety initiatives require improvements in unsafe driver or pedestrian behaviors. Traffic enforcement focuses on the high pedestrian-motor vehicle crash locations across the State of Maine based on the past three years of data.
Maine currently has several programs approved in their Highway Safety Plan with 402 funding, including a planned activity for the “Heads Up! Safety is a Two-Way Street” educational and media campaign for pedestrians. It also has High Crash Pedestrian Community Law Enforcement Agencies as well a Targeted Pedestrian-Motor Vehicle Traffic Enforcement program.
Massachusetts
The Massachusetts Office of Highway Safety developed educational media messaging on pedestrian safety in collaboration with Massachusetts DOT (MassDOT). Additionally, Massachusetts provided funding to 84 local police departments across the state to conduct overtime enforcement patrols

Spotlight on Highway Safety | Governors Highway Safety Association | ghsa.org | @GHSAHQ
Pedestrian Traffic Fatalities by State2018 PRELIMINARY DATA
3636
aimed at reducing pedestrian and bicyclist injuries and fatalities. Subrecipients were also allowed to purchase equipment specifically for improving pedestrian and bicycle safety such as traffic cones, crosswalk signs, crosswalk markers and bicycle helmets. On the engineering front, MassDOT performed a safety evaluation of the improvement of 34 signalized intersections throughout the Commonwealth. Intersection improvements included signal equipment and timing upgrades; pedestrian, bicycle and ADA improvements; pavement resurfacing; and signage and pavement marking upgrades.
The majority of MassDOT’s federally funded projects involve intersection improvements or redesigns to make roads safer for all users (motor vehicle occupants, motorcyclists, bicyclists and pedestrians). Through subrecipient WalkBoston, MassDOT also helped fund an engineering-centric project that worked with six communities with high incidence of pedestrian injuries and fatalities to develop strategies for improving their respective towns’ walking environments.
Section 402 funds are used for pedestrian and bicycle media, including the initial launch of a “Scan the Street for Wheels and Feet” awareness campaign done in collaboration with MassDOT.
Michigan
Michigan is implementing a variety of measures to improve pedestrian safety, including law enforcement training and mobilization, public education, Road Safety Audits (RSAs), a Work Zone Mobility Manual featuring guidance on the treatment of pedestrians in work zones, Complete Streets policies and traffic control devices.
Over two years, Michigan used Section 402 funds to conduct a comprehensive pedestrian and bicyclist crash evaluation through Western Michigan University. A pedestrian and bicyclist safety statewide conference was held in May 2016, using 402 funds, to share the information and results of the 2016 Michigan Comprehensive Pedestrian and Bicycle Crash Evaluation Report.
Minnesota
Minnesota provided the following examples of pedestrian safety projects:
●● Evaluation of Sustained Enforcement, Education, and Engineering Measures on Pedestrian Crossings study, HumanFirst Lab, University of Minnesota: The objective of this study is to review the City of St. Paul’s effort to improve pedestrian safety and investigate whether a program similar to a NHTSA-supported study could be applied to changing the driving culture related to yielding to pedestrians and speed compliance on arterial and collector roads on a citywide basis.
●● Enforcing Pedestrian Laws: More than one-fourth of pedestrian deaths occur in Hennepin County, and the majority within the city of Minneapolis. Minnesota crash data show that drivers made errors in judgment approximately half of the time, and the other half, the pedestrian made the error. Aiming to decrease the number of pedestrian fatalities, a grant was written with the Minneapolis Police Department and the Ramsey County Sheriff’s Office to conduct HVE and increase the number of citations written to pedestrians and drivers.
Missouri
Limited applications of traffic calming are being implemented (speed humps, roundabouts, road diets, etc.). Enhanced signing, particularly at mid-block crossings, is frequently used to emphasize pedestrian

Spotlight on Highway Safety | Governors Highway Safety Association | ghsa.org | @GHSAHQ
Pedestrian Traffic Fatalities by State2018 PRELIMINARY DATA
3737
crossings. In addition, pedestrian countdown timers and audible pedestrian signals are being used at several signalized intersections. Behavioral solutions are more limited, but public awareness campaigns focused on keeping pedestrians safe have been conducted in St. Louis and Kansas City.
Montana
Pedestrian fatalities have represented approximately seven percent of all fatalities in Montana during the last five years. Montana’s Comprehensive Highway Safety Plan requires that the Montana Department of Transportation (MDT) review fatalities on high-risk roads and fatalities and serious injuries per capita among older drivers and pedestrians annually to assess if action is needed. The Roadway Departure and Intersection Crashes emphasis area contains a strategy to “reduce and mitigate intersection crashes through data-driven problem identification and the use of best practices.” Under this strategy, MDT has developed an implementation step to construct infrastructure improvements to mitigate intersection-related crashes. Examples include but are not limited to: turn lanes; signal phasing/timing; flashing yellow arrows; retroreflective backplates on signals; sight distance improvements; roundabouts or other intersection control improvements; pedestrian improvements, including improvements at midblock crossings; bicycle improvements; signal coordination and timing improvements; enhanced/improved lighting; or enhanced/improved signing.
MDT requires that during any construction project, pedestrian issues are reviewed to determine the best practice for the specific project.
Nevada
After having a record year in 2017 with 100 pedestrian fatalities statewide, the Nevada Office of Traffic Safety through the Zero Fatalities program launched an aggressive new Pedestrian Safety campaign in May of 2018. Nevada’s campaign speaks to drivers and pedestrians, emphasizing the role of both in enhancing safety. The campaign is highly geo-targeted to the most dangerous roads, intersections and behaviors to best reach its audience and is primarily a paid media approach, complemented with public relations safety messages.
New Hampshire
The New Hampshire Highway Safety Office works directly with its local law enforcement partners to educate, message and enforce pedestrian and bicyclist safety laws on the state’s roadways.
New Jersey
The primary activities being implemented include overtime enforcement and education funding to police departments. Both the State Pedestrian Fund and Section 402 funds are used to pay for overtime enforcement that target high pedestrian crash locations and provide pedestrian safety education materials for delivery to high-risk segments of the pedestrian population.
New Mexico
New Mexico has created “Look For Me” corridors, high crash risk travel corridors coupled with high frequency transit travel corridors throughout Albuquerque. Road Diets are being studied and implemented in parts of the city.
Spotlight on Highway Safety | Governors Highway Safety Association | ghsa.org | @GHSAHQ
Pedestrian Traffic Fatalities by State2018 PRELIMINARY DATA
3838
New York
The Governor’s Traffic Safety Committee (GTSC), the New York State Department of Health (NYS DOH), and the NYS Department of Transportation (NYS DOT) are continuing to play key roles in pedestrian safety guided by the New York State Pedestrian Safety Action Plan (PSAP). The $110 million initiative identifies 20 “focus communities,” which account for nearly 50 percent of all pedestrian crashes. The five-year plan calls for a variety of low-cost engineering improvements undertaken by NYS DOT, enforcement strategies organized by GTSC and educational/public information initiatives spearheaded by NYS DOH.
NYS DOT is conducting pedestrian safety site evaluations at approximately 2,000 unsignalized midblock crosswalks and 2,400 signalized crosswalks on state-maintained routes in urban areas. Improvements to crosswalk safety design and construction, consisting of proven countermeasures to reduce conflicts between pedestrians and vehicles, are also ongoing.
GTSC planned, promoted and coordinated two, six-hour pedestrian safety training workshops for law enforcement officers. Officers learned about the state’s plan to address pedestrian injuries and fatalities, relevant vehicle and traffic laws, pedestrian crash issues and data. They were also given tools and strategies for the effective implementation of pedestrian education and enforcement countermeasures.
GTSC also conducted an annual pedestrian safety enforcement mobilization. GTSC worked with police agencies covering 20 designated PSAP “focus communities” to allocate a portion of their PTS grant to fund additional patrols during the high-visibility blitz, “Operation See! Be Seen!” Grantees were encouraged to issue warnings and educational materials prepared by the NYS DOH to pedestrians and drivers found violating safety laws during the first week of the campaign, and citations during the second week.
New York City has its own pedestrian safety initiative known as Vision Zero. Age-appropriate educational and outreach programs are provided at hundreds of schools and senior centers in target communities. Multi-language presentations are provided to parents at health centers, schools and public assistance centers. Outreach to schools includes meetings with principals and school staff and walking tours to identify issues around the locations. New York City’s Department of Transportation also staffs street teams to engage with community residents and business owners in high-risk corridors.
North Carolina
The “Watch for Me NC” program grant supports training for law enforcement related to crosswalk and pedestrian traffic laws.
North Dakota
North Dakota DOT teamed up with local communities to plan, design and install temporary Active Transportation Demonstration Projects. These temporary demonstration projects help determine the public’s desired types of long-term changes for safer streets. These demonstration projects included crosswalk enhancements in which nine communities participated. The projects are designed to make the intersections more pedestrian-friendly while keeping vehicular traffic moving.
Engineering measures include new or replaced pedestrian and bicyclist facilities, new bicycle lanes, new or replaced ADA measures, and pedestrian signage. The facilities are placed throughout the state where federal funding was requested and awarded along with local funding matches.

Spotlight on Highway Safety | Governors Highway Safety Association | ghsa.org | @GHSAHQ
Pedestrian Traffic Fatalities by State2018 PRELIMINARY DATA
3939
Law enforcement is also tasked with enforcing pedestrian right-of-way laws when they encounter violations.
Ohio
Ohio DOT (ODOT) developed materials for a statewide campaign around pedestrian safety in 2018, called “Your Move Ohio.” Messages included “Yield to Pedestrians When Turning,” “Look Out for Each Other,” and “Slow Down, Watch for Pedestrians.” The campaign included a statewide advertisement buy, social media page, development of materials for local communities, car magnets and distribution of flashing reflectors across the state. In addition, Ohio DOT and statewide partners are working to emphasize pedestrian safety within the novice Driver’s Education Program. Statewide partners are creating supplemental materials on driver education emphasizing laws that keep pedestrians safe.
Regarding enforcement, ODOT facilitates a statewide active transportation network for partners and practitioners. Best practices for bicyclist and pedestrian safety are shared, including enforcement strategies. Within the scope of the Safe Routes to School Program, ODOT funds projects to improve student safety, including training and implementation of enforcement activities. At least four communities were awarded projects in 2018 that addressed enforcement in some way.
ODOT administers funding that can be used to improve the design of pedestrian facilities. For example, the Safe Routes to School program provides $4 million annually to communities looking to improve the safety for K-8 students to walk or bike to school. The Transportation Alternatives program provided roughly $27 million for projects in 2018, many of which supported bicycle and pedestrian facilities. The Highway Safety Improvement Program funds programs focused on improving roadway safety, for which pedestrian projects are eligible.
Through Section 402 funding, each Safe Communities program can direct programming based on local problem identification. Butler County, Franklin County and Hamilton County (which represent 28 percent of statewide pedestrian fatalities) have proposed pedestrian activities in their grants to address pedestrian issues. Butler, Franklin and Hamilton County Safe Communities will conduct evidence-based programs that will specifically address their pedestrian problem identification.
Oklahoma
The Oklahoma Highway Safety Office has supported a pilot project in Tulsa for the last three years to identify means and methods for improving pedestrian and bicyclist safety. This effort involves both enforcement and engineering concepts working together to identify and address the increasing number of pedestrian fatalities. The “Walk This Way” and “Everyone is a Pedestrian” programs have been used in both Tulsa and Oklahoma City, but not to any great extent yet. The DOT sponsors a bicyclist and pedestrian safety committee that makes recommendations for improved engineering assistance in roadway design. Several larger communities have added pavement markings and signage to better indicate bicycles are allowed on the main roadways unless other prohibited. Additionally, the use of a “3-foot buffer” is encouraged and in some cases mandated by local laws.
Oregon
The Oregon Department of Transportation (ODOT) re-released its PSA for the “Oregonian Crossing – Every Intersection is a Crosswalk” campaign in theatres and Facebook ads. Oregonian Crossing yard signs were also created and distributed to all regions. The new campaign “Oregonians Standout” was

Spotlight on Highway Safety | Governors Highway Safety Association | ghsa.org | @GHSAHQ
Pedestrian Traffic Fatalities by State2018 PRELIMINARY DATA
4040
also released to remind Oregonians to be visible to drivers. The state re-released the “Say What You See” back-to-school pedestrian safety PSA in September. An updated brochure on “What you need to know about Oregon Crosswalk Laws: A Driver’s Guide” was created and translated in other languages to be distributed to local Department of Motor Vehicle offices and local police departments. Also, the state created a pocket “Driver’s Field Guide to Sharing Oregon’s Roads” which is also stocked at DMV offices and used in partnership with the state Driver Education Program.
Pedestrian Safety Enforcement (PSE) Operation overtime mini-grants were awarded to 28 local law enforcement agencies to do PSE operations statewide from April to September 2017. Non-funded law enforcement agencies also conducted their own PSE operations throughout the year.
In 2014, ODOT developed the Oregon Statewide Pedestrian and Bicycle Safety Implementation Plan. Oregon did a crash- and risk-based analysis with practitioners statewide to develop a list of systemic mitigation measures being implemented with HSIP funds. For 2017 statewide, ODOT continued to implement improved pedestrian crossings, including: installation of Rapid Flashing Beacons and Pedestrian Hybrid Beacons, using Leading Pedestrian Intervals, and upgrading and installing accessible pedestrian push buttons, sidewalks and curb ramps. ODOT has made it common practice to use advanced stop bars at signalized intersections as a pedestrian/bicyclist safety measure. Also, House Bill 2017 (Keep Oregon Moving) passed, approving funding of multiple transportation projects to include statewide pedestrian safety improvement and Safe Routes to School infrastructure in the coming years.
Pennsylvania
Pennsylvania law enforcement conduct targeted enforcement stings for motorists who fail to yield to pedestrians in crosswalks. The Pennsylvania Department of Transportation (PennDOT) website has a number of safety videos targeted at parents and children that are focused on walking safely to school. Packages of pedestrian safety cards have been distributed at numerous events. The state’s district press and safety officers execute a range of other activities in support of pedestrian safety. From an engineering perspective, the state is focused on being more aggressive with road diets, bulb-outs, speed tables and raised intersections.
Rhode Island
Rhode Island has created a law enforcement pedestrian safety training, which all agencies requesting funding for pedestrian projects are required to attend. The training offers best practices, data and a review of pedestrian statutes and policies. A training course is also available for businesses and their employees, which offers some of the same information and data. Infrastructure measures include road diets and statewide mitigation programs focused on curves, signalized intersections and high-risk crosswalks.
South Carolina
The Office of Highway Safety and Justice Programs partnered with the South Carolina Highway Patrol to specifically target pedestrian and bicyclist safety issues through the Target Zero umbrella campaign. The Highway Patrol utilizes multiple avenues in its effort to educate the public about highway safety issues related to pedestrians, bicyclists and mopeds. Community Relations Officers give approximately 700 safety presentations a year, attend hundreds of safety fairs and give thousands of interviews on various topics, including the topic of vulnerable roadway users. Section 402 funds were used for a billboard campaign to supplement the Vulnerable Roadway Users (VRU) outreach efforts that had been used in the past. A sustained, redesigned VRU campaign is planned for spring 2019.

Spotlight on Highway Safety | Governors Highway Safety Association | ghsa.org | @GHSAHQ
Pedestrian Traffic Fatalities by State2018 PRELIMINARY DATA
41
Texas
The state is conducting educational, training, outreach, research and engineering measures to address pedestrian safety. Some engineering efforts include: 1) safer places to walk along a roadway such as complete sidewalk networks; 2) safer places to cross a roadway such as intersection improvements including pedestrian signals, detection and crosswalks; and 3) Pedestrian Hybrid Beacons for mid-block crosswalks.
Section 402 funds are used to support the following projects:
●● Pedestrian and bicyclist outreach
●● Early child safety education focusing on pedestrians/bicyclists aged 5-10 years old
●● Statewide pedestrian and motorist outreach and support to address pedestrian safety
Utah
Utah placed messaging on sidewalks and near public transportation informing people about pedestrian myths such as “pedestrians always have the right of way.” They have also coordinated crosswalk enforcement mobilizations and encouraged each police department to reach out to their local media for coverage. Each of these mobilizations has been coupled with straightforward social media posts explaining laws. Utah is currently conducting a pilot study on advanced crosswalk signal timing giving pedestrians extra time to get out into the crosswalk while the lights are all red.
Utah has used 402 funds for local health departments to provide outreach by helping their communities with Green Ribbon Month and Walk to School days. As part of these projects, departments are also required to conduct pedestrian observational surveys to better understand behaviors in the communities they serve. The state also funded enforcement for school bus safety with officers riding on buses calling out vehicles who violate the red stop arm.
Vermont
Vermont efforts to reduce pedestrian crashes emphasize speed enforcement, lighting and markings of crosswalks, and safety education.
Virginia
In Virginia, the localities that receive highway safety funding to raise awareness of and enforce pedestrian safety laws include Arlington County, Fairfax County, Prince William County, Richmond City, Roanoke City, Salem City and Harrisonburg City. Additionally, Virginia’s “Street Smart Regional Pedestrian and Bicycle Safety Program” focuses on promoting pedestrian and bicyclist safety and includes similar strategic enforcement engagements around the metropolitan Washington region. This public awareness and enforcement campaign aims at reducing the number of pedestrian and cyclist injuries and deaths in the Washington metropolitan area (including Northern Virginia). The campaign uses creative radio and television advertising in English and Spanish to reach drivers, pedestrians and cyclists, while targeting them through outdoor and transit advertising on bus shelters and bus sides. In addition, law enforcement and local, county and state agencies distribute handouts and tip cards to further spread awareness and educate drivers and pedestrians. Virginia also has several selective enforcement programs to address pedestrian safety. Section 402 funds support Working Towards Zero Pedestrian Deaths, including Street Smart Metro Washington, Share Virginia Roadways and selective enforcement.

Spotlight on Highway Safety | Governors Highway Safety Association | ghsa.org | @GHSAHQ
Pedestrian Traffic Fatalities by State2018 PRELIMINARY DATA
42
Washington State
Many cities are implementing design features on roadways to enhance pedestrian safety, such as curb bulb-outs, protected left turn lanes, pedestrian crossing intervals for crosswalks and various traffic calming measures to slow drivers down.
The Washington Traffic Safety Commission supports several pilot projects on high visibility enforcement that couple public education and outreach with enforcement targeted to locations with histories of pedestrian fatalities and serious injuries.
The Washington State Legislature created a Pedestrian Safety Advisory Council (PSAC) to study the common causes of pedestrian crashes, which often center on the speed the driver was going and whether the driver or pedestrian were paying attention. The 2018 PSAC report was just submitted and it supports increased used of automated speed enforcement, increased data collection and analysis and strengthening and clarifying the state’s vulnerable user law.
Section 402 funds are used to support several pilot projects working on high visibility enforcement, coupling public education and outreach with enforcement targeted to locations with histories of pedestrian fatalities and serious injuries.
Wisconsin
The Bureau of Transportation Safety (BOTS) hosted two Designing for Pedestrian Safety classes in Wisconsin, instructed by FHWA staff. This course provided resources and knowledge about behavioral and infrastructural design to engineers and planners to help increase pedestrian safety. Each course was held over two days, with 20 participants in each course. BOTS also held three Pedestrian and Bicyclist Safety Law Enforcement Trainings. The training is specifically designed to support law enforcement when addressing and enforcing pedestrian and bicycle safety.
In the summer of 2018, BOTS provided the Wisconsin Bike Federation a grant to increase pedestrian safety in Milwaukee, which has the highest rate of pedestrian crashes and fatalities in the state. The goal was to create strategic marketing and advertising that would advance safety messages to the forefront of motorists’ and pedestrians’ knowledge.
BOTS provided four Pedestrian/Bicycle High Visibility Enforcement Grants. This grant program reimbursed officers for overtime while conducting high visibility enforcement to reduce bicyclist and pedestrian crashes and fatalities. Each agency agreed to participate at a minimum of one HVE per week for three months. This minimum was identified from evidence-based, peer-reviewed research. In addition, all agencies were required to participate in the Pedestrian and Bicyclist Safety Law Enforcement Trainings that the Bureau conducted.