pedestrian traffic fatalities by state · spotlight on highway safety | governors highway safety...
TRANSCRIPT
Spotlight on Highway Safety
®
Governors Highway Safety Association
www.ghsa.org
@GHSAHQ
2017 PRELIMINARY DATA
Prepared forGovernors Highway Safety Association
by Richard RettingSam Schwartz Consulting
PedestrianTraffic Fatalitiesby State
Spotlight on Highway Safety | Governors Highway Safety Association | 444 North Capitol Street | Suite 722 | Washington, DC 20001
Pedestrian Traffic Fatalities by State2017 PRELIMINARY DATA
2
CONTENTS
3 SUMMARY
5 INTRODUCTION
13 EARLY ESTIMATES OF 2017 PEDESTRIAN FATALITY DATA
19 WHAT ABOUT CITIES?
20 EFFORTS TO REDUCE PEDESTRIAN FATALITIES AND INJURIES
22 FEDERAL SAFETY PROGRAMS AND RESOURCES
23 WHAT STATES ARE DOING
34 DISCUSSION
38 ACKNOWLEDGEMENTS
Spotlight on Highway Safety | Governors Highway Safety Association | 444 North Capitol Street | Suite 722 | Washington, DC 20001
Pedestrian Traffic Fatalities by State2017 PRELIMINARY DATA
3
SUMMARY
In recent years, the number of pedestrian fatalities in the United States has grown substantially faster than all other traffic deaths. The number of pedestrian fatalities increased 27 percent from 2007 to 2016, while at the same time, all other traffic deaths decreased by 14 percent. Pedestrian deaths as a proportion of total motor vehicle crash deaths increased steadily, from 11 percent in 2007 to 16 percent in 2016. Pedestrians now account for a larger proportion of traffic fatalities than they have in the past 33 years.
The number of states with pedestrian fatality rates at or above 2.0 per 100,000 population has more than doubled, from seven in 2014 to 15 in 2016. From 2015 to 2016, pedestrian fatalities in the nation’s ten largest cities increased 28 percent (153 additional fatalities).
Earlier studies by the Governors Highway Safety Association (GHSA), based on preliminary data reported by State Highway Safety Offices (SHSOs), were the first to predict recent increases in pedestrian fatalities. The present study, based on preliminary data from all states and the District of Columbia (DC), found that the alarming rise in pedestrian deaths observed in both 2015 and 2016 appears to be tapering off. For the first six months of 2017, GHSA found a four percent decrease in the reported number of pedestrian fatalities compared with the first six months of 2016. However, after adjusting for anticipated underreporting in the preliminary state data and considering the historic data for pedestrian fatality distribution during the first and second halves of the year, GHSA estimates the number of pedestrians killed in motor vehicle crashes nationwide in 2017 was 5,984, a decrease of one half of one percent — essentially unchanged from 2016. This means that nearly 6,000 pedestri-ans died in motor vehicle crashes in 2016 and 2017. It has been more than 25 years since the U.S. experienced this level of pedestrian fatalities. Because both 2015 and 2016 saw large increases in pedestrian fatalities, the continuation of pedestrian fatalities at virtually the same pace in 2017 raises continued concerns about the nation’s alarming pedestrian death toll.
GHSA’s latest analysis of state-provided preliminary pedestrian fatality data also indicates the following:
●● States reported a range of changes in the number of pedestrian fatalities in the first half of 2017 compared with the same period in 2016 (see Table 10):
i 23 states (and DC) had increases in pedestrian fatalities;
i 20 states had decreases; and
i 7 states remained the same.
●● States differ widely in fatality numbers (see pages 23-33):
i The number of pedestrian deaths for the first half of 2017 ranged from one in both Hawaii and Wyoming to 352 in California;
i Five states (California, Florida, Texas, New York, and Arizona – in rank order) each
GHSA estimates the number of pedestrians killed in motor vehicle crashes nationwide in 2017 was 5,984, a decrease of one half of one percent — essentially unchanged from 2016.
Spotlight on Highway Safety | Governors Highway Safety Association | 444 North Capitol Street | Suite 722 | Washington, DC 20001
Pedestrian Traffic Fatalities by State2017 PRELIMINARY DATA
4
reported more than 100 pedestrian deaths, while 12 states (Alaska, Hawaii, Idaho, Maine, Montana, Nebraska, New Hampshire, North Dakota, South Dakota, Rhode Island, Vermont, and Wyoming) and DC each had fewer than ten;
i Five states (California, Florida, Texas, New York, and Arizona) accounted for 43 percent of all pedestrian deaths; and
i Arizona had the highest rate of pedestrian deaths per resident population, while Hawaii had the lowest.
●● States use various combinations of engineering, enforcement and education countermeasures to address pedestrian safety, including targeted enforcement in conjunction with public outreach and education.
Many factors outside the control of traffic safety officials contribute to annual changes in the number of pedestrian fatalities, including economic conditions, demographics, weather, fuel prices, vehicle miles traveled, and the amount of time people spend walking. On the other hand, concerted traffic safety efforts led by SHSOs and state/local partners can reduce pedestrian fatalities, and appear to have contributed to a reversal of the recent trend of large increases in the numbers of nationwide pedestrian fatalities.
Without making a direct correlation or claiming a definitive link, more recent factors contributing to the increase in pedestrian fatalities might include the growing number of state and local governments that have decriminalized the recreational use of marijuana, which can impair judgment and reaction time for all road users, and the increasing use of smartphones, which can be a significant source of distrac-tion regardless of travel mode.
●● The seven states (Alaska, Colorado, Maine, Massachusetts, Nevada, Oregon, Washington) and DC that legalized recreational use of marijuana between 2012 and 2016 reported a collective 16.4 percent increase in pedestrian fatalities for the first six months of 2017 versus the first six months of 2016, whereas all other states reported a collective 5.8 percent decrease in pedestrian fatalities. Tables 10 and 12.
●● With regard to cellphone use, the reported number of smartphones in active use in the U.S. increased by 236 percent from 2010 to 2016, and the annual number of multimedia messages over this period more than tripled. Analysis of data from the National Electronic Injury Surveillance database shows the number of cell-phone related Emergency Department visits is increasing in parallel with the prevalence of cell phone use in the United States.1 Figures 11 and 12.
1 Saltos, A.; Smith, D.; Schreiber, K.; Lichtenstein, S.; and Lichtenstein, R. 2015. Cell-Phone Related Injuries in the United States from 2000‒2012 Journal of Safety Studies ISSN 2377-3219 2015, Vol. 1, No. 1.
Spotlight on Highway Safety | Governors Highway Safety Association | 444 North Capitol Street | Suite 722 | Washington, DC 20001
Pedestrian Traffic Fatalities by State2017 PRELIMINARY DATA
5
INTRODUCTION
Walking is the oldest, most basic, and arguably the most beneficial form of human transportation. Walking provides many important personal and societal benefits, including reduced air pollutant emis-sions when people choose to walk instead of driving cars, and health benefits from physical activity.
Walking is becoming an increasingly popular mode of transportation. According to the U.S. Census Bureau’s American Community Survey (ACS), in 2016 an estimated four million Americans reported walking to work in the past week. This number has risen about 4 percent since 2007, when an esti-mated 3.9 million people reported their primary method of commuting to work in the past week was walking. Unfortunately, pedestrians represent a growing percentage of total traffic fatalities and inju-ries. For example, pedestrian fatalities comprised 11 percent of all traffic deaths nationwide in 2007, but 16 percent in 2016, as detailed below.
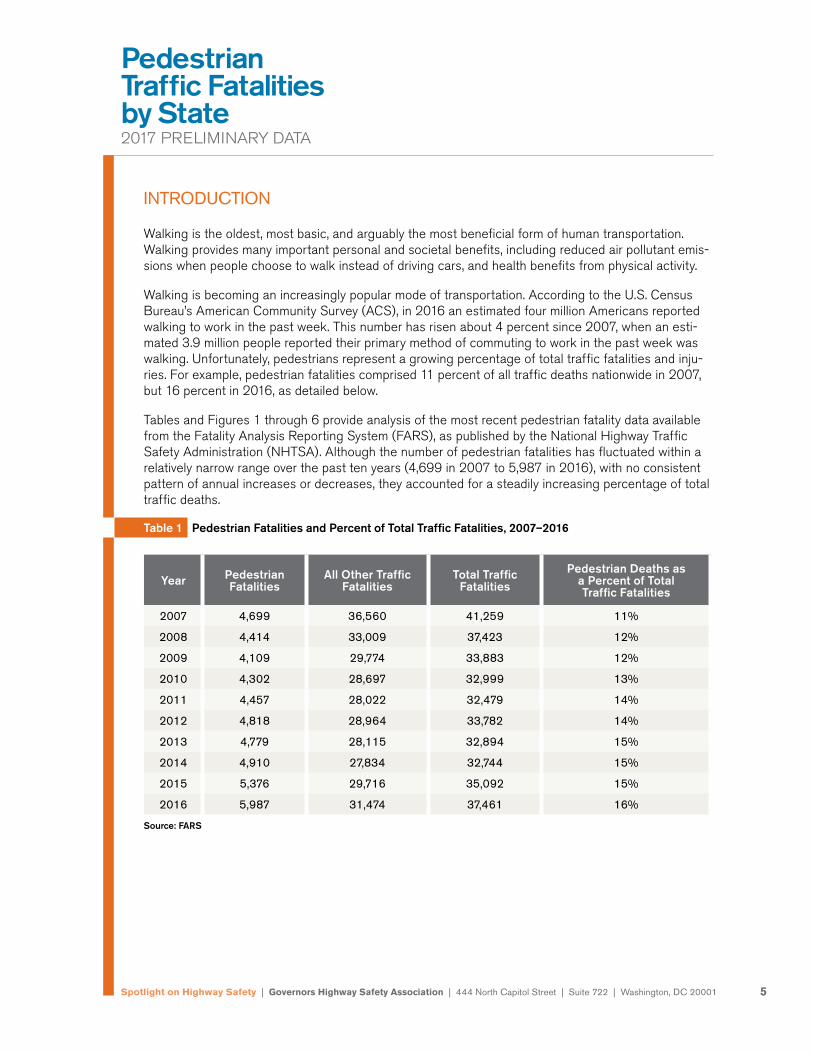
Tables and Figures 1 through 6 provide analysis of the most recent pedestrian fatality data available from the Fatality Analysis Reporting System (FARS), as published by the National Highway Traffic Safety Administration (NHTSA). Although the number of pedestrian fatalities has fluctuated within a relatively narrow range over the past ten years (4,699 in 2007 to 5,987 in 2016), with no consistent pattern of annual increases or decreases, they accounted for a steadily increasing percentage of total traffic deaths.
Table 1 Pedestrian Fatalities and Percent of Total Traffic Fatalities, 2007–2016
Source: FARS
Year Pedestrian Fatalities
All Other Traffic Fatalities
Total Traffic Fatalities
Pedestrian Deaths as a Percent of Total Traffic Fatalities
2007 4,699 36,560 41,259 11%
2008 4,414 33,009 37,423 12%
2009 4,109 29,774 33,883 12%
2010 4,302 28,697 32,999 13%
2011 4,457 28,022 32,479 14%
2012 4,818 28,964 33,782 14%
2013 4,779 28,115 32,894 15%
2014 4,910 27,834 32,744 15%
2015 5,376 29,716 35,092 15%
2016 5,987 31,474 37,461 16%
Spotlight on Highway Safety | Governors Highway Safety Association | 444 North Capitol Street | Suite 722 | Washington, DC 20001
Pedestrian Traffic Fatalities by State2017 PRELIMINARY DATA
6
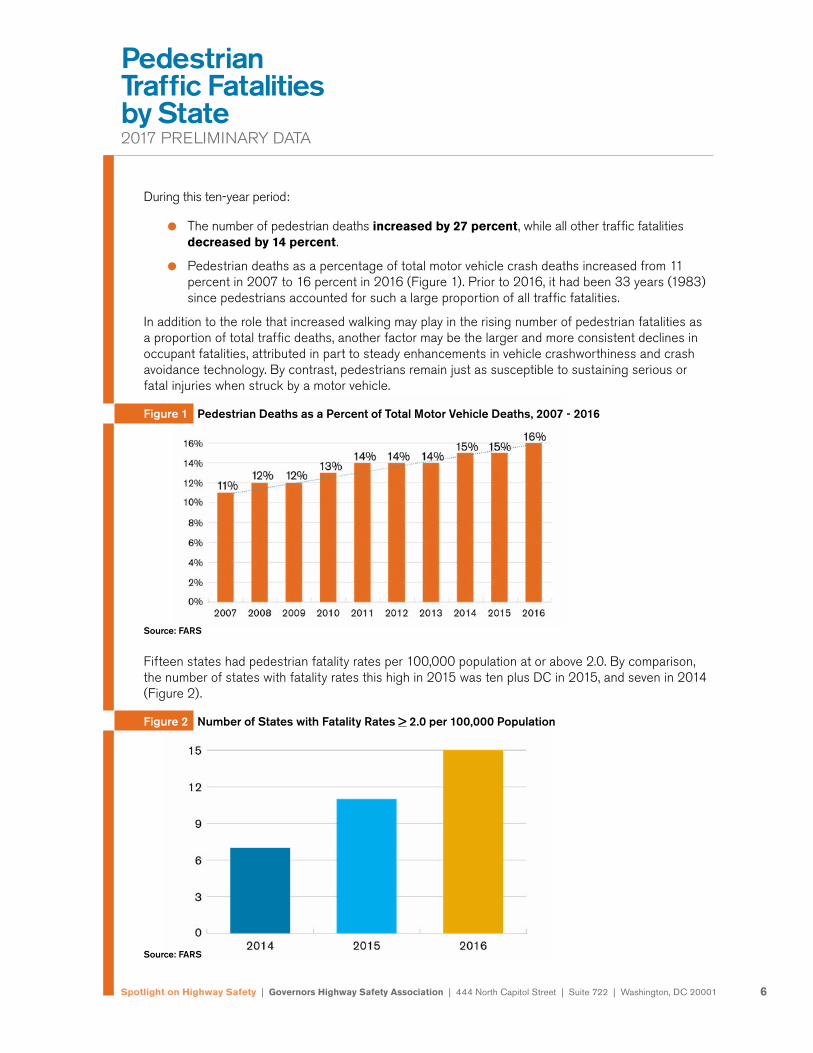
During this ten-year period:
●● The number of pedestrian deaths increased by 27 percent, while all other traffic fatalities decreased by 14 percent.
●● Pedestrian deaths as a percentage of total motor vehicle crash deaths increased from 11 percent in 2007 to 16 percent in 2016 (Figure 1). Prior to 2016, it had been 33 years (1983) since pedestrians accounted for such a large proportion of all traffic fatalities.
In addition to the role that increased walking may play in the rising number of pedestrian fatalities as a proportion of total traffic deaths, another factor may be the larger and more consistent declines in occupant fatalities, attributed in part to steady enhancements in vehicle crashworthiness and crash avoidance technology. By contrast, pedestrians remain just as susceptible to sustaining serious or fatal injuries when struck by a motor vehicle.
Figure 1 Pedestrian Deaths as a Percent of Total Motor Vehicle Deaths, 2007 - 2016
Source: FARS
Fifteen states had pedestrian fatality rates per 100,000 population at or above 2.0. By comparison, the number of states with fatality rates this high in 2015 was ten plus DC in 2015, and seven in 2014 (Figure 2).
Figure 2 Number of States with Fatality Rates > 2.0 per 100,000 Population
Source: FARS
Spotlight on Highway Safety | Governors Highway Safety Association | 444 North Capitol Street | Suite 722 | Washington, DC 20001
Pedestrian Traffic Fatalities by State2017 PRELIMINARY DATA
7
Sorted by State
StatePedestrian Fatalities per 100K Population - 2016
Alabama 2.51
Alaska 1.62
Arizona 2.85
Arkansas 1.64
California 2.43
Colorado 1.52
Connecticut 1.73
Delaware 2.83
DC 1.32
Florida 3.22
Georgia 2.25
Hawaii 2.24
Idaho 0.71
Illinois 1.15
Indiana 1.28
Iowa 0.73
Kansas 1.41
Kentucky 1.69
Louisiana 2.73
Maine 1.28
Maryland 1.78
Massachusetts 1.17
Michigan 1.69
Minnesota 1.09
Mississippi 1.94
Missouri 1.63
Montana 1.06
Nebraska 0.68
Nevada 2.76
New Hampshire 1.42
New Jersey 1.85
New Mexico 3.45
New York 1.61
North Carolina 2.00
North Dakota 0.93
Ohio 1.20
Oklahoma 2.32
Oregon 1.81
Pennsylvania 1.35
Rhode Island 1.42
South Carolina 2.96
South Dakota 0.70
Tennessee 1.52
Texas 2.44
Utah 1.28
Vermont 2.41
Virginia 1.44
Washington 1.22
West Virginia 1.53
Wisconsin 0.85
Wyoming 0.85
U.S. Average 1.92
Sorted by Fatality Rate
StatePedestrian Fatalities per 100K Population - 2016
New Mexico 3.45
Florida 3.22
South Carolina 2.96
Arizona 2.85
Delaware 2.83
Nevada 2.76
Louisiana 2.73
Alabama 2.51
Texas 2.44
California 2.43
Vermont 2.41
Oklahoma 2.32
Georgia 2.25
Hawaii 2.24
North Carolina 2.00
Mississippi 1.94
New Jersey 1.85
Oregon 1.81
Maryland 1.78
Connecticut 1.73
Kentucky 1.69
Michigan 1.69
Arkansas 1.64
Missouri 1.63
Alaska 1.62
New York 1.61
West Virginia 1.53
Colorado 1.52
Tennessee 1.52
Virginia 1.44
New Hampshire 1.42
Rhode Island 1.42
Kansas 1.41
Pennsylvania 1.35
DC 1.32
Indiana 1.28
Maine 1.28
Utah 1.28
Washington 1.22
Ohio 1.20
Massachusetts 1.17
Illinois 1.15
Minnesota 1.09
Montana 1.06
North Dakota 0.93
Wisconsin 0.85
Wyoming 0.85
Iowa 0.73
Idaho 0.71
South Dakota 0.70
Nebraska 0.68
U.S. Average 1.92
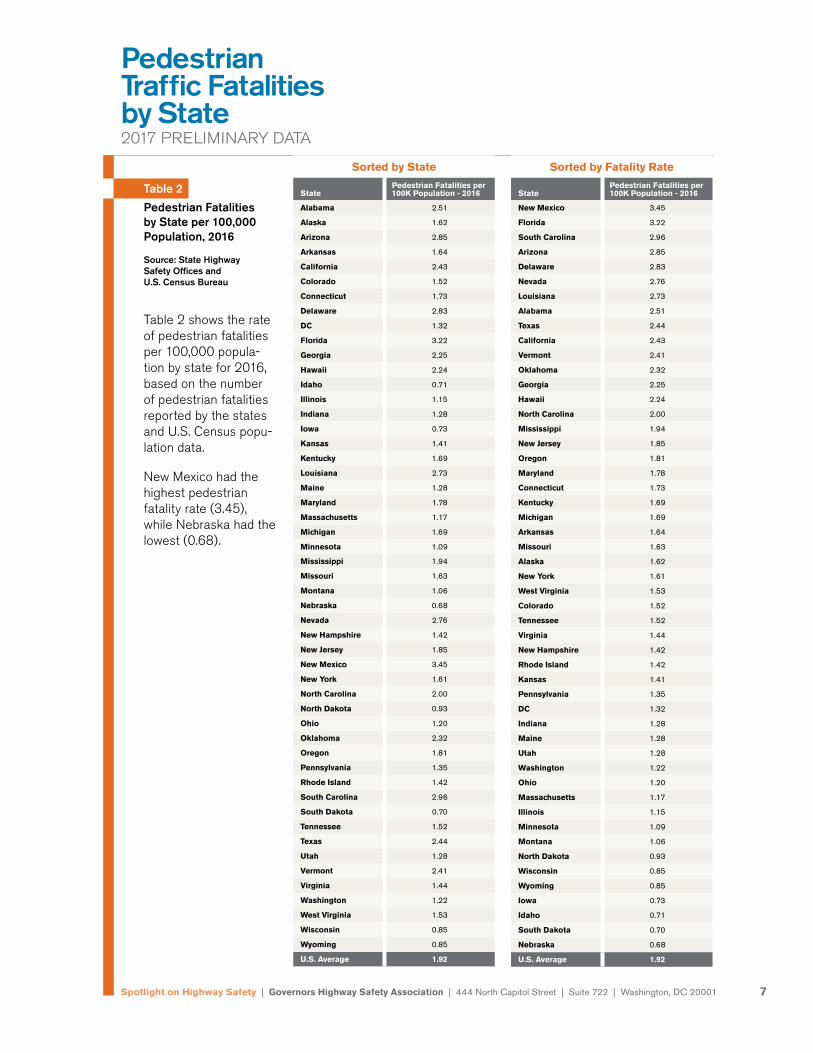
Table 2
Pedestrian Fatalities by State per 100,000 Population, 2016
Source: State Highway Safety Offices and U.S. Census Bureau
Table 2 shows the rate of pedestrian fatalities per 100,000 popula-tion by state for 2016, based on the number of pedestrian fatalities reported by the states and U.S. Census popu-lation data.
New Mexico had the highest pedestrian fatality rate (3.45), while Nebraska had the lowest (0.68).
Spotlight on Highway Safety | Governors Highway Safety Association | 444 North Capitol Street | Suite 722 | Washington, DC 20001
Pedestrian Traffic Fatalities by State2017 PRELIMINARY DATA
8
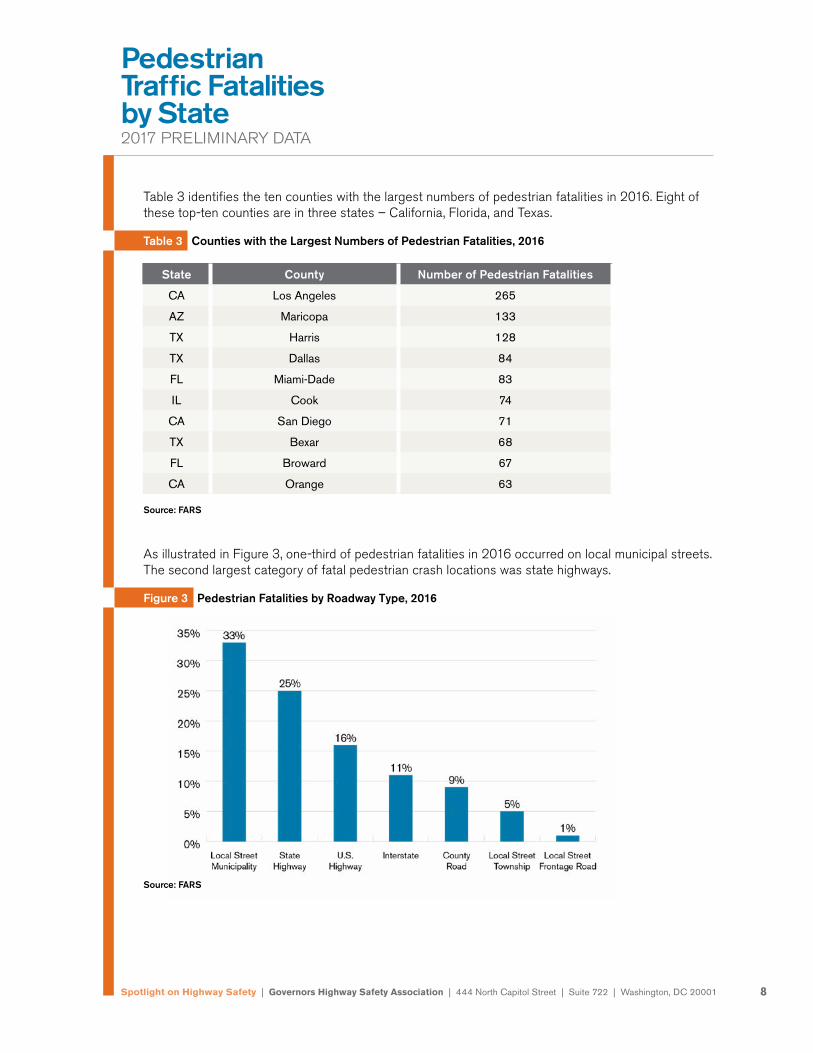
Table 3 identifies the ten counties with the largest numbers of pedestrian fatalities in 2016. Eight of these top-ten counties are in three states – California, Florida, and Texas.
Table 3 Counties with the Largest Numbers of Pedestrian Fatalities, 2016 Source: FARS
As illustrated in Figure 3, one-third of pedestrian fatalities in 2016 occurred on local municipal streets. The second largest category of fatal pedestrian crash locations was state highways.
Figure 3 Pedestrian Fatalities by Roadway Type, 2016
Source: FARS
State County Number of Pedestrian Fatalities
CA Los Angeles 265
AZ Maricopa 133
TX Harris 128
TX Dallas 84
FL Miami-Dade 83
IL Cook 74
CA San Diego 71
TX Bexar 68
FL Broward 67
CA Orange 63
Spotlight on Highway Safety | Governors Highway Safety Association | 444 North Capitol Street | Suite 722 | Washington, DC 20001
Pedestrian Traffic Fatalities by State2017 PRELIMINARY DATA
9
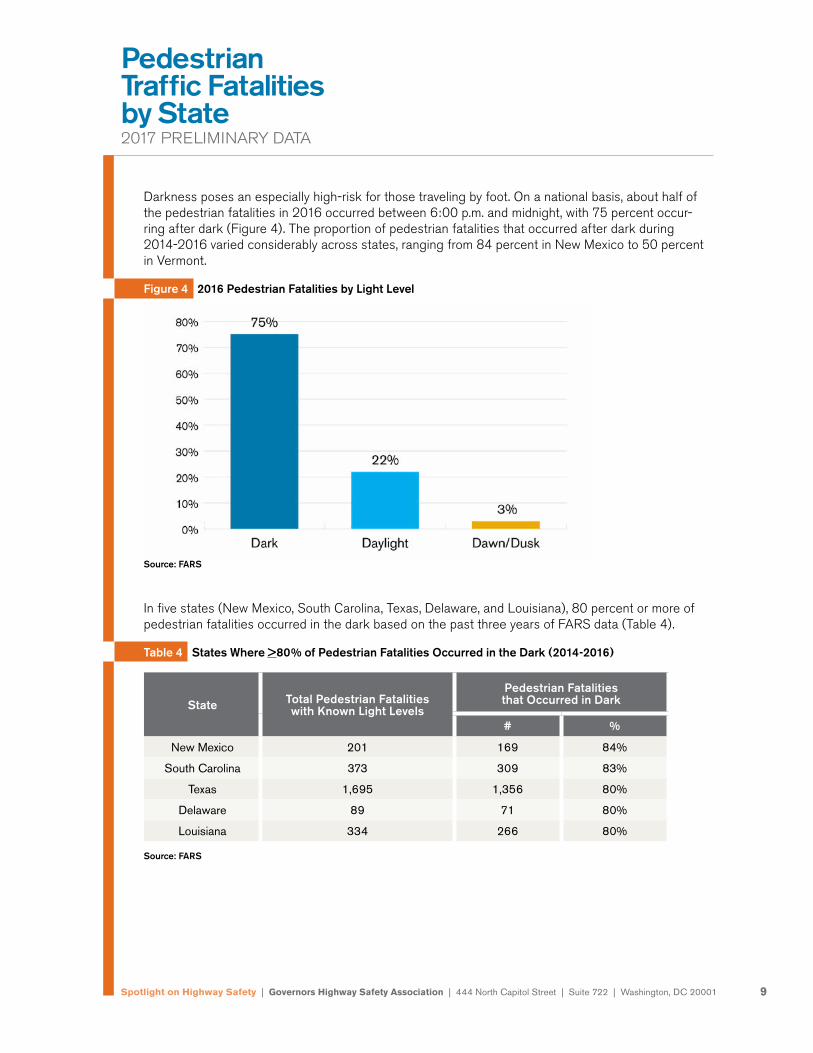
Darkness poses an especially high-risk for those traveling by foot. On a national basis, about half of the pedestrian fatalities in 2016 occurred between 6:00 p.m. and midnight, with 75 percent occur-ring after dark (Figure 4). The proportion of pedestrian fatalities that occurred after dark during 2014-2016 varied considerably across states, ranging from 84 percent in New Mexico to 50 percent in Vermont.
Figure 4 2016 Pedestrian Fatalities by Light Level
Source: FARS
In five states (New Mexico, South Carolina, Texas, Delaware, and Louisiana), 80 percent or more of pedestrian fatalities occurred in the dark based on the past three years of FARS data (Table 4).
Table 4 States Where >80% of Pedestrian Fatalities Occurred in the Dark (2014-2016)
Source: FARS
State Total Pedestrian Fatalities with Known Light Levels
Pedestrian Fatalities that Occurred in Dark
# %
New Mexico 201 169 84%
South Carolina 373 309 83%
Texas 1,695 1,356 80%
Delaware 89 71 80%
Louisiana 334 266 80%
Spotlight on Highway Safety | Governors Highway Safety Association | 444 North Capitol Street | Suite 722 | Washington, DC 20001
Pedestrian Traffic Fatalities by State2017 PRELIMINARY DATA
10
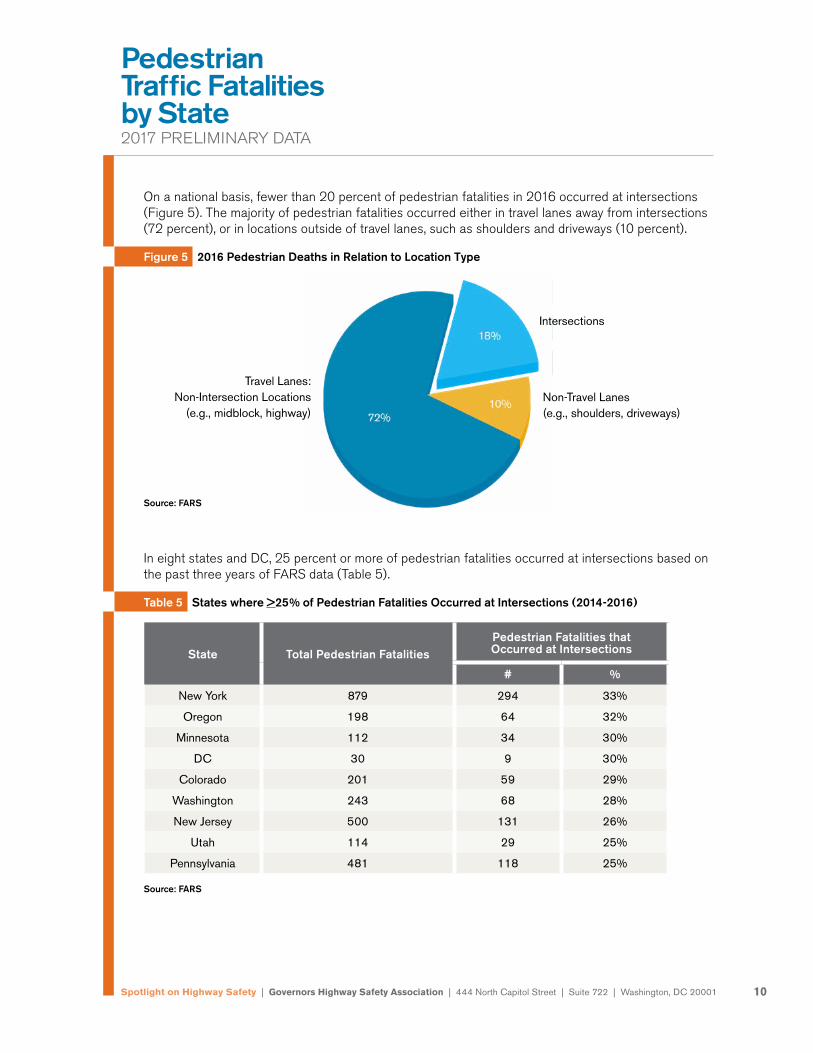
On a national basis, fewer than 20 percent of pedestrian fatalities in 2016 occurred at intersections (Figure 5). The majority of pedestrian fatalities occurred either in travel lanes away from intersections (72 percent), or in locations outside of travel lanes, such as shoulders and driveways (10 percent).
Figure 5 2016 Pedestrian Deaths in Relation to Location Type
Source: FARS
In eight states and DC, 25 percent or more of pedestrian fatalities occurred at intersections based on the past three years of FARS data (Table 5).
Table 5 States where >25% of Pedestrian Fatalities Occurred at Intersections (2014-2016)
Source: FARS
Intersections
Non-Travel Lanes(e.g., shoulders, driveways)
Travel Lanes: Non-Intersection Locations
(e.g., midblock, highway)
State Total Pedestrian FatalitiesPedestrian Fatalities that Occurred at Intersections
# %
New York 879 294 33%
Oregon 198 64 32%
Minnesota 112 34 30%
DC 30 9 30%
Colorado 201 59 29%
Washington 243 68 28%
New Jersey 500 131 26%
Utah 114 29 25%
Pennsylvania 481 118 25%
Spotlight on Highway Safety | Governors Highway Safety Association | 444 North Capitol Street | Suite 722 | Washington, DC 20001
Pedestrian Traffic Fatalities by State2017 PRELIMINARY DATA
11
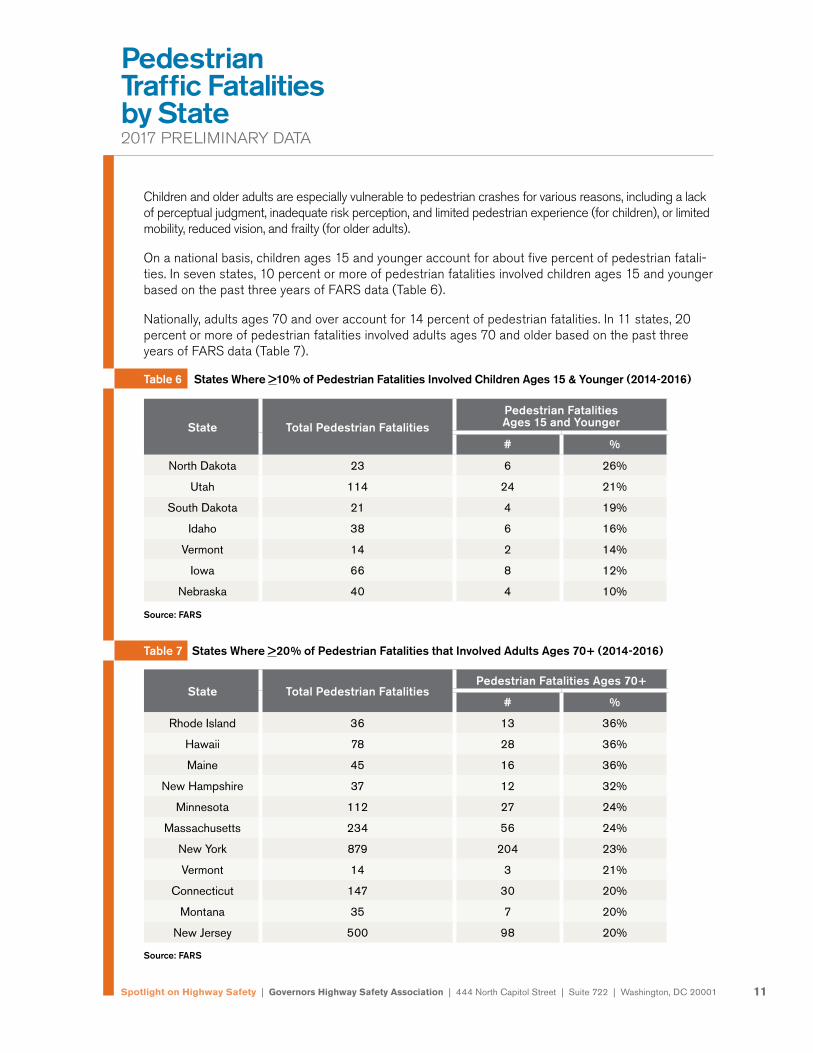
Children and older adults are especially vulnerable to pedestrian crashes for various reasons, including a lack of perceptual judgment, inadequate risk perception, and limited pedestrian experience (for children), or limited mobility, reduced vision, and frailty (for older adults).
On a national basis, children ages 15 and younger account for about five percent of pedestrian fatali-ties. In seven states, 10 percent or more of pedestrian fatalities involved children ages 15 and younger based on the past three years of FARS data (Table 6).
Nationally, adults ages 70 and over account for 14 percent of pedestrian fatalities. In 11 states, 20 percent or more of pedestrian fatalities involved adults ages 70 and older based on the past three years of FARS data (Table 7).
Table 6 States Where >10% of Pedestrian Fatalities Involved Children Ages 15 & Younger (2014-2016)
Source: FARS
Table 7 States Where >20% of Pedestrian Fatalities that Involved Adults Ages 70+ (2014-2016)
Source: FARS
State Total Pedestrian FatalitiesPedestrian Fatalities Ages 15 and Younger
# %
North Dakota 23 6 26%
Utah 114 24 21%
South Dakota 21 4 19%
Idaho 38 6 16%
Vermont 14 2 14%
Iowa 66 8 12%
Nebraska 40 4 10%
State Total Pedestrian FatalitiesPedestrian Fatalities Ages 70+
# %
Rhode Island 36 13 36%
Hawaii 78 28 36%
Maine 45 16 36%
New Hampshire 37 12 32%
Minnesota 112 27 24%
Massachusetts 234 56 24%
New York 879 204 23%
Vermont 14 3 21%
Connecticut 147 30 20%
Montana 35 7 20%
New Jersey 500 98 20%
Spotlight on Highway Safety | Governors Highway Safety Association | 444 North Capitol Street | Suite 722 | Washington, DC 20001
Pedestrian Traffic Fatalities by State2017 PRELIMINARY DATA
12
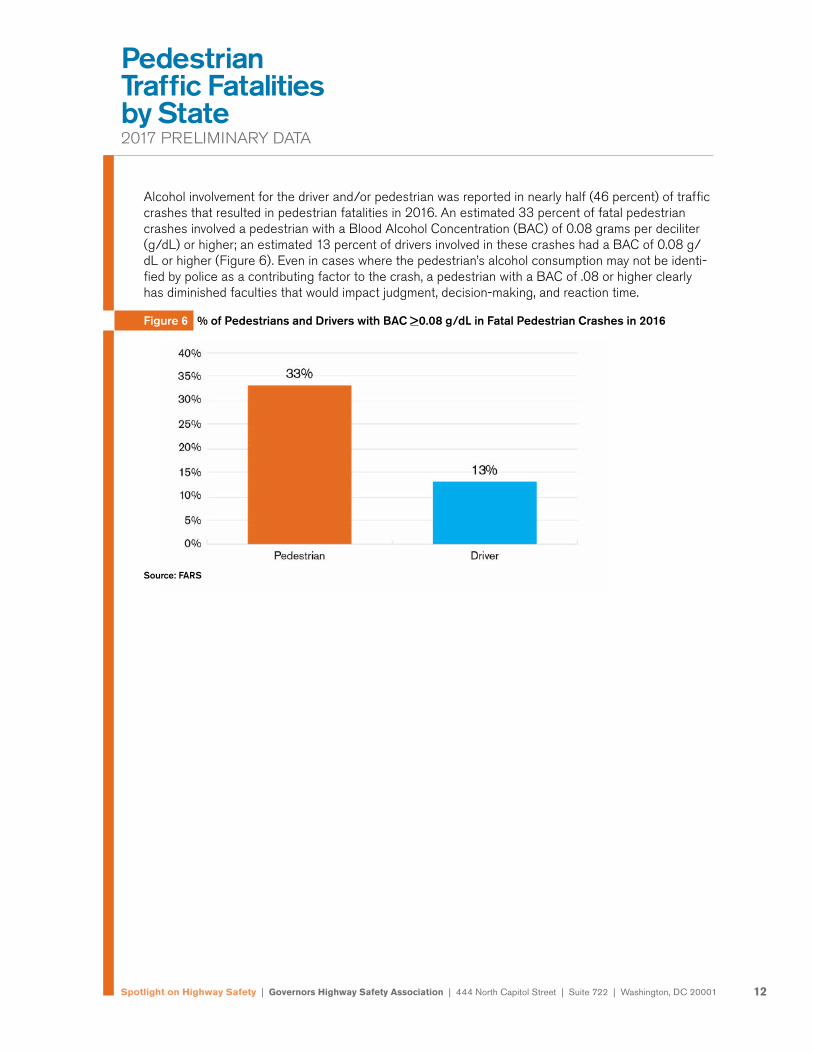
Alcohol involvement for the driver and/or pedestrian was reported in nearly half (46 percent) of traffic crashes that resulted in pedestrian fatalities in 2016. An estimated 33 percent of fatal pedestrian crashes involved a pedestrian with a Blood Alcohol Concentration (BAC) of 0.08 grams per deciliter (g/dL) or higher; an estimated 13 percent of drivers involved in these crashes had a BAC of 0.08 g/dL or higher (Figure 6). Even in cases where the pedestrian’s alcohol consumption may not be identi-fied by police as a contributing factor to the crash, a pedestrian with a BAC of .08 or higher clearly has diminished faculties that would impact judgment, decision-making, and reaction time.
Figure 6 % of Pedestrians and Drivers with BAC >0.08 g/dL in Fatal Pedestrian Crashes in 2016
Source: FARS
Spotlight on Highway Safety | Governors Highway Safety Association | 444 North Capitol Street | Suite 722 | Washington, DC 20001
Pedestrian Traffic Fatalities by State2017 PRELIMINARY DATA
13
EARLY ESTIMATES OF 2017 PEDESTRIAN FATALITY DATA
The recent increase in pedestrian fatalities prompted GHSA to undertake the present study for the first half of 2017. Using the same methods as in five prior pedestrian fatality studies, SHSOs were asked to provide preliminary counts of pedestrian deaths that had occurred in the first half of 2017. This is intended to provide an early look at 2017 trends many months before FARS data are available. (Annual FARS data are typically released near the end of the following year.)
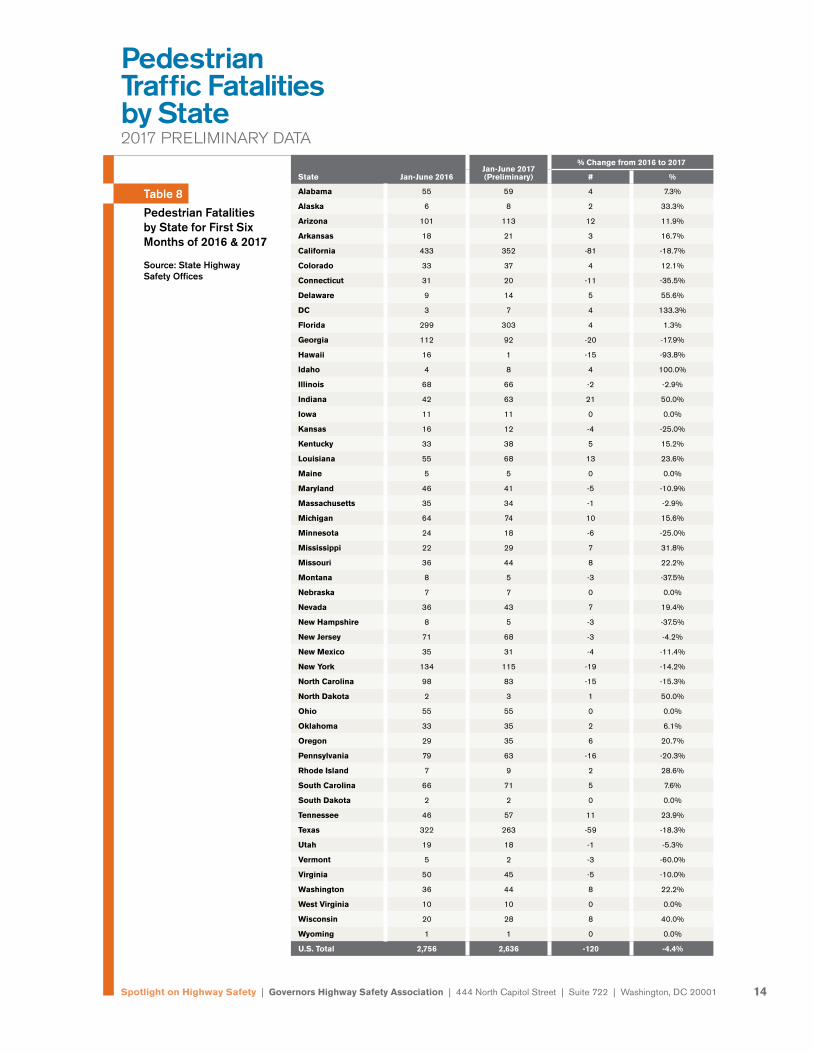
The reported state data used for this analysis are preliminary and in some cases incomplete. All 50 states and DC provided information. Comparing these results with the first six months of 2016, as reported by SHSOs, pedestrian deaths decreased by 4.4 percent, as summarized in Table 8.
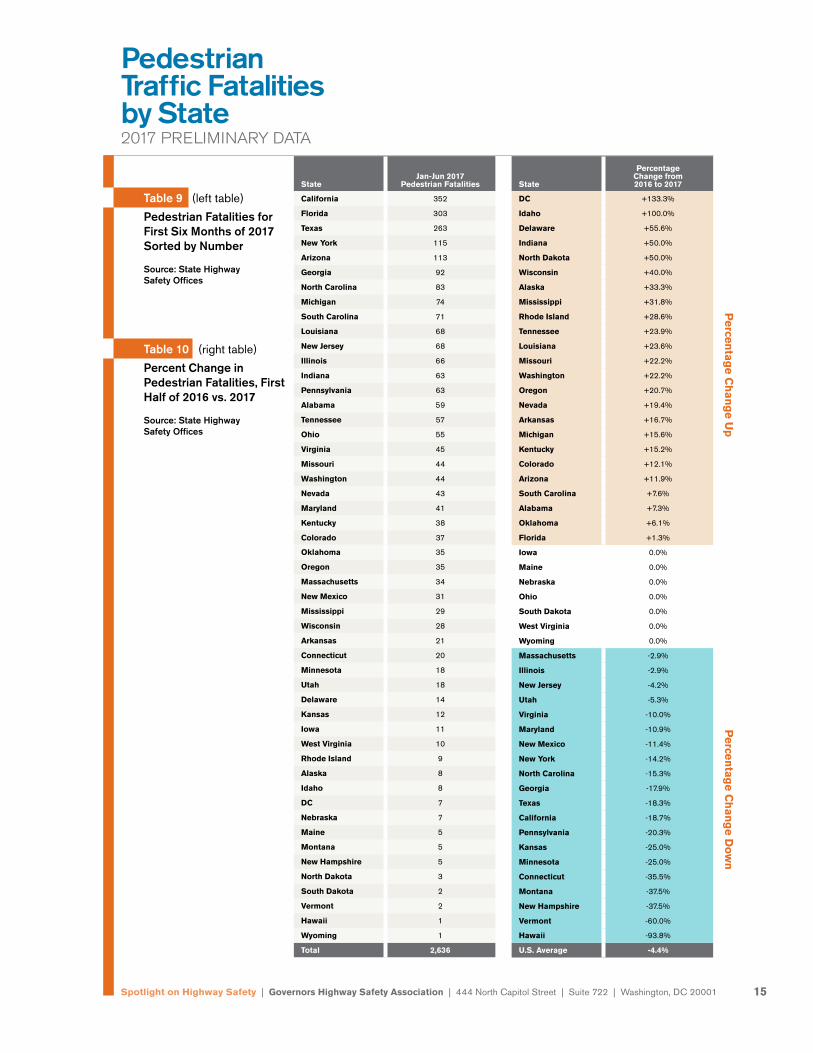
Tables 9 and 10 show the same number of pedestrian fatalities for the first six months of 2017, sorted by number of fatalities (Table 9) and the percent change from 2016 to 2017 (Table 10). Even with preliminary data, more states reported increases during the first six months of 2017 (24) than decreases (20), compared the same time period in 2016.
The actual change in the number of U.S. pedestrian deaths in 2017 is expected to differ from the 4.4 percent decrease reported in Table 8, because some deaths are likely not yet recorded in state traffic records systems. Compared to the preliminary fatality data provided by states for prior GHSA pedes-trian and motorcycle reports, final FARS data were about 4 percent higher.
It is, therefore, reasonable to assume an undercount of 4 percent in the preliminary data provided by the states. Increasing the preliminary 2017 count by 4 percent would mean there were approximately 2,741 pedestrian deaths in the first half of 2017 (2,636 x 1.04), compared with 2,756 reported for the first half of 2016. This, coupled with the fact that a greater number of pedestrian fatalities tends to occur during the latter half of the year, leads GHSA to project that there have been 5,984 pedes-trian fatalities in 2017, essentially unchanged from 2016.
Recent national projections also anticipate a leveling off of overall traffic fatalities. NHTSA has esti-mated a marginal increase of about 0.1 percent in overall traffic fatalities for the first nine months of 2017 compared with 2016.2 The National Safety Council recently projected a 1% decrease for 2017 compared with 2016.3
2 https://crashstats.nhtsa.dot.gov/Api/Public/ViewPublication/812490
3 http://www.nsc.org/NewsDocuments/2018/December_2017.pdf
Spotlight on Highway Safety | Governors Highway Safety Association | 444 North Capitol Street | Suite 722 | Washington, DC 20001
Pedestrian Traffic Fatalities by State2017 PRELIMINARY DATA
14
State Jan-June 2016Jan-June 2017(Preliminary)
% Change from 2016 to 2017
# %
Alabama 55 59 4 7.3%
Alaska 6 8 2 33.3%
Arizona 101 113 12 11.9%
Arkansas 18 21 3 16.7%
California 433 352 -81 -18.7%
Colorado 33 37 4 12.1%
Connecticut 31 20 -11 -35.5%
Delaware 9 14 5 55.6%
DC 3 7 4 133.3%
Florida 299 303 4 1.3%
Georgia 112 92 -20 -17.9%
Hawaii 16 1 -15 -93.8%
Idaho 4 8 4 100.0%
Illinois 68 66 -2 -2.9%
Indiana 42 63 21 50.0%
Iowa 11 11 0 0.0%
Kansas 16 12 -4 -25.0%
Kentucky 33 38 5 15.2%
Louisiana 55 68 13 23.6%
Maine 5 5 0 0.0%
Maryland 46 41 -5 -10.9%
Massachusetts 35 34 -1 -2.9%
Michigan 64 74 10 15.6%
Minnesota 24 18 -6 -25.0%
Mississippi 22 29 7 31.8%
Missouri 36 44 8 22.2%
Montana 8 5 -3 -37.5%
Nebraska 7 7 0 0.0%
Nevada 36 43 7 19.4%
New Hampshire 8 5 -3 -37.5%
New Jersey 71 68 -3 -4.2%
New Mexico 35 31 -4 -11.4%
New York 134 115 -19 -14.2%
North Carolina 98 83 -15 -15.3%
North Dakota 2 3 1 50.0%
Ohio 55 55 0 0.0%
Oklahoma 33 35 2 6.1%
Oregon 29 35 6 20.7%
Pennsylvania 79 63 -16 -20.3%
Rhode Island 7 9 2 28.6%
South Carolina 66 71 5 7.6%
South Dakota 2 2 0 0.0%
Tennessee 46 57 11 23.9%
Texas 322 263 -59 -18.3%
Utah 19 18 -1 -5.3%
Vermont 5 2 -3 -60.0%
Virginia 50 45 -5 -10.0%
Washington 36 44 8 22.2%
West Virginia 10 10 0 0.0%
Wisconsin 20 28 8 40.0%
Wyoming 1 1 0 0.0%
U.S. Total 2,756 2,636 -120 -4.4%
Table 8
Pedestrian Fatalities by State for First Six Months of 2016 & 2017 Source: State Highway Safety Offices
Spotlight on Highway Safety | Governors Highway Safety Association | 444 North Capitol Street | Suite 722 | Washington, DC 20001
Pedestrian Traffic Fatalities by State2017 PRELIMINARY DATA
15
StateJan-Jun 2017
Pedestrian Fatalities
California 352
Florida 303
Texas 263
New York 115
Arizona 113
Georgia 92
North Carolina 83
Michigan 74
South Carolina 71
Louisiana 68
New Jersey 68
Illinois 66
Indiana 63
Pennsylvania 63
Alabama 59
Tennessee 57
Ohio 55
Virginia 45
Missouri 44
Washington 44
Nevada 43
Maryland 41
Kentucky 38
Colorado 37
Oklahoma 35
Oregon 35
Massachusetts 34
New Mexico 31
Mississippi 29
Wisconsin 28
Arkansas 21
Connecticut 20
Minnesota 18
Utah 18
Delaware 14
Kansas 12
Iowa 11
West Virginia 10
Rhode Island 9
Alaska 8
Idaho 8
DC 7
Nebraska 7
Maine 5
Montana 5
New Hampshire 5
North Dakota 3
South Dakota 2
Vermont 2
Hawaii 1
Wyoming 1
Total 2,636
State
Percentage Change from 2016 to 2017
DC +133.3%
Idaho +100.0%
Delaware +55.6%
Indiana +50.0%
North Dakota +50.0%
Wisconsin +40.0%
Alaska +33.3%
Mississippi +31.8%
Rhode Island +28.6%
Tennessee +23.9%
Louisiana +23.6%
Missouri +22.2%
Washington +22.2%
Oregon +20.7%
Nevada +19.4%
Arkansas +16.7%
Michigan +15.6%
Kentucky +15.2%
Colorado +12.1%
Arizona +11.9%
South Carolina +7.6%
Alabama +7.3%
Oklahoma +6.1%
Florida +1.3%
Iowa 0.0%
Maine 0.0%
Nebraska 0.0%
Ohio 0.0%
South Dakota 0.0%
West Virginia 0.0%
Wyoming 0.0%
Massachusetts -2.9%
Illinois -2.9%
New Jersey -4.2%
Utah -5.3%
Virginia -10.0%
Maryland -10.9%
New Mexico -11.4%
New York -14.2%
North Carolina -15.3%
Georgia -17.9%
Texas -18.3%
California -18.7%
Pennsylvania -20.3%
Kansas -25.0%
Minnesota -25.0%
Connecticut -35.5%
Montana -37.5%
New Hampshire -37.5%
Vermont -60.0%
Hawaii -93.8%
U.S. Average -4.4%
Table 9 (left table) Pedestrian Fatalities for First Six Months of 2017 Sorted by Number Source: State Highway Safety Offices
Table 10 (right table)
Percent Change in Pedestrian Fatalities, First Half of 2016 vs. 2017 Source: State Highway Safety Offices
Percen
tage C
han
ge U
pP
ercentag
e Ch
ang
e Do
wn
Spotlight on Highway Safety | Governors Highway Safety Association | 444 North Capitol Street | Suite 722 | Washington, DC 20001
Pedestrian Traffic Fatalities by State2017 PRELIMINARY DATA
16
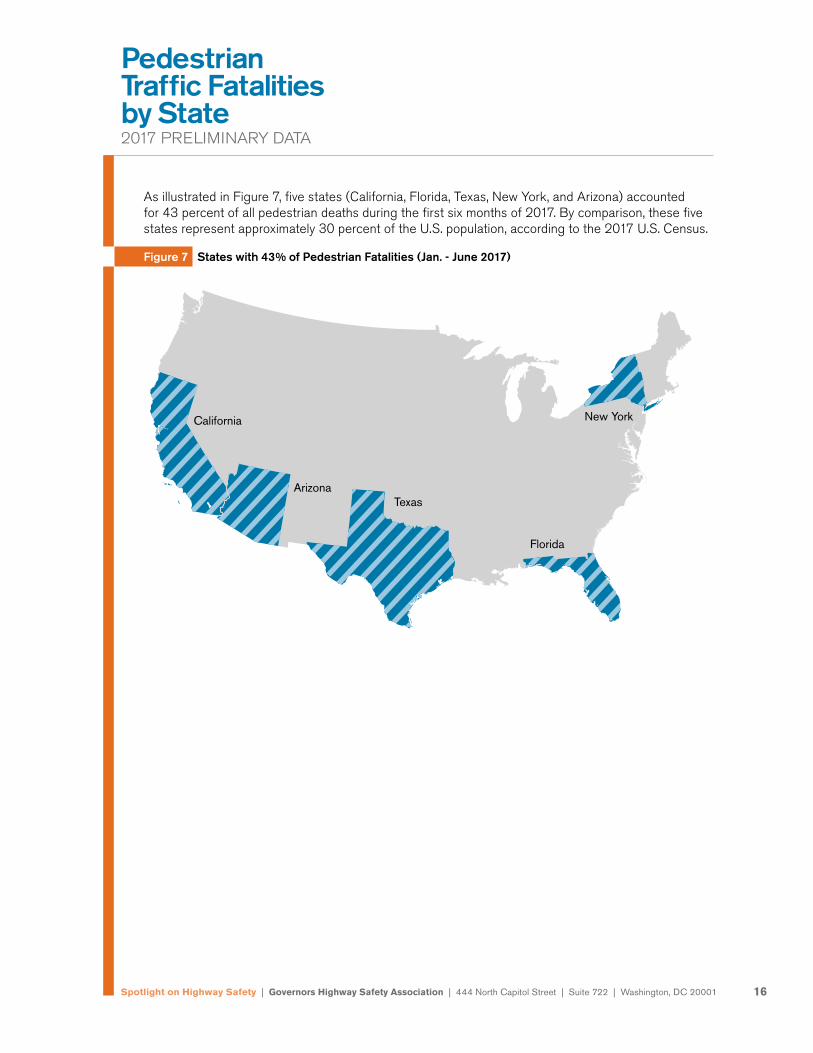
As illustrated in Figure 7, five states (California, Florida, Texas, New York, and Arizona) accounted for 43 percent of all pedestrian deaths during the first six months of 2017. By comparison, these five states represent approximately 30 percent of the U.S. population, according to the 2017 U.S. Census.
Figure 7 States with 43% of Pedestrian Fatalities (Jan. - June 2017)
California
Texas
Florida
New York
Arizona
Spotlight on Highway Safety | Governors Highway Safety Association | 444 North Capitol Street | Suite 722 | Washington, DC 20001
Pedestrian Traffic Fatalities by State2017 PRELIMINARY DATA
17
Sorted by State
StatePedestrian Fatalities per 100K Pop. - Jan-Jun 2017
Alabama 1.21
Alaska 1.08
Arizona 1.61
Arkansas 0.70
California 0.89
Colorado 0.66
Connecticut 0.56
Delaware 1.46
DC 1.01
Florida 1.44
Georgia 0.88
Hawaii 0.07
Idaho 0.47
Illinois 0.52
Indiana 0.94
Iowa 0.35
Kansas 0.41
Kentucky 0.85
Louisiana 1.45
Maine 0.37
Maryland 0.68
Massachusetts 0.50
Michigan 0.74
Minnesota 0.32
Mississippi 0.97
Missouri 0.72
Montana 0.48
Nebraska 0.36
Nevada 1.43
New Hampshire 0.37
New Jersey 0.76
New Mexico 1.48
New York 0.58
North Carolina 0.81
North Dakota 0.40
Ohio 0.47
Oklahoma 0.89
Oregon 0.84
Pennsylvania 0.49
Rhode Island 0.85
South Carolina 1.41
South Dakota 0.23
Tennessee 0.85
Texas 0.93
Utah 0.58
Vermont 0.32
Virginia 0.53
Washington 0.59
West Virginia 0.55
Wisconsin 0.48
Wyoming 0.17
U.S. Average 0.81
Sorted by Fatality Rate
StatePedestrian Fatalities per 100K Pop. - Jan-Jun 2017
Arizona 1.61
New Mexico 1.48
Delaware 1.46
Louisiana 1.45
Florida 1.44
Nevada 1.43
South Carolina 1.41
Alabama 1.21
Alaska 1.08
DC 1.01
Mississippi 0.97
Indiana 0.94
Texas 0.93
Oklahoma 0.89
California 0.89
Georgia 0.88
Kentucky 0.85
Rhode Island 0.85
Tennessee 0.85
Oregon 0.84
North Carolina 0.81
New Jersey 0.76
Michigan 0.74
Missouri 0.72
Arkansas 0.70
Maryland 0.68
Colorado 0.66
Washington 0.59
Utah 0.58
New York 0.58
Connecticut 0.56
West Virginia 0.55
Virginia 0.53
Illinois 0.52
Massachusetts 0.50
Pennsylvania 0.49
Wisconsin 0.48
Montana 0.48
Ohio 0.47
Idaho 0.47
Kansas 0.41
North Dakota 0.40
Maine 0.37
New Hampshire 0.37
Nebraska 0.36
Iowa 0.35
Minnesota 0.32
Vermont 0.32
South Dakota 0.23
Wyoming 0.17
Hawaii 0.07
U.S. Average 0.81
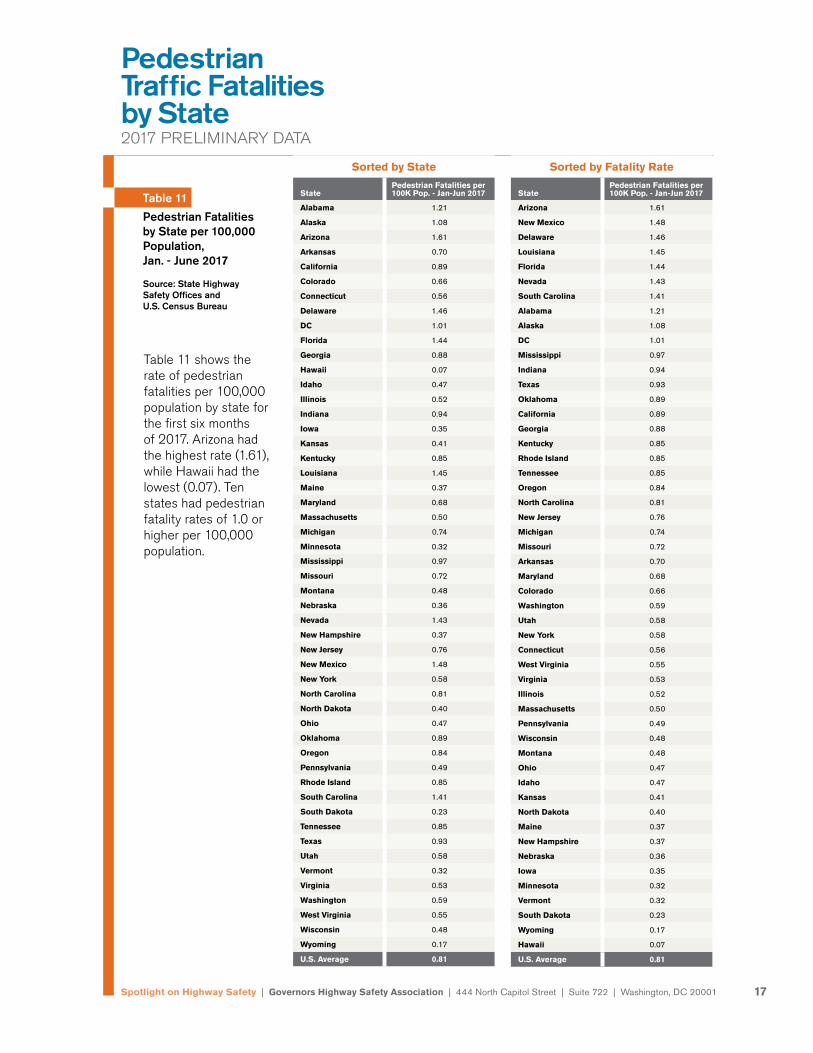
Table 11 Pedestrian Fatalities by State per 100,000 Population, Jan. - June 2017 Source: State Highway Safety Offices and U.S. Census Bureau
Table 11 shows the rate of pedestrian fatalities per 100,000 population by state for the first six months of 2017. Arizona had the highest rate (1.61), while Hawaii had the lowest (0.07). Ten states had pedestrian fatality rates of 1.0 or higher per 100,000 population.
Spotlight on Highway Safety | Governors Highway Safety Association | 444 North Capitol Street | Suite 722 | Washington, DC 20001
Pedestrian Traffic Fatalities by State2017 PRELIMINARY DATA
18
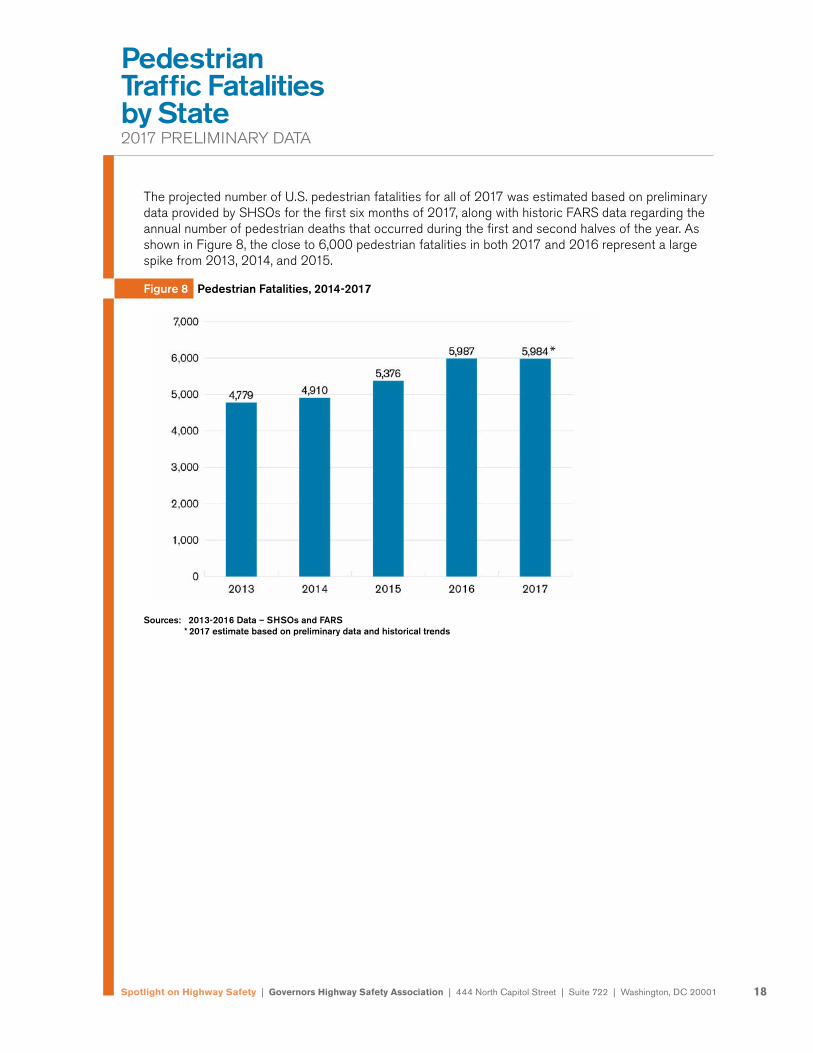
The projected number of U.S. pedestrian fatalities for all of 2017 was estimated based on preliminary data provided by SHSOs for the first six months of 2017, along with historic FARS data regarding the annual number of pedestrian deaths that occurred during the first and second halves of the year. As shown in Figure 8, the close to 6,000 pedestrian fatalities in both 2017 and 2016 represent a large spike from 2013, 2014, and 2015.
Figure 8 Pedestrian Fatalities, 2014-2017
Sources: 2013-2016 Data – SHSOs and FARS * 2017 estimate based on preliminary data and historical trends
Spotlight on Highway Safety | Governors Highway Safety Association | 444 North Capitol Street | Suite 722 | Washington, DC 20001
Pedestrian Traffic Fatalities by State2017 PRELIMINARY DATA
19
WHAT ABOUT CITIES?
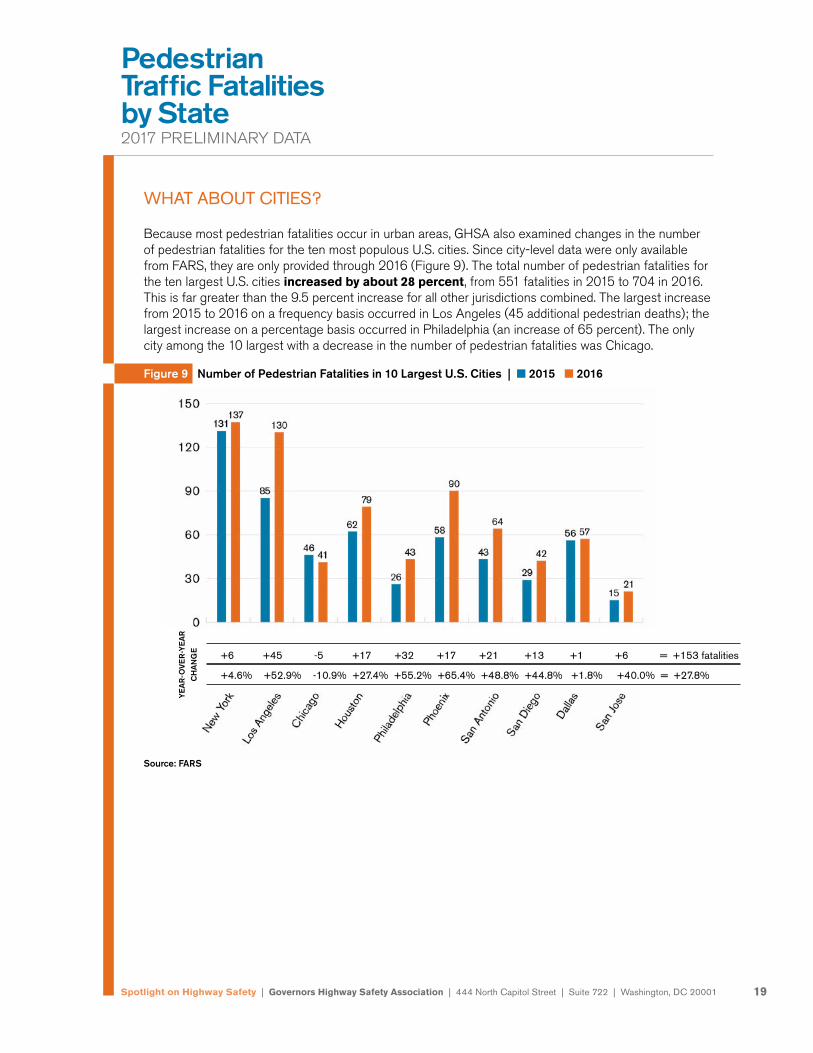
Because most pedestrian fatalities occur in urban areas, GHSA also examined changes in the number of pedestrian fatalities for the ten most populous U.S. cities. Since city-level data were only available from FARS, they are only provided through 2016 (Figure 9). The total number of pedestrian fatalities for the ten largest U.S. cities increased by about 28 percent, from 551 fatalities in 2015 to 704 in 2016. This is far greater than the 9.5 percent increase for all other jurisdictions combined. The largest increase from 2015 to 2016 on a frequency basis occurred in Los Angeles (45 additional pedestrian deaths); the largest increase on a percentage basis occurred in Philadelphia (an increase of 65 percent). The only city among the 10 largest with a decrease in the number of pedestrian fatalities was Chicago.
Figure 9 Number of Pedestrian Fatalities in 10 Largest U.S. Cities | n 2015 n 2016
Source: FARS
+4.6% +52.9% -10.9% +27.4% +55.2% +65.4% +48.8% +44.8% +1.8% +40.0% = +27.8%
+6 +45 -5 +17 +32 +17 +21 +13 +1 +6 = +153 fatalities
YE
AR
-OVE
R-Y
EA
RC
HA
NG
E
Spotlight on Highway Safety | Governors Highway Safety Association | 444 North Capitol Street | Suite 722 | Washington, DC 20001
Pedestrian Traffic Fatalities by State2017 PRELIMINARY DATA
20
EFFORTS TO REDUCE PEDESTRIAN FATALITIES AND INJURIES
Achieving robust and sustained progress toward reducing – and someday eliminating — pedestrian fatalities and injuries requires a comprehensive “3E” approach to pedestrian safety that includes targeted enforcement, engineering improvements, and public education. Enforcement, engineering, and education programs should incorporate the latest advances in technology and best practices, and must be tailored to the needs of state and local communities. Some noteworthy examples of the 3E approach to pedestrian safety are provided below.
Evidence-based strategies to Increase Separation of Pedestrians from Motor Vehicles include:
●● Refuge islands, which allow pedestrians to cross two-way streets one direction at a time.
●● Sidewalks
●● Pedestrian overpasses/underpasses
●● Countdown pedestrian signals that provide ample crossing time
●● Pedestrian hybrid beacons, where warranted. Also known as HAWK signals, this traffic device stops traffic to allow pedestrians to cross at midblock locations that do not warrant full traffic signal control.
●● New traffic signals, where warranted
Evidence-based strategies to Make Pedestrians More Visible to Drivers include:
●● Improved street lighting (note that nationwide 75% of pedestrian fatalities occur in the dark)
●● High-visibility crosswalks
●● Rapid-flashing beacons (RFBs) mounted to pedestrian crossing signs at mid-block crossings
Higher vehicle speeds are strongly associated with both a greater likelihood of pedestrian crashes and more serious and fatal pedestrian injuries. For this reason, efforts to reduce speeding on streets with pedestrian activity are a major focus of many municipal traffic safety programs, including Vision Zero programs, which emphasize intensified traffic enforcement and engineering measures.4 Evidence-based Engineering and Enforcement Measures to Reduce Speeds include:
●● Road diets that create space for other modes (e.g., bicycle lanes, sidewalks, turn lanes)
●● Roundabouts (also known as traffic circles) in place of stop signs and traffic signals
●● Traffic calming devices such as speed humps and curb extensions, where appropriate
●● Automated traffic enforcement as a supplement to traditional enforcement
4 Vision Zero Network. 2017. Moving From Vision To Action: Fundamental Principles, Policies & Practices to Advance Vision Zero in the U.S. Available at: http://visionzeronetwork.org/wp-content/uploads/2017/01/MinimumElements_Final.pdf
Spotlight on Highway Safety | Governors Highway Safety Association | 444 North Capitol Street | Suite 722 | Washington, DC 20001
Pedestrian Traffic Fatalities by State2017 PRELIMINARY DATA
21
Public Education has always been a component of efforts to reduce pedestrian/motor vehicle colli-sions. Pedestrians and motorists need to know about the risk factors associated with sharing the road, but studies have indicated that many have limited understanding of right-of-way rules they are legally obligated to follow at crosswalks and other locations.5, 6 Although standalone public education programs generally have not been effective in reducing pedestrian crashes, there is a role for public education in supporting speed management activities.
●● NHTSA developed a public information and education outreach toolkit that provides marketing materials to support development of a speed management strategy.7
●● Public information campaigns that raise awareness of police crackdowns on impaired driving, distracted driving, and other unsafe behaviors can increase the effectiveness of these enforcement activities and can promote adoption of practices (obeying the speed limit, using crosswalks, etc.) to avoid behaviors specifically linked to pedestrian/motor vehicle crashes.
●● “Share the Road” and similarly branded campaigns can be used to increase driver awareness of pedestrians and encourage drivers to yield to pedestrians.8
●● Coupling road improvements with educational strategies and messages can help pedestrians and motorists understand how to use the infrastructure to improve the safety of all roadway users (e.g., roundabouts, hybrid beacons).
5 Hatfield, J., Fernandes, R.F., Soames, J., & Smith, K. (2007). Misunderstanding of right-of-way rules at various pedestrian crossings: Observational study and survey, Accident Analysis & Prevention, 39, 833-842.
6 Mitman, M.F., & Ragland, D.R. (2007). Crosswalk confusion: More evidence why pedestrian and driver knowledge of the vehicle code should not be assumed. Transportation Research Record, 2002, 55-63. Washington, DC: National Research Council.
7 Speed Campaign Toolkit, https://www.trafficsafetymarketing.gov/campaign-search?topic=162
8 http://safeny.ny.gov/media/beSmart-peds.htm
Spotlight on Highway Safety | Governors Highway Safety Association | 444 North Capitol Street | Suite 722 | Washington, DC 20001
Pedestrian Traffic Fatalities by State2017 PRELIMINARY DATA
22
FEDERAL SAFETY PROGRAMS AND RESOURCES
Federal government resources available to help states reduce pedestrian fatalities and serious injuries include the following:
●● Section 402. The State and Community Highway Safety Grant Program is the cornerstone of state behavioral highway safety strategies. It provides the greatest flexibility for states to target resources to meet their most pressing needs.
●● Pedestrian and Bicycle Safety Focus States and Cities. Since 2004, FHWA’s Safety Office has been working aggressively to reduce pedestrian deaths by focusing extra resources on the cities and states with the highest pedestrian fatalities and/or fatality rates. Part of this effort has included How to Develop a Pedestrian Safety Action Plan, which helps state and local officials know where to begin to address pedestrian safety issues.
●● Section 403. Under this program, NHTSA has conducted a series of education and enforcement efforts in pedestrian focus cities including demonstration projects in Louisville (KY), New York City, and Philadelphia (PA). In addition, funds were awarded to the Safe States Alliance for a project on Injury Prevention for Pedestrians.
●● Section 405. Beginning in Federal Fiscal Year 2017 (Oct. 1, 2016 – Sept. 30, 2017), approximately $14 million is awarded to eligible states annually to decrease pedestrian and bicyclist crash fatalities. A state is eligible if its bicyclist and pedestrian fatalities exceed 15% of its total annual crash fatalities based on the most recent year of FARS data available. Funds may be used to train law enforcement officials on bicyclist/pedestrian traffic laws, for bicyclist/pedestrian safety enforcement of these laws, and for education campaigns promoting bicyclist/pedestrian traffic laws.
●● Highway Safety Improvement Program (HSIP). The goal of this program is to achieve a significant reduction in traffic fatalities and serious injuries on all public roads, including non-state-owned public roads and roads on tribal lands. The HSIP requires a data-driven, strategic approach to improving highway safety that focuses on the application of proven engineering countermeasures to significantly reduce fatal and serious-injury crashes. Although prior federal transportation legislation allowed HSIP funds to be spent on behavioral safety programs – and several states leveraged this opportunity – this option was eliminated in the latest reauthorization bill.
Spotlight on Highway Safety | Governors Highway Safety Association | 444 North Capitol Street | Suite 722 | Washington, DC 20001
Pedestrian Traffic Fatalities by State2017 PRELIMINARY DATA
23
WHAT STATES ARE DOING
SHSOs are committed to improving the safety of all road users by focusing on behavioral issues that lead to traffic crashes such as impaired, distracted, and aggressive driving; seat belt use; child passenger, pedestrian, bicyclists, and motorcyclist safety; and teen and older driver issues. SHSOs are typically tasked with addressing behavioral safety issues via education and enforcement initia-tives. SHSOs administer federal highway safety grants (including Sections 402 and 405 as outlined above) and produce annual state Highway Safety Plans (HSPs) as required by the U.S. Department of Transportation. In some states, SHSOs are responsible for traffic records coordination and Safe Routes to School programs. SHSOs work with their state DOT counterparts to align behavioral solu-tions with engineering efforts. SHSOs provided the following examples of strategies they and their partners employ to reduce pedestrian fatalities and serious injuries:
●● Targeted law enforcement efforts
●● Public information campaigns
●● Educational outreach in high-risk areas
●● Data analysis
●● Identifying high-risk zones
●● Pedestrian safety assessments/road safety audits
●● Adoption of Complete Streets policies, which direct transportation planners and engineers to routinely design and operate the entire right of way to enable safe access for all users, regardless of age, ability, or mode of transportation.
●● Engineering countermeasures, including some that target high-risk pedestrian crossing intersections and corridors
●● Inclusion of pedestrian safety action items in Strategic Highway Safety Plans (SHSPs)
Every state is addressing pedestrian safety using a combination of engineering, education and enforcement. Specific SHSO-reported activities are provided below. This list does not represent the full spectrum of activities happening across the country.
Alabama
Alabama DOT implements engineering and infrastructure programs and safety projects/measures across the state for pedestrian safety.
Alaska
Many of the state’s measures are engineering in nature. The Highway Safety Improvement Program (HSIP) has many projects dedicated to pedestrian refuges on major urban corridors which have had a high number of fatal and serious injury pedestrian crashes. The state is also adding improved lighting and HAWK crossings in identified areas.
Spotlight on Highway Safety | Governors Highway Safety Association | 444 North Capitol Street | Suite 722 | Washington, DC 20001
Pedestrian Traffic Fatalities by State2017 PRELIMINARY DATA
24Spotlight on Highway Safety | Governors Highway Safety Association | 444 North Capitol Street | Suite 722 | Washington, DC 20001 24
Arkansas
Engineering measures implemented in Arkansas to make pedestrian crossing locations safer include Rapid Flashing Beacons, Pedestrian Hybrid Beacons (PHBs), and refuge islands. Other engineering measures used within the state are pedestrian countdown timers and leading pedestrian intervals at signalized intersections.
California
The California Department of Transportation is installing more roundabouts, while the Office of Traffic Safety is funding Pedestrian Assessments in cities with high collision rates. These assessments make recommendations based on engineering, education and enforcement strategies. Over the past three years, funding for pedestrian education has increased over 40 percent. The University of San Diego developed a Senior Pedestrian curriculum that is being shared.
Colorado
Colorado supports four grants specific to pedestrian education, awareness and enforcement. In addition, the Office of Communications creates public relations materials and campaigns related to pedestrian education.
Connecticut
Connecticut DOT recently completed a statewide overhaul to replace old signage, including signs for pedestrian safety. These are new, bright signs that are up to code. The Highway Safety Office also launched an outreach and advertising campaign titled “Watch for Me CT ” which focuses primarily on pedestrian safety but also includes bicyclists. Law enforcement training for this issue is currently being developed.
Delaware
Delaware targets high crash locations for engineering and educational improvements, as well as making these locations a priority for law enforcement. The Office of Highway Safety partners with multiple police agencies to provide overtime enforcement along corridors where a majority of pedes-trian fatalities occur. Education has been prioritized as a tactic, and officers receive safety items and informational flyers to provide to pedestrians who are stopped. Engineering strategies include: improv-ing infrastructure to reduce pedestrian exposure and the potential for pedestrian/vehicle conflicts, and increased pedestrian visibility and awareness; pedestrian safety audits at high-crash locations; consideration of pedestrians when installing roadway improvements; and before/after studies to evaluate and identify the most effective pedestrian safety treatments.
Florida
Florida uses a combination of education, enforcement, engineering, and emergency response counter-measures that are data-driven and context sensitive to improve pedestrian safety. These elements are coordinated so they complement the others for the greatest opportunity for improvement. Examples include:
● Having officers educate as their initial enforcement contact prior to issuing warnings or citations
● Educating first responders on the most common types of injuries sustained in these types of crashes so they are prepared to provide the best possible response to crash victims
Spotlight on Highway Safety | Governors Highway Safety Association | 444 North Capitol Street | Suite 722 | Washington, DC 20001
Pedestrian Traffic Fatalities by State2017 PRELIMINARY DATA
25Spotlight on Highway Safety | Governors Highway Safety Association | 444 North Capitol Street | Suite 722 | Washington, DC 20001 25
● Developing educational materials to fit the context of the community such as multilingual messaging to reach the right audience with the right message
● Engaging “brand ambassadors” that the community knows and trusts to ensure the messages resonate with the audience
● Implementing Complete Streets recommendations, such as pedestrian lighting at areas over represented with pedestrian crashes, leading pedestrian interval signal phasing at high crash intersections, and other engineering countermeasures
Georgia
Georgia is developing a Pedestrian Safety Action Plan with target corridors for assessment and coun-termeasures, conducting Road Safety Audits, and conducting School Road Safety Audits.
Illinois
Illinois DOT provides funding for Chicago DOT to promote pedestrian safety. The Chicago Pedestrian Initiatives execute programs to assist in the implementation of the City’s Vision Zero program, with the goal of eliminating pedestrian fatalities in 10 years. The pedestrian program, “Safe Routes Ambassadors,” encourages Chicagoans to walk and bike more and to do so more safely.
In 2017, the Pedestrian Corridor Analysis program completed 56 events with the Chicago Police Department. Chicago police issued 248 citations to motorists for crosswalk violations. A total of 14,636 pedestrians, bicyclists and motorists were educated in these campaigns.
In 2017, the Safe Routes Ambassadors presented for 473 classrooms in 101 schools, prioritizing schools in the Vision Zero high-crash areas. Ambassadors taught 186 classrooms of second grade students covering pedestrian and crosswalk safety and 147 5th grade classes covering bicycle and traffic safety.
Illinois completed a study in 2017 entitled “Establishing Procedures and Guidelines for Pedestrian Treatments at Uncontrolled Locations.” Taken together, these engineering elements will allow all users, including individuals who are disabled, to use facilities safely. Two types of projects with renewed focus to further reduce non-motorized crashes are Road Diets and Roundabouts
Indiana
Indiana conducts pedestrian and cyclist enforcement and education projects as outlined in the state’s FY 2018 Highway Safety Plan. Indiana DOT engineering projects include high-visibility crosswalks, countdown crosswalks, audio crosswalks and refuge areas.
Iowa
Several of Iowa’s larger police departments are conducting public awareness campaigns on pedes-trian safety issues. Flashing pedestrian crossing signs continue to be installed in large pedestrian traffic areas.
Kansas
Kansas conducts small educational programs and distributes brochures.
Spotlight on Highway Safety | Governors Highway Safety Association | 444 North Capitol Street | Suite 722 | Washington, DC 20001
Pedestrian Traffic Fatalities by State2017 PRELIMINARY DATA
26Spotlight on Highway Safety | Governors Highway Safety Association | 444 North Capitol Street | Suite 722 | Washington, DC 20001 26
Maine
Maine identified the top 21 towns/cities with pedestrian issues and meets with town officials to develop ways of educating the public and improving infrastructure.
Maryland
Maryland leverages the four Es (engineering, education, enforcement and EMS) to improve pedes-trian safety. Education efforts include Street Smart campaigns (bestreetsmart.net) and Walk Smart in Ocean City (ocwalksmart.com). The Maryland Highway Safety Office (MHSO) collaborates with partners through the Pedestrian-Bicycle Emphasis Area Team (P-BEAT), which brings together stakeholders to integrate data-driven approaches, proven countermeasures and shared resources. Maryland DOT utilizes HSIP funding to employ targeted engineering countermeasures identified during pedestrian road safety audits. The MHSO collaborates with Maryland DOT and other part-ners to follow these engineering improvements with education and enforcement for both drivers and pedestrians, addressing observed behaviors that put pedestrians at risk.
The MHSO has used 402 funds to support pedestrian projects both at the state and local levels. Educational outreach includes public awareness and education through sporting venues, community events, school programs, health departments, and religious outreach. Funds also have been used to support law enforcement overtime for speed enforcement in and around high pedestrian corridors as well as enforcement of pedestrian safety laws. Most enforcement projects are restricted to areas where known engineering countermeasures have been deployed and are accompanied by educa-tional efforts. Additionally, projects are funded by the new ‘Non-motorized Vulnerable Users’ FAST Act funds (405h). MHSO also utilizes $1.1 million in state funding for pedestrian safety education and enforcement.
Massachusetts
Massachusetts conducted a media campaign to promote situational awareness for drivers, pedestri-ans and bicyclists; provided funding to local and state police agencies to conduct enforcement activity aimed at improving roadway safety for all users (drivers, passengers and non-motorists); and offered a statewide Pedestrian & Bicycle Enforcement Grant to 79 municipal law enforcement agencies to conduct enforcement patrols and purchase equipment related to pedestrian/bicyclist safety.
Massachusetts DOT invests funds into a statewide Complete Streets program, with 26 projects underway in 2017 and 22 more slated for 2018. Each project will overhaul an existing intersection to make it safer for drivers and non-motorists alike. MassDOT also has a “Healthy Transportation Policy” that requires all projects (except interstate/controlled access highways) to incorporate pedestrian/bicyclist improvements like sidewalks and crosswalks.
Michigan
Pedestrian safety measures being implemented in Michigan include law enforcement training, law enforcement mobilization, public education and crosswalk treatments.
Minnesota
Minnesota has a data-driven pedestrian education campaign that any community can use to educate drivers and pedestrians about pedestrian safety. The statewide campaign is currently being revamped to address incidental pedestrians: those who are killed after starting their trip via another mode.
Spotlight on Highway Safety | Governors Highway Safety Association | 444 North Capitol Street | Suite 722 | Washington, DC 20001
Pedestrian Traffic Fatalities by State2017 PRELIMINARY DATA
27Spotlight on Highway Safety | Governors Highway Safety Association | 444 North Capitol Street | Suite 722 | Washington, DC 20001 27
Enforcement measures in Minnesota include Saint Paul’s Stop for Me campaign that is a sustained education, engineering, and enforcement program within the City of Saint Paul to enforce the state’s crosswalk law and educate pedestrians and motorists about the law.
A suite of engineering countermeasures used to increase pedestrian safety includes raised cross-walks, curb extensions, signing, leading pedestrian intervals, rectangular rapid flashing beacons, pedestrian hybrid beacons, road diets, lighting, and other geometric and traffic-related changes. Minnesota DOT recently completed a systemic safety analysis, identifying higher-risk intersections and creating a methodology to identify high-risk locations before a crash happens.
Mississippi
Mississippi DOT addresses pedestrian safety through its Safe Routes to School Program.
Missouri
In 2017, Missouri conducted a pedestrian focus campaign that utilized social media, radio and TV. Several interviews were conducted with news media.
Montana
Montana DOT reviews fatalities on high-risk roads and fatalities and serious injuries per capita among older drivers and pedestrians annually to assess what actions are needed.
Montana constructs infrastructure improvements to mitigate intersection-related crashes. Examples of pedestrian safety measures include midblock crossing improvements; signal coordination and timing improvements; improved lighting; and improved signing. Montana DOT requires that during any construction project, pedestrian issues are reviewed to determine the best practice for the specific project. An update to Montana DOT’s ADA Transition Plan requires that new curb ramps be consid-ered wherever curbs, gutters, and sidewalks are adjacent to the project to ensure pedestrian safety.
Nebraska
Behavioral efforts in Nebraska include local enforcement agencies conducting special enforcement operations in school zones and pedestrian crosswalks. Locally produced pedestrian crosswalk PSAs are also being aired.
Engineering efforts include using new more durable painting on pedestrian crosswalks as well as lighting more heavily used intersections.
Nevada
Engineering improvements are being made at a faster pace than ever before. The Metropolitan Planning Organizations for both northern and southern Nevada authorized large pedestrian improve-ment projects, adding lighting, crosswalks and sidewalk improvements, while the DOT has committed $10M annually for pedestrian improvements.
Law enforcement agencies committed staffing to increased enforcement, and Joining Forces fund-ing, was utilized specifically for several enforcement waves. (Joining Forces is a multi-jurisdictional law enforcement program that promotes statewide enforcement on a number of road user behaviors.) Southern Nevada had nine specific waves of enforcement on the agencies’ budgets, plus two through
Spotlight on Highway Safety | Governors Highway Safety Association | 444 North Capitol Street | Suite 722 | Washington, DC 20001
Pedestrian Traffic Fatalities by State2017 PRELIMINARY DATA
28Spotlight on Highway Safety | Governors Highway Safety Association | 444 North Capitol Street | Suite 722 | Washington, DC 20001 28
Joining Forces, as well as many saturation patrols. Northern agencies held five enforcement waves and several saturation patrols.
The state’s ePEDemic campaign uses real life stories of pedestrians killed on Nevada’s roads, with local malls displaying victims’ shoes, photos, and stories, to great effect. Radio, television, and print were also part of the campaign.
New Jersey
The primary pedestrian safety activities include overtime enforcement and education funding to police departments.
The Pedestrian Safety, Enforcement and Education Fund is a repository for monies provided pursuant to subsection c. of N.J.S.A. 39:4-36. Under the statute, a motorist must stop for a pedestrian cross-ing the roadway at an intersection. Failure to stop may result in a fine of $200. A total of $100 of the fine is dedicated to the Fund that is used to make grants available to municipalities and counties with pedestrian safety problems. Grants can be used for enforcement, education and engineering.
Both the State Pedestrian Fund and Section 402 funds are used to pay for overtime enforcement that target high pedestrian crash locations and provide pedestrian safety education materials for delivery to high risk segments of the pedestrian population.
New Mexico
New Mexico pedestrian safety efforts include Look For Me, Safe Routes to School, and Safety Town, but the state lacks organizations with singular focus on pedestrian issues. New Mexico has a Safety Plan and a Long Range NM 2040 Plan with pedestrian elements.
New York
New York State is implementing a $110M Pedestrian Safety Action Plan (PSAP) to confront pedes-trian safety challenges across upstate New York and on Long Island. The PSAP incorporates education, enforcement and engineering solutions in 20 focus communities where pedestrian fatali-ties are the highest.
In 2017, New York conducted the state’s second annual high-visibility pedestrian safety enforcement mobilization, Operation See! Be Seen! During the first week, police agencies were encouraged to issue warnings and educational materials; in week two, tickets for infractions were issued to both pedestrians and motorists who were violating the law. In 2017, over 51,000 “See! Be Seen!” materials were shared. New York is also implementing a new pedestrian safety training program to support the goals of the PSAP. These courses teach officers about the PSAP, relevant vehicle and traffic laws, pedestrian crash issues and data.
New York State DOT is conducting pedestrian safety site evaluations on state roadways, with plans to implement crosswalk improvements at more than 2,000 unsignalized intersections and midblock locations. Additionally, NYSDOT is improving nearly 2,400 signalized intersection locations, with high-visibility crosswalk markings and signals enhanced with extended crossing times, countdown timers and leading pedestrian intervals to reduce conflicts between pedestrians and turning vehicles.
In New York City, pedestrian safety activities are spearheaded by NYCDOT and NYPD as part of the city’s Vision Zero initiative. Educational and outreach programs are provided at hundreds of
Spotlight on Highway Safety | Governors Highway Safety Association | 444 North Capitol Street | Suite 722 | Washington, DC 20001
Pedestrian Traffic Fatalities by State2017 PRELIMINARY DATA
29Spotlight on Highway Safety | Governors Highway Safety Association | 444 North Capitol Street | Suite 722 | Washington, DC 20001 29
schools and senior centers in 20 target communities where NYCDOT has identified high-crash arte-rial roadways. Multi-language presentations are provided to parents at health centers, schools and public assistance centers. NYCDOT also engages with community residents and business owners in high-risk corridors in all five boroughs to gather information about their traffic safety concerns, and it conducts Vision Zero outreach for the public by distributing educational materials at sporting events.
Additionally, NYCDOT recently completed a three-year project funded through FHWA’s Focused Approach to Safety initiative. The enforcement component included the issuance of 2,425 speeding and 1,312 failure-to-yield summonses by the NYPD during a total of more than 4,000 dedicated patrol hours. At high pedestrian crash corridors, pedestrian injuries declined by 34%, and at high pedestrian crash intersections, pedestrian injuries dropped by 23%. NYPD also utilizes dedicated grant funding to conduct additional pedestrian safety patrols focused on failure to yield and speed.
North Carolina
North Carolina DOT’s Watch for Me NC is a comprehensive program to reduce bicyclist and pedes-trian deaths by combining public education and high visibility enforcement, and is strengthened by partnerships with local communities around the state. The program was recognized by GHSA with a Peter K. O’Rourke Special Achievement Award in 2017.
The program was pilot tested in in four communities in 2012 and has expanded vastly since, with 33 communities participating in 2017. Watch for Me’s educational materials focus on the most commonly ignored laws that contribute to pedestrian and bicyclist crashes and encourage behaviors that can reduce such crashes.
In addition, law enforcement officers receive training on best practices in communicating and enforc-ing pedestrian and bicycle laws, and agencies use crash data to target enforcement efforts to crash hot spots. As of 2016, communities participating in Watch for Me NC had reported a total of 360 targeted safety operations, resulting in more than 800 citations.
The campaign has received significant public engagement and earned media, and evaluations show significant increases in law enforcement officer knowledge of pedestrian and bicycle laws as well as a 32 percent increase in the rate of drivers complying with yielding laws at marked pedestrian intersections.
North Dakota
North Dakota encourages the use of countdown timers and advanced walk intervals at identified urban intersections with high pedestrian traffic. Additionally, Transportation Alternative Program (TAP) funds are used for school zone enforcement, education, and outreach activities.
Oklahoma
Specific locations receive targeted education through radio and social media. Most education occurs concurrently through signage, focused on both pedestrians and motorists, mostly in metropolitan areas. Oklahoma City and Tulsa have implemented new multi-modal engineering solutions that include improved crosswalk markings, signals/signs, sidewalks, and dedicated lanes for bicyclists that also provide some additional protection to pedestrians. Many high-risk locations are part of plans for assessment and implementation of engineering improvements to areas of high pedestrian traffic, including some rural locations.
Spotlight on Highway Safety | Governors Highway Safety Association | 444 North Capitol Street | Suite 722 | Washington, DC 20001
Pedestrian Traffic Fatalities by State2017 PRELIMINARY DATA
30Spotlight on Highway Safety | Governors Highway Safety Association | 444 North Capitol Street | Suite 722 | Washington, DC 20001 30
The Indian Nations Council of Governments received funding for bicyclist/pedestrian safety in the Tulsa metropolitan area. The project focuses on providing oversight and coordination of an interdis-ciplinary group that will provide specific recommendations regarding high crash locations, including those involving pedestrians. Recommendations may include engineering improvements, traffic safety education, and enforcement at the local level.
Funding is also provided to Safe Kids Oklahoma to support a bicycle/pedestrian educational effort.
Oregon
Oregon’s behavioral efforts include producing and distributing a 30-second PSA directed to pedes-trians promoting safe crossing at intersections. In the Portland Metro area, regional traffic safety partners produced a poster campaign, Every Intersection is a Crosswalk. Portland transit TriMet posted the message on buses. A 30-second video was produced by the MPO and posted on Oregon DOT YouTube and partnering agencies’ sites. The state has printed and distributed yard signs and bookmarks with driver messages to watch for pedestrians. The state released the Say What You See back-to-school pedestrian safety PSA in September. An updated brochure on What you need to know about Oregon Crosswalk Laws: A Driver’s Guide was created to be distributed to local Department of Motor Vehicle offices and local police departments.
Enforcement activities include awarding Pedestrian Safety Enforcement (PSE) operation overtime mini-grants to 28 local law enforcement agencies to conduct PSE operations statewide, April to September 2017. Non-funded law enforcement agencies also conducted their own PSE operations throughout the year.
On the engineering side, Oregon DOT is implementing pedestrian crossing improvements including rapid flashing beacons and pedestrian hybrid beacons, leading pedestrian intervals, accessible pedes-trian push buttons, sidewalks, and curb ramps. ODOT has made it common practice to use advanced stop bars at signalized intersections as a pedestrian/bike safety measure. ODOT started requiring a Temporary Pedestrian Accessible Route as a component of every Traffic Control Plan, and the Portland Bureau of Transportation adopted new temporary traffic control guidelines to prioritize main-taining pedestrian facilities during construction projects. ODOT started project development on the first round of jurisdictionally blind, data driven, ped/bike safety improvement projects funded through the All Roads Transportation Safety (ARTS) program. Lastly, in the Oregon Legislative Assembly, House Bill 2017 (Keep Oregon Moving) passed, approving funding of multiple transportation projects to include statewide pedestrian safety improvement projects and Safe Routes to School infrastructure projects in the upcoming years.
Pennsylvania
Pennsylvania has conducted targeted enforcement stings for motorists who fail to yield to pedestrians in crosswalks. PennDOT’s website has a number of safety videos for parents and children – focused on walking safely to school, and packages of pedestrian safety cards have been distributed at numer-ous events. PennDOT’s district press and safety officers do a range of other activities in support of pedestrian safety. From an engineering perspective, the state is being more aggressive with road diets, bulb-outs, speed tables and raised intersections.
Spotlight on Highway Safety | Governors Highway Safety Association | 444 North Capitol Street | Suite 722 | Washington, DC 20001
Pedestrian Traffic Fatalities by State2017 PRELIMINARY DATA
31Spotlight on Highway Safety | Governors Highway Safety Association | 444 North Capitol Street | Suite 722 | Washington, DC 20001 31
Rhode Island
Rhode Island conducts pedestrian safety presentations for businesses and holds press events with safety data and a safety message. The state also produces pedestrian safety tri-fold pamphlets with a safety message.
For enforcement, the state holds pedestrian decoy stings and crosswalk enforcement.
Engineering improvements include curb bump-outs to decrease a pedestrian’s time in the roadway and installation of RRFB flashing beacons on select roadways.
South Carolina
The state continues to remind motorists, through its “LOOK” educational campaign, to be alert for pedestrians and other vulnerable roadway users.
South Carolina used 402 funds from a Public Information, Outreach and Training internal grant to produce a pedestrian “LOOK” billboard campaign. Billboards were placed throughout the state reminding motorists to look for pedestrians.
Tennessee
Walk Bike Nashville, one of the Tennessee Highway Safety Office’s (THSO) subrecipients, devel-oped and designed a pedestrian safety campaign. To get a wide range of input, they partnered with Anthony Campbell, a professor at TN State University, to host a series of focus groups and meetings. They had one general public focus group, one with pedestrian advocates, one with the homeless population and one with the Walk Bike Nashville Board of Directors. With each group, they sought input on perceptions of safety for those walking and feedback on campaigns in peer cities.
Walk Bike Nashville contracted with the iCube team at TN Tech University to help create the graphic elements of the campaign. The campaign includes three different stories/versions alerting drivers to look out for people walking, slow down, and pay attention at night. These were finalized towards the end of September and approved by THSO. The campaign communication channels will include the Metropolitan Transit Authority ad spaces (buses, bus benches, shelters and interior bus cards), a website, and social media.
THSO works closely with Tennessee DOT. A Complete Streets policy was updated in 2015 and is in active use. Roadway and resurfacing projects are reviewed by several groups, and multi-modal road users are included in the process; they can provide input about improvements that positively impact pedestrians and cyclists. A multi-modal design guide and scoping manual will be rolling out in the coming months. These guides assist in designing Complete Streets. FHWA has identified five design countermeasures, and a meeting will occur in February 2018 to determine which countermeasures will be highlighted in Tennessee.
Texas
Texas DOT (TxDOT) launched its Be Safe. Be Seen. campaign to improve pedestrian safety and to reduce the number of fatalities and injuries along and around I-35 in the Austin area. As part of the campaign, reflective bags were provided to the homeless population and school children, two of the most at-risk groups.
Spotlight on Highway Safety | Governors Highway Safety Association | 444 North Capitol Street | Suite 722 | Washington, DC 20001
Pedestrian Traffic Fatalities by State2017 PRELIMINARY DATA
32Spotlight on Highway Safety | Governors Highway Safety Association | 444 North Capitol Street | Suite 722 | Washington, DC 20001 32
TxDOT also informs the public through PSAs to explain the dangers of walking while impaired or distracted. Be Safe. Drive Smart. is an education and awareness effort aimed at saving lives and reducing crashes. Pedestrian safety is one of the campaign emphasis areas.
Texas Children’s Hospital’s Pedestrian and Bicycle Safety Education and Outreach project educated communities about safe pedestrian and bicycling behaviors in an effort to reduce the prevalence of fatalities and injuries to children in the Houston metropolitan area.
Texas DOT is also improving pedestrian safety by adding marked crosswalks and pedestrian signals (including pedestrian hybrid beacons), and by constructing new sidewalks, median islands, and bulb-outs.
Utah
Utah utilized educational booths at various community events to talk about pedestrian safety. The state also conducted several media events, including one that demonstrated the difficulty of seeing pedestrians at night.
Utah has also funded several overtime law enforcement efforts across the state.
The Utah Highway Safety Office worked on several committees with the State DOT and local health departments to develop a pedestrian-focused training module for city planners, engineers, and officials.
Utah uses a Pedestrian Safety Action Plan as a platform for working on multiple aspects of pedes-trian safety at the same time.
Vermont
In 2015, the Vermont Governor’s Highway Safety Program (GHSP) conducted a pedestrian safety assessment in coordination with FHWA. Since then, GHSP has worked with an external consultant to advance pedestrian safety activities, including development and implementation of a curriculum at the state police academy on laws governing the interaction of vehicles, bicyclists and pedestri-ans; updating a non-motorized transportation safety web page; and helping communities develop local pedestrian safety action plans. The program has also run PSAs, participated in events and rallies, and created a number of educational publications promoting non-motorized safety. Funding efforts include providing infrastructure grants to Vermont communities, investments in state projects improving bicycling and walking, and supporting Local Motion, a statewide bicyclist and pedestrian advocacy organization.
Virginia
The Virginia Highway Safety Office (VAHSO), through its regional program managers, emphasizes the importance of improving pedestrian safety through education. VAHSO has a Pedestrian Safety Taskforce which meets quarterly to discuss the data and initiatives to address pedestrian fatalities. Virginia DOT also has a Pedestrian Safety Committee that meets on infrastructure improvements to protect pedestrians. Both committees also share information. Arlington County, Fairfax County, Prince William County, Richmond City, Roanoke City, Salem City and Harrisonburg City are among the locali-ties that receive highway safety funding to raise awareness of and enforce pedestrian safety laws.
Spotlight on Highway Safety | Governors Highway Safety Association | 444 North Capitol Street | Suite 722 | Washington, DC 20001
Pedestrian Traffic Fatalities by State2017 PRELIMINARY DATA
33Spotlight on Highway Safety | Governors Highway Safety Association | 444 North Capitol Street | Suite 722 | Washington, DC 20001 33
Washington
The City of Spokane and Spokane County have developed a See and Be Seen campaign that focuses public education/outreach on pedestrians getting the attention of motorists. Their public outreach efforts are supported by law enforcement, with an emphasis on patrolling for pedestrians who break state law for crossing roadways as well as vehicle operators who fail to yield the right of way to pedestrians.
Clark County has a law enforcement-focused effort to provide citations to both walkers and driv-ers who fail to follow pedestrian safety laws. They have created an attractive rack card to discuss pedestrian safety issues.
West Virginia
West Virginia has a Safe Communities program in Morgantown that created a Distracted Driving/Walking Task Force, and is focusing on distracted walking and educating the college students and community as a whole on the dangers of distracted walking. There is also a Pedestrian Safety Board in Morgantown that is very involved in pedestrian issues in their city.
Wisconsin
The Bureau of Transportation Safety (BOTS) has a range of tools that it uses to support safe trans-portation for pedestrians. The agency hosts the following courses on an annual basis to increase safety education: Teaching Safe Bicycling, Law Enforcement Bike and Pedestrian Training, and Designing for Pedestrian Safety.
The Bureau also provides funding for annual high visibility enforcement (HVE) grants to law enforcement agencies in communities that have the most acute problems with pedestrian and bicyclist fatalities and injuries. The goal of these HVE grants is to collaborate with law enforcement agencies to improve and increase the number of enforcement initiatives that impact pedestrians and bicyclists. Enforcement should focus on behaviors that lead to crashes – failure to yield, red light violations, speeding in advance of marked and unmarked crosswalks that can lead to failure to yield, sudden pedestrian movement, and bicyclist violations of stop signs and stop lights. These grants supplement existing enforcement related to pedestrian and bicyclist safety.
In addition, BOTS has a partnership program with the Bicycle Federation of Wisconsin called Share and Be Aware. Share and Be Aware is a statewide campaign to make walking and biking even safer by educating all road users. Every person, whether walking, biking, or driving has a role to play in traffic safety. This program supports the training and education portion of the high visibility enforcement grants.
Spotlight on Highway Safety | Governors Highway Safety Association | 444 North Capitol Street | Suite 722 | Washington, DC 20001
Pedestrian Traffic Fatalities by State2017 PRELIMINARY DATA
34Spotlight on Highway Safety | Governors Highway Safety Association | 444 North Capitol Street | Suite 722 | Washington, DC 20001 34
DISCUSSION
In recent years, pedestrian fatalities in the U.S. have risen at an alarming and unprecedented rate:
●● The nationwide number of pedestrian fatalities increased 27 percent from 2007 to 2016, while all other traffic fatalities over this period decreased by 14 percent.
●● Pedestrian deaths as a percent of total motor vehicle crash deaths increased steadily, from 11 percent in 2007 to 16 percent in 2016. Pedestrians now account for the largest proportion of traffic fatalities during the past 33 years.
●● The number of states with pedestrian fatality rates at or above 2.0 per 100,000 population more than doubled from seven in 2014 to 15 in 2016.
●● From 2015 to 2016, pedestrian fatalities in the nation’s 10 most populous cities increased 28 percent (153 additional fatalities).
●● GHSA’s most recent analysis projects the nationwide number of pedestrians killed in 2017 decreased by about one half of one percent — essentially unchanged from 2016. Despite the apparent leveling off of pedestrian fatalities, 2017 is still on par to become the second consecutive year with nearly 6,000 pedestrian deaths. The last time the U.S. saw more than 6,000 pedestrian deaths was 1990.
●● During the first six months of 2017, more states reported increases (24) than decreases (20) compared with the same time period in 2016.
Many factors outside the control of traffic safety officials may contribute to the observed year-to-year changes in the number of pedestrian fatalities, including economic conditions, demographics, weather, fuel prices, the amount of motor vehicle travel, and the amount of time people spend walking. Travel monitoring data published by FHWA indicates that motor vehicle travel on all roads and streets increased by 1.6% (+24.6 billion vehicle miles) for the first half of 2017 as compared with the same period in 2016.9 The year-to-date travel estimate was the highest number of vehicle miles traveled ever reported by FHWA. Comparable exposure data for pedestrian activity is not available.
Without stating a direct correlation or claiming a definitive link, more recent factors contributing to the increase in pedestrian fatalities might include the growing number of state and local governments that have decriminalized recreational use of marijuana (which can impair judgment and reaction time for all road users),10 and the increasing use of smart phones (which can be a significant source of distraction for both drivers and pedestrians).
With regard to marijuana, a 2017 study by the Highway Loss Data Institute found that legalizing recre-ational use of marijuana in Colorado, Oregon and Washington has resulted in collision claim frequencies that are about 3 percent higher overall than would have been expected without legalization.11 The pres-ent study examined SHSO-reported pedestrian fatality data for seven states (Alaska, Colorado, Maine, Massachusetts, Nevada, Oregon, Washington) plus the District of Columbia that legalized recreational use of marijuana between 2012 and 2016 (Table 12). These eight jurisdictions experienced a collective 16.4 percent increase in pedestrian fatalities for the first six months of 2017 versus the first six months
9 FHWA. 2017. Traffic Volume Trends, June 2017. https://www.fhwa.dot.gov/policyinformation/travel_monitoring/17juntvt/
10 http://norml.org/laws
11 http://www.iihs.org/iihs/sr/statusreport/article/52/4/1
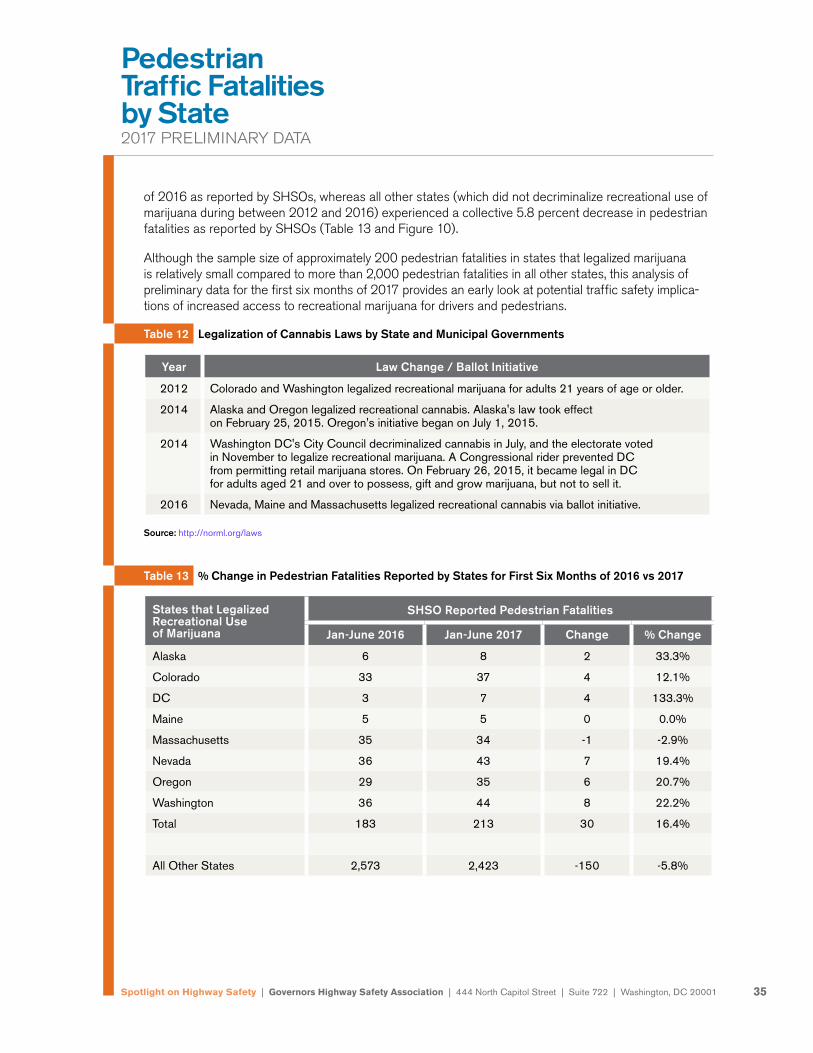
Spotlight on Highway Safety | Governors Highway Safety Association | 444 North Capitol Street | Suite 722 | Washington, DC 20001
Pedestrian Traffic Fatalities by State2017 PRELIMINARY DATA
35
of 2016 as reported by SHSOs, whereas all other states (which did not decriminalize recreational use of marijuana during between 2012 and 2016) experienced a collective 5.8 percent decrease in pedestrian fatalities as reported by SHSOs (Table 13 and Figure 10).
Although the sample size of approximately 200 pedestrian fatalities in states that legalized marijuana is relatively small compared to more than 2,000 pedestrian fatalities in all other states, this analysis of preliminary data for the first six months of 2017 provides an early look at potential traffic safety implica-tions of increased access to recreational marijuana for drivers and pedestrians.
Table 12 Legalization of Cannabis Laws by State and Municipal Governments
Source: http://norml.org/laws
Table 13 % Change in Pedestrian Fatalities Reported by States for First Six Months of 2016 vs 2017
Year Law Change / Ballot Initiative
2012 Colorado and Washington legalized recreational marijuana for adults 21 years of age or older.
2014 Alaska and Oregon legalized recreational cannabis. Alaska's law took effect on February 25, 2015. Oregon's initiative began on July 1, 2015.
2014 Washington DC's City Council decriminalized cannabis in July, and the electorate voted in November to legalize recreational marijuana. A Congressional rider prevented DC from permitting retail marijuana stores. On February 26, 2015, it became legal in DC for adults aged 21 and over to possess, gift and grow marijuana, but not to sell it.
2016 Nevada, Maine and Massachusetts legalized recreational cannabis via ballot initiative.
States that Legalized Recreational Use of Marijuana
SHSO Reported Pedestrian Fatalities
Jan-June 2016 Jan-June 2017 Change % Change
Alaska 6 8 2 33.3%
Colorado 33 37 4 12.1%
DC 3 7 4 133.3%
Maine 5 5 0 0.0%
Massachusetts 35 34 -1 -2.9%
Nevada 36 43 7 19.4%
Oregon 29 35 6 20.7%
Washington 36 44 8 22.2%
Total 183 213 30 16.4%
All Other States 2,573 2,423 -150 -5.8%
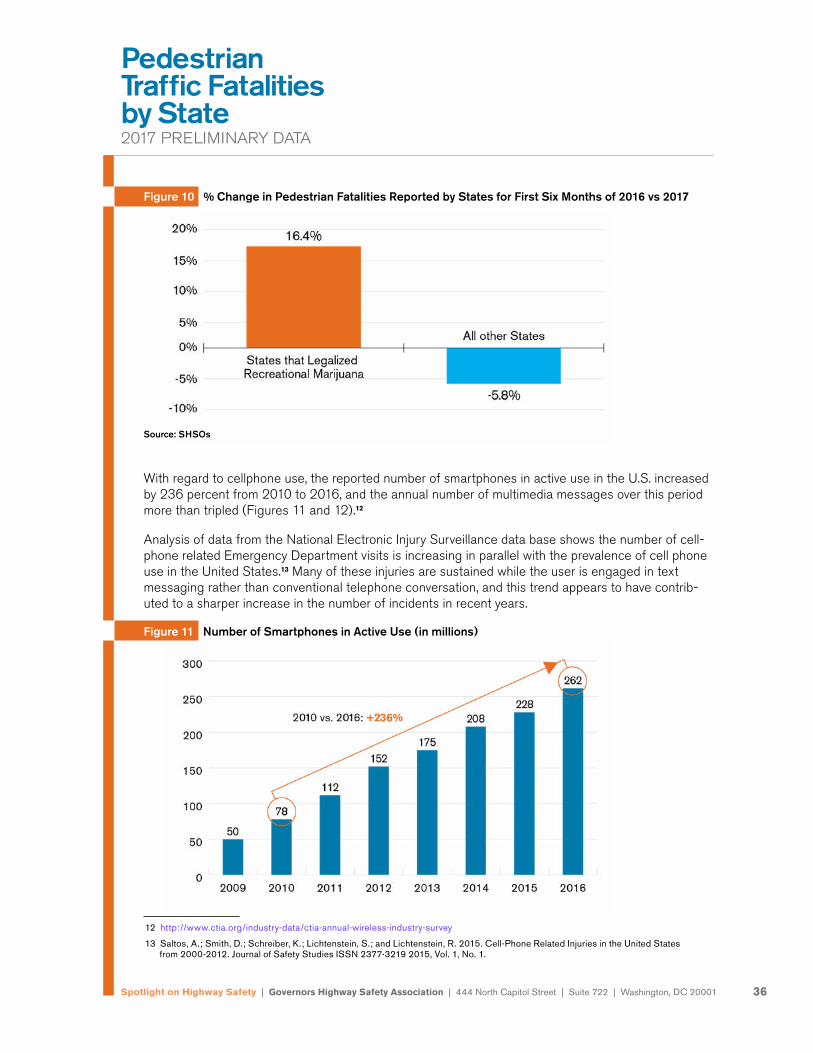
Spotlight on Highway Safety | Governors Highway Safety Association | 444 North Capitol Street | Suite 722 | Washington, DC 20001
Pedestrian Traffic Fatalities by State2017 PRELIMINARY DATA
36
Figure 10 % Change in Pedestrian Fatalities Reported by States for First Six Months of 2016 vs 2017
Source: SHSOs
With regard to cellphone use, the reported number of smartphones in active use in the U.S. increased by 236 percent from 2010 to 2016, and the annual number of multimedia messages over this period more than tripled (Figures 11 and 12).12
Analysis of data from the National Electronic Injury Surveillance data base shows the number of cell-phone related Emergency Department visits is increasing in parallel with the prevalence of cell phone use in the United States.13 Many of these injuries are sustained while the user is engaged in text messaging rather than conventional telephone conversation, and this trend appears to have contrib-uted to a sharper increase in the number of incidents in recent years.
Figure 11 Number of Smartphones in Active Use (in millions)
12 http://www.ctia.org/industry-data/ctia-annual-wireless-industry-survey
13 Saltos, A.; Smith, D.; Schreiber, K.; Lichtenstein, S.; and Lichtenstein, R. 2015. Cell-Phone Related Injuries in the United States from 2000-2012. Journal of Safety Studies ISSN 2377-3219 2015, Vol. 1, No. 1.
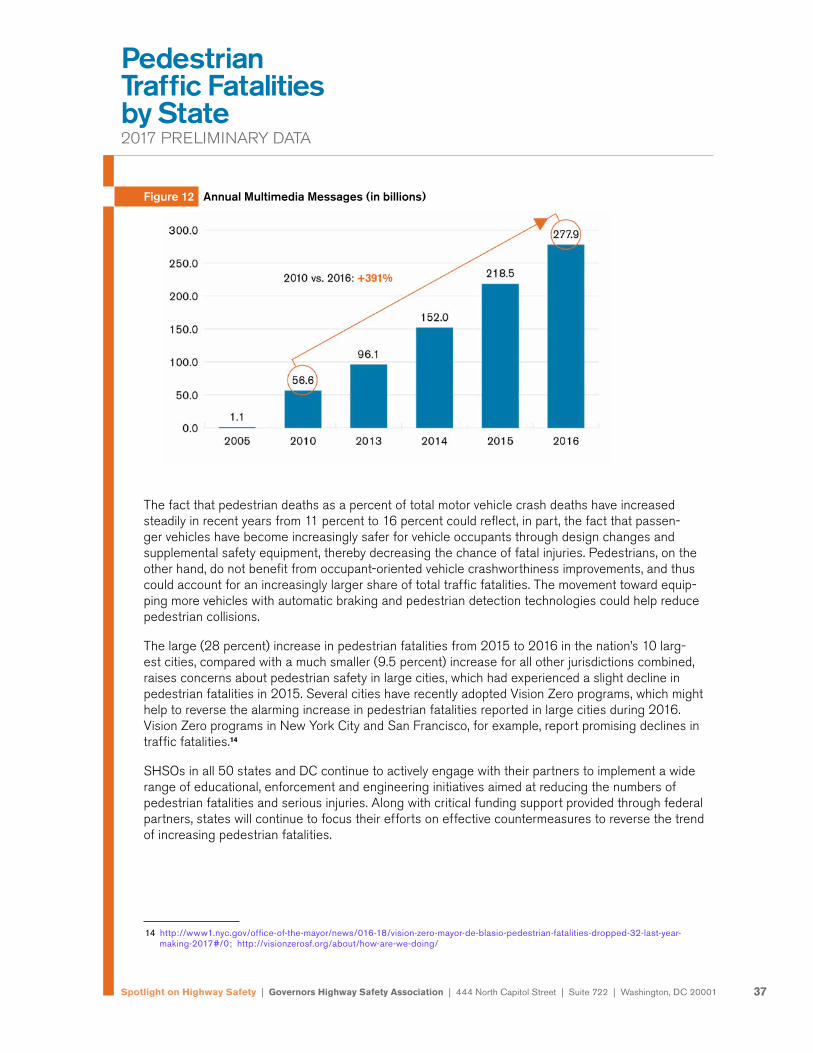
Spotlight on Highway Safety | Governors Highway Safety Association | 444 North Capitol Street | Suite 722 | Washington, DC 20001
Pedestrian Traffic Fatalities by State2017 PRELIMINARY DATA
37
Figure 12 Annual Multimedia Messages (in billions)
The fact that pedestrian deaths as a percent of total motor vehicle crash deaths have increased steadily in recent years from 11 percent to 16 percent could reflect, in part, the fact that passen-ger vehicles have become increasingly safer for vehicle occupants through design changes and supplemental safety equipment, thereby decreasing the chance of fatal injuries. Pedestrians, on the other hand, do not benefit from occupant-oriented vehicle crashworthiness improvements, and thus could account for an increasingly larger share of total traffic fatalities. The movement toward equip-ping more vehicles with automatic braking and pedestrian detection technologies could help reduce pedestrian collisions.
The large (28 percent) increase in pedestrian fatalities from 2015 to 2016 in the nation’s 10 larg-est cities, compared with a much smaller (9.5 percent) increase for all other jurisdictions combined, raises concerns about pedestrian safety in large cities, which had experienced a slight decline in pedestrian fatalities in 2015. Several cities have recently adopted Vision Zero programs, which might help to reverse the alarming increase in pedestrian fatalities reported in large cities during 2016. Vision Zero programs in New York City and San Francisco, for example, report promising declines in traffic fatalities.14
SHSOs in all 50 states and DC continue to actively engage with their partners to implement a wide range of educational, enforcement and engineering initiatives aimed at reducing the numbers of pedestrian fatalities and serious injuries. Along with critical funding support provided through federal partners, states will continue to focus their efforts on effective countermeasures to reverse the trend of increasing pedestrian fatalities.
14 http://www1.nyc.gov/office-of-the-mayor/news/016-18/vision-zero-mayor-de-blasio-pedestrian-fatalities-dropped-32-last-year-making-2017#/0; http://visionzerosf.org/about/how-are-we-doing/
Spotlight on Highway Safety | Governors Highway Safety Association | 444 North Capitol Street | Suite 722 | Washington, DC 20001
Pedestrian Traffic Fatalities by State2017 PRELIMINARY DATA
38
ACKNOWLEDGEMENTS
Richard Retting, Sam Schwartz Consulting, conducted the analysis, researched and wrote the report.
Jonathan Adkins, Executive Director, GHSA, Kara Macek, Senior Director of Communications and Programs, GHSA, and Madison Forker, Communications Coordinator, GHSA, oversaw the report.
Pam Fischer, Principal, Pam Fischer Consulting, edited the report.
Creative by Tony Frye Design.
Published February 28, 2018.