spotlight on australian manufacturing - power trans · spotlight on australian manufacturing. ......
TRANSCRIPT

RRP $25.00Showcasing high voltage electricity | issue 4 | August-September | 2015
SPOTLIGHT ON AUSTRALIAN MANUFACTURING

WARNING! The counterfeit clevis thimble above may have been sold as an individual product or part of an assembly.
P: (02) 8805 0000 | E: [email protected] | W: www.preformed.com.au
COUNTERFEIT WARNING!!!
The NSW Supreme Court made a declaration on 5 June 2015 that RNH Ventures Pty Ltd trading as Summit Power and Summit Fasteners (together Summit) has engaged in misleading and deceptive
conduct in contravention of section 18 of the Australian Consumer Law.
Summit has sold clevis thimbles both individually and as part of an assembly identified as PLP 70kN ACT27-16 which were not manufactured or distributed by Preformed Line Products (Australia) Pty Ltd (or
its related companies) but were in fact manufactured and distributed by a third party (Counterfeit Clevises). This non-genuine product is not approved for use in the Australian Electricity Networks.
Marking is not as defined and slightly off-centre!
Ejector Pin Marking or Marking removed
with linishing!
Thimble Front
Ejector Pin Marking or Marking removed
with linishing!
Thimble Rear
39mm Split Pin
COUNTERFEIT THIMBLE FRONT COUNTERFEIT THIMBLE REAR
For help with the identification of counterfeit thimbles please contact PLP (02) 8805 0000
20150731_02

Transmission & Distributionwww.powertrans.com.au 1
The manufacturing capacity at the Brisbane Australia corporate Head Office and factory has been enhanced with three separate medium voltage reclosing circuit breaker production
lines, operating two shifts a day throughout the entire year.In addition, subsidiary entities and exclusive distributors in 82
countries continue to provide a network across the globe to provide their customers with solutions in their own time zones. NOJA Power Brazil Campinas manufacturing facility has now matured to provide consistent output and recently obtained ISO 9001 accreditation.
NOJA Power have recently obtained third party accreditation to ISO18001 Occupational Health and Safety, their health and safety programs are recognised as industry leading.
world leaderNOJA Power’s vision is to be the world leader in medium-voltage outdoor switchgear. The company has moved towards achieving that vision with the installation of more than 35,000 NOJA Power OSM series Automatic Circuit Reclosers in over 82 countries worldwide.
In addition the company’s products are externally type tested and certified by Netherlands-based independent test laboratory KEMA.
NOJA Power is committed to quality and environmental responsibility and the company has been certified to AS/NZS ISO9001, AS/NZS ISO14001, AS/NZS 4801 and OHSAS 18001 Standards.
The company’s medium voltage Automatic Circuit Reclosers are suitable for both pole-mount and substation applications for conventional distribution networks ranging from 10 to 38 kV.
client collaborationNOJA Power collaborates with its clients worldwide to ensure their different needs and requirements are met. For example, the company recently released a single triple Automatic Circuit Recloser to meet the unique requirement of the US Market.
The company retains offices throughout the world with business developers and authorised distributors servicing clients in Australia, the U.S., South America, Europe, Africa and Asia. In January 2012 NOJA Power Brazil was founded to service the already high and increasing demand for the OSM series and RC10 Controller Products in Brazil.
ManUFactUrinG actiVitieSNOJA Power’s main production facility is purpose built for the manufacture of low- and medium-voltage switchgear and houses the latest in lean assembly processes together with advanced testing facilities.
reSearcH & deVeloPMentNOJA Power maintains a long-term commitment to Research & Development (R&D) activities.
Up to 10% of the company’s turnover is invested in R&D every year. Our R&D team are highly skilled and talented with relevant industry experience.
This year has seen the broadening of their single and dual phase product range. The launch of the single triple for the US market and the introduction of a whole new range of features allowing the broadening of support for electrical networks now and well into the future.
QUalitY ManGeMent SYSteMNOJA Power’s established Quality Management System has been certified in accordance with AS/NZS ISO9001:2008 and guarantees the manufacture of quality, leading-edge finished goods in each of the company’s factories.
Superior product safety, reliability and performance is underwritten by type testing and certification conducted on all products using both NOJA Power’s in-house test facilities and those of independent laboratories such as KEMA, TCA, EMC technologies and SIMTARS.
Financial PerForMance2014 delivered a strong financial performance for the NOJA Power Group. This performance resulted in a significant increase in the net worth of the group and an on-budget net profit after tax performance. The group balance sheet has no significant debt and allows the company to continue to invest in the coming years to finance expansion and growth.
NOJA Power is well placed in 2015 for continued growth with an ever increasing product portfolio and financial capability to support the growth.
world leader in medium voltage outdoor switchgear
NOJA Power are committed to continuing to invest in research and development and plan to launch several new products and technologies in 2015 as a result. Many of these technologies will be world firsts and are expected to fuel significant growth in the business over the next decade.
T&DMade in aUStralia

4
EEA ConfErEnCE in rEviEw bEgins on pAgE 4
24
fAult loCAtion in powEr CAblEs
coVer StorY
Made in Australia 1world leader in medium voltage outdoor switchgear 1
EEA in Review 4-18Power station refurbishment completed 4
eea Pictorial review 6
Power transformer operations and loading 8
seismic testing of timber Power Poles 12
mercury and air toxics standard (mats) 13
Battery Powered 200a micro-ohmmeter 15
Overhead Lines 19-30overhead line conductors 20
30 Years milestone in australia 23
Fault location in Power cables 24
distribution Fault anticipation 27
Transmission & Distribution August/September 20152
T&D iSSUe 4 2015 • aUG–SePT&D
T&D
NOJA Power Switchgear Pty Ltd specialises in the research and development, manufacture, marketing, sales and service of low and medium voltage switchgear products.
Our medium voltage switchgear division specialises in Medium Voltage Autoreclosers for both pole mounted and substation applications from 10kV to 38kV. Our recloser products are in service today in more than 80 countries worldwide.Our staff and engineers, scientists, technicians and tradespeople have extensive experience in researching and developing, manufacturing and servicing medium voltage pole mounted switchgear and the related microprocessor based controllers and technologies.We pride ourselves on providing the best possible service and support for our products.Today we are represented in more than 80 countries by exclusive distributors and our products and services have a reputation for high reliability, leading edge technology and long life.All of our products have been extensively tested in both in-house laboratories as well as externally type tested and certified by KEMA in the Netherlands. We maintain a quality system in full compliance with ISO 9001 that is externally audited and certified.We service our global customer base from our NOJA Power corporate office and factory facilities located in Brisbane, Australia.noJa Power SwitcHGear PtY ltd | WWW.NOJAPOWER.COM.AU | 16 ARCHIMEDES PLACE MURARRIE, QLD, 4172PHONE: +61 (7) 3907 8777 | EMAIL: [email protected]

11
rEAdEr rEgistrAtion
register online at www.powertrans.com.au
40
prEvEntion of trAnsformEr fAilurE
Software 31Power monitoring meter 31
General 32-45
eecon nsw 2015 32
design and development of 110kv mobile substations 34
aPt Publications new looK... 37
rent the Fluke dsX-5000 cable analyser 38
a new integrated solution for condition monitoring 39
Prevention of transformer Failure 40through continuous monitoring
Switchgear 46-48Practical Partial discharge mitigation on 11kv switchgear 46
Transmission & Distributionwww.powertrans.com.au 3
T&D
Head oFFice 16 bird Place, Pullenvale, brisbane Qld 4069 P. o. box 1195 Kenmore, brisbane Qld 4069 telephone +61 (0)7 3374 2877 Facsimile +61 (0)7 3374 2899
website www.powertrans.com.au
Managing Director Tyrone Gautier Email [email protected]
Production Manager Jenni Onn Email [email protected]
Transmission & Distribution is published bimonthly and distributed via subscription to electrical consulting engineers and personnel within utility companies, the mining and sugar industries, heavy industry, government departments and local councils within the area covered by the Australian “Print Post” Service and New Zealand.
reader enQUirieS / SUbScriPtionSPlease contact Head Office or register on-line at www.powertrans.com.au
PUbliSHeraUStralaSian Power tecHnoloGieS (aPt) PUblicationS PtY ltd
adVertiSinG enQUirieS diana McPheeDirect Line +61 (0)7 3374 3720 Email [email protected]
coPYriGHt© All rights reserved. No part of this publication may be reproduced or transmitted in any form or by any means electronic, mechanical, including photocopying, recording or entry into an electronic database without written permission of the copyright owner.
iMPortant diSclaiMerNo responsibility is accepted by APT Publications, the editor, the authors or the printer of any articles for the accuracy of any information contained in the magazine or the consequences of any person relying upon such information. The contents of this magazine should not be relied upon as a substitute for professional advice.
Advertisements must comply with the relevant provisions of the Competition and Consumer Act 2010. Responsibility for compliance with the Act rests with the person, company or advertising agency submitting the advertisement. Neither the publisher nor editor accepts responsibility for advertisements.
Officers hereby disclaim, to the full extent permitted by the law, all liability, damages, costs and expenses whatsoever arising from or in connection with copy information or other material (“Copy”) in this magazine, any negligence of the Publisher, or any person’s actions in reliance thereon. Inclusion of any Copy must not be taken as any endorsement by the Publisher. Views expressed by contributors are personal views and they are not necessarily endorsed by the Editor or the Publisher.
T&D
Tyrone GautierManaging Director
A VALUE ADDFor those who have a professional status and require Continuing Professional Development (CPD) to retain your status, you can use this publication to fulfil the educational requirements. Contact your association to learn how.

T&D
Transmission & Distribution August/September 20154
Loy Yang’s iconic cooling towers and flue stacks near Traralgon in the Latrobe Valley have become
local landmarks ever since the plant was commissioned over 30 years ago in 1982. Loy Yang is a 2,210- megawatt power station that supplies approximately 30% of Victoria’s power requirements. It is Victoria’s largest power station. More than 30 years on, continuing efficiency initiatives in the face of rising coal costs and tougher environmental controls and the ageing of many disparate control and protection systems meant that there was a need to refurbish the integrated control and monitoring systems on the 4 boilers and generators.
The contract to do this refurbishment was awarded to Yokogawa in 2006 with a scope that included creating a common station plant control system, a coal handling system, creating a high fidelity operator training simulator and the changing of the operating systems on the generator units by the end of 2014.
witHoUt anY loSt tiMe incidentS.Over the time that this project took to complete, Yokogawa did not miss the opportunity to learn how to be more efficient, timely and ultimately provide more value to Loy Yang’s owners. Every Unit outage was quicker than the previous one. Yokogawa successfully completed Unit 4’s outage early and importantly without any Lost Time Incidents.
cooPerate FreelY witH otHer SUPPlierSJohn Hewitt, Yokogawa’s Managing Director said that Yokogawa’s ability to bring this project in early was the result of the open and
learning culture at Yokogawa: “Over the years we have learned to embrace better ways to do things and to cooperate freely with other suppliers on these mega projects, so costs and time can be saved. What we did at Loy Yang, is very similar to the Major Automation Contractor approach we employ in the oil and gas part of our business.”
According to feedback from the plant’s operators, the new control system will allow more precision in
operation of the steam boilers to better cope with variations in coal quality and moisture content from the adjacent mine. The coal sometimes contains 66% water.
tiGHter control oF tHe SYSteMAGL Loy Yang’s Engineering and Maintenance Manager, Ron Tomasetti, said during the initial implementation phase Loy Yang was already seeing yield improvements in running the automated control system which required less operator input, but gave tighter control of the system. “From what we’ve seen to date, thermal efficiency improvements of 2-3% across the plant are possible.”
SUMMarYMr Tomasetti said this was a ‘win-win’ for the power station, electricity users and the environment. “Efficiency and environmental benefits are one and the same thing. If you run the plant efficiently, you burn less fuel and also avoid spikes in steam temperature. This preserves the life and integrity of the whole steam circuit (comprising boiler, valves etc) and also results in a higher level of plant safety.”
Power station reFurBishment comPleted
AGL Energy Limited (AGL) has completed the refurbishment of all four generating units at its Loy Yang A facility as part of a total upgrade of the power station’s control system and generating units. The Unit 4 generator at AGL’s Loy Yang A power station successfully passed its full load rejection test in late 2014, signifying the end of Unit 4’s major outage activity. The total refurbishment started in 2006.
eea in reView

...EEA CONFERENCE | WELLINGTON | 24–26 JUNE 2015 In Review...
Transmission & Distributionwww.powertrans.com.au 5
bri-tech Pty ltdC Mike DayT +64 9 274 4280F +64 9 274 4281E [email protected] www.britech.com.au
BBri-Tech is a specialist supplier and manufacturer’s agent for a diverse range of electric power distribution and transmission
products. Supplying brands such as Hubbell, Chance, Ohio Brass, Hendrix, Howard, Honeywell and Erico our core product lines are surge arresters, insulators, powerline hardware, tools and safety equipment and switching products.
We service and support customers across power utilities, mining, heavy industry, communication providers, transportation, electrical contractors, OEM and wholesaler markets throughout Australia and New Zealand. Bri-Tech adds value to imported products through quality control, testing, packaging, and by modifying products to meet Australian and New Zealand Standards and to suit customer needs. Please contact any of our offices in Perth, Brisbane, Melbourne and Auckland.
inGal ePSC Paul SheatherT +61 409 517 831E [email protected] W www.ingaleps.com.au
INGAL EPS is the leading steel pole manufacturer in Australia and have been designing and supplying power poles for more than 40 years. INGAL EPS
steel power poles are the lightest poles available on the market for almost any length and tip load combination. We’re able to transport more poles per truck than any other type of pole structure, optimising the load and considerably reducing the overall delivery and installation costs.
Our local support team with extensive experience in the pole business combined with design expertise ensures supply of optimal products of highest quality. Design standards are to Australian, New Zealand and American standards as well as conformance to line design software most commonly used in Australasia such as PLS Cadd. INGAL EPS only use ASTM A572 GR65 steel for pole shafts which has high yield strength and low silicon content to produce a uniformly hot dip galvanized finish.
As an Australian based company, INGAL EPS is able to offer site assistance and local logistics support backed by applicable insurance certificates, quality system and safety policies.
Paul Sheather - Ingal EPS
wilson transformer company310 Springvale Road (PO Box 5)Glen Waverley VIC 3150C Bob BagnaraM + 61 418 598 887E [email protected] www.wtc.com.au
Wilson Transformer Company exhibited at the EEA Conference and also presented on the first day of the event. Mohinder
Pannu, Strategic Engineering & Project Manager, gave a presentation on the successful testing and in service performance of the saturated core fault current limiters installed in two UK substations.
Established in 1933 with a proud history, Wilson Transformer Company is a leading specialist in the delivery of transformer solutions. We offer our customers the confidence of proven designs coupled with state of the art manufacturing facilities, robust processes and compliance to international standards. Our product range includes:• Power transformers up to ≤ 550MVA, 400kV• Distribution transformers ≤ 5,000kVA• Compact MV substations• Furnace & rectifier transformers• Traction transformers• Special transformers & applications• Monitoring & control solutions

Scott Steele, Tyree Transformers; Richard Kroon & Peter Sommer, Cellpack
Peter Rhodes, High Voltage Solution
Larry Lawson, Safer Power; Anthony Lima, PortaCAT Industries;
Paul Sheather, Ingal EPS
Captain Wendy Lawrence, Retired NASA Astronaut
Tony McGrail, Doble Engineering, USA
Ian Flatley, Groundline Engineering
Michele Woodhouse & Keith Bensley, Pacific Test Equipment;
Tyrone Gautier, APT Publications
Greg Linton, HV Diagnostics; Mark Cozens, Unison Networks Ltd;
Mark Sprawson, EA Technology (at Right)
Tim Densem, Southwest Consulting Group; Allan Bradshaw, Chorus;
John Miles, Align Limited (at Right)
Patrick Pearl, Martin Laird & Rory Solomon, Sicame Australia
Chris Burbridge & colleagues, ABB Limited
Anjali Khire & Ravi Khire, Delstar; Jag Joshi, Machinemonitor NZ
Pictorial Review...
Transmission & Distribution August/September 20156

Maik Ufferhardt & Maryam Khallaghi, Omicron; with Malcom Macaulay, Transpower (centre)
Leonard Ricketts, Wilson Transformer Co
Bill Murray, Ian Charman, Alan luff, RPS Switchgear
Peter Rhodes, High Voltage Solution; Antony Giacomin, TJ/H2b (at Right)
Chris O’Halloran, Tesla Consultants;
Maryam Khallaghi, Omicron
Chris Gordon, Arthur D Riley & Co Ltd (at Right)
Tony McGrail, Doble Engineering, USA
Darren Jenkins, Ausgrid
Dan Condotti & Leam Kearns, Open Systems International;
Leonard Ricketts, Wilson Transformer Co
Jesse Stuart, University of Canterbury; Terry Krieg, Cigre; Trevor Lord, AVO NZ
Conference Floor
Bob Charleston, Pro-Test Instruments Ltd;Len Robson, Doble Engineering
...EEA CONFERENCE | WELLINGTON | 24–26 JUNE 2015
Transmission & Distributionwww.powertrans.com.au 7

T&D
Transmission & Distribution August/September 20158
Each manufacturer presents their factory heat run test data results in a different format, making it difficult to collate and get value from the data. SDG&E has trained a contractor to
do all of the data gathering and had provided them with a template where all data was to be entered per transformer. A decent amount of time went into educating the contractor since test reports vary per manufacturer. Often transformers will not have their thermal tests performed at their full nameplate rating, and in order to provide overload ratings to our operators, additional calculations to predict what these values would have been if tested at 100% of their full nameplate rating were performed. In addition, older test reports do not provide as much information as todays test reports, and therefore various assumptions and default values need to be established.
The program has already assisted SDG&E in evaluating a few transformers that were predicted to be overloaded last summer. The program was ran per transformer at the predicted loads to verify that limits would not be exceeded. This program will not only support SDG&E’s transformer loading operations, but will also be used as a tool for justifying capital deferment in the near future.
tranSForMer PoPUlationS and loSS oF liFeUtilities may have large fleets of power transformers. Many of these transformers are highly loaded or perhaps even overloaded. Furthermore, the age of many units are in excess of original design life and have unclear asset conditions. The end result is possible operational use which brings accelerated ageing and runs transformers much closer to failure. The ability to estimate loss of life for dielectric insulation due to load and associated temperature is the first step to recovery.
Loss of life assumes that the life of a transformer is a well-defined and well understood property of transformers. Sadly, this is not the case. Simple application of a standard such as IEEE C57.91-1995 leads to a 20.6 year expected insulation life for a transformer loaded to rated power. It follows that thermal insulation deterioration will occur. However, many transformers are not fully loaded, and average age at failure is usually in well beyond 20.6 years.
The problem of loading, and expected transformer life, usually arises when a short term load is applied to a transformer – either as a result of system contingencies or planned outages. The condition of the transformer must be considered before overloading and must be continually monitored during overload. Utilities must have the wherewithal to proactively monitor transformers that has been overloaded and ensure they remain ‘Fit for Purpose’.
tranSForMer inSUlation aGeinG‘Normal’ ageing of a transformer would be at the rate of one year per year. That is, the insulation has a predetermined expected life, and after one year of in-service operation, one year of that life has been used up. The idea is that after all the years have been used, the
transformer is no longer fit for purpose. It’s a good approach, but relies on an assumption as to what the expected life of the cellulose is. Accelerating factors increase the rate at which the expected life is used up. Transformer ageing is primarily caused by heat, but is also dependent on both moisture and oxygen. The contribution to overall ageing of each factor is a function of temperature. The three effects are:• Pyrolisis: direct thermal ageing of cellulose, which increases with
temperature• Oxidation: depending on the level of oxygen dissolved in the oil
up to a factor of 3x ‘normal’• Hydrolysis: related to moisture – up to a factor of ~15x ‘normal’
Figure 1 Effects of Ageing factors at Different Temperatures
Oxygen appears in transformers as a result of free breathing unit operation, or as a byproduct of poor seals in a sealed unit. Moisture appears in oil as a result of ingress at gaskets, seals etc, but is also generated by the deterioration of cellulose within the transformer. The factor for accelerated thermal ageing, FAA, of cellulose is given by:
Where HST=Hot Spot Temperature (°C) (1). Oxygen acceleration factor is given by a value between 1 and 3, depending on the level of oxygen within the unit. Moisture acceleration factors depend on the weight of moisture, as a percent, in dry paper:
Where T is the temperature in °C (2) and the moisture acceleration factor, MAAF, is given by (3)
Power transFormer oPerations and loadingThis paper will discuss aspects of load management calculations, combining factory and condition monitoring data, and will stress the need for sensible application of standards and guides to prevent anomalous results through inappropriate models and algorithms. It also discusses how to maximise transformer operational capabilities by evaluating both the thermal capability and situational condition of substation power transformers.
By Tony McGrail and Ken Elkinson, Doble Engineering, USA and Kristina Lukin and Bill Yturralde, San Diego Gas & Electric, USA
Continued page 104
eea in reView

Get the Power of Knowingwith doblePRIMETM
doblePRIME™
CONDITION MONITORING PLATFORMFOR TRANSFORMERS
Now you can choose the most appropriate and cost-effective level of condition monitoring for an individual transformer or a group of transformers in one location.
doblePRIME is a scalable, on-line monitoring solution that can be as simple and focused as a single DGA device, the doblePRIME Delphi; doblePRIME can also be a robust monitoring platform analyzing oil status, tap changer
condition, and bushing health, while integrating all available types of diagnostic indicators, IEDs, and sensor data.
View all condition data and information on site or remotely, and configure and manage alarms through the doblePRIME interface. With doblePRIME, you have the tools to know what is happening, where it is happening and what to do next. That’s the power of knowing.
Learn more about condition monitoring possibilities with doblePRIME™ www.doble.com/doblePRIME
Integrated On-Line Monitoring & Analysis Backed by Decades of Diagnostic Experience
Len Robson | Regional Sales Manager Australia & New Zealand | Doble Engineering Company +61 427 215 954 | [email protected]

T&D
Transmission & Distribution August/September 201510
data collection and ValidationThere are a number of assumptions within the IEEE C57.91 loading guide which must be addressed to provide useful and meaningful results. In addition, the team extracted real time data from the SDG&E SCADA system to allow for automatic update and what-if analysis under high system stress scenarios. The data is then used to predict how future temperatures may vary from expected values; consequently, situational problems can be identified before they happen.
Data is collected from thermal sensors and on line DGA and moisture sensors across a range of transformers.
Particular transformers may be seen through simple charts linking load, ambient temperature, calculated hot spot and measured hot spot temperatures. The figure shows some key parameters.
Predictive temperature assessment looks at the present thermal condition of the transformer and predicted loading to give a 24 hour cycle of predicted temperatures:
The load cycle is used to predict temperatures. On line monitoring gives historic temperature values under known load and a predicted loss of life for the three combined factors can be identified.
The loading model is validated against actual temperatures and a cumulative loss of life can be calculated. This is most easily performed in a per unit mode and in the figure it can be seen that loss of life is heavily dependent on load and approaches 2 pu at the end of a 24 hour period. This means that in 1 day we have used almost 2 days of insulation expected life.
The authors discovered that the feedback between calculated and measured hot spot temperatures provides the greatest insight-- the IEEE loading guide has good prognostic value but a strict application may be too conservative.
bUbble ForMationThe updated C57.91 from 2011 has a new bubble formation algorithm which is dependent on moisture content of the paper, the gas content of the oil and the pressure at the hot spot within the oil based on atmospheric pressure and local oil depth. Bubble formation is an issue if the temperature of the hot spot exceeds that at which bubble formation is likely to occur (2).
Predicting the hot spot temperature, and knowing the local atmospheric pressure and the dissolved gas content, a bubble formation temperature may be calculated. Loading may then be managed to reduce risk of bubble formation.
PredictinG PerForManceEach utility or operator has its own guidelines and standards for transformer operational limits: hot spot temperature, top oil temperature, loss of life per 24 hours. By using ‘what if’ analyses on transformers, based on latest loading, condition and temperature information, analyses can be run to determine where optimal loading lies. The approach is to look at a range of load values, in per unit, and predict the resulting temperatures and ageing factors.
Where a particular limit is exceeded, the data is colored red; where we are approaching the limit, data is colored yellow. This gives a broad indication of how much load can be added to a transformer under spike or increased ambient temperature conditions. (see table below)
diScUSSionApplication of available standards and condition monitoring systems has allowed for better predictive analysis and asset management of a fleet of power transformers. By using known conditions and algorithms for analysis of ageing factors, transformers may be loaded closer to limiting values and life management of the units improved.
Figure 4 Limiting Factors for Transformer Loading
Figure 3 Predicted Loss of Life and Thermal Condition
Figure 2 Key Temperature Parameters and Load Recorded for a Daily Cycle
Continued from page 8
eea in reView

Magazine issues per year
(Price per year)australia
(Price per year)international
Transmission & Distribution 6 Issues AUD $67.50 AUD $112.50
Energy Generation 4 Issues AUD $57.00 AUD $107.00
Industrial Electrix 4 Issues AUD $57.00 AUD $107.00
Prices quoted are ex GST. 10% GST applies to Australia-only readers in addition to subscription costs.
Subscriptions commence the first issue after receipt of payment and registration.
ThESE MAGAzINES ARE ALSO AvAILAbLE IN ELECTRONIC FORMAT AT NO ChARGE.NEW e-REAdERS, pLEASE REGISTER ON-LINE AT WWW.pOWERTRANS.COM.AU
reaDer subscripTions...
to receiVe a PerSonallY addreSSed Hard coPY,SUbScribe online at www.powertrans.com.au or PHone 61 7 3374 2877
SubScribe now to receive 3 yearS for the price of 2!!!that’S 18 iSSueS of t&D for $135 or 12 iSSueS of ie / eG for $114 Get in quick for laSt chance offer - promo valiD until 25 September 2015
offer exTenDeD

T&D
Transmission & Distribution August/September 201512
The Seismic Pole Tester incorporates recent advances in portable hardware and faster processing power to utilise sound mechanical impedance metrics identifying poles
requiring further inspection.In addition, the paper offers an interesting insight into the
development and industry acceptance of a new testing methodology that now provides an innovative solution to the evaluation of timber pole integrity through a whole of pole approach to identify poles needing further attention.
external FactorSDuring the poles life, external factors such as rot, decay, collisions with vehicles, fungal attack, and in some countries woodpeckers, termites will accelerate the degradation process. Indeed prior to standing, the pole will have been felled unceremoniously onto the forest floor and may have been even dropped onto trucks, ships and offloaded without due care. Some may even simply be dispatched with insufficient preservative.
In order to prevent such failures occurring, many utilities employ various inspection programs which sees poles inspected;• Visually• Sounding• Mechanically Testing• Dig and DrillSome utilities at the same time as inspecting the poles install pole saver rods or bandages to keep rot or termites at bay, at or around the critical ground line area of the pole. This ground line area experiences the highest mechanical load and is an area under constant attack from rot, fungal attack and in many cases suffers the indignity of being drilled by well-intentioned inspectors.
In addition to the natural loading of poles by climatic or seismic events, poles can be climbed by Linesman thus introducing further mechanical loading and hence occupational health and safety risks that must be addressed.
tHe elePHant in tHe rooMSuch inspections whilst purporting to be arbitrators of a sound pole lack repeatability and reliability. Worse of all methods in this regard are Visual and Sounding.
Employing “band aid” pole splints as a permanent fix does not address the very nature of degradation and simply does not afford the protection sort.
Furthermore, invasive inspections such as drilling, damage the pole whilst providing limited information outside of an area of timber which is protected by pole saver rods and bandages in many cases.
iMProVeMent in tecHnoloGYThe author worked on non-destructive testing of concrete piles in the late 80’s testing piles with rudimentary test equipment which filled a van at the time. Improvements in technology provided an opportunity to develop a similar tool which could offer a new non-destructive testing methodology offering the following benefits;• OHS improvement – Only dig what needs to be dug. Reduces
back breaking work• Improved inspection times. Targeted approach seeing more
emphasis on problems and issues rather than “going through the motions”.
• Improved Auditability• Repeatable and Reproducible – Even between operators and
years.• Improved speed and retention of Data.• Cost Effective – Rapid and fast. More poles can be inspected
per day.
tHor MetHodoloGYExtensive amount of time and effort has been invested in the development of THOR unit over the past years. Additional research study and field trials of the Beta version of THOR on timber poles resulted in the robust and advanced THOR unit. Figure 2 shows the predecessors of the latest THOR units.
seismic testing oF timBer Power Poles
With over five million timber power poles sitting in the public domain across Australia and New Zealand, this paper provides a background to the many problems faced by many utilities as they maintain aging poles under constant degradation modes including rot, decay and termites.
By Ian Flatley, Groundline EngineeringCo Author: Baraneedaran Sriskantharajah, Groundline Engineering / Swinburne University
Figure 1 Various types of pole defects and damages
Figure 2 Older versions of THOR unit
eea in reView
Continued page 164

www.powertrans.com.au
The following quick questions and answers will hopefully help clarify the situation for our readers:
MATS is the US EPA’s legislation which aims to reduce several pollutants simultaneously from coal-fired power plants. The rule sets new emission limits for particulate, sulphates and nitrates (as acid emissions) and mercury. It is the mercury limit which has turned out to be most challenging. And the most expensive.
MercUrY control exPenSiVe in tHe US?It is important that we stress the uniqueness of the US situation. Many nations, (eg EU member states, Japan, Korea and now China) have achieved or are achieving significant mercury control through “co-benefit effects”. That is – their mercury emissions have been reduced due to controls placed on other pollutants (SO2, NOx and particulates). For example, the EU has achieved over 70% mercury emission reduction from the coal sector since the 1980s without any mercury specific controls whatsoever. This is currently working in a similar manner in China - China has an emission limit for mercury which is not challenging at all, but the requirement for flue gas control for acid gases has resulted in significant mercury control as a co-benefit. Recent data suggest that mercury emissions from the Chinese coal sector peaked in 2014.
The US took a different route on emissions control during the 1970-2000s. Whilst the EU effectively required installation of particulate and acid gas controls on ALL plants, the US chose emissions trading – some plants would fit controls, some would use lower sulphur fuels and some would buy emission allowances and continue to release sulphur. This meant that many plants did not fit controls and, as a consequence, the co-benefit effects were significantly lower in the US than elsewhere. And so, as MATS arrived with tighter emission limits on acid gases AND mercury, all of a sudden, some plants found that they could no longer trade their way into compliance and would have to install very expensive.
KeeP endinG UP in coUrt?Many US states and individual industry and utility companies argue that the cost of compliance with MATS is too high. The current text has no reference to cost implications – no “where reasonably affordable” escape route. All plants MUST comply with the stringent legislation regardless of how much it may cost. And the legislation IS stringent – all plants must reduce their
mercurY and air toXics standard
(mats)MATS, the legislation that has been bounced back and forth between the US Environmental Protection Agency (EPA) and the law courts for several years, has been hit out of bounds again. Whilst far from dead in the water, MATS will require some re-writing before it takes its final and permanent form.
By Dr Lesley Sloss, IEA Clean Coal Centre
Continued over 4

T&D
Transmission & Distribution August/September 201514
mercury emissions to match those of the cleanest 12% of plants in the country. This does cause significant problems for some plants. Mercury is a complex beast – it is easily controlled in some plants and a significant challenge in others. So whilst some plants can comply by spending a little, others are facing closure as the cost of retrofitting control technologies is too high.
Justice Antonin Scalia at the Supreme Court ruling is quoted as saying that “it is not rational, never mind “appropriate”, to impose billions of dollars of economic costs in return for a few dollars in health or environmental benefits”. The cost of compliance with MATS has been estimated at $9.6 billion/y but the EPA estimate the health benefits to be somewhere between $37 billion and $90 billion annually. Since these benefits are calculated based on increased life expectancies and reduced health effects, the values are open to, and the subject of, much debate.
lateSt coUrt rUlinGThe Supreme Court ruled on June 29 2015 against MATS in its current format. Once again, the US EPA will have to go back and re-draft the text. This time they will have to build in some sort of cost-effectiveness calculation which could exclude some plants from complying if compliance will mean either plant closure (and the associated loss of jobs) or will mean that the plant cannot operate without external funding (which is not commonly available in the US). However, in the meantime, MATS appears to remain on the books - since the rule itself still applies (that is, the aim to limit emissions), the limits will still apply and most utilities will still be expected to move towards compliance.
wHat doeS tHiS Mean For US UtilitieS?Apparently over 70% of US coal plants have already gone ahead with their compliance options and billions have been invested in new technology installations. A recent report by the IEA Clean Coal Centre (Sloss, 2015, The emerging market for mercury control, http://bookshop.iea-coal.org.uk/reports/ccc-245/83540) reviews which technologies have been applied at US plants. However, many of the remaining plants have approved delays, which may give them a window of opportunity to reconsider their compliance options.
riPPle eFFectS in tHe international coMMUnitYThis is a blow to the Obama administration in its final term. Significant work has come out of this administration in terms of legislation and policy towards cleaner air. And much has met
with counter-legislation. This blow to MATS will not help the US position as they move into international discussions on global emissions policy.
The Minamata Convention on mercury has not yet been ratified but may well move into action within the next 2-3 years. The convention is already working to define BAT/BEP (best available technology/best environmental practice) for new plants and some existing plants (depending on individual national action plans). The current BAT/BEP guidance includes some information on costs but warns that it is neither simple nor wise to predict costs when equipment, labour and other regional factors can significantly affect costs on a case by case basis. Further, unlike MATS, the current text of the convention does include the term “where economically feasible”, thus reducing the pressure on those signatory countries who wish to comply with the convention without significant strain on their national economy.
For developing regions and emerging economies, signing and ratification of the Minamata convention is a major commitment and many are hesitant to move forward until they understand the cost implications. For this they look to the international community to learn from those who have already committed to mercury reduction. On one hand they will see countries such as those in the EU who appear to be in compliance at minimal cost whilst on the other hand the USA is spending billions. Obviously, the EU route is more re-assuring. The current MATS situation may, unfortunately, be perpetuating the myth that mercury control is expensive.
SUMMarYThe UNEP (United Nations Environment Programme) Coal Partnership, led by the CCC, is currently trying to provide information to emerging countries and others who are hesitant to commit to Minamata. We wish to reassure them that their commitment is likely to follow the path of the EU, through cost-effective co-benefits, or even along the path of Canada, through a combination of fuel switching, energy switching, co-benefit and specific controls.
The situation in the US is unique – the limit is extremely tight and, since it applies to several pollutants simultaneously, can mean that some plants require a combination of control technologies.
New signatories to the Minamata Convention should understand that the convention is far more flexible in terms of emission reductions and that the cost of compliance is very much taken into account. GEF (Global Environment Facility) funding is available to help at all stages of ratification and compliance for those countries who need it.
Continued from page 13
eea in reView

Transmission & Distributionwww.powertrans.com.au 15
BatterY Powered 200a micro-ohmmeter
Measuring the resistance of breaker and switch contacts, busbar and cable joints and earthing bonds requires the test current to approximate the rated operating current of the device. Mains powered high current micro-ohmmeters have been around for many years, but with advances in technology, light weight battery powered high current hand-held micro-ohmmeters are now available.
The new DV-Power 200 Amp Miro-ohmmeter offers hand-held convenience, superior accuracy and resolution, huge memory, Lithium-Ion battery power and a 3-year warranty.
The new DV-Power RMO200H weighs under 1kg and measures resistance from 0.1µΩ to 1Ω with an accuracy of 0.2%, significantly outperforming its nearest rival!
li-ion batterY PowerThe RMO200H is powered by two Lithium-Ion battery packs which sets it apart from the competition that still rely on nickel metal-hydride batteries. The Li-Ion batteries charge an ultra-capacitor and provide up to 220 Amps of ripple free DC current. With the ultra-capacitor fully charged approximately 65 consecutive measurements can be made with no recovery time required between measurements. When the voltage from the ultra-capacitor becomes insufficient, it is automatically re-charged from the Li-Ion batteries. If required, the user can initiate re-charging of the ultra-capacitor at any time.
To maximise battery life the test duration can be user defined at 0.1, 0.6 and 3 seconds. Approximately 1,200 0.1 sec tests can be performed before the batteries require recharging. When fully discharged the Li-Ion batteries will recharge in 6 hours compared to overnight with Ni-Mh.
re-cHarGe at anY tiMeUsage patterns can vary greatly and being able to recharge a partly drained Li-Ion battery prior to the next series of tests without reducing the life of the battery gives the DV-Power instrument a major advantage over Ni-Mh powered instruments. The same should not be done with Ni-Mh batteries which will last longer if not recharged before fully discharged. Unlike Ni-Mh batteries which will slowly discharge even when not used, Li-Ion batteries will maintain their charge during months of inactivity.
larGe MeMorY caPacitYThe SD memory card stores 1000 measurements which can be accessed by the included DV-Win software communicating either by Bluetooth or USB interfaces. DV-Win includes free upgrades for the life of the instrument.
Set PaSS/Fail liMitThe user can set a maximum resistance threshold and the RMO200H will alert the user if the limit is exceeded. This is very useful when making a large number of repetitive tests.
botH SideS GroUnded MeaSUreMentHigh voltage equipment such as circuit breakers are frequently earthed on both sides for safety reasons when taken out of service for testing. Although the grounding of either side effectively places a short across the breaker contacts, the RMO200H incorporates a “Both Sides Grounded” capability to measure contact resistance under these conditions.
Pacific Test Equipment Pty Ltd
Sydney Melbourne or your State Distributort +61 2 9659 2300 • f +61 2 9659 2311
For more information, please contact
T&D

T&D
Transmission & Distribution August/September 201516
During testing of a timber pole with a THOR unit, a number of mechanical impedance parameters are obtained which provide various indices of health. The primary purpose of the THOR testing technique is primarily to seek “outliers” or poles of interest where results obtained and analysed that are outside of the norm.
At present results obtained are assessed in real time using quantitative assessments, with further qualitative assessment available.
Qualitative assessment includes a review of the pole hammer input trace and its velocity (output) response in the time domain. Such assessment is the detailed subject of a thesis undertaken by Baraneedaran Sriskantharajah (Bara) and we refer the reader to this thesis which is currently in review by peers for the requirement of the degree of Doctor of Philosophy.
Quantitative Assessment of the pole is undertaken using parameters directly obtained from the THOR unit, and once real Engineering Units are applied, then mechanical impedance parameters such as hammer force input, duration, mobility and dynamic stiffness can be compared against similar pole populations to identify poles requiring further attention or identifying that poles are indeed healthy and sit within a normal admittance range. Poles tested to date have allowed for the building of a large database of poles and the establishment of health indices for the various parameters in determining if the pole is an “outlier” or outside of the norm.
inStrUMental HaMMer The THOR testing methodology is based on generating a pulse that creates a stress wave which travels along the timber utility pole whilst measuring the reflected stress wave. The stress wave is generated by an instrumental hammer.
The stress wave response due to the impulse is measured with a geophone. It is essential to have a minimum impulse force of at least 2500N into a timber utility pole. A proper impulse is critical to get a meaningful stress wave propagation velocity trace which is the signature of the timber utility pole. When sufficient energy is transferred into the timber utility pole, the stress wave propagation travels along the full length of the pole against the attenuation of energy.
Further, the instrumented hammer measures the applied impulse force and duration. Combination of these parameters effectively produces a hardness test of the material with the result restricted to the location of impulse applied; “A high impulse force within a short duration indicates very high hardness of the pole while a low impulse force over a long duration indicates a soft surface.” Figure 3 shows a typical example of the above two conditions.
There should be sufficient impulse force to get the transverse directional Stress Wave Propagation (SWP) to travel through the full length of the pole. The material damping will attenuate the SWP amplitude, hence, if the impulse energy generated into the system is insufficient, the returning stress waves are more likely to be damped. This will result with further analysis for establishment of SWP velocity, above ground, below ground lengths, defects and location to be skewed or impossible. Therefore, it is very important to monitor the impulse force and duration during the inspection. When the applied impulse is insufficient or improper, the acquired results should be discarded and the inspection should be repeated.
The accepted applied impulse force over duration is empirically derived by analysing the inspected timber poles and benchmarked with advanced modelling timber pole for stress wave propagation using ANSYS Finite Element package. It is graphically shown in Figure 4.
MobilitYThe Mobility provides a normalised value of motion versus input force at various frequencies and is the inverse of the stiffness of the pole. ie;
• Low – Normal mobility = Healthy pole• High mobility = Suspect pole.
Mobility is independent of the supporting medium (soil, stays or other attachments) and is an excellent identifier of poles requiring further investigation.
This Mobility is given by M = 1 / (ρ.C.A)
Where;
• p = density of shaft material• C = Velocity of wave propagation in the Pole• A= Cross Sectional Area of the Pole
A reduction in any of the pole properties above will result in a higher (in many cases significantly) than a similar “healthy pole”.
Measured distances between resonant peaks and their respective maxima and minimums can provide additional information with regard to position and significance of impedance changes. To this end other parameters such a P (max Mobility), Q (min Mobility) and N (sqrt (P/Q^2) are also obtained at the time of analysis.
From the extensive number of poles tested throughout New Zealand and Australia, Groundline Engineering has come up with an initial health assessment of timber poles based on the Mobility of timber poles tested. Figure 5 shows the expected screening of timber poles based on average mobility in traffic light scheme.Figure 3 Different applied force over duration
Figure 4 Applied force vs duration for a collection of timber poles
Continued from page 12
eea in reView

T&D
Transmission & Distributionwww.powertrans.com.au 17
dYnaMic StiFFneSSDynamic stiffness values are obtained from the low end of the mobility trace and provide a value of the pole / soil medium. That is a pole firmly embedded in soft soils will produce a lower Dynamic Stiffness than say an identical pole firmly embedded in stiffer concrete.
At the lower frequencies assessed in the mobility trace, the observed vibration of the pole increases in a relatively linear fashion to the first resonant peak. The slope of this linear change is measured and obtained as dynamic stiffness (looking at the change in observed vibrational response to the force input at various given frequencies).
The Dynamic Stiffness therefore measures the effective resistance to inertial excitation of the pole / soil system as a whole and is
a useful parameter for detecting poles of concern and requiring further analysis. Low Dynamic Stiffness values can be masked by changes in soil or embedment conditions and whilst not as strong an indicator as mobility for detecting poles of concern a low value (regardless of the pole embedment conditions) is therefore worthy of further investigation.
As discussed earlier for the Force-duration and mobility, a screening scheme is set out for the timber poles based on the Dynamic stiffness as shown in Figure 6.
The three parameters described above together with a qualitative assessment of the velocity and force traces provides for a reasonable assessment of the poles health and the presence of any anomalies requiring further investigation.
Figure 5 Screening of poles based on Average MobilityFigure 6 Screening scheme based on Dynamic Stiffness
Continued over 4

T&D
Transmission & Distribution August/September 201518
diStinctiVe SiGnatUre oF tHat ParticUlar tiMber PoleThe results obtained using the SWP technology on a timber poles is repeatable and can be regarded as a distinctive signature of that particular timber pole as shown in Figure 7.
This pole (is in Victoria}, tested in years 2005, 2006 and 2009 and shows the Mobility plots of the pole. This signature confirms the integrity of the pole over the period. The pole is deemed to be changing its properties if the signature alters from the previous inspection. The change in property of the pole can be due to the activity of termites, deterioration, vehicle collision etc. and will be ideal for the network industries maintaining the poles to flag them for further investigation before it is too late.
Field ValidationNumerous field trials have been carried out in five countries at the time of writing this report.
It is outside of the scope of this paper to report on these findings, sufficient to say that THOR technology has been shown to correctly find defective poles and in many cases correctly identified healthy poles that did not need to be replaced.
Too often, and largely as a result of funding, we’d be asked to inspect poles at the end of life – almost to offer a second opinion. Whilst such analysis is worthwhile, particularly if a post mortem of the said poles is carried out, equally worthwhile is the testing of sound poles.
iMPleMentationWith any new technology, it is vital to have good communication of how it works, what it can offer, consistency of data, limitations and how can it be implemented.
To this end a web portal has been developed to assist the end user to manage the collation and use of the field data.
Data is collected rapidly and effectively by the field operator with analysis carried out at the time of test. A simple Red / Amber or Green Flag is shown to the operator and at this time he/she may then decide to carry out further investigations based on the results from THOR and other field data collected separately.
Owing to the large amount of metrics, pole signature and various health scores a system to consistently collate the data was sought. A web portal was subsequently developed, by deploying the program on a web based application which avoided the standard IT department block by not requiring specialised software to be installed locally.
clear MaP and tabUlar ForMat Files are simply zipped up, and uploaded into the portal. The portal does the rest, unencrypts the files, pulls out what it needs, tabulates and geocodes the results before presenting in a clear map and tabular format as shown in Figure 8.
Further work is required, but the portal currently provides a useful niche in presenting clearly and consistently results obtained from the field. The ability exists to raise a query within the web
portal, with a stress wave propagation specialist. Equally important is the ability to quickly analyse and respond to the request. All this is completed without email and totally within the web portal providing consistent data with which to undertake further analysis and reporting.
tHe beneFit oF HindSiGHtNot spend any more of my own money on what is effectively someone else’s problem. Premature or unassisted pole failures are a problem for the utilities that own and manage the assets. Development and commitment of resources with no funding is fraught with risk.
Separate the R&D development from any marketing. Updates and improvements need to be released in a systematic method including validation and testing. It is all too tempting to throw out a minor change untested only to undo previous good work, not to mention create a new headache.
THOR development has enjoyed the benefits of solid lines engineering input including support from asset owners (with respect to access to poles), however nothing can replace the end user experience. Human Element learnings and frustration with respect to implementation could have been avoided through a smaller limited release and allowing for extra time during the release period.
In summary, mistakes have been made along the way but we have learned so much and these have contributed to a much more robust system than would have been achieved using a traditional Gantt / project management path.
conclUSionTHOR would not have been possible without a good solid team. Thanks go to Swinburne University of Technology Melbourne, Baraneedaran Sriskantharajah with respect to his studies and determination, Tony Mitton and the team at Proto Electronics, Dennis Clancy of Citipower / Powercor, Victoria and the Groundline Engineering team for allowing me to champion this project and the provision of time.
At the time of writing, THOR is a fully functioning non-destructive pole tester and methodology.
Ongoing modifications and tweaks will occur for some time, however the theory is sound, the test repeatable and reproducible and is capable of identifying poles of concern rapidly and efficiently.
Figure 7 Mobility plot of a timber pole tested over a period
Figure 8 Screen shot of the THOR web portal
Continued from page 17
eea in reView

We’re passionate about poles! Sure, it’s not something that excites most people, but here at International Utility Poles (IUP) we live and breathe utility poles.
We’re a new name in the industry, but our experience and love of poles ranges from 15 to more than 25 years. Our manufacturing partners, Shanghai Ambor Industries (Ambor), is owned and operated by equally experienced pole-lovers, all with a minimum of 15 years, that includes senior level management, setting up greenfield manufacturing facilities and manufacturing extensively for Western markets.
Now, we might not be able to convince you to love poles as much as we all do, but we’re certain we can convince you of our commitment to our goal; and that is to deliver a great result on your overhead line project by offering the support, technical advice and quality that only people with our love of poles can hope to achieve.
So contact us now and discover how we can help you to deliver a great result for your project or that of your clients. We’d really love to hear from you.
We love poles!
(02) 4627 6500
0488 088 377

T&D
Transmission & Distribution August/September 201520
Conductor permanent elongation is non recoverable or inelastic material plastic deformation that is a logarithmic in behaviour and a function of conductor stress, conductor temperature
and exposure duration. Permanent elongation begins at the instant of applied axial tensile load and continues at a decreasing rate providing tension and temperature remain constant.
In the short term, permanent elongation consists of wire radial and tangential movement during the early loading period and in the longer term, primary metallurgical logarithmic creep. Conductor permanent elongation will result in conductor sag and tension changes with time. These changes are illustrated in figures 1 for typical transmission line.
The best example of permanent elongation, or in metallurgical terms, material creep is lead sheeting on historical churches which slowly “creeps” towards the eaves and requires replacement every few hundred years. Textbook metallurgical creep is described schematically in figure 2. Logarithmic creep, the lower curve, occurs between about 0.3 and 0.4 Tm
1 . For aluminium this is in the range of the design operating temperature for conductors as indicated in table 1. The upper curve describes creep behaviour normally encountered above about 0.4 Tm. The period of secondary creep is significantly greater than the primary and tertiary creep phases. “High temperature” creep may occur at less than 0.4 Tm as the transition to 0.4 Tm is not definitive. The author has not experienced objective evidence that overhead power line conductors have ever experienced tertiary creep.
Conductor permanent elongation expressed as a function of time, temperature, stress and conductor constants is given as
ε = A . t n1 . s n2 . e n3(θ-20)
where t = time in hours s = conductor stress in Pa. θ = conductor temperature in oC A,n = conductor constants
In most cases the conductor exposure period at elevated temperatures is very small relative to an everyday exposure temperature assessed to be 20°C hence the equation may be reduced to
ε = A . t n1 . s n2
Conductor constants are determined by conductor creep tests as described in AS 3822 – 2002.
overhead line conductorsPermanent elongation
Part 2 oF the series
By Gary Brennan, Endeavour Energy, Australia
This article is the second of a series articles about overhead line conductors which will be presented over a number of coming issues of Australian Power T&D. The subject of conductors will cover thermal expansion, modulus of elasticity, fatigue, annealing, tension and sag relations, steady state current ratings, transient current ratings, corona discharge, corrosion and conductor types and selection.
Figure 1 typical changes of tension and sag over time
Figure 2 textbook metallurgical creep
1Tm is melting point in Kelvin
alUMiniUM & alUMiniUM alloY MeltinG teMPeratUreT K 0.4 T K
1350 917 3671120 917 3676201 887 355
table 1 aluminium conductor melting & operating temperatures
condUctor MaxiMUM oPeratinG teMPeratUreST K T °C323 50358 85393 120
oVerHead lineS
Continued page 224

For more information contact IDC Technologies:1300 138 522 • [email protected] • www.idc-online.com
Proudly presented byLearn the latest information fromAustralian industry professionals who will present papers on new technologies, best practice, case studies and practical solutions for your high voltage issues.
7th & 8th October 2015
Mercure Hotel Perth, AUSTRALIA
What you will gain from attending this event:• Update your knowledge on best practice and find practical solutions to your HV design and
installation issues• Hear how to extend the life of your HV equipment through
effective condition monitoring, testing and diagnostic techniques• Discuss compliance to the AS 2067-2008 standard with experienced electrical engineers• Learn about effective substation design• Improve the reliability of your reconditioned electrical equipment• Learn how optimal HV design can improve production and reduce costs• Update your knowledge on best practice and find practical solutions to
your HV maintenance issues• Learn about new industry equipment e.g. transformers, cables, converters, switchgear,
transformers and motors
Proudly Sponsored by:
SPECIAL DISCOUNT - 10% OFF We would like to offer readers of Transmission & Distribution Magazine
a 10% discount off the conference registration fee.Contact IDC Technologies to receive your discount: [email protected].
Register early to avoid disappointment.
REgISTRATIONS NOw OPEN
DESIgN, INSTALLATIONS & MAINTENANCE
HIgH VOLTAgE CONFERENCEHIgH VOLTAgE CONFERENCE
PRE-CONFERENCE wORkSHOPS:
6th October 2015High Voltage Test Applications
Specialist
Doble Engineering Company
KARL HAUbnER
Principal Engineer
Power System Protection
Training
bARRIE MooR Featuring Keynote Speakers:

T&D
Transmission & Distribution August/September 201522
Typical creep test results are illustrated in figure 3 and yield the creep constants A, n1, n2 and n3.
The cumulative conductor permanent elongation is dependent on the aggregation of permanent elongation intervals characterized by differing conductor stresses and temperatures. Graphically, a conductor may be subjected to a number of differing stress levels and temperatures each with a given time interval as illustrated in figure 4. In this example, the initial exposure is at 20% CBL2 and 20°C with a duration, t1 to t2 which will result in creep accumulation of ε2 – ε1 as the conductor behaviour moves from a to b.
From b, the conductor experiences an elevated temperature to move to point c, at say 16% CBL and 85 °C with duration, t3 to t4 which will result in creep accumulation of ε3 – ε2 as the conductor behaviour moves from c to d. At d, the conductor may return to the original condition and hence the original creep curve and transition to point e, and so on for subsequent loading cycles.
deterMination oF tHe creeP accUMUlationThus, conductor permanent elongation may be determined for the predicted operating duty of the transmission line. Whilst this has been illustrated as a graphical representation of the creep accumulation, the application of the elongation equation knowing the conductor stress history, exposure duration and conductor temperature allows a mathematical determination of the creep accumulation.
Also illustrated in this example is that 1. the creep at a low temperature is much less than that at an
elevated temperature; and2. the creep from one creep curve may be translated to another
creep curve (ie from point b to point c and also from point d to point e).
One of the most important aspects of understanding conductor permanent elongation is determining design allowances for the long term conductor behaviour. The design allowance for conductor elongation is necessary to account for the changes in conductor sag and hence ground clearance over time. Design and or construction allowance generally consists of short term prestressing conductors followed by long term design criteria by either providing a ground clearance margin or over tensioning conductors as part of final sagging.
Many designers have found that a combination of these methods to compensate for conductor permanent elongation yield a practical approach and result in the best overall long term predictability of conductor behaviour.
Firstly, conductor prestressing takes advantage that significant wire radial and tangential movements may be eliminated during the initial installation and loading periods. The fundamental basis of conductor prestressing may be determined by examination of figure 3 and applying the principles of figure 4. The selection of an appropriate prestressing tension is a balance between a practical prestressing duration and a practical prestressing tension. Significant over tensioning with small prestressing durations may result in conductor fatigue and the over stressing of conductor fittings, insulators and support structures. Typical and practical prestressing duration of about 3 hours at about 30% CBL may eliminate approximately 25% of the total predicted permanent elongation.
Final StrinGinG teMPeratUre Temperature allowance is one of the longer term compensation methods. In this method, conductor permanent elongation is equated to an equivalent conductor thermal elongation. A temperature is determined which may be subtracted from the conductor stringing temperature which results in the conductor being finally tensioned at a slightly elevated conductor tension. For example, the final stringing temperature may be 15 °C and 40% of the total permanent elongation compensation is required which may equate to a thermal elongation of 6 °C. Thus, the final sagging temperature would be 15 – 6 = 9 °C.
The selection of a temperature allowance is limited by the allowable conductor fittings, insulators and support structures ratings with appropriate consideration given to the possibility of longer term conductor fatigue. Typical temperature allowances are approximately 40% of the total predicted permanent elongation.
Sag allowance is the final long term and most common compensation method and is already illustrated in figure 1.
Conductor permanent elongation is equated to a change in conductor sag over the design life of the transmission line and a sag allowance is aggregated to the specified ground clearance. For example, the predicted change in sag maybe 0.76 m and the specified ground clearance is 6.7 m. Hence, the design ground clearance would be 6.7 + 0.76 = 7.46 m.
Typical sag allowance ranges between 40% to 100% of the total predicted permanent elongation.
next article in tHiS SerieSThe next article to be published in this series will be on conductor change of state equations which will discuss the time dependent and independent equations and provide the mathematical model to determine changes of conductor tension and sag with time.
References
“Permanent Elongation of Conductors Predictor Equations and Evaluation Methods,” CIGRE Electra 75, pp 63-98, March 1981
“Methodology for Assessment of Serviceability of Aged Transmission Line Conductors” Postgraduate Thesis, Wollongong University, 1989, Brennan, G.F
“The Effect of Prestressing on Inelastic (Creep) Behaviour of Australian Mode Base Overhead Conductor” Postgraduate Thesis Wollongong University, 1993, Drury, M.D
AS/NZS 7000:2010 Overhead line design – detailed procedures, Appendix V, Conductor Permanent Elongation (Creep)
2 calculated breaking load
Figure 3 typical conductor creep test results
Figure 4 typical conductor permanent elongation accumulation
Continued from page 20
oVerHead lineS
T&D
Transmission & Distributionwww.powertrans.com.au 23
Australmold, incorporated in July 1985, is now celebrating 30 years in Australia. As a family company,
founded by Mr. Keith Armstrong (formerly of NHP), the beginnings were humble.
At the age of 65, Mr. Armstrong who was Sales Manager for Medium Voltage products at NHP from 1969-1985, took up the challenge of starting Australmold when NHP decided at the time they would focus efforts on other products. The fledgling business was originally run from home, then near NHP at Richmond, until relocation across town to a very small establishment in North Melbourne, Victoria.
Screened SeParable connectorSThe only product represented was the little known brand Elastimold from the USA, which specialised in technology not yet seen in Australia, “screened separable connectors” in ANSI profile. These safe to touch terminations are used to connect MV cables to the epoxy bushings of equipment such as transformers, switchgear and motors. Most of the power utilities at the time were using MV paper lead cables. The real driver for the successful introduction of screened separable connectors was the upcoming MV XLPE cable.
Within a short period of time, Mr. Armstrong employed his daughter (Mrs. Judy McKelvie) and his son-in-law (Mr. Greg McKelvie) in 1988 to help with the development of the company. Through the technical knowledge of Mr. McKelvie and administrative nous of Mrs. McKelvie, Australmold flourished.
By 1988 Australmold was also distributing the DIN Profile separable connectors manufactured by Euromold in Belgium, (now a Nexans company). The employment of Mr. Ray Pitman in 1989 was also a pivotal moment in Australmold history. His knowledge and industry connections through S.E.C.V. (Victorian Power Utility) were fundamental to Australmold’s success. Initially, Australmold secured orders with power utilities in Victoria, later in Western Australia and South Australia, with other states soon after.
a MaJor GrowtH PHaSeBy 1993 Greg & Judy McKelvie purchased Australmold 100% and took it through a major growth phase.
Since then, Australmold has become synonymous with “screened separable connectors” also known as “elbows” throughout Australia and New Zealand.
Through meticulous selection of quality staff and product representation, Australmold continued to flourish, moving from North Melbourne to a much larger site in Airport West, Melbourne. In Early 2001, the company had 6 staff and had outgrown the Airport West premises and therefore relocated to Tullamarine, Melbourne where it is located today.
Today, Nexans Australmold - a division of Olex Australia Pty Ltd is a manufacturer (Nexans, Euromold & GPH brands) and distributor (Elastimold), of Power Cable Accessories up to 72kV for the Power Transmission and Distribution markets. Olivier Lopez, GM Asia Pacific – based in Melbourne,
heads up this division which now employs fifteen people, with additional sales offices in Perth and Brisbane, as well as representation in New Zealand by distributor Cuthbert Stewart.
SUMMarY Nexans Australmold has continued to introduce innovation and new products, and is a leading supplier to Power Utilities, OEM’s (transformer & switchboard), Contractors, Renewable Energy (wind & solar farms), Rail (rolling stock & infrastructure) and Resources (Oil & Gas) market.
Range of products include separable connectors (elbows), joints, terminations, compression and shear off lugs and links, pre-assembled cable leads, bushings and tooling. Technologies include, EPDM rubber, silicone slipon, heat shrink and cold shrink.
30 Years milestone in australiaIn March 2008, Australmold was acquired by Olex Australia (a Nexans company) and became part of the Nexans Power Accessories Group. A continued commitment to offer a high quality of customer service, local technical support, and local stock with the backup and resources of the global Nexans group, have ensured growth.
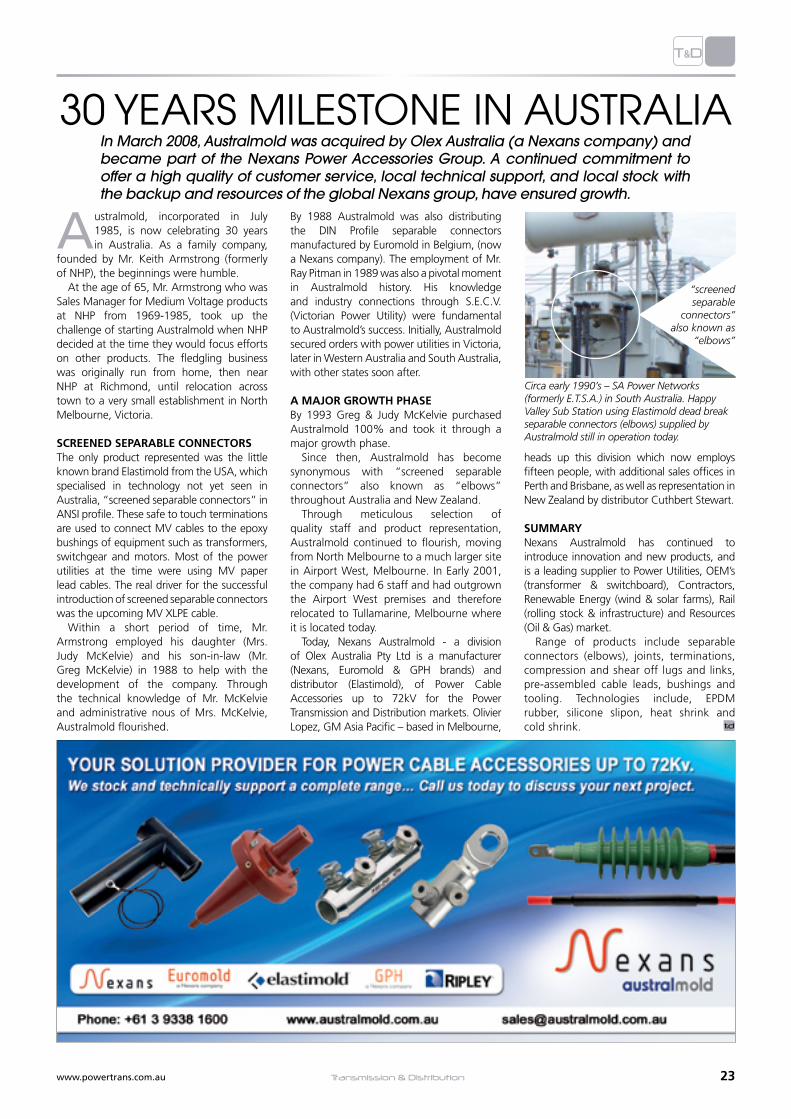
Circa early 1990’s – SA Power Networks (formerly E.T.S.A.) in South Australia. Happy Valley Sub Station using Elastimold dead break separable connectors (elbows) supplied by Australmold still in operation today.
“screened separable
connectors” also known as
“elbows”

Transmission & Distribution August/September 201524
The most commonly used cable fault prelocation techniques depend on pulse reflection. With these
techniques, the fault must have certain characteristics if it is to be detectable and measurable. However, even faults that don’t intrinsically have these characteristics can often be made detectable by burning them to make them permanent, or by applying a short-term high voltage to create a flashover at the fault location.
Prelocation techniques are divided into two groups – those based on pulse-reflection (TDR or Teleflex) technologies, and those that use HV transient methods. This article deals primarily with techniques in the first group.
The basis of all pulse reflection techniques is to inject a measuring pulse at the local end of the cable. This travels to the fault location at a velocity (V), which is a characteristic of the cable. When it reaches the fault, the pulse is reflected back toward the point where it was injected – see Figure 1. The time taken for the pulse to travel to the fault and back to the point of injection is measured and multiplied by the propagation velocity, V/2. The result is the distance to the fault.
Propagation velocity of the pulse (V/2)
1x = t v 2 v 2 = t lg lx = distance to fault | lg = overall cable length | t = travelling time in μs
The measurement accuracy that can be achieved is primarily influenced by external factors – it is affected only slightly by the intrinsic accuracy of the reflectometer.
One of the main external factors that affects measurements is the accuracy of the value used for the propagation velocity V/2, which is influenced by many factors, including: • Characteristic impedance of the cable • Dielectric material (for example, XLPE,
PVC, PILC, insulation colour) • Age of the cable• Temperature• Moisture content (water in the cable
reduces V/2 to around 65 m/µs) • Conductor position within the cable (for
communication cablesComplications can also occur when different types of cable are used in the same cable run. In practice, there are many cases where the factors that influence propagation velocity cannot be evaluated accurately and completely.
reFlection Factor (r) Every change in the uniformity of the cable construction produces a change in the inductance and/or capacitance, and also in the conductivity (G) at the location of the change. As a result, there is a change in impedance (Z) at this location. This impedance change reflects a certain amount of energy from the pulse back toward the transmitter.
In most cases, only part of the energy in the pulse is reflected, with the remaining energy
continuing on to the next impedance change where, once again, all or part of that energy is reflected back toward the source. The measured amplitude of the reflected pulse is determined by the reflection factor (R) and the cable attenuation. In long cables with small cross sections, faults need to be much better defined (with either very low or very high resistance) if they are to be detected.
r = longitudinal resistance l = inductance G = conductivity c = capacitance
No impedance change in cable – no reflection
Large impedance change in cable – large reflection
Short circuit or open circuit – total reflection
Cable faults often have resistances significantly above 2 kΩ and many faults have a resistance that is nearly infinite. Such faults cannot be detected using normal reflection methods. In these cases, fault conversion must be used, where the fault is changed, for a short time at least, into a form that is detectable by the reflectometer.
PUlSe widtH Depending on the cable length (fault distance), pulses of different widths must be used. Narrow pulses are only suitable for short ranges, but they give very high resolution with a lot of detail. On long cables, wide pulses have to be used, but this reduces resolution and potentially increases the dead zone. On most reflectometers, the pulse width is automatically set to suit the measuring range, but provision is usually also made for the setting to be changed manually.
Fault location in Power caBles
Pinpointing – finding the exact location of a cable fault – should always be preceded by the use of an accurate prelocation procedure, so that pinpointing only needs to be performed on a short section of the cable. This saves time, as well as reducing stress on the cable and associated accessories. This article, the third in our series on cable fault location, provides an introduction to prelocation techniques.
By Peter Herpertz, SebaKMT
Figure 1 Reflection at fault (negative) and cable end (positive)Reflection at joint (positive / negative or negative / postitive)
Figure 2 Length measurement at differentpropagation velocities (V/2)
Figure 3 Equivalent circuit of a length of cable
T&D oVerHead lineS
Continued page 264

Portable cable test and fault location system up to 32 kV for medium and low voltage power cables
Safe and fast fault location with latest tdr technology
High surge energy for effective pinpoint locating
Various fault location methods included

T&D
Transmission & Distribution August/September 201526
Typical pulse widths are:
1 ns – 3 μsHigh-resolution reflectometers for communications cables
35 ns – 5 μsReflectometers for general use on power cables
50 ns – 20 μsSpecial reflectometers for long cables (subsea cables and overhead lines)
dead zone in relation to PUlSe widtH
5 ns pulse width – dead zone approximately 2 m
500 ns pulse width– dead zone approximately 90 m
3 μs pulse width– dead zone approximately 400 m
The dead zone is the length of cable covered by the transmitted measuring pulse. Depending on the design of the reflectometer, faults cannot usually be seen in this zone.
However, it’s not true that absolutely no detail can be seen within the dead zone, as changes in the measuring pulse are still detectable. Additionally, with the best reflectometers, the effects of the measuring pulse are suppressed, which means that even within the dead zone, faults can be detected.
Note: NVP = nominal velocity of propagation, expressed as a fraction of the speed of light in a vacuum. Automatic setting of the pulse width ensures that the measurement pulse is always optimally matched to the fault distance. Manual adjustment of the pulse width is also supported in most instruments as, in suitable cases, this allows the operator to reduce the pulse width to reveal more detail.
As shown in the following diagrams, a wide measurement pulse shows all reflections clearly and on a large scale. If higher levels of accuracy are needed the pulse width must be reduced to make small changes and details visible.
Limits set by attenuation mean, that the pulse width cannot be reduced indefinitely, which is why pulse widths below a certain minimum are not supported by reflectometers.
cable attenUation and diSPerSion Both the cross-section and length of the cable have an effect on the amplitude and form of the pulse transmitted into the cable.
Attenuation causes the reflected signal to become smaller with increasing distance, and is shown by the red line in Figure 5. As attenuation follows an exponential law, it can be calculated and corrected. This distance related amplitude correction is shown in Figure 6.
Dispersion is another factor that influences pulse shape. Higher signal frequencies are attenuated more than lower frequencies, which makes pulses that have travelled long distances appear much broader than those that have travelled shorter distances. The combination of attenuation and dispersion means that distant reflections are sometimes difficult to evaluate.
Distance-related amplitude correction allows all events to be displayed at the correct size, irrespective of distance. This makes it much easier to recognise and to evaluate these events and assess their relative size.
coMPenSation and adaPtation Compensation is one of the foundations of reflection measurement methods, and is used to eliminate, or at least greatly reduce, the dead zone effect. Figure 7 shows how this is achieved.
The variable resistance R is compared with the impedance of the cable, and is adjusted until the impulse currents I1 and I2 are as nearly as possible identical, which means that they cancel each other out in the transformer. The reflectometer does not, therefore, see the measurement pulse.
SUMMarYIn practice, R should be set using the reflectometer’s lowest measurement range and should be adjusted until the positive and negative reflections are equal in size and as small as possible in amplitude. Reflected pulses produce current I3 in the transformer, and are completely unaffected by the compensation circuit.
Adaptation means matching one parameter to another, in this case the output impedance of the instrument to the impedance of the cable. In reflectometers, impedance matching is usually done with a transformer, to enable maximum possible transfer of energy for both the transmitted and received pulses.
Figure 4 Reflections with pulse width of 50 nc(Gain = 22dB) and 1μs ) (Gain = 3 dB)
Figure 5 Cable attenuation and dispersion
Figure 6 Distance related amplitude correction
Figure 7 Terminating set, compensation andadaptation in the reflectometer
Continued from page 24
oVerHead lineS

T&D
Transmission & Distributionwww.powertrans.com.au 27
In the Australasian region there are believed to be in excess of 13,000 MV feeders (11-33 kV). They form the backbone of the distribution system in both Australia and New Zealand. The MV
system typically comprises feeders that are long and radial and generally operating semi-automatically with varied levels of SCADA to the distributed reclosers spread through the network.
Typically over 50% of the events on the lines arise from unknown causes with over 75% of faults being transitory. Often faults are not able to be correlated to actual or repeating causes or underpinning specific issues. Maintenance activities are generally reactive and in response to customer outage reports.
Reliability varies greatly over the region and between feeders. It is not uncommon to observe in Australasian distribution companies that issues on MV distribution lines might contribute over 70% of a company’s total SAIDI figures.
In spite of the future regulatory challenges for Distribution Lines Companies, Regulators are expected to place ever more pressure to improve system performance, whilst reducing allowable revenue and placing closer scrutiny on the effective management of OPEX and CAPEX expenditure. As an industry, we need to find smarter ways of operating and maintaining networks, in particular embracing cost effective new technology that can reduce the lifetime costs of ownership and increase reliability.
The implementation of this technology is expected to significantly improve fault detection and location times for work crews working on line faults. The cost of one DFA unit per feeder is comparable to the cost of three to four medium size feeder faults and is therefore highly cost effective in terms of the return on investment for ongoing feeder performance improvement for Distribution Lines Companies.
The DFA concept represents a major new technological step and promises significant business and asset management outcome benefits in network risk reduction and in increased operational effectiveness and efficiency. The implications of the introduction of this technology include some significant improvements to business processes and long-term benefits in terms of safety, risk, operational effectiveness and work productivity.
Technology – An ouTlineDFA is a technology approach to the identification of distribution equipment failure by continuously monitoring current and voltage waveforms under both normal and abnormal operating conditions. DFA uses waveform analysis (referred to as waveform based analytics) and pattern recognition of system events, perturbations and transients in the line current and voltage waveforms to determine precursor indications of hardware failure interferences
with the distribution line from external sources. Some 12 patents apply to these analytical techniques.
The DFA employs sensitive (or ‘high-fidelity’) high speed high resolution front-end circuitry to capture the low-magnitude electrical waveform variations caused by some types of incipient failures at levels not observed by other devices (Figure1), such as relays and meters. A protection operation is not required for the analysis per se as the DFA continuously analyses both normal and abnormal (‘fault’) waveform patterns, assessing the likely issues. It is even capable of recognising if an event is the same as a previous event, a major contribution to identifying and auctioning the repair of repetitive events that might otherwise traditionally be viewed as independent, unrelated matters.Importantly, the DFA does not need to ‘learn’ or be programmed with technical details of the feeder it is connected to, it is able to begin detecting failures and faults on any feeder ‘right out of the box’.
Upon recognising an ‘abnormal’ event, DFA provides information in simple plain English language (Figure 2) and sent to a defined choice of personnel in near real-time via a fully-configurable email or SMS message.
Distribution Fault anticipation Major EnhancEMEnts to MV linEs ManagEMEnt practicEs
In this period of financial and commercial constraint, with the associated pressure to improve distribution line reliability with less available budget and sometimes less workforce numbers, there are very few technical solutions available in the market place today to assist in Distribution line management. Distribution Fault Anticipation (DFA) is new to Australasia but is expected to have a major impact on distribution line management practices. DFA uses continuous wave form analysis to detect the discrete signatures associated with failing line hardware, providing the user with warning that enables remedial action often before the customer has noticed a problem. The product was developed out of industry need and a desire to improve performance and safety and is backed by solid research and extensive field trials in the US. Now available in Australasia, this technology is expected to have a wide application and will assist utilities to improve efficiency and reliability providing better outcomes for customers and shareholders.
By Trevor Lord, LORD Consulting
Figure 1 DFA offers reliable detection thresholds below conventional technology
Figure 2 Reports from the DFA are presented directly in plain English formats
Continued over 4

T&D
Transmission & Distribution August/September 201528
Continued from page 27
Technology originsDFA was developed based on industry need to improve distribution system reliability, initially in the US. Beginning with an Industry desire in the 1970’s to improve the identification and reporting of downed MV lines, the first outcome was a “HiZ” sophisticated high impedance line detection algorithm that has now had extensive field implementations with a commercial USA relay maker. It was soon found that the pattern matching and detection capability of the HiZ concept allowed researchers to observe and characterise other line perturbations that correlated with specific line hardware issues. This led to the fuller development of the ‘DFA’ technology focussing on anticipatory information on developing failures.
The DFA technology itself is based on more than 15 years of research initially via EPRI1 in the US and direct input from the power industry and field trials. Pilot installations have provided hundreds of circuit-years of exposure to distribution line fault data and in that time, an extensive database of experience in distribution faults has been collected. Up to now, truly commercial devices have not existed in the market so all installations have previously used different versions of “rugged research grade” hardware and have been supported in a research demonstration mode. We now are at the point of the first commercial implementation of this technology. The technology has not previously been used commercially in New Zealand until its availability in 2015, now combined in functionality with the HiZ feature and known presently collectively (and more correctly) as ‘DFA/HiZ’ technology.
The important point to note is that these waveform pattern indications are often detectable before the fault can result in disruption to customer supply or damage that may result in arcing, fire start or line hardware damage. Thus an emerging fault may be detected before a consumer notices any problem.
DeploymenT Topology:The DFA technology consists of a single-ended monitoring device assembled as a 2U 19” rack and fitted to standard CTs and VTs at the substation (Figure 3). One DFA unit is required per feeder with each feeder unit operating, assessing, qualifying, and storing data independently. The DFA operates using DC station battery supply (12-48VDC).
The DFA unit does not require connection to the substation SCADA system thus simplifying installation. Each unit is connected via the Internet to a central Master Station to enable longer term data storage, permitting additional analysis and providing the means of communication to users. It is important to note that the measurement, analysis and data storage is done independently at the DFA feeder unit and that the Master Station is, simply-put, the vehicle by which each DFA communicates to the outside world.
Fundamentally, the DFA/HiZ device is an intelligent monitoring device connected to a MV line via substation protection (CT/VT) circuits. The hardware meets the typical Industry expectations for electrical and environmental robustness compliance requirements that are applicable to similarly connected devices.
Whilst most commonly deployed on MV lines (or lines/cable combinations), the technology is equally suited to application on HV Transmission lines. It is also the case that LV cable faults may be observed and reported via the MV observation platform.
cApAbiliTiesIn field trials the DFA device has been able to successfully detect and (in some cases) directly identify and provide warning of problems with:• Switch and Clamp failures• High impedance line drop events• Tree and other vegetation issues such as contact with phase
conductors• Clashing conductors, including fault current induced slap
detection• Arcing and tracking of insulation due to pollution and/or
humidity that may lead to pole-top fires• Tap changers and voltage regulator problems• Surge arrestor failures• Switching issues in reclosers and line switches• Cable and bushing failures (applicable for ABC1)• Overhead conductor failures and downed conductors• Pole top transformer bushing failures• Pad-mount transformer failures• Bus capacitor bushing failures• Capacitor bank problems such as failed cans, controller mal-
operation, blown fuses, switch restrike etc.• Repetitive overcurrent faults from any cause
Figure 4 illustrates something of the wide range of contributions offered by DFA.
conTinuAl evoluTion oF DFA cApAbiliTy:Within the DFA unit a library of pre-determined algorithms is held which enable identification and reporting of the actual likely cause based on the characteristics of the measured waveform.
This library of algorithms is continually growing with further experience from a range of utility and environmental conditions. For example, algorithms to cover animal induced faults and failures of MOV surge arrestors, and vacuum bottle failures are being planned currently as likely next steps in the library of specific detection algorithms with an associated warning alert. Australia has some differences in network topologies from the US and so adaption of some algorithms may be required to allow specific detection of specific configurations such as Single Wire Earth Return (SWER) systems. However, most phenomena, such as failing switches, arcing and overcurrent faults are based on universal principles regardless of the network configuration.
Liaison between clients and the DFA support team is continual once each DFA is deployed.
Figure 3 Typical utility deployment architecture. Each DFA unit connects to available CT and VT.
Figure 4 Illustration of the wide range of contribution of DFA
overheAD lines
T&D
Transmission & Distributionwww.powertrans.com.au 29
Frequently the mutually-analysed outcome of an event informs an enhancement to the DFA’s algorithm library (refer Section 2-4).
It took the collaborative support of the Industry over 15+ years to give the DFA its present capabilities and it will continue to take that support to enhance the capabilities of the DFA into the future.
communicATions inTerFAce & DATA mAnAgemenT:The DFA hardware is connected via an encrypted TCP/IP connection to the Internet and ultimately via an encrypted pathway to a central Master Station for data storage, centralised communication to users, and also remotely-activate updating of firmware when that becomes necessary.
This ability of the system architecture to automatically maintain firmware versions by a remote, secure update concept is a major innovative advantage of the DFA technology, avoiding the need for staff to attend the site for these purposes and ensuring 100% hardware availability.
The Master Station also polls all installed DFA units routinely to ensure firmware currency and continued hardware functionality.
Access to the history of events and to details of a particular disturbance is via an easy-to-use web based interface together with a range of other logged data. Alarms and indications can be easily configured and sent directly as emails or SMS messages in plain English to a range of addressees based on the selected filters.
The DFA/HiZ field unit contains significant internal storage and can operate fully independently for a long period of time, however the storage does have a limit and eventually new data will overwrite old waveform stored data. Archive files are copied to the Master Station for longer-term data storage using automatic synchronisation between the field units and the master station. The period of time that the device stores data, before overwriting occurs, is inversely proportional to the level of activity on the circuit. Under normal operations, the files may remain for more than one month. On a very active circuit, the time period would be shorter, because there will be more anomalies detected and therefore more data recorded each day. All archival storage occurs through the Master Station. The Master Station collates data and makes that data available to users (using defined rules) through user login and via SMS/email, providing communication and messages from the remote field DFA/HiZ units that are otherwise fully independent devices.
Downloaded data can be interfaced to SCADA databases as required but the system is not generally connected to the SCADA system due to speed and volume of data required to be transferred and other operational reasons.
beneFiTs From DFA DeploymenTNew to New Zealand, the adoption of DFA presents an opportunity to progress from the reactive corrective maintenance practices that have been traditionally employed to enable preventative maintenance on MV lines to avoid unplanned outages.
Providing the unique ability to anticipate many faults before they have an impact on customers and feeder reliability, DFA/HiZ offers the following advantages and benefits:• Improved safety for staff and the public.• Improved efficiency (reduced cost) of field line repairs
(reduced OPEX).• Faster response to line faults by field crew (increased network
availability).• Network risk reduction – especially bushfire and electrocution risk.• Increased asset life and improved asset management decision-
making (more targeted and effective Capex investment).• Improved quality of supply.• Improved customer satisfaction.• Improved senior management regulatory reporting ability.• Demonstrable evidence of appropriate, measured and targeted
investment based on pin-point determination of asset fitness within the asset lifecycle curve.
Implementation of DFA/HiZ provides a range of other accessible logged data and information plus many of the features of a digital fault recorder providing additional functionality and capability to analyse customer complaints and distribution feeder performance.
bAcKgrounD observATionsThe fundamental role of a Distribution Lines Company is to provide a safe and reliable supply of electricity to the high voltage and low voltage consumers within its geographic coverage region. Under legislation, the design, construction, operation and management of Electricity Distribution Systems are required to comply with the specific requirements of the Electricity (Safety) Regulations 2004.
Distribution networks are generally extensive and complex in physical and electrical topology providing the connection of the less diverse transmission system to consumer houses, offices factories and buildings, wherever these are situated geographically.
Continued over 4
T&D
Transmission & Distribution August/September 201530
Ultimately, the distribution network provides the final connection from the energy sources to the electricity customer.
Distribution systems are therefore constructed and maintained in a variety of geographically and environmentally diverse conditions, presenting a challenge to ensure the ongoing safety and security of power supply.
The introduction of micro generation, such as solar photovoltaic (PV), micro wind and micro hydro technology by low voltage customers means that utilities must increasingly facilitate the integration of small-scale generation into the network. This role is expected to increase in the future as customers adopt a wider range of distributed energy resources (e.g. battery storage and electric vehicles) in coming years.Central to ongoing reliability and availability of distribution networks is the rapid identification, repair and restoration of power system hardware failures that inevitably occur due to aging of the network, premature equipment failures, the interaction of equipment such as lines and other hardware with vegetation and animals and the environment.
This field work process from customer call to repair of a fault involves a range of work flow steps from the customer fault report, the call centre receiving the customer call, field despatch, field supervisors and ultimately field crews who are required to identify and repair faulty or failed equipment to return power to the consumer. This process requires considerable control and is resource hungry.
The longer the crew takes to identify the problem and repair the fault, the longer the customer is out of power and the higher the costs for the utility.
limiTeD opporTuniTy For prevenTATive mAinTenAnce oF neTworKsOne of the characteristics of the historical approach to distribution network fault identification and repair is that it is generally reactionary. A failure of a network component is required, usually indicated by a ‘lights out’ or ‘flickering light’ report from a consumer to initiate repairs. There are very few technology options available (until now) that provide the opportunity for preventative, predictive or condition-based maintenance to allow the remediation of the fault before it actually eventuates.
Automatic protection systems at medium voltage and low voltage are predominantly simplistic (usually fuses or simple overcurrent relays) and are able to detect some failure types after they have occurred. However the nature of the network topology is that there is often no other indication of failure than reports phoned in by customers, characteristically after some equipment failure has occurred. While routine inspections of lines and hardware are important ways to identify early signs of failure, there is strong evidence of a large number of failure types that are not able to be detected by either pre-failure automatic detection or from routine line inspection.
Recently, within Australia, the Bushfire Royal Commission identified a range of issues directly associated with line faults not identified by routine inspection processes2. Subsequent class actions resulted in multi-million dollar settlements that included aspects of line inspection3 highlighting the difficulties faced in identifying emerging faults by routine inspection from the ground.
regulATory conTeXTDistribution Lines Companies are essentially monopoly service providers within their geographical franchise area and as such are subject to regulation designed to ensure appropriate outcomes for customers, the community and investors. This regulation is governed by the Commerce Act and is undertaken by the Commerce Commission. As suppliers of electricity lines services, Distribution Lines Companies (EDB’s) operate in a market where there is little or no competition, and little prospect of future
competition without replication of physical networks or significant legislative change.
In the view of the Commerce Commission, “Price-quality regulation is designed to ensure that EDBs have similar incentives and pressures to suppliers operating in competitive markets to innovate, invest and improve their efficiency. It also aims to limit the ability of suppliers to earn excessive profits, while also ensuring that consumer demands on service quality are met”.
implemenTATion & supporT sTrATegyAs uniquely innovative and well-conceived as the DFA technology and deployment topology is, LORD Consulting was firmly of the view that the scale of the proposed rollout of the technology (of the order of 7000 units in nominally 5-10 years) demanded a more comprehensive implementation strategy.
This was viewed by the consulting team as being the case for two main reasons:• The past approach to the introduction of new technology
to support asset management, including online monitoring equipment has been poor in some cases with vendors providing inadequate levels of support. This has resulted in sub-optimal results for utilities implementing new technology.
• The DFA is expected to be more widely adopted than previous online technologies. Thus, the problems alluded to above would become extreme in the scaling of a ‘conventional’ model and clearly required a ‘new deployment model’ to be applied.
The deployment model proposed, and now implemented in the current rollout is a combination of all the above points, integrated as follows:• The DFA unit is sold at a set price, inclusive of all applications
support (e.g.: specific identification or engineering guidance of an interesting event noted by the DFA) over its lifetime.
• Lifetime support by Power Solutions Inc USA (the makers and IP holders) for algorithm development and ‘as needed’ collaboration on observations by the DFA.
• All firmware updates and software licences• A 3 year warranty• Training and operationalising support• LORD Consulting support on an ‘as needed’ basis to ensure
continued contribution to the MV line asset management outcomes.
conclusionDFA technology has shown itself to be a major advance in the management of MV lines and promises to revolutionise and enhance the present practices in the Australasian region.
The technology has been time-proven in real world field trials. DFA has been conceived to offer simple and low-cost installation, minimal configuration requirements for each site, comprehensive performance from a single-ended operation architecture, negligible false positives, and simple ‘plain English’ interpretation by operations teams to near real-time reports of issues without recourse to complex training or complex waveform analysis.
In Australasia the deployment model is novel and unique for this category of technology, promising long-term and remotely-accessed support and continued evolution and enhancement of the devices via collaborative ‘as required’ interaction between the client and the technology support team.
For more information contact Trevor Lord:[email protected]
1800 128 000 (AUS) or 0274314003 (NZ)
overheAD lines
Continued from page 29

T&D
Transmission & Distributionwww.powertrans.com.au 31
The meters are distributed by Christchurch’s Quasar Systems Ltd, an integrator of advanced energy
and power quality monitoring technology. Sales engineer Tomo Reed says the PM8000 is a sophisticated solution with advantages that include flexibility, size and price.
“One of the meter’s most attractive features is the amount and diversity of power quality information it provides and, crucially, in a format that’s easy to read. Understanding and maintaining power quality helps to avoid downtime and lift productivity. It also helps to extend the life of the electrical infrastructure.”
Compact and easy to install, the meters are typically installed at a point in an electrical network where power quality information is desired, this could be on substation incomers or feeders or at a customer’s main switchboard or on critical loads. Power quality issues that are monitored include harmonics, power factor and sags/swells in the electricity supply.
Armed with the data, says Tomo, “users are more easily able to identify the source of a disruptive event – whether it’s upstream or downstream of the meter. That quickly focuses the corrective strategy.
“Because it logs information over hours, days or months, the meter provides vital data for analysing patterns and trends. Again, this can be enormously helpful for a manufacturing plant. It might, for example, prompt the operators to modify schedules to avoid repetitive power quality issues.”
PM8000 meters interface easily with SCADA, Building Management Systems & Energy Monitoring Systems, allowing users to view the data on different
platforms. It’s equipped with a range of I/O options, says Tomo, and because it has an IP web-based server facility, the data can be viewed remotely.
The meter’s expandable I/O also means it accepts in a range of diverse inputs unrelated to power monitoring. It can, for example, be configured to monitor water supply and usage patterns.
progrAmming“The meters are equipped with ION technology,” says Tomo. “They can be programmed and configured precisely to the requirements of each user. Every plant or building has a different load profile with distinctive power quality issues. Being able to programme alarms and triggers around individual parameters is a significant advantage.”
He points outs that power quality monitoring is becoming an important issue with electricity suppliers and consumers growing increasingly concerned about clean power.
“There’s a greater onus on distribution companies and major users to be more aware of and to tackle issues such as harmonics and power factor. A meter which monitors power quality to an internationally-recognised standard (IEC 61000-4-30 class S, IEC 62586, EN 50160, IEEE 519 is very useful tool.”
cosT-eFFecTive Affordability is one of the PM8000’s key advantages. “We call it an ‘intermediate’ power quality meter because it costs a lot less than many high-end meters, yet provides many of the same functions. For a mid-level meter it’s a remarkable performer.”
pm8000 FeATures • High-accuracy energy metering:
IEC 62053-22 Class 0.2S, IEC 61557-12 PMD-S
• Time synchronisation• Multi-tariff support• WAGES metering support• PQ compliance monitoring:
IEC 61000-4-30 class S, IEC 62586, EN 50160, IEEE 519
• PQ analysis capabilities: Dip & swell detection, waveform capture, disturbance direction detection, trending & forecasting
• Protocols: Modbus, DNP3, IEC 61850• Ports: RS-485, dual-port Ethernet,
Ethernet-to-serial gateway• Colour display• On-board, customisable web pages
pm8000 beneFiTs• Fast access to critical information for
decision making for your electrical network and asset management.
• More detailed PQ compliance reporting, and expert-level power quality and root-cause analytics.
• Power monitoring, logging, and forecasting to help ensure your electrical system stays within safe operating tolerances, avoiding the risk of overloads, unbalances, or high peak demand.
• Ensure energy efficiency and optimised costs by understanding where, when and how energy is being consumed and perform sub-billing or allocate energy costs to encourage energy-efficient behaviour, reduce peak demand and power factor penalties, and support participation in demand response or variable tariff programs.
• Maximise use of capacity by performing detailed load studies, circuit optimisation, and more accurate infrastructure expansion planning.
poWEr Monitoring MEtErSchneider Electric’s new PowerLogic PM8000 is a versatile meter giving users rapid, easy insight into complex power quality issues. It enables operational crews to respond to problems instantaneously – and helps to identify and eliminate the causes.
Quasar Systems | +64 3 343-9150 www.quasar.co.nz | [email protected]
soFTwAre
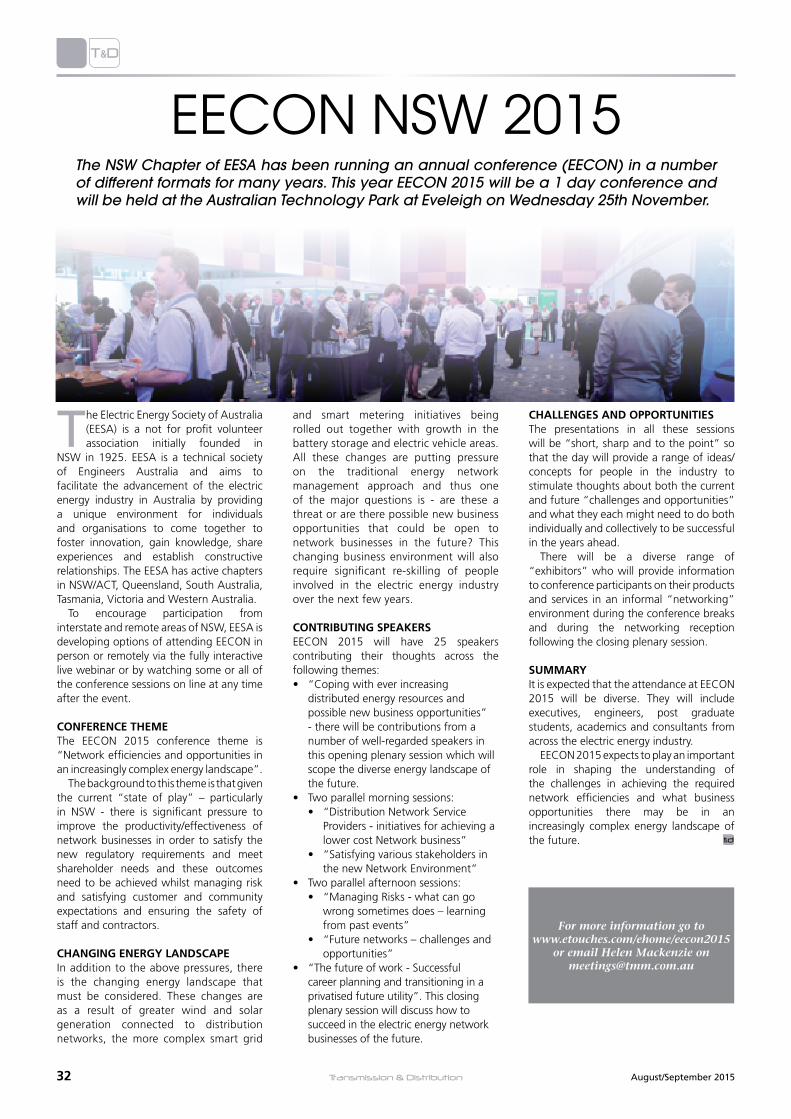
T&D
Transmission & Distribution August/September 201532
The Electric Energy Society of Australia (EESA) is a not for profit volunteer association initially founded in
NSW in 1925. EESA is a technical society of Engineers Australia and aims to facilitate the advancement of the electric energy industry in Australia by providing a unique environment for individuals and organisations to come together to foster innovation, gain knowledge, share experiences and establish constructive relationships. The EESA has active chapters in NSW/ACT, Queensland, South Australia, Tasmania, Victoria and Western Australia.
To encourage participation from interstate and remote areas of NSW, EESA is developing options of attending EECON in person or remotely via the fully interactive live webinar or by watching some or all of the conference sessions on line at any time after the event.
conFerence Theme The EECON 2015 conference theme is “Network efficiencies and opportunities in an increasingly complex energy landscape”.
The background to this theme is that given the current “state of play” – particularly in NSW - there is significant pressure to improve the productivity/effectiveness of network businesses in order to satisfy the new regulatory requirements and meet shareholder needs and these outcomes need to be achieved whilst managing risk and satisfying customer and community expectations and ensuring the safety of staff and contractors.
chAnging energy lAnDscApeIn addition to the above pressures, there is the changing energy landscape that must be considered. These changes are as a result of greater wind and solar generation connected to distribution networks, the more complex smart grid
and smart metering initiatives being rolled out together with growth in the battery storage and electric vehicle areas. All these changes are putting pressure on the traditional energy network management approach and thus one of the major questions is - are these a threat or are there possible new business opportunities that could be open to network businesses in the future? This changing business environment will also require significant re-skilling of people involved in the electric energy industry over the next few years.
conTribuTing speAKersEECON 2015 will have 25 speakers contributing their thoughts across the following themes:• “Coping with ever increasing
distributed energy resources and possible new business opportunities” - there will be contributions from a number of well-regarded speakers in this opening plenary session which will scope the diverse energy landscape of the future.
• Two parallel morning sessions:• “Distribution Network Service
Providers - initiatives for achieving a lower cost Network business”
• “Satisfying various stakeholders in the new Network Environment”
• Two parallel afternoon sessions: • “Managing Risks - what can go
wrong sometimes does – learning from past events”
• “Future networks – challenges and opportunities”
• “The future of work - Successful career planning and transitioning in a privatised future utility”. This closing plenary session will discuss how to succeed in the electric energy network businesses of the future.
chAllenges AnD opporTuniTiesThe presentations in all these sessions will be “short, sharp and to the point” so that the day will provide a range of ideas/concepts for people in the industry to stimulate thoughts about both the current and future “challenges and opportunities” and what they each might need to do both individually and collectively to be successful in the years ahead.
There will be a diverse range of “exhibitors” who will provide information to conference participants on their products and services in an informal “networking” environment during the conference breaks and during the networking reception following the closing plenary session.
summAryIt is expected that the attendance at EECON 2015 will be diverse. They will include executives, engineers, post graduate students, academics and consultants from across the electric energy industry.
EECON 2015 expects to play an important role in shaping the understanding of the challenges in achieving the required network efficiencies and what business opportunities there may be in an increasingly complex energy landscape of the future.
EEcon nsW 2015The NSW Chapter of EESA has been running an annual conference (EECON) in a number of different formats for many years. This year EECON 2015 will be a 1 day conference and will be held at the Australian Technology Park at Eveleigh on Wednesday 25th November.
For more information go to www.etouches.com/ehome/eecon2015
or email Helen Mackenzie on [email protected]

T&D
Transmission & Distributionwww.powertrans.com.au 33
EESA’s Annual Conference and Trade Exhibition will address the challenges involved in improving productivity and effectiveness in network businesses to satisfy the new regulatory requirements.
Network efficiencies and opportunities in an increasingly complex energy landscape
Sponsorship and exhibition opportunitiescall Kirsten Pain on +612 9810 7322 or email [email protected]
A Professional Development Initiative of the Electric Energy Society of Australia
For full details please visit www.etouches.com/ehome/eecon2015
EECONNSW 201525 November 2015, Australian Technology Park, Sydney
EESA NSW Annual Conference and Trade Exhibition has been developed as a one day conference with presentations from over 25 speakers. These presentations will be short, sharp and to the point, providing a range of ideas and concepts for people in the industry to stimulate thoughts about the current and future “challenges and opportunities” and what they might need to do, individually and collectively to be successful in the years ahead.
Key speakers include:
Dr Glenn Platt, Research Director, Energy Flagship, CSIRO
Peter McIntyre, Executive Director and Managing Director, TransGrid
John Hardwick, GM Asset Management, Ausgrid
John Bradley, Chief Executive Officer, Energy Networks Association

T&D
Transmission & Distribution August/September 201534
A Mobile Substation is a complete Substation on wheels. Specifically, the mobile substation will connect up to the incoming lines at a host substation, bypass the host
substation, and connect directly to the customer feeders (outgoing lines), as depicted in Figure 1. In this way, the host substation can be taken completely out of service.
The use of a mobile substation allows for maintenance outages at the host substation to be planned with flexibility and opportunity for efficiency. For example, instead of an annual shutdown, Transpower can move to longer shut downs every four years. It will also enable construction work that has been put off due to lack of outages to be carried out, and this work can be carried out over a longer, safer, timeframe. By enabling the entire host substation to be de-livened, maintenance work can be carried out more safely without having to work near live equipment.
The justification for Transpower’s mobile substation was based around savings in generation costs and the value of lost load for planned maintenance outages. The safety, emergency supply, reduction in customer disruption and flexibility are important benefits over and above the economic benefits.
primAry iTems on A mobile subsTATionThe main primary items on a Mobile Substation are the HV circuit breaker, a step down transformer (otherwise known as a supply transformer), LV (incomer) circuit breaker, feeder circuit breakers, current transformers, voltage transformers and surge arrestors. See Figure 2 for a typical single line diagram.
builD/buy DecisionThe development of Transpower’s first mobile substation was an iterative process, trading off desired features and capacity versus size, weight, cost and technical feasibility. The decision was made early on that this integration process would be better carried out locally to enable closer control and easier input from Transpower, rather than offshore. A close working relationship with suppliers and designers enabled an iterative and collaborative approach rather than attempting to specify all requirements and having the Mobile Substation built offshore.
This collaborative approach enabled more features to be incorporated during the design and construction, helping ensure the end result fully met Transpower’s operational, maintenance and safety requirements.
Further advantages of designing and building the Mobile Substation locally include:
• The equipment on the Mobile Substation is similar to other equipment on the Transpower network, enabling consistent operation and maintenance practices.
• A secure communication system was developed, tested and installed on the Mobile Substation, enabling remote control from Transpower operating centres.
• The contractor that constructed the Mobile Substation is also the maintainer, and is intimately aware of the design and features.
• As Transpower owns the IP, it will be easier and cheaper to build a second Mobile Substation.
DEsign anD DEVElopMEnt oF 110kV MobilE
substationsInstead of purchasing a completed Mobile Substation, Transpower designed and built one from scratch, drawing on local expertise and experience in the New Zealand power industry. The result was a Mobile Substation that can be deployed at 16 small single transformer substations nationwide, is suited to NZ roads, contains multiple safety features and interlocks, and is completely self-contained.
By Graeme Winthrop, Transpower NZ Ltd
Figure 1 Typical Mobile Substation Connection
Figure 2 Single Line Diagram of Typical Mobile Substation Equipment and Connection

T&D
Transmission & Distributionwww.powertrans.com.au 35
mobile subsTATion FeATuresAs mentioned in the previous section, the collaborative development approach enabled additional features to be incorporated that made the Mobile Substation more fit for purpose.Some of the features include:a. The ability to supply at 33kV, 22kV or 11kV, enabling the
mobile substation to operate at all 16 designated sites. b. Associated with this multi-voltage functionality is a system of
interlocks to prevent mobile substation equipment or feeders being livened at an incorrect voltage.
c. The transformer phasing can be reversed to enable the Mobile Substation to be parked under a transmission line in either direction yet able to provide correct phase rotation to the customer.
d. A specialised 110kV CB has bushings that can rotate out so that the phases have correct phase to phase clearance when in service, but rotate together to keep within the allowable width for transport on NZ roads.
e. A hydraulically operated security fence was developed that can swing out when the CB bushings are rotated out, and moves into the vertical position when in transit.
f. An automatic SF6 filling mechanism will fill the 110kV SF6 CB prior to livening, and depressurises the CB prior to transportation. Secure communications was developed and interconnected with the Transpower SCADA system, to enable remote control of the Mobile Substation, and integration into the Transpower grid.
g. Oil interception is provided via a shallow tray on the Mobile substation that pipes directly in to the host substation oil interception facilities.
h. All cables are stored on the Mobile substation on cable reels that are motorised, able to be remotely controlled and also able to be lifted off the Mobile substation and used at ground level.
The mobile substation was built on two trailers in order to incorporate all of the required equipment and features. The heavier trailer (MS1), with the supply transformer, is 76 tonnes and the lighter trailer (MS2), with the 33kV switchgear, is 36 tonnes, not including the tractor units.
connecTion AnD siTe mAKe reADyTo successfully use the Mobile Substation at a site, the site needs to be made ready to receive it. The connections at the site and preparation required are outlined below.a. physical parking and high voltage connections
The MS1 trailer is first parked under the 110kV transmission line that comes into the host substation. When considering the parking location, the ground stability needs to be considered. Another consideration is access to the rest of the site once the Mobile Substation is in place.
b. Feeder connectionsFeeder cables are connected from the MS2 trailer to connection points on the lines company network to enable the Mobile Substation to feed the lines company directly.
c. road AccessAlthough the Mobile Substation is suitable for the New Zealand road system, due to its size and weight, a transportation analysis is still required to ensure that the roads are suitable for such large trailers. Standard switchyard gravel may cause the heavy trailers to get stuck, so mats are carried on the MS2 trailer that can be laid out over the switchyard gravel to enable trailers to drive over the top.
d. isolation pointsOne of the key advantages of using the mobile substation is that the entire host substation can be de-livened for maintenance or construction purposes. To provide this totally de-livened state, there needs to be an isolation point in the 110kV line away from the host substation and also a break in the feeder away from the host substation.
e. oil interceptionThe 110/33-22-11kV 18MVA transformer on the Mobile Substation contains approximately 15,000 litres of mineral oil. For environmental reasons, this must not be allowed to spill out on to the ground or go into the stormwater system. MS2 Trailer with MS1 in the background
Typical isolation point in an incoming 110kV Transmission line
QUT has conducted short course training programs for electricity supply engineers since 1993. Our courses have been specifically designed to provide the skills and knowledge that have been identified in the competency standards for electricity supply engineers for the Australian and New Zealand electricity industry.
Our intensive training modules are particularly valuable in the fast-tracking, re-skilling and up-skilling of personnel in an industry that is undergoing continual change.
The program is presented by experienced senior engineers from industry as well as QUT lecturers, and small class sizes ensure personal attention and positive learning outcomes for all.
The courses are run throughout the year on QUT’s Gardens Point campus (Brisbane), however corporate in-house training is also available.
For more information, visit www.qut.edu.au/study/pestc or search ‘QUT’ ‘PESTC’.
Professional training courses for the electricity supply industry
© QUT 2015 21309 SEF-15-203
Continued over 4

T&D
Transmission & Distribution August/September 201536
To accommodate this situation, a bladder or “onion” is transported with the mobile substation, and is connected to the drain pipes along with an oil/water separator.
f. local service 400v supplyThe Mobile Substation requires both a connection from and a connection to the host substation 400V system. When the Mobile Substation first arrives, it will require a 400V connection from the host substation in order to keep its systems livened and batteries charged.
g. communications and controlThe Mobile Substation connects back to the Transpower operating centres via either cellular or satellite communications. In this way, the Mobile Substation can be remotely controlled much like any other Transpower substation.
h. lightning AssessmentA lighting protection analysis needs to be carried out to ensure that the Mobile Substation equipment be protected from lightning strikes.
i. phasing DiagramIn particular because of the Mobile Substation’s ability to reverse the phase rotation, a phasing diagram is essential to ensure that cables and transformer settings are correct and will result in the correct phasing when the Mobile Substation feeder cables are connected to the lines company network.
j. protection settings The fault levels and downstream arrangements will vary from site to site and this will affect the settings of certain relays on the Mobile Substation. Therefore, a separate protection setting analysis is required for each site.
k. earthingThe trailers need to be earthed and EPR issues need to be assessed to ensure that step and touch potential issues are addressed around the Mobile Substation trailers.
DevelopmenT AnD insTAllATionAs with any project, the Mobile Substation development had its fair share of challenges, and I would like to outline a few of these below:
a. locking Down the Design The Mobile Substation development was like a prototype development, with an iterative approach to design and a relatively long design phase. For example, when the project was initiated,
there was only to be one trailer and no on board communications. However, as the project progressed, it became apparent that two trailers were required to keep within New Zealand road weight limitations. Once installation was underway, the design needed to be locked down to prevent delays caused by further iterative design modifications.b. Transformer FailuresThe specialised transformer was originally to use Ester Oil, a type of bio-degradable oil that would not create an environmental incident should there be a catastrophic leak while the Mobile Substation is in transit. However, the transformer failed its partial discharge test five times, delaying the project, and in the end the decision was made to use standard mineral oil.c. stoke AccessOriginally, the Mobile Substation was to be commissioned at Stoke Substation, with livening off the 110kV tie line within the substation. A Site Make Ready analysis was therefore prepared for Stoke. The installation contractor decided to double check the access feasibility by having MS1 trailer towed up the steep incline to the 110kV structure. It was found that MS1 trailer was too long and not suitable for the incline, with the wheels leaving the ground at the top. d. reduction in security during connectionAt the Murchison deployment we encountered a situation where the connection of the Mobile Substation, and associated de-livening of the host substation, reduced security of supply to other parts of the network. In this case, by creating a break between the Mobile Substation and the host substation, a break was formed in one of the two main circuits supplying the West Coast of the South Island. This situation was resolved by adding a temporary bypass around the Mobile Substation.
commissioning AnD subsequenT useThe Mobile Substation was commissioned at Murchison Substation, with no loss of supply while taking over supply from the host substation. It has since been deployed at five other Transpower sites enabling transformer replacements, protection replacements and other system projects and maintenance to take place that otherwise would not have been economically feasible. For example, transformer replacements requiring four week outages have taken place at two substations. Use of the Mobile Substation meant there was no need for generation or unnecessary additional works to transfer supply to a second bay.
Connection Arrangement of the Mobile Substation at Murchison
Continued from page 35

APT PublicATionsnEW looK...
RRP $25.00
Showcasing high voltage electricity | issue 4 | August-September | 2015
SPOTLIGHT ON AUSTRALIAN MANUFACTURING
Welcome to the new look Transmission & Distribution. With the new look comes a revitalised layout and extended coverage into new markets – markets that look to Australia
for leadership and ground breaking solutions.
In the upcoming issues there will be new layouts and increased input from our readers via our “From the field” segment. This is an area where our readers have the ability to comment and reply to others on various topics chosen by the readers. If you would like to get the ball rolling please feel free to send your comments to me at: [email protected]. There will be very little in the way of editing in this new area, just the way we all like it.
APT Publications has always believed that the information that comes from the field is, in essence, what occurs at the “coal face” and is therefore, the most accurate and correct.
One thing that has not changed is the quality of the articles, which, over the past 18 years, we have become renowned for. Articles written by Engineers for Engineers. Articles that provoke discussion and debate, not those written by journalists with little Electrical Engineering experience. I thank you all for your support over the past 18 years and I am sure the new look meets with your approval. I also look forward to the next 18 years in this exciting, ever evolving industry.
Tyrone GautierManaging Director
exciting new covers will be unveiled for the next issues of ie & eg – stay tuned...

T&D
Transmission & Distribution August/September 201538
TR13
70
Simplify Three-Phase Protection Device Testing
Save with our NEW long term rental rates$
Rent the Megger SVERKER 900 Relay and Substation Test System from TechRentals
Features:3 Stand-alone functionality3 Three current and four voltage sources
3 Secondary and primary testing 3 Generation of 900 V and 105 A in single phase mode
techrentals
For more information, contact us today:1800 632 652 [email protected] www.techrentals.com.au
The DSX-5000 CableAnalyser copper test solution enables testing and certification of twisted pair cabling for up to 10 Gigabit Ethernet deployments, and will certify shielded and
unshielded structured cabling systems from Category 3, to 6A and Class C, to FA at Level V accuracy.
Features high speed testing, including a nine second Category 6 autotest. Built-in Alien Crosstalk testing capability. PLA004 (Cat 6A / Class EA), CHA004 (Cat 6A / Class EA) adapters included.
Features:• ProjX management system for tracking complex jobs• Taptive user interface – simplified testing protocols across
multiple media types• LinkWare management software for test analysis and
professional test reports• Dedicated diagnostics
product link: http://techrentals.com.au/Products_Detail.asp?ID=10071&productcode=FLU,DSX-5000
rEnt thE FlukE DsX-5000 cablEanalysEr
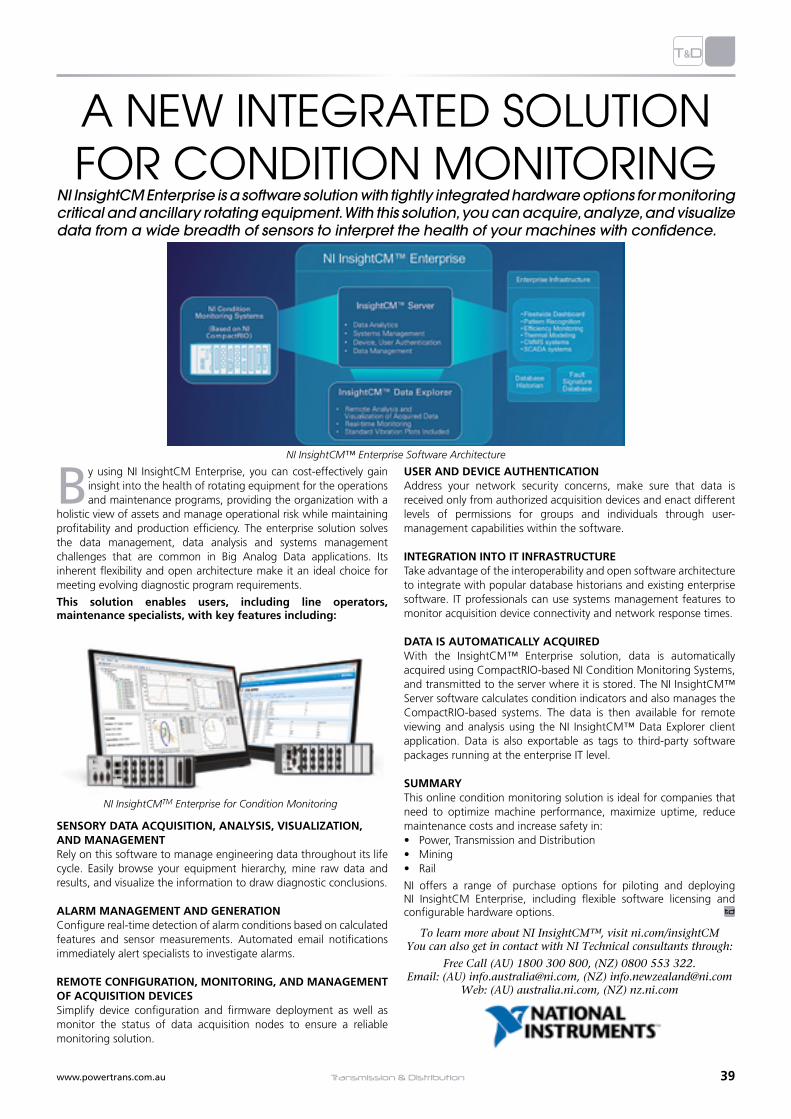
T&D
Transmission & Distributionwww.powertrans.com.au 39
a nEW intEgratED solution For conDition Monitoring
NI InsightCM Enterprise is a software solution with tightly integrated hardware options for monitoring critical and ancillary rotating equipment. With this solution, you can acquire, analyze, and visualize data from a wide breadth of sensors to interpret the health of your machines with confidence.
By using NI InsightCM Enterprise, you can cost-effectively gain insight into the health of rotating equipment for the operations and maintenance programs, providing the organization with a
holistic view of assets and manage operational risk while maintaining profitability and production efficiency. The enterprise solution solves the data management, data analysis and systems management challenges that are common in Big Analog Data applications. Its inherent flexibility and open architecture make it an ideal choice for meeting evolving diagnostic program requirements.
This solution enables users, including line operators, maintenance specialists, with key features including:
sensory DATA AcquisiTion, AnAlysis, visuAlizATion, AnD mAnAgemenTRely on this software to manage engineering data throughout its life cycle. Easily browse your equipment hierarchy, mine raw data and results, and visualize the information to draw diagnostic conclusions.
AlArm mAnAgemenT AnD generATionConfigure real-time detection of alarm conditions based on calculated features and sensor measurements. Automated email notifications immediately alert specialists to investigate alarms.
remoTe conFigurATion, moniToring, AnD mAnAgemenT oF AcquisiTion DevicesSimplify device configuration and firmware deployment as well as monitor the status of data acquisition nodes to ensure a reliable monitoring solution.
user AnD Device AuThenTicATionAddress your network security concerns, make sure that data is received only from authorized acquisition devices and enact different levels of permissions for groups and individuals through user-management capabilities within the software.
inTegrATion inTo iT inFrAsTrucTureTake advantage of the interoperability and open software architecture to integrate with popular database historians and existing enterprise software. IT professionals can use systems management features to monitor acquisition device connectivity and network response times.
DATA is AuTomATicAlly AcquireDWith the InsightCM™ Enterprise solution, data is automatically acquired using CompactRIO-based NI Condition Monitoring Systems, and transmitted to the server where it is stored. The NI InsightCM™ Server software calculates condition indicators and also manages the CompactRIO-based systems. The data is then available for remote viewing and analysis using the NI InsightCM™ Data Explorer client application. Data is also exportable as tags to third-party software packages running at the enterprise IT level.
summAryThis online condition monitoring solution is ideal for companies that need to optimize machine performance, maximize uptime, reduce maintenance costs and increase safety in:• Power, Transmission and Distribution• Mining• Rail
NI offers a range of purchase options for piloting and deploying NI InsightCM Enterprise, including flexible software licensing and configurable hardware options.
To learn more about NI InsightCM™, visit ni.com/insightCM You can also get in contact with NI Technical consultants through:
Free Call (AU) 1800 300 800, (NZ) 0800 553 322. Email: (AU) [email protected], (NZ) [email protected]
Web: (AU) australia.ni.com, (NZ) nz.ni.com
NI InsightCMTM Enterprise for Condition Monitoring
NI InsightCM™ Enterprise Software Architecture

T&D
Transmission & Distribution August/September 201540
Partial discharges are also measured at the bushing measuring taps and in the ultra-high frequency range with an antenna installed within the transformer tank. The advantages provided
by both methods are combined in order to confirm the presence of the partial discharge (PD) activity inside the tank. The system employs advanced techniques of multi-channel and multi-spectral PD sources and noise separation and identification. An acoustic localisation of the PD was also undertaken and the locations are confirmed by the visual inspections. The data enabled appropriate and timely maintenance to be performed in order to prevent the transformer failure.
moniToring oF bushing c AnD DF Traditionally, the sum-of-currents method is used for bushing C and DF insulation measurements. The leakage currents measured at the three bushing taps are added to obtain the imbalance current. The changes of the system voltage phase angle due to the daily load may lead to significant variation of this current and to misinterpretation of C and DF. To increase the sensitivity of the measurements, reference and comparison methods have become more and more popular. Both these methods require a reference signal for DF and C calculation. Depending on the source of the reference signal, relative or absolute measurements can be performed. With relative measurements, the bushing-to-bushing or dual transformer comparison can be performed. For absolute measurements, the reference signal is taken from a group of voltage transformers (VTs) of the substation. The advantages and disadvantages of absolute and relative measurements are summarised in Table 1.
In Figure 1, the comparison of the results of absolute and relative DF measurements on the same distribution transformer are shown. The DF values are more stable with absolute measurements, when the reference signal is taken from VTs of 0.5 accuracy class (Figure 1 – left). By changing the monitoring method to a bushing-to-bushing comparison, a higher scattering of the DF values is recorded (Figure 1 – right). The uncertainties are introduced by the grid unbalances.
On the other hand, if the transformer under monitoring operates in a power plant close to the generator (no grid unbalances), the bushing-to-bushing comparison provides stable results (Figure 2).
In case of the 230/115/45 kV transmission transformer, the utility decided to continuously monitor absolute values of DF and C of its resin bonded paper (RBP) bushings. The reference signal is taken from a group of 0.2 accuracy class VTs located in the substation. This pure resistive signal is compared with the mainly capacitive leakage current measured at the bushing tap in order to derive the dissipation angle and then the DF. The temperature compensation is applied on DF values taking the insulation system of the bushing (resin bonded paper) into account.
The diagnosis of the bushing is performed by analysing the DF trend, its magnitude and rate of change. In general, a continuous operation is not recommended when a predefined level of 1.5% is reached. On the other hand, bushings with DF values above this level but with a quite stable trend may stay in operation. Additional off-line diagnosis is recommended in cases when the DF doubles its value in a short period of time, e.g. in six months.
In Figure 3, the trend diagrams of DF and the ambient humidity at the monitored bushings are shown. Figure 4 shows the comparison of the highest DF monitored value with the pre-set threshold limit and with the values from the off-line measurements performed after taking the transformer out of service for maintenance. The good state of the bushings insulation is confirmed.
prEVEntion oF transForMEr FailurE through
continuous MonitoringThis article describes the actions that were taken to check the condition of the insulation of a 230/115/45 kV transmission transformer in operation since 1967. The installed system described in this article monitors the absolute values of bushing insulation capacitance and dissipation factor, taking the reference signal from a group of voltage transformers located in the same substation.
By L.V. Badicu, OMICRON Energy Solutions GmbH
Figure 1 DF monitoring with absolute and relative measurements performed on a 60 MVA, 154/23 kV distribution transformer.
Figure 2 DF monitoring with relative measurements (bushing-to-bushing comparison method) performed on a 600 MVA, 420/20 kV GSU transformer.
Figure 3 DF trend in 3-phases and trend of ambient humidity (red line)
Continued page 424

My Dad always knows the condition of his bushings and power transformers since he started using his MONTRANO online monitoring system from OMICRON. That's because it alerts him when bad things are happening to insulation, which can a� ect the health of his transformers and eventually cause them to fail.
MONTRANO software lets Dad quickly see the trends anytime and anywhere, using the convenient web interface. The data helps him to decide if maintenance or even replacement is required to prevent costly outages.
Thanks to Dad and his MONTRANO monitoring system, his bushings and transformers are in great shape and they have a longer service life.
stay healthy longerMy Dad's transformers
AustraliaEmail: [email protected]: +61 3 9473 8400
New ZealandEmail: maik.u� [email protected]: +64 27 6642 768Free Call: 0800 6642 766
That's me at work I love you,
Dad
www.omicron.at
OMICRON-Ad_MONTRANO-A4-ENU.indd 1 2015-07-31 10:45:55

T&D
Transmission & Distribution August/September 201542
In Figure 5, the trend of the bushings capacitance together with the trend of ambient humidity are shown. The diagnosis is performed by comparing the capacitance values from continuous monitoring with the values from off-line measurements. The difference gives the capacitance variation ΔC that has to remain within certain limits. The change of bushing capacitance when one capacitive grading layer is short-circuited for bushings of different rated voltage. Taking the 230 kV rated voltage of the bushings of the monitored transformer into account, the presence of about 30 capacitive grading layers can be assumed. The short circuit of a single layer would lead to an increase of the bushing capacitance of about 3.3 %. Such a value can be set up as a threshold limit of the capacitance variation. Figure 6 shows the comparison of the bushing capacitance values coming from continuous monitoring and off-line measurements with the preset threshold limits. It can be noticed, that the values coming from monitoring are very close to those from the off-line measurements. The short circuit of one of the bushing grading layers does not necessarily lead to the immediate failure of the bushing, in case of resin bushings, but it creates a higher electric field on the healthy layers. The accuracy of the applied monitoring system was < ±0.8 pF for capacitance measurement and ±0.01 % for dissipation factor measurement. The errors introduced by the VT class have to be considered.
moniToring oF pDThe PD activity was measured by a conventional detection method at the bushing measuring taps and an unconventional UHF method by placing a sensor inside the transformer tank.
Additionally, an acoustic method was applied for a precise localisation of the PD sources. All these methods have a complementary character. The conventional type measurements indicate the defects in both, bushings and winding insulation. The UHF measurements are only sensitive to detect winding problems.
Type oF meAsuremenTs
ADvAnTAges DisADvAnTAges
Absolute measurements
vT reference method
The only measurements that give absolute values of DF and C.
Grid unbalance does not affect the measurements.
Good accuracy of the measurements requires high class of reference VTs (≤ 0.5) and their location should be at distance within 500 m from the monitored transformer.
More channels in the acquisition unit are required, which can increase the cost of the system.
relative measurements
sum of currents and bushing-to-bushing comparison methods
Environmental factors like e.g.: temperature, humidity, bushings surface contamination have low influence on the monitoring parameters.
System installation is simple.
There is a worldwide experience in application.
Results strongly affected by grid unbalances.
Cannot detect a simultaneous ageing of the monitored bushings.
Dual transformer comparison method
Grid unbalance does not affect the monitoring results and the temperature corrections are not necessary when both transformers are installed on the same bus bars and have similar load.
Lower costs of the system per transformer.
Cannot detect a simultaneous ageing of the compared bushings.
Environmental factors can have influence if the two transformers are far from each other.
Conventional methodThe PD signal is synchronously detected at the measuring tap of each bushing via a special coupling unit. The same unit is used for C and DF monitoring. It includes several levels of redundant over-voltage protections and the measuring tap is automatically grounded when the communication with the acquisition unit is interrupted.
After installation, the PD system is calibrated for different measuring frequencies and bandwidth, so no further calibration is needed even if the frequency of the measurements is changed during monitoring. The three-phase trend of the PD signal acquired is presented in Figure 7.
Figure 4 Comparison of the highest values of DF from monitoring (green bar) with the off-line measured values (blue bar) and with the preset threshold warning limit (red bar)
Figure 5 C trend in 3-phases and trend of ambient humidity (red line)
Figure 6 Comparison of the highest values of C from monitoring (green bar) with the off-line measured values (blue bar) and with the preset threshold limits (red bar)
Figure 7 Three phase PD trend
Continued from page 40

T&D
Transmission & Distributionwww.powertrans.com.au 43
For each point of the trend, phase-resolved PD patterns (PRPDs) and 3 Pulse Amplitude Relation Diagrams (3PARD) are available. This helps to identify PD defect type and gives its rough location. The PRPD patterns are complex with overlapped signals from different PD sources (Figure 8). In order to separate clusters of different PD sources, a synchronous multi-channel PD evaluation technique is applied. The 3PARD diagram visualises the relationship between amplitudes of a single PD pulse in one phase and its crosstalk generated signals in the other two phases. By repetition of this procedure for a large number of PD pulses, PD sources as well as noise appear as a clearly distinguishable concentration of dots in a 3PARD diagram.
By examining individual clusters in the 3PARD diagram, a separation between noise and PD phenomena is possible. The back transformation to PRPD patterns of the clusters 1 and 2 is presented in Figure 8. The pattern of the cluster 1 indicates the presence of PD activity at the phase V of the transformer. The highest amplitude of the signal is detected at the phase V but signal cross talk to the phase U and W is also visible. The PRPD pattern of the cluster 2 appears to be generated by PD activity in the vicinity of the phase W. The other clusters visible in the 3PARD diagram are generated by external interferences.
Unconventional UHF methodThe UHF PD signal was measured in the frequency range from 0.1 to 2 GHz by an antenna type sensor installed inside the transformer tank. In order to gain information about the UHF frequency content of the signal, off-line and on-line frequency sweeps were performed (Figure 9 and 10). In the frequency sweep diagram, two spectra of the signal are shown. The upper spectrum is based on the maximum amplitude of the time domain signal acquired at each value of the frequency during the sweep. The lower spectrum corresponds to the minimum amplitude. PD activity is always visible on the upper spectrum while noise with external interferences, like e.g. corona discharge, radio waves, and GSM, are visible on both spectra. An off-line frequency sweep was performed during the installation of the monitoring system, while the transformer was de-energised. The off-line spectra gives information about the sources of interferences produced by other equipment in the substation. These sources are discarded when the analysis of the on-line detected PD signal is performed. The on-line sweep indicates the PD activity in the frequency range from 450 to 650 MHz. The trend line of the UHF signal and PRPD pattern of the signal (at the central frequency 560 MHz and bandwidth of 70 MHz) has been increasing since May 2014 and is shown in Figure 11.
The pattern, synchronised with the voltage in phase U, is generated by the PD source located around phase V. The PRPD patterns at frequencies above 1 GHz were also investigated and no PD activity was identified.
Three independent observers (sources) of the PD signal are necessary to build a 3PARD diagram, one signal for each axis of the diagram. In Figure 12, such a diagram was built with the UHF signal and with the two signals measured at the bushings of phase V and W. After the cluster separation, the PD activity was confirmed at the phases V and W. The PRPD patterns from the back transformation of clusters surrounded by red rectangles in Figure 12 show the same shape and phase position with those presented in Figure 8. Detecting the PD activity in the UHF range it is an important indication that the PD sources are located inside the transformer tank and not inside the bushings (C and DF results are confirmed).
PD monitoring versus DGA analysisThe increased (by factor of 3) PD signal magnitude over a period of three months is presented in Figure 13. In parallel, regular oil sampling for DGA lab tests was performed. The concentration values of the most relevant fault gases are presented in Table 2.
The increase of hydrogen (H2) and methane (CH4) concentrations confirms the presence of the PD activity, while the increase of the carbon monoxide (CO) concentration indicates the paper deterioration, probably, as an effect of the on-going PD activity.
sAmpling DATe h2 co co2 ch4 c2h2 c2h4 c2h6
01 April 576 557 3821 150 11 116 19
15 April 433 416 3016 115 9 92 15
15 May 966 835 5952 226 21 179 32
12 June 1212 808 5797 225 21 171 30
3-ph
ase
PRPD
pat
tern
s3P
ARD
dia
gram
Figure 8 Separation of PD sources using 3PARD
Figure 9 Off-line frequency sweep
Figure 10 On-line frequency sweep
Figure 11 Trend and PRPD patterns of UHF signal
Table 2 Fault gas concentrations from lab tests
Figure 12 PD sources separation combining the conventional and unconventional method Continued over 4

T&D
Transmission & Distribution August/September 201544
AcousTic locAlisATion oF pD sourcesIn order to obtain a more precise localisation of the PD sources, acoustic PD measurements were performed in July 2014. Figure 14 shows the shape of the acoustic PD signals and final position of the sensors that allowed the calculation of the PD source coordinates. According to the results of the acoustic method, the PD activity takes place at the exit leads of the HV winding of phase V. No PD source could be localised at phase W using the acoustic method.
inTernAl inspecTionIn the next step, the transformer was de-energised and the bushing of phase V was dismantled for an internal investigation (figure 15). PD activity traces around the phases V and W were found using an endoscope. Having the proof of the on-going PD activity, the utility decided to lower the oil level and dismantle all other bushings for a detailed investigation. Off-line C and DF measurements were also performed, confirming the results of the monitoring system. Several carbonisation traces on the surface of the HV exit leads were found at phase V (Figures 16) and phase W (phase 17). Carbonisation traces were identified on the inner layers of the insulation, as well.
conclusionThe following conclusions can be formulated:• A catastrophic failure of the transmission transformer was
prevented through continuous monitoring of bushing C, DF and PD;
• The high accuracy of bushing insulation C and DF measurements was obtained with absolute measurements, taking the reference signal from a group of voltage transformers located in the same substation;
• With the combined application of conventional and UHF PD measurements, the presence of the PD activity was confirmed inside the transformer tank;
• The advanced technique of synchronous multi-channel PD measurements was applied in order to recognise the PD source type as well as to identify and separate noise;
• With acoustic PD measurements, the location of the PD defect was precisely identified leading to a shorter time required for the internal investigation.
For further information:www.omicron.at
Figure 13 Increase of the amplitude of the PD pulses detected at the phases V and W
Figure 14 PD source localisation in the vicinity of the phase V
Figure 15 Preliminary internal inspection for defect location confirmation
Figure 16 Traces of PD activity at the phase V
Figure 17 Traces of PD activity at the phase W
Continued from page 43


T&D
Transmission & Distribution August/September 201546
High partial discharge levels provide an indication that an asset’s insulation may be deteriorating
in a way that could lead to failure. The process of deterioration can propagate and develop, indicated by a trend of increasing partial discharge, until the insulation is unable to withstand the electrical stress, leading to flashover.
The ultimate failure of circuit breakers can be sudden and catastrophic, posing a significant health and safety risk to personnel through arc flash, causing major equipment damage, and with considerable network outages. This is especially the case for circuit breakers located at zone substations, potentially placing the entire substation at risk.
pArTiAl DischArge locATionsPartial discharge testing on LMT switchgear indicated potential issues around the current transformer (CT) chambers on units with resin encapsulated CTs, with some sites generating levels as high as 50dB. While the magnitude of partial discharge was not increasing over time, this steady high level of PD occurring on high priority assets was considered unacceptable and in need of further investigation.
As the project proceeded, further issues were identified with cast epoxy resin risers and synthetic resin bonded paper (SRBP) bushings between the CT compartment and cable box. There are also instances where partial discharge was occurring in heatshrink cable terminations where the cable boxes had been converted from a compound-filled box to an air box, without adequate clearances being maintained between the phases of the termination. In some instances the source of the partial discharge was the circuit breaker truck itself.
When the partial discharge was initially identified, a number of zone substation LMT circuit breakers had cleaning carried out on the affected components with unsuccessful results. The PD levels caused by dirt and surface electrical stresses may have been reduced but the solid insulation PD element was still present. This indicated that component replacement was necessary.
FirsT TriAl oF componenT replAcemenTReyrolle LMT switchgear used a one-piece cast resin CT and primary bar assembly on most equipment from the late 1960s to the 1990s, when they changed to a screened primary bar with slip on CTs. Voids created during the resin moulding process are thought to be the main cause of the discharge on these components.
Five sets of resin encapsulated CTs were replaced in 2012 with mixed results. In several cases the PD was reduced to normal levels, but in others the reduction in PD in the CT compartment revealed PD occurring elsewhere in the cabinet.
Discussion with the switchgear manufacturer and field investigations led Wellington Electricity to suspect that the cast epoxy resin riser and SRBP bushings between the CT chamber and the cable
box were also exhibiting PD. Similarly, PD levels were also high on compound cable boxes that had been converted to an air-box using heatshrink terminations.
seconD TriAl oF componenT replAcemenTIn the later part of 2012 a LMT circuit breaker at Waitangirua zone substation with abnormally high PD values coming from the CT chamber was targeted for additional component replacement. Tan-delta testing confirmed that the insulation around the encapsulated CTs and SRBP bushings was in poor condition.
The project involved replacement of the resin encapsulated CTs, SRBP bushings, and pitchfilled cable termination with retrofit components specifically developed for Wellington Electricity by the switchgear manufacturer. This significantly improved the partial discharge and tan-delta results, given in Figure 1, and confirmed that the retrofit was effective in addressing the risk.
From replaced CTs, visible signs of surface tracking were observed on the monoblock riser, as shown in Figure 3. This indicated that, while the magnitude of partial discharge was not increasing, the potential for failure still existed and the replacement of components was justified.
practical partial DischargE Mitigation on 11kV sWitchgEar
Testing of synthetic resin-bonded-paper (SRBP) bushings found them to have high dielectric loss angles. Wellington Electricity worked with the OEM, RPS Switchgear Limited to develop a retrofit kit which included all the necessary replacement components between the cable termination and the circuit breaker spouts to replace the original components. This modification has been undertaken at a number of sites and has brought the level of partial discharge at these sites to acceptable levels.
By George Alburo and Richard Steer, Wellington Electricity Lines Limited
locATionTAn-DelTA
beFore replAcemenTTAn-DelTA
AFTer replAcemenT
Blue Phase – CT and cable bushing
13.017% 0.612%
Yellow Phase – CT and cable bushing
10.077% 1.034%
Red Phase – CT and cable bushing
13.336% 0.496%
Figure 1 Waitangirua CB3 Tan-Delta Results Before and After Component Replacement
swiTchgeAr

T&D
Transmission & Distributionwww.powertrans.com.au 47
reTroFiT KiTsThis work has led to two retrofit kits being developed for LMT switchgear by RPS Switchgear Limited, each targeting a different compartment. One kit replaces components when PD is present in the CT compartment, shown in green in Figure 4, and replaces the resin CTs and monoblock riser. The second kit targets the cable box, shown in blue in Figure 3, and includes a larger cable box to facilitate the use of heatshrink terminations, and replaces the SRBP bushings by providing dropper extension bars with insulated standoffs. Where PD is present on the circuit breaker truck, this is replaced with a standard retrofit vacuum truck.
correcTive reFurbishmenT progrAmmeSpecific switchgear panels at seven zone substations, as shown in Figure 5, consistently having high PD levels were identified for PD mitigation using the retrofit kits.
To measure the effectiveness of the mitigation measures, transient earth voltage (TEV) and tan-delta measurements were taken before the modifications, and again once the work was complete.
The partial discharge mitigation work is very cost-effective against a replacement of the panels. All circuit breakers in a substation could have retrofit kits installed for approximately 10% of the cost of replacing the switchboard.
Figure 2 Damage on Monoblock Riser due to PD at Waitangirua CB3
Figure 3 Retrofit Kit Compartment Locations for LMT Switchboard
Figure 4 Examples of Installed Retrofit Components
prioriTy rAnKing
zone subsTATion
cT compArTmenT
cAble boX
1 Waitangirua CB2, CB3 CB2, CB3
2 Nairn StreetCB1, CB2, CB11, CB12,
CB13,CB14CB1, CB2, CB11, CB12,
CB13,CB14
3 Titahi Bay CB9 CB9
4 Tawa CB13 CB13
5 Porirua CB1 CB1
6 Moore Street CB8, CB12 CB8, CB12
7 Ngauranga CB2 CB2
Figure 5 Zone Substation CBs Identified with High Partial Discharge Levels
compArTmenTTev beFore miTigATion
Tev AFTer miTigATion
CT Chamber 15 dB 5 dB
SRBP Bushing Area 39 dB 4 dB
11kV Cable Box 36 dB 4 dB
Figure 6 Results of TEV Testing of Moore St CB12, Before and After Mitigation
Figure 7 Results of Tan-Delta Testing of Moore St CB12, Before and After Mitigation
500.0V
1000.0V
1500.0V
2000.0V
2500.0V
3000.0V
3500.0V
4000.0V
4500.0V
5000.0V
5500.0V
6000.0V
Continued over 4

T&D
Transmission & Distribution August/September 201548
resulTs AFTer correcTive reFurbishmenTFrom 2013 to 2014, partial discharge mitigation using the retrofit kits was completed at the seven substations identified. Example partial discharge and tan-delta test results on Moore St CB12 are shown in Figures 6 and 7, demonstrating the effectiveness of the corrective measures.
The success of component replacement was also confirmed in 2014 when the annual partial discharge and ultrasonic testing was undertaken at these substations, showing the PD levels on the identified circuit breaker panels had reduced to normal levels.
implemenTATion AnD chAllengesChallenges have been encountered, particularly as there are minor variations between cable boxes, bushings and monoblock CTs on different LMT models. The presence of RPS Switchgear personnel
during some of the replacement activities has resulted into changes in the design of retrofits, simplifying the process and making the components in universal for all models of LMT.
eXTension To DisTribuTion subsTATionsPartial discharge mitigation at zone substation circuit breakers will continue to take priority, due to the criticality of these sites. However, over 600 panels of LMT switchgear are also located in Wellington Electricity’s distribution substations. Partial discharge is present on a number of these panels, and is being monitored for trends that may indicate a need for component replacement. After the completion of the zone substation PD mitigation, a programme will commence to implement the improvement measures on LMT switchgear at distribution substations, with
priority determined by severity of partial discharge, frequency of personnel access for switching, the number of customers potentially affected.
summAryWellington Electricity has identified issues with high partial discharge levels being generated on LMT switchboards at a number of its zone substations. The sources of the partial discharge have been identified and retrofit components developed by the OEM that have allowed the problem to be addressed through component replacement instead of switchboard or panel replacements. Experience has demonstrated that this is an economical and effective option for partial discharge mitigation on this switchgear, and the project will be extended beyond zone substations to include high priority distribution circuit breakers.
SWITCHED ONHigh Voltage training by knowledgeable engineers with real fi eld experience
Train with the best. MVA Engineering’s High Voltage training is delivered by highly experienced senior engineers with extensive fi eld experience.
Students receive excellent theoretical knowledge combined with practical hands-on training including an on-site switch room. That means better outcomes for your workforce.
The courses offered are: HV Switching Operations HV Switching Refresher HV Switching Awareness Hazardous Area Classifi cation
and Design
For enrolments call 07 3333 2946 or book online www.mvaeng.com.au
MVA
019
MVA Engineering is a Registered Training Organisation.
swiTchgeAr
Continued from page 47

Electrical distribution utilities face considerable risks, as their customers’ expectations of performance and reliability are high. Both utilities and heavy industrial users demand products and service that are delivered at the highest levels.RPS Switchgear’s expertise in design and manufacture of new switchgear, retrofit solutions and safety upgrades certified to IEC/AS 62271 and customised to meet specific needs, has ensured enduring relationships with many of the industries’ largest players.
Raising the standard insubstation safety

+
–
www.cellpack.com
POWER UNDER CONTROL
Cable connecting systems & Accessories Low and Medium Voltage
• Heat shrink technology
• Cast resin technology
• Gel technology
• Connecting technology
• System accessories
Behr Bircher Cellpack BBC Australia Pty Ltd Australia Tel. +61 407 103 621 New Zealand Tel. +64 21 591 960 [email protected]
Campaign 8_2015.indd 1 24.07.2015 09:30:50