speed reduction feasibility study final jh040519
TRANSCRIPT

SPEED REDUCTION
FEASIBILITY STUDY
PREPARED FOR:METRO NASHVILLE PUBLIC WORKS
1101 17TH AVENUE SOUTHNASHVILLE, TENNESSEE 37212
APRIL 2019

Speed Reduction Feasibility Study April 2019
PROJECT# 15-0805
SPEED REDUCTION FEASIBILITY STUDY
NASHVILLE, TENNESSEE
PREPARED FOR:
METRO NASHVILLE PUBLIC WORKS
PREPARED BY:
KCI TECHNOLOGIES, INC.1101 17th Avenue South
Nashville, TN 37212615.370.8410 office 615.370.8455 fax
www.kci.com

Speed Reduction Feasibility Study April 2019
1 PROJECT# 15-0805
EXECUTIVE SUMMARY
In response to Substitute Bill BL2019-1492, this speed limit reduction feasibilitystudy analyzes the reduction of vehicular speed limits (30 mph to 25 mph) on alllocally classified streets. The goal for the speed limit reduction is to increase safetyfor all roadway users – motorized and non-motorized users alike. Animplementation strategy for accomplishing this task is provided along with potentialissues and concerns, as well as possible countermeasures.
The recommended implementation strategy is as follows: Speed limit reduction (30 mph to 25 mph) would apply to all locally
classified streets with the Urban Services District; any exceptions to thiswould be presented to and decided by the Traffic & Parking Commissionfollowing its typical procedures.
A reduction requires all existing 30 mph speed limit sign faces be replaced.Metro Public Works’ speed limit sign inventory (with geocoded locations)will be updated, while also noting existing speed limit pavement markinglocations, using Metro Public Work’s photolog.
Conservatively, the sign face replacement process would occur over thecourse of one (1) year with the project divided into four relatively equalphases. The phases may be generally categorized by council districts. Themost central, urbanized districts will be implemented first, and thenexpanding outward from there. The opinion of probable cost isapproximately $750,000 to $1,000,000.
Countermeasures for addressing potential issues and concerns with thespeed limit reduction are detailed in this report. They fall within threegeneral categories – education, engineering, and enforcement. Theeducation component will likely be the most effective before, during, andimmediately following construction in supporting this broad scale change.Countermeasures should be periodically monitored and evaluated in orderto refine the mix of strategies as to maximize resources and associatedimpacts on safety.
A task force focused on improving roadway safety should be considered toidentify a specific countermeasure strategy tailored to meet Nashville-Davidson County’s dynamic needs. This task force could also provideimportant analyses of, and guidance on, the evolution of this strategy.

Speed Reduction Feasibility Study April 2019
2 PROJECT# 15-0805
1. INTRODUCTION
Substitute Bill BL2019-1492 passed its second reading at the Metropolitan Councilof Nashville’s (“Council”) February 19, 2019 meeting. This bill directs MetroNashville Public Works (“MPW”) to complete an analysis for the reduction ofvehicular speed limits on local streets, per the Major and Collector Street Plan ofNashville and Davidson County recommended in the 2016 WalkNBike StrategicPlan, and to submit a feasibility report with implementation recommendations toCouncil within a 30-day period.
This report seeks to provide general background information on the greaterconversation of speed limit reductions occurring in communities across thecountry, which is often carried out as part of a larger Vision Zero strategy. High-level summaries of both aspirational and peer cities who have carried out speedlimit reductions are provided to build an understanding of the strategies associatedwith achieving safe streets for all users. Potential issues and concerns for a similarreduction effort in Nashville-Davidson County are highlighted, along with a list ofpotential countermeasures that could help to achieve better speed limitcompliance. Finally, a high-level implementation strategy for rolling out anextensive speed limit reduction on locally classified streets is provided.Scheduling, phasing, and an opinion of probable cost are included.

Speed Reduction Feasibility Study April 2019
3 PROJECT# 15-0805
2. STUDY BACKGROUND AND FOUNDATIONThroughout the country there is a paradigm shift currently occurring for one of themost prevalent assets a municipality invests in, its roadways. The transportationnetwork underlies every aspect of a citizens’ life, from their ability to access goodsand services, to their quality-of-life, health, and safety. Historically, ease of mobilityfor vehicles has been the dominant focus and drive of roadway designs, as well asthe structure of a community’s transportation network; however, negative impactson the safety and comfort of pedestrians, bicyclists, and other non-motorized usersof roadways and neighborhood streets, has resulted in a fundamental shift in theapproach to traffic safety.
Vision Zero, an international strategy for eliminating traffic deaths and severeinjuries on roadways, seeks to increase the safety for all roadway users, equally,as opposed to an auto-driven approach. It also deems the preservation of humanbeings’ lives as well as their quality-of-life as community priorities worthy ofinvestments. The strategy employs a “safe systems” approach to transportationplanning, design, and implementation. It assumes drivers will inevitably makemistakes, even when trying to avoid from doing so. Therefore, roadway designsshould reflect this fact with appropriate safety features, such as lower speed limits(which increases driver reaction times, reduces vehicle-stopping distances, andcan increase sight distance), to prevent serious and fatal crashes when thesemistakes do occur. This approach differs from the traditional approach in themanner it identifies the problem, causes, responsible party, planning approach,and ultimate safety goal. The traditional method finds blame in the individual roadusers due to human error when an accident occurs, whereas the Vision Zeroapproach identifies faults in the system design and places a higher priority onfatalities and serious injuries than overall crash frequency. Speed management isa major tenant to Vision Zero’s safe systems approach.
Jurisdictions around the world and even inter-jurisdictional departments haverecognized, adopted, and implemented Vision Zero differently. Metro Public Worksdoes not currently have staffing, programming, or funding specifically designatedas Vision Zero. However, the intent and methods of Vision Zero are strived for inMPW's everyday safety focus, as well as special projects like roundaboutconstruction, neighborhood traffic calming, and this speed limit reduction effort.
The Metropolitan Government of Nashville and Davidson County’s (“Metro”) 2017-2020 Transportation 3-Year Action Plan, Moving the Music City, is a guidingdocument for near-term action regarding increasing the safety of city streets, aswell as increasing the options and viability of non-motorized travel. The Planoutlines dozens of near-term initiatives for achieving a variety of mobility goals,which are all underlined by the City’s first priority, public safety. Vision Zero is oneof the four overarching mobility goals. Nine actions/initiatives for improving safetyon Nashville’s streets are detailed, including creating safer neighborhoods. MPWis tasked with several actions in working towards this goal. This includes theimplementation of Walking District pilots and “adding ‘quick build’ walkways to its

Speed Reduction Feasibility Study April 2019
4 PROJECT# 15-0805
community-driven Traffic Calming Program”, which MPW has accomplished andcontinues to build upon. Additional efforts in working towards safer, moremultimodal streets are highlighted on the following two pages.

Speed Reduction Feasibility Study April 2019
5 PROJECT# 15-0805
HIGHLIGHT: EXAMPLES OF ADDITIONAL RECENT TRAFFIC CALMINGEFFORTS IN NASHVILLE-DAVIDSON COUNTY IN SUPPORT OF CITYMOBILITY GOALS
Achieving slow, safe streets takes strategies from all angles. Discussed in the speedingcountermeasure section, an approach that includes education, engineering, andenforcement is necessary for success. Examples of efforts with Nashville-Davidson Countythat have occurred relatively recently, include:
Metro Neighborhood Traffic Calming Program (MPW)In addition to a walk/bike pathway reappropriated from excess pavement width in SouthNashville, the Metro Neighborhood Traffic Calming Program has successfully implemented,or is currently in the neighborhood action process of constructing, more robust trafficcalming measures, including four neighborhood traffic circles and series of speed cushionson two higher-volume neighborhood streets.
Last month, eight neighborhoods were selected for additional traffic calming analysisfollowing the conclusion of the Program’s first open application submittal period, which willoccur twice a year (in January and July). For the 60+ requesting neighborhoods, theProgram’s new prioritization strategy was used to rank requests based on greatest need.Data points include crash history, vehicle speeds and volumes, availability of non-motorizedinfrastructure, and nearby destinations. Neighborhoods have already begun coordinatingwith MPW staff to set up design meetings with residents.
Implementation of WalkNBike Bikeway Network (MPW, Metro PlanningDepartment)In the past two years, planners and engineers have teamed up to provide a neighborhood-based design approach to the implementation of Nashville-Davidson County’s envisionedbikeway network. Part of bike lanes’ ability to increase roadway safety for all users has to dowith slowing vehicle speeds; therefore, traffic calming elements are important aspects to thesuccess of a bike facility. In 2017, 10
thAvenue South was restriped to utilize excess
pavement width in order to incorporate parking-protected bike lanes on a two-lane roadway.A “floating bus island” was constructed to improve safety for transit users, as well as help tophysically narrow the originally wide roadway.
Speed Reduction Feasibility Study April 2019
6 PROJECT# 15-0805
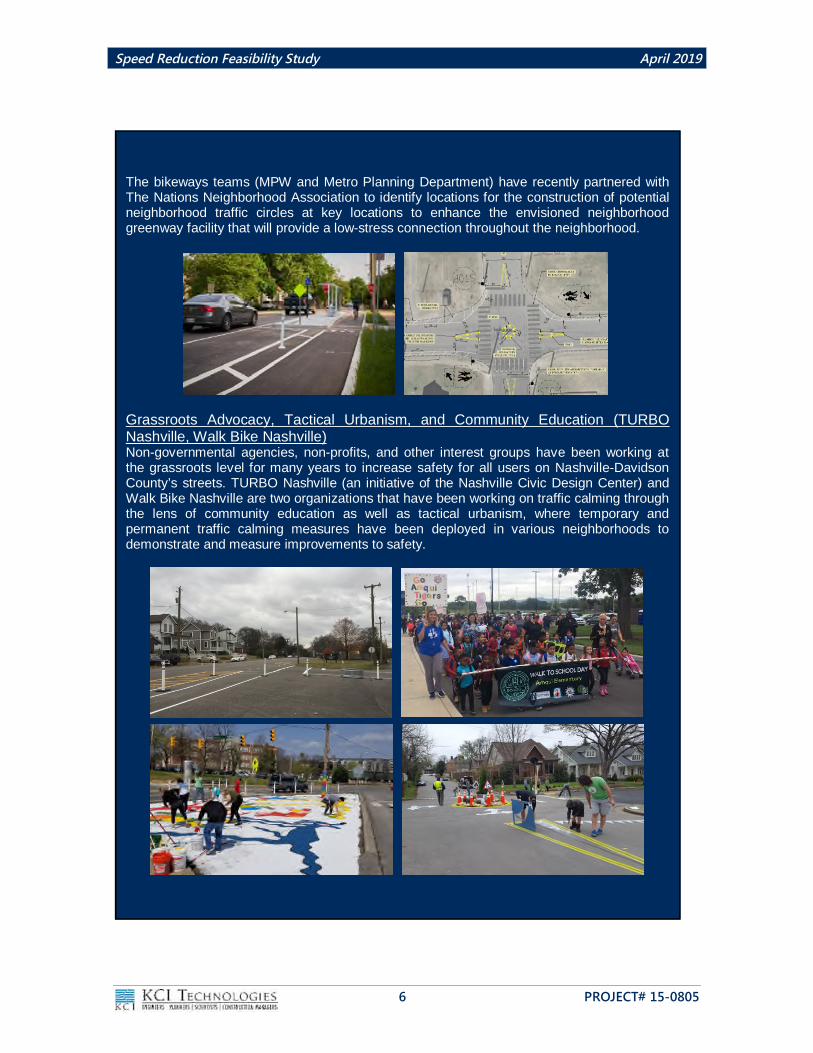
The bikeways teams (MPW and Metro Planning Department) have recently partnered withThe Nations Neighborhood Association to identify locations for the construction of potentialneighborhood traffic circles at key locations to enhance the envisioned neighborhoodgreenway facility that will provide a low-stress connection throughout the neighborhood.
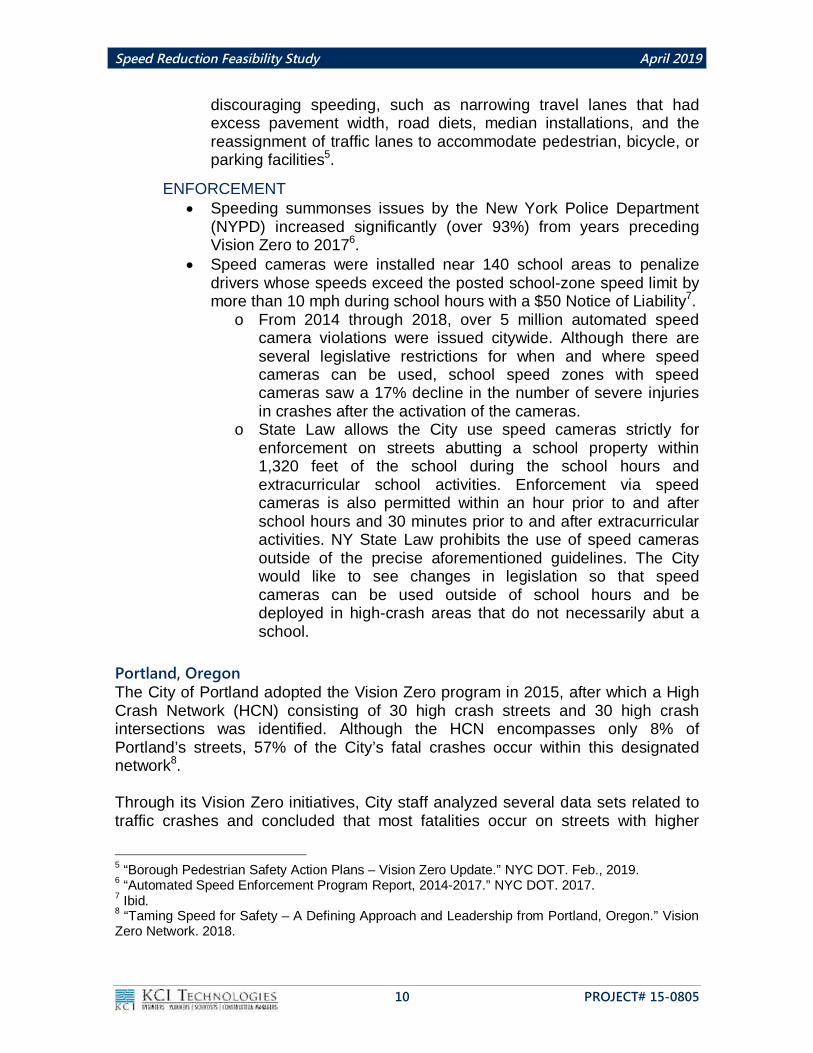
Grassroots Advocacy, Tactical Urbanism, and Community Education (TURBONashville, Walk Bike Nashville)Non-governmental agencies, non-profits, and other interest groups have been working atthe grassroots level for many years to increase safety for all users on Nashville-DavidsonCounty’s streets. TURBO Nashville (an initiative of the Nashville Civic Design Center) andWalk Bike Nashville are two organizations that have been working on traffic calming throughthe lens of community education as well as tactical urbanism, where temporary andpermanent traffic calming measures have been deployed in various neighborhoods todemonstrate and measure improvements to safety.

Speed Reduction Feasibility Study April 2019
7 PROJECT# 15-0805
Originally emerging from a grassroots neighborhoodinitiative, Walking District pilots, which included theoriginal neighborhood (Hillsboro-West End, alsoknown as “HWEN”), were established in threeneighborhoods in 2017. The additional twoneighborhoods were selected based on a variety ofelements, including the structure of the roadwaynetwork (grid-like pattern versus curvilinear,suburban-style subdivision streets), traffic patterns,demographics, development patterns, and availabilityof pedestrian accommodations. The goal was to testthe success of speed limit reductions combined withminor signage and pavement marking improvements.Collector roadway speed limits were reduced from 30or 35 mph to 25 mph, while locally classified streetswere reduced from 30 mph to 20 mph. The studyincluded pre- and post-data collection andobservations to evaluate the impacts in driving behaviors. At a general high-level,results showed improvements in average speeds, although 85th percentile speeds(a metric often used for understanding speed limit compliance in trafficengineering) remained statistically unchanged. Essentially, the majority of driversthat typically drive in a prudent manner slowed their speeds; however, thebehavior of the few that choose to drive recklessly and disobey laws did notchange. A follow-up resident survey showed overall positive feedback, but therewas a desire for additional engineering and enforcement countermeasures tofurther reduce vehicular speeds as well as other reckless driving behaviors(distracted driving, not yielding to pedestrians, rolling through stop signs, etc.).Ultimately, the study recommends a speed limit reduction on all locally classifiedneighborhood streets in Nashville-Davidson County, to 25 mph instead of 20 mph,among other action items. This is due, largely in part, to the suburban-styledevelopment patterns that dominate Nashville-Davidson County and theunlikeliness of achieving 20 mph operating speeds in a large portion ofneighborhoods. Recent speed and volume data from the Walking Districts ishighlighted on the following page.
An additional action outlined in the 3-Year Plan is for city agencies to “reviewMetro's speed limit policy for all municipal streets and for local residential streets”.BL2019-1492 addresses this action, in part; by requesting a feasibility analysis ofthe reduction in posted speed limits for all locally classified streets in Nashville-Davidson County, as well as an implementation strategy should the change becodified.

Speed Reduction Feasibility Study April 2019
8 PROJECT# 15-0805
HIGHLIGHT: RECENT WALKING DISTRICT DATA COLLECTION
Shifting driving behaviors at a large scale, particularly as it relates to speeding, can take yearsbefore sizable benefits are experienced, especially when the American culture is so deeplyengrained around the automobile. Speed and volume data was collected on sample localstreets (posted at 20 mph) from each Walking District (“WD”) in mid-March 2019 to test speedlimit reduction impacts. Follow-up data was originally collected 1-2 months followingimplementation of the new Walking District measures, which are also provided in the tablebelow.
CHANGES IN WEIGHTED AVERAGE SPEEDS (BOTH DIRECTIONS)
“BEFORE”WD
(2016/2017)
“AFTER”WD
(2017/2018)
DIFFERENCE(2016/2017 to2017/ 2018)
2019 DIFFERENCE(2017/2018 to
2019)
OVERALLDIFFERENCE(2016/2017 to
2019)Cleveland ParkN. 2
ndSt. 26.7 mph 23.4 mph -3.3 mph 26.2
mph+2.8 mph -0.5 mph
N. 6th
St. 24.7 mph 25.0 mph +0.3 mph 26.4mph
+1.4 mph +1.7 mph
Hillsboro-West EndW.
LindenAve.
24.9 mph 24.6 mph -0.3 mph 23.7mph
-0.9 mph -1.2 mph
BernardAve.
26.0 mph 27.2 mph +1.2 mph 25.4mph
-1.8 mph -0.6 mph
Una AntiochPiccadilly
Row31.2 mph 30.1 mph -1.1 mph 31.0
mph+0.9 mph -0.2 mph
Results on these randomly selected Walking District streets show initial increases andreductions in the weighted average speeds directly following implementation. Roughly a yearto two following the Pilot Program, speed and volume results (when comparing weightedaverages between 2019 and “after” conditions) showed continued improvement on the streetswithin HWEN. The other three streets showed an upwards tick in averages; however, overallreductions were still maintained between 2019 and “before” conditions, except for N. 6
thStreet
in Cleveland Park. Continued monitoring of impacts, positive and negative, should beconsidered, especially in terms of crash experience. Isolating contributing/detractingenvironmental factors can help Nashville-Davidson County tailor their strategies towardsincreasing compliance in a variety of neighborhood settings.

Speed Reduction Feasibility Study April 2019
9 PROJECT# 15-0805
3. ASPIRATION AND PEER CITY EXPERIENCES WITH SPEED LIMIT REDUCTIONS
3.1 Aspirational City Methodologies and ExperiencesCities are hotbeds for innovative approaches to urban living, including roadwaydesigns that better accommodate all modes of travel while increasing the overallcomfort of public spaces. This section includes information on aspirational cities(New York City, New York and Portland, Oregon) and their multi-prongedapproaches to increasing roadway safety. The information is intended to generateideas for potential similar approaches in Nashville-Davidson County, as well as toestablish an understanding that a comprehensive approach is necessary tosuccess.
New York City, New YorkNew York City was the first American city to adopt the Vision Zero program in2014 with the goal of providing safer streets for all road users through education,law enforcement, public dialogue, street design, and legislation. When analyzingfatal traffic crashes, speeding is often classified as a leading cause. Thus, the Cityhas implemented a multitude of diverse efforts focused on encouraging drivers toreduce their vehicular speeds, including a reduction in default speed limit to 25mph in November of 20141. Some key additional efforts are as follows:
EDUCATION From 2014 through 2018, 1,484 schools and 356 senior centers
were visited by the City’s Vision Zero team to provide safetyeducation for residents of designated priority locations2.
“Street teams” of City staff target all roadway users in areas withinformational flyers and general discussions with people regardingroadway safety. Police provide on-foot patrol during the typicalweeklong duration of the educational outreach. The week is followedup with a period of targeted enforcement of the most commonmoving violations, which lead to modal conflicts.
The Taxi and Limousine Commission (TLC) uses outreach andeducation to promote safety among the many for-hire drivers byincorporating Vision Zero content into the permitting process and taxischool curriculum3.
ENGINEERING In 2017, 390 speed humps were installed, doubling the installation
pace from years prior to Vision Zero4. From 2014 through 2018, 461 Safety Engineering Projects were
completed. These include a myriad of design strategies aimed at
1“Automated Speed Enforcement Program Report, 2014-2017.” NYC DOT. 2017.
2“Borough Pedestrian Safety Action Plans – Vision Zero Update.” NYC DOT. Feb., 2019.
3“TLC Vision Zero Outreach.” NYC Taxi & Limousine Commission. 2019.
4“Automated Speed Enforcement Program Report, 2014-2017.” NYC DOT. 2017.
Speed Reduction Feasibility Study April 2019
10 PROJECT# 15-0805
discouraging speeding, such as narrowing travel lanes that hadexcess pavement width, road diets, median installations, and thereassignment of traffic lanes to accommodate pedestrian, bicycle, orparking facilities5.
ENFORCEMENT Speeding summonses issues by the New York Police Department
(NYPD) increased significantly (over 93%) from years precedingVision Zero to 20176.
Speed cameras were installed near 140 school areas to penalizedrivers whose speeds exceed the posted school-zone speed limit bymore than 10 mph during school hours with a $50 Notice of Liability7.
o From 2014 through 2018, over 5 million automated speedcamera violations were issued citywide. Although there areseveral legislative restrictions for when and where speedcameras can be used, school speed zones with speedcameras saw a 17% decline in the number of severe injuriesin crashes after the activation of the cameras.
o State Law allows the City use speed cameras strictly forenforcement on streets abutting a school property within1,320 feet of the school during the school hours andextracurricular school activities. Enforcement via speedcameras is also permitted within an hour prior to and afterschool hours and 30 minutes prior to and after extracurricularactivities. NY State Law prohibits the use of speed camerasoutside of the precise aforementioned guidelines. The Citywould like to see changes in legislation so that speedcameras can be used outside of school hours and bedeployed in high-crash areas that do not necessarily abut aschool.
Portland, OregonThe City of Portland adopted the Vision Zero program in 2015, after which a HighCrash Network (HCN) consisting of 30 high crash streets and 30 high crashintersections was identified. Although the HCN encompasses only 8% ofPortland’s streets, 57% of the City’s fatal crashes occur within this designatednetwork8.
Through its Vision Zero initiatives, City staff analyzed several data sets related totraffic crashes and concluded that most fatalities occur on streets with higher
5“Borough Pedestrian Safety Action Plans – Vision Zero Update.” NYC DOT. Feb., 2019.
6“Automated Speed Enforcement Program Report, 2014-2017.” NYC DOT. 2017.
7Ibid.
8“Taming Speed for Safety – A Defining Approach and Leadership from Portland, Oregon.” Vision
Zero Network. 2018.

Speed Reduction Feasibility Study April 2019
11 PROJECT# 15-0805
speed limits (35-45 mph). This finding encouraged the Portland Bureau ofTransportation (PBOT) to prioritize speed reduction efforts through the followingVision Zero Action Plan strategies:
RESEARCH9
To determine appropriate speed limits on non-arterial roads, whichaccount for 94% of Portland’s streets network, the City of Portlanddeveloped a unique strategy that varies greatly from the widelyutilized 85th percentile methodology. In 2016, the OregonDepartment of Transportation (ODOT) granted Portland the ability touse a speed-setting methodology that consists of a SimplifiedDecision Matrix. Through this matrix, City Staff can determine whichroadway design features are necessary to ensure the safety ofdifferent road users when vehicles are traveling at varying speeds.The concept of setting speed limits based on a roadway’s 85th
percentile speed was developed based on studies from the 1960sconducted on rural roads, which differ significantly from urban roadsthat accommodate a diverse mix of road users. Thus, the 85th
percentile speed-setting practice does not take into considerationkey safety concerns that seem irrelevant for rural roads but areimportant to account for in an urban setting. With this, PBOT hopesits Simplified Decision Matrix can help the City set safer speed limitscitywide. PBOT’s Simplified Decision Matrix is presented below inFigure 1.
Figure 1: PBOT’s Simplified Decision Matrix
9Ibid.

Speed Reduction Feasibility Study April 2019
12 PROJECT# 15-0805
In order to receive approval to reduce a street’s posted speed limit,PBOT presents a speed zone investigation to Oregon Department ofTransportation (ODOT) with an analysis of the following factors:
o Adjacent land uses; street widths; average daily traffic volume;total number of fatal and injury crashes in a certain timeperiod; number of crashes per mile in a certain time period;detailed description of available pedestrian, bicycle, andvehicle facilities.
From this investigation, a recommendation for a 20 mph postedspeed limit can be made to reduce the risk of fatality for a pedestrianor bicyclist hit by a vehicle to 10%, versus a fatality risk of 40% foundfor vehicles driving at 30 mph.
EDUCATION10
A communication campaign for public outreach was established inSpring 2018.
A messaging campaign was initiated to support safe speeds andbuild public awareness of Vision Zero.
Education on traffic safety cameras was distributed to nearbyresidents and businesses prior to launching this safety initiative.
ENGINEERING The City of Portland decreased posted speed limits to 20 mph on
residential local roadways in April 201811. Signage was installed based on a priority system to promote
connectivity between two, or more, higher classification streets.Priority was also given to locations neighboring bus stops, school,and parks.
Enhancements to street design, such as traditional bike lanes,protected bike lanes, and raised curbs, were considered. Under itsstrategy of enhancing street design in order to discourage speeding,PBOT has developed a prioritization process that allows for efforts tofocus on Portland’s High Crash Network, with special attention paidto communities identified based on a list of 10 equity indicators. Theindicators are as follows12:
o Low-income households; people with disabilities; low Englishproficiency persons; youth; older adults; affordable housing;lower paying jobs; poor vehicle access; access to services.
10“20 mph Residential Speed Limits.” PBOT’s City Council Presentation. 2018.
11“Residential Speed Limit Reduction.” PBOT. 2019.
12“Taming Speed for Safety – A Defining Approach and Leadership from Portland, Oregon.” Vision
Zero Network. 2018.

Speed Reduction Feasibility Study April 2019
13 PROJECT# 15-0805
In order to prioritize the allocation of project funding, the Cityidentifies intersections within its HCN considered highly unsafe andcross-references the identified intersections with communities inneed, as determined through the equity indicators aforementioned13.
Future plans include evaluating the impact of the reduced 20 mphspeed limit on public safety.
ENFORCEMENT Safety cameras were installed on streets with high injury rates. After
an initial evaluation in 2017 prior to the reduction in posted speed, atthree study intersections speeding was reduced 47 percent, 68percent, and 61 percent after installation of speed safety cameras14.
3.2 Peer City Methodologies and ExperiencesThe cities of Charlotte, North Carolina, Wheaton, Illinois, Decatur, Georgia, andLexington, Kentucky were selected as somewhat similar (peer) cities to Nashville,Tennessee that have implemented a large-scale speed reduction strategy. Citieswere selected based on general similarities in their transportation networks and/orcommuting characteristics with that of Nashville-Davidson County. The goal was toinclude networks that reflect the spectrum of roadway contexts and neighborhoodstructures in Nashville. Availability of information and data (regarding speedreductions) on municipal websites was a limiting factor in peer city selection.Therefore, size and demographics vary among these communities as compared toNashville.
Charlotte, NC – Medium-Sized City – Population: 859,035 (2017) –Network Characteristics: historic center with grid-like street pattern,suburban-style commuting corridors with subdivision cul-de-sacsfurther out from downtown core
Wheaton, IL – Suburb of Chicago – Population: 53,373 (2017) –Network Characteristics: small historic center with grid-like streetpattern, largely suburban-style commuting corridors with subdivisioncul-de-sacs, access to commuter rail
Decatur, Georgia – Suburb of Atlanta – Population: 23,832 (2017) –Network Characteristics: commercial center, largely suburban-stylecommuting corridors with subdivision cul-de-sacs, access tocommuter rail
Lexington, Kentucky – Small-Sized City – Population: 321,959(2017) – Network Characteristics: historic center with grid-like streetpattern, suburban-style commuting corridors with subdivision cul-de-sacs further out from downtown core
13Ibid.
14Ibid.

Speed Reduction Feasibility Study April 2019
14 PROJECT# 15-0805
Relevant information is provided below to gain insight on similar speed reductionefforts and traffic calming practices throughout the country.
Charlotte, North CarolinaFollowing the global Vision Zero initiative, Charlotte strives to eliminate allpedestrian deaths on its city streets by 2030. A myriad of actions are required toachieve this goal considering that 27 pedestrian fatalities were reported in 201715.Approximately 80% of these pedestrian deaths occurred on arterial roads with twoor four lanes of travel and speed limits of 35 mph or 45 mph16.
As one of its Vision Zero efforts, Charlotte’s City Council approved a set ofmeasures aimed at facilitating the process that neighborhoods must follow to applyfor traffic calming measures and to request that the posted speed limits onneighborhood streets be reduced to 25 mph in November 2018. The set ofapproved measures includes the following changes17:
EDUCATION Assistance is provided to “distressed neighborhoods” (i.e., low
income) so that signatures required for traffic-calming petitions canbe successfully collected.
ENGINEERING The installation of a speed hump can be requested for streets with a
minimum of 600 vehicles per day. The installation of a stop sign can be requested based on traffic
counts from both the major and the minor streets adding up to aminimum of 600 vehicles per day, as opposed to solely countingmajor street traffic.
The installation of both a speed hump and a stop sign can berequested with a minimum of 1,500 vehicles per day.
Upon the request of individual neighborhoods, the current citywidespeed limit of 35 mph, unless otherwise posted, can be lowered to25 mph.
Wheaton, IllinoisAs part of its efforts to enhance public safety, the Wheaton City Council approvedthe reduction of the speed limit on residential streets from 30 mph to 25 mph inJuly 2018. A speed limit of 30 mph was maintained on residential streetsconsidered major collectors through which more than 6,000 vehicles travel per
15“A record 27 pedestrians died in Charlotte last year. This year could be worse.” Charlotte
Observer. 16 Nov., 2018.16
Ibid.17
“Charlotte Neighborhood Traffic Calming Program: Policy Updates.” Charlotte, NC TAPCommittee Presentation. 24 Sept., 2018.

Speed Reduction Feasibility Study April 2019
15 PROJECT# 15-0805
day18. The following initiatives were conducted in association with the speedreduction:
RESEARCH The decision to maintain the 30-mph speed limit on some roadways
was made following completion of a traffic study on collector roads19.For the study, traffic data was collected along Wheaton’s collectorstreet system to determine whether the procedure used to classifythe city’s roadways should be modified and if reducing the speedlimit on collector streets would be appropriate from a trafficengineering perspective. The study concluded that instead of havingthree roadway classifications – local roads, collectors, and arterials –the city should have five classifications to differentiate minorcollectors and arterials from major collectors and arterials. Thisrecommendation stemmed from the high range of traffic volumesrecorded on the city’s collectors, which varied from 1,000 to over10,000 vehicles per day. In terms of speed data collection, the studyconcluded that the 85th percentile speed on several streetssurpassed the posted speed limit by more than five mph. Most of thestreets where high 85th percentile speeds were recorded arecharacterized by physical conditions that tend to encourage driversto drive faster. Such conditions include long stretches ofuninterrupted flow, wide travel lanes, limited access, and no/limitedon-street parking.
EDUCATION In order to increase awareness about the speed limit change,
residents were welcome to obtain “Drive 25” yard signs and carmagnets at city hall.
A strong communication campaign was implemented, accompaniedby a grace period in which officers only issued warnings.
ENGINEERING Portable Dynamic Message Signs (DMS) and street signs were
installed to raise awareness. Speed limit change as a result of a citywide plan to improve public
safety that included several sidewalk-widening projects.
ENFORCEMENT Law enforcement began enforcement of the speed limit upon
erection of the new speed limit signs. As a suburb of Chicago with apopulation of approximately 52,000 people (~11.5 square miles) ),the implementation of new speed limit signs in Wheaton was carried
18“New Residential Speed Limit.” City of Wheaton, Illinois-Transportation & Parking Department.
2018.19
“Collector Roads Traffic Study & Residential Street Speed Limit.” City of Wheaton, Illinois. 2018.

Speed Reduction Feasibility Study April 2019
16 PROJECT# 15-0805
out during the few weeks following Council’s approval of the speedlimit reduction in July of 2018. The reduced speed limit took effect onAugust 1, 201820.
Decatur, GeorgiaIn April of 2018, the Decatur City Commission approved the request to createResidential District Speed Zones (RDSZ) to facilitate the issue of speeding ticketsin certain areas. This included the following enforcement initiatives21:
ENFORCEMENT Although no changes were made to the posted speed limits across
the city, police officers were granted permission to write a speedingticket to any driver traveling at 1 mph above the posted speed limiton any of the 16 areas designated RDSZ.
o Prior to this change, officers were only allowed to ticketdrivers traveling at more than 11 mph above the posted speedlimit.
o The streets encompassed by the established RDSZ are trafficgenerator roadways known for connecting to high-volumestreet and being in close proximity to schools. Thus, theRDSZ streets carry high traffic volumes during peak hours.
Lexington, KentuckyIn February of 2016, the Urban County Council unanimously decided to reduce theposted speed limit on 21 downtown streets from 35 mph to 25 mph based on highcrash rates (72% occurring downtown) and an increase in pedestrian crashes22.The goal of the legislation was to encourage more multi-modal trips in thedowntown area. Following this legislation, University of Kentucky agreed to lowerposted speeds on their local roadways as well. Speed limits on state roadways,however, were not altered. The following measures were taken to implement thereduction in speed:
EDUCATION Public service announcements were made to emphasize the threat
of higher speeds to pedestrian safety. These announcements wereaired on local television to encourage speeds of under 25 mph in thedowntown area and residential neighborhoods.
20“Speed Limit Lowered for Wheaton Neighborhoods”. City of Wheaton, Illinois-Traffic & Parking
Department. 2018.21
“Decatur adding 16 streets to ‘Residential District Speed Zones’.” Atlanta. News. Now. 9 Apr.,2018.22
“Speed limit will drop from 35 mph to 35 mph on some downtown Lexington streets in spring.”Lexington Herald Leader. 4 Feb., 2016.

Speed Reduction Feasibility Study April 2019
17 PROJECT# 15-0805
A social media campaign was implemented with funding bydonations made to Kentucky’s “Share the Road” campaignestablished by the Kentucky Bicycle and Bikeway Commission.
ENGINEERING To decrease speeds, 158 speed limit signs were installed at a cost of
$5,90023.
ENFORCEMENT The local police department assisted with raising driver awareness
by issuing warning citations in the downtown area during the earlystages of implementation.
23“Speed limits on dozens of downtown Lexington streets could lower from 35 to 25 mph.”
Lexington Herald Leader. 17 Nov., 2015.

Speed Reduction Feasibility Study April 2019
18 PROJECT# 15-0805
4. SPEED LIMIT REDUCTION
FEASIBILITY FOR NASHVILLE-DAVIDSON
COUNTY
4.1 Proposed Scope of Speed Limit
Reduction
Roadways are classified based on thefunction they provide within the overallnetwork, meaning how they serve theflow of trips within that network, as well as the type and number of accesses itprovides to individual adjacent properties. The traditional functional classificationhierarchy breaks the roadway network down into three categories based on thelevel of mobility and accessibility the roadway provides:
Arterials (high level of mobility, typically lower level of access) Collectors (balance of mobility and accessibility) Locals (low level of mobility, high level of access)
Comprehensive transportation planning uses functional classification to determinethe most logical and efficient manner for funneling traffic within the roadwaynetwork. For roadway designers, functional classification dictates a roadway’sdesign, particularly its design speed. Community planners work to tie communitytransportation (mobility, accessibility) and land use/development (livability) goalstogether during key stages in the developmental process, largely by ‘right-sizing’roadway designs according to their existing and future land context, not just theirfunction within the roadway network.
The scope of the potential speed limit reduction for Nashville-Davidson Countyincludes locally classified streets per the Major and Collector Street Plan (MCSP)of Nashville and Davidson County recommended in the 2016 WalkNBike StrategicPlan. The MCSP maps “the vision for Nashville’s major and collector streets andensuring that this vision is fully integrated with the city’s land use, mass transit,and bicycle and pedestrian planning efforts”. The Plan’s guidance for the planning,construction and redevelopment of these roadways expands upon the traditionalfunctional classification system by incorporating considerations for existing andfuture adjacent land use character (i.e., context) into design elements. The threestreet context types used in the MCSP include residential, mixed use, andindustrial, while the roadway functional design types, include:
Arterial-Parkway Arterial-Boulevard Collector-Avenue
Although design guidance is not explicitly tailored in the MCSP for the followingroadway types, it does acknowledge the importance of these roadways and how
There is often a relationship between
posted speed limits and roadway
functional classifications. Typically,
arterials have higher posted speeds, while
locals have lower speeds. The lower
speeds provide safety benefits for both
motorized and non-motorized users.

Speed Reduction Feasibility Study April 2019
19 PROJECT# 15-0805
design principles contained within the MCSP can be relevant for the efficiency,safety, and comfort of these facilities:
Locals Access-Controlled Facilities, such as Interstates and Expressways
Local streets, the lowest order of the functional classification hierarchy, make upthe majority of roadway miles in Nashville-Davidson County, and provide a varietyof roles in varying contexts across the city. These contexts, such as residential,mixed-use, and industrial, are generally aligned with the street contexts outlined inthe MCSP. Although local streets are typically two lanes, widths of local streetsvary widely. Within urban contexts, widths are typically narrower, while insuburban areas, particularly within subdivisions, streets can be very wide. Thefundamental function of a local street is to provide direct access to individualproperties. Many of Nashville’s local streets also operate as residentialneighborhood streets meaning they provide important public spaces to pedestriansand playing children. Reckless driver behaviors (including speeding, whetherperceived or real) negatively impact the safety and comfort of residents and otherusers of these streets, and ultimately, the livability of Nashville. Given theNashville area’s continued urbanization, and subsequent vehicular traffic pressureon these public spaces and the users traveling them, special attention has turnedto one of our community’s largest assets – local streets.
Locally classified streets within Nashville-Davidson County’s Urban ServicesDistrict (USD) are recommended to be the initial focus for the potential speed limitreduction. The USD encompasses what was once the City of Nashville’s historicmunicipal limits prior to city-county government consolidation in 1963, and nowincludes areas such as Antioch and Donelson to the southeast and east ofNashville’s core. USD boundaries were chosen for the speed limit reductionstrategy based on higher density levels (population and built environment), historicstreet patterns and designs, as well as the greater expectation for pedestrians andbicyclists (i.e., increased chances for conflicts between non-motorized andmotorized users). Higher density levels translate to higher traffic volumes in manylocations. Historic street patterns and designs means more grid-like streets,narrower roadways, greater utilization of on-street parking, and higher levels ofcurbside activities, all of which contribute to “self-enforcement” of low operatingspeeds. Narrower environments create less opportunity for drivers to avoidcollisions, and when combined with increased uncertainty along a roadway’scurbside, such as on-street parallel-parked vehicle doors opening or a pedestrianstepping out into the roadway, most drivers tend to slow their speeds.Germantown, one of Nashville’s densest neighborhoods, is a great example whenthinking about this concept, especially the corridors of 4th Avenue North, 5th
Avenue North (although a collector), and 6th Avenue North.
The General Services District (GSD) is not recommended for a district-wide speedlimit reduction on local streets given the spectrum of contexts these streets servein more rural, undeveloped areas of Nashville-Davidson County. Many local
Speed Reduction Feasibility Study April 2019
20 PROJECT# 15-0805
roadways within the GSD (beyond subdivision developments) are narrow, windingcountry roads. In these locations, the ability to support a reduced speed limit withenforcement or engineering countermeasures is reduced. Reduction of speeds onstreets within the GSD could become a second phase of implementation, afterevaluation of the USD process.
Streets on which a 25 mph may not be suitable would be handled on a case-by-case basis through presentation to the Traffic & Parking Commission. This is theprocess currently used for the changing of any speed limit.
It should be noted that a speed reduction would not resolve all traffic concerns onlocally classified roads, such as the need for traffic calming. The existing TrafficCalming Program plays an important role in supporting the speed reduction,especially on local streets experiencing higher volumes of speeding traffic.Furthermore, while this study does not evaluate roads classified as collectors,some collectors share similar characteristics, such as design and context, withlocal roads. In these locations, a speed limit reduction should be evaluated. Thegoal in these evaluations is to find an appropriate balance between the mobility,safety, and livability of the street.
4.2 Potential Issues & Concerns
Potential issues or concerns associated with a broad-sweeping speed limitreduction are outlined in this section. For elected officials and municipaldepartments, cost and logistical details are a concern when talking about thereplacement of more than 2,800 sign faces; however, the success of this projectrelies on more than just the logistics of a smooth installation. Without somedegree of education, engineering, and enforcement, the concerns listed in thissection may endure. Measures to prevent and counteract these follow. A proposedimplementation strategy along with an engineer’s opinion of probable cost isincluded later in this study. Potential issues and concerns during and afterimplementation are as follows:
Driver awareness of newly-reduced speed limits. This includes residentsthat live on the street or in the area, Nashville-Davidson County residentsthat do not live within the USD (whose neighborhood streets did not have aspeed limit reduction), and commuters from adjacent municipalities andcounties.
Driver confusion when in an area with newly-reduced speed limits but on astreet with no posted speed limit sign.
Perception of reduced mobility for residents (i.e., ability to move throughneighborhood quickly).
People may not adhere to newly-reduced speed limit signs, especially onroadways in suburban areas where street widths are very wide and on-street parking is limited. Nashville also has a number of hilly

Speed Reduction Feasibility Study April 2019
21 PROJECT# 15-0805
neighborhoods, which creates an additional hurdle for compliance, even forthe most well intentioned drivers.
Some residents will expect immediate adherence to and enforcement ofnew speed limits. A sweeping change could put a strain on the enforcementbody’s resources as a large percentage of road miles in the USD are localresidential streets.
Resident’s perception of speeding in neighborhoods may not change.Traffic Calming will likely become more important to these residents.
Countermeasure Toolbox
Potential measures to counter the issues and concerns discussed above arehighlighted in this section. They are arranged by the traditional traffic engineeringapproach to roadway safety – the three ‘E’s’, Education, Engineering, andEnforcement. Measures from each category should be implemented in tandemwith each other, as each plays its own unique role in achieving slow speed streets,changing cultural norms surrounding mobility and livability, and providing saferoadways for all users. Cities that have experienced measurable improvements intheir roadway safety have all employed multi-pronged approaches. Whenspeaking of successes, these cities emphasize the importance of approachingroadway safety from all angles.
EDUCATION
The education component should not be overlooked nor undervalued in theprocess of achieving safe streets. Engineering and enforcement countermeasuresare costly to a community, and are not practical for every mile of each local streetwithin Nashville. Education plays a critical role in shifting the American culturalparadigm around travel – from an auto-oriented one to one that considers all usersof the roadway as equally-valuable and important. Those with potential applicationspecific to this effort during/following implementation are provided below:
“Off-Site” Awareness/Educationo Media Blitz – using traditional and non-traditional methods to convey
the message of changes prior to, during, and after implementation.These may include: Approach local TV news channels and newspapers for
message dissemination. Make strategic social media posts using venues such as
NextDoor, Twitter, Facebook, Instagram, etc. Include message in monthly councilmember newsletters for
several months following implementation. Incorporate announcement in monthly council district and
other neighborhood meetings held by councilmembers. Utilize neighborhood associations, especially those that have
been previously involved with the Traffic Calming Program, to

Speed Reduction Feasibility Study April 2019
22 PROJECT# 15-0805
disseminate the message and even tailor neighborhood-specific messaging strategies for maximum effectiveness.
Deliver message using high visibility locations/venues. Thiscould be accomplished through methods such asflyers/handouts/notices, yard signs, or small mobile exhibitsthat could be moved to a variety of community venues andevents as the speed limit reduction progresses across the city.Examples include notices placed within utility bills, flyersplaced at Vehicle Registration Offices, or yard signs placed atVehicle Emissions Testing Locations or in schoolreceiving/pick-up lines.
Place a detailed map of newly posted 25 mph streets on theMPW website for public dissemination.
o Tailor message delivery for those that drive the streets of Nashvilleas their profession. These could include Metro Nashville School busdrivers, MTA Bus Drivers, Campus Transportation Drivers (such asVanderbilt University), MPW fleet drivers, the Post Office, for-hirecompanies, rideshares, and delivery companies (such as FedEx,Amazon, and Uber Eats). While more resource-intensive, consideralerting the larger construction companies that are redevelopingNashville’s neighborhood streets. Some neighborhoods haveexpressed concern over construction-related driver behaviorsthrough the Traffic Calming Program.
o Establish a ‘Pace Car’ Pledge for residents to sign stating they willobey the newly posted speeds, even if vehicles stack up behindthem, effectively creating a “mobile speed bump” for trailing traffic.Similar pledges in other cities also include language on the drivercommitting to being more aware of and courteous to non-motorizedusers. This type of grassroots strategy helps to target speeding fromthe ground up as opposed from the top down, creating greatermomentum for a cultural shift in how our neighborhoods and livingspaces are viewed and treated by vehicular drivers in Nashville.
o Perform surveys to gauge public perception of the Traffic CalmingProgram and enforcement. Determine public awareness of thereduced posted speed and develop education programs that targetspecific audiences deemed less aware of these changes. Validatethe effectiveness of public outreach campaigns by surveying publicawareness of specific marketing strategies.
o Update Google Map/Waze data with newly-posted speed limits, ifpossible.
“On-Site” Awareness/Educationo Place portable DMS at higher-volume entrances to neighborhoods in
more suburban areas or generally place along key collector/arterialroadways in urban areas where traffic has numerous opportunities totravel into and through a neighborhood.

Speed Reduction Feasibility Study April 2019
23 PROJECT# 15-0805
o Provide the opportunity for yard signs to be purchased or borrowedfor residents interested in reinforcing the new speeds.
ENGINEERING
Engineering countermeasures implemented on streets can facilitate reducedspeeds by physically and visually narrowing roadways, as well as providinghorizontal or vertical deflection that physically alters driver behaviors (such asspeed cushions or striping patterns (i.e., chicanes)). Countermeasures can alsoinclude incorporating space for safer bicycle and pedestrian movements. ‘Right-sizing’ existing streets aids in the ability of a roadway to self-enforce a lower speedlimit. While engineering countermeasures and additional roadway design retrofitsare outside the scope of this study, these measures are an important componentin achieving slow speeds and safety goals. The Traffic Calming Program shouldcontinue to be funded in order to complete the detailed analyses and identificationof appropriate engineering countermeasures at a more granular level.
In the design and approval process of new neighborhood developments, designspeeds and other design elements should be evaluated for consistency andshould consider countermeasures to facilitate low speeds.
ENFORCEMENT
Enforcement of newly posted speeds plays a part in the success of a sweepingspeed limit reduction; however, it should not be considered as a panacea to stopspeeding, nor is there a desire for it to be. With thoughtful preparation andimplementation, this program can succeed without a significant enhancement inenforcement from Metro Nashville Police Department (MNPD). MPW and theMNPD should coordinate engineering and enforcement efforts through the TrafficCalming Program regarding roadways that have limited engineeringcountermeasure options or vice versa, limited options for safe, effectiveenforcement. Overlap in strategies can help target the most effective combinationof countermeasures or design standard revisions for these especially troublesomestreets.
By identifying the boundary of the speed limit change as the USD, MNPD officerswill have a clear understanding of the speed limit, allowing for consistentenforcement. The intent of the proposed strategy is to limit driver and officerconfusion both during and after the construction period.
Potential strategies to assist law enforcement include:
An initial warning period (~1 month), similar to the approach used for theWalking Districts, could be implemented as residents become acclimated todriving at a reduced speed.

Speed Reduction Feasibility Study April 2019
24 PROJECT# 15-0805
Data regarding vehicle speeds and volumes is critical for making informedinvestment decisions. Data sharing coordination between MPW (TrafficCalming, Bikeways, and Traffic Engineering), MNPD, and the MetroPlanning Department regarding recently collected data sets (speed andvolume) could be beneficial for maximizing our existing resources efforts.
Some communities have employed ‘Neighborhood Speed Watch’ programsin an effort to provide self-enforcement within their community (as well asan important education opportunity). These programs provide localresidents with speed-reader boards or radar units from their local lawenforcement agency or transportation department. Participants monitorpassing vehicle speeds and report the speed, date, time, and license plateof each speeding incident. With this data, local law enforcement may sendwarning letters to offenders, or they may deploy their own enforcementteam to address high-frequency speeding locations.
Evaluating the success of education, engineering, and enforcement efforts is acritical component in achieving safe streets and other community mobility goals.Collecting, analyzing, and sharing data allows for strategies and actions to becontinually revaluated and refined. This allows limited resources to be allocated towhere the greatest need is and where efforts will have the most significant impacton improving safety. Successful cities across the country underscore theimportance of data collection, the quality of data (ensuring that collected datapoints adequately inform desired safety goals, such as what/how information isincluded in crash reports), and finally, the continual evaluation of that data toproperly refine education, engineering, and enforcement strategies.

Speed Reduction Feasibility Study April 2019
25 PROJECT# 15-0805
5. SPEED LIMIT REDUCTION IMPLEMENTATION
5.1 Implementation Plan
INVENTORY
Implementation of any citywide speed limit reduction should be thoughtfullyplanned and implemented. The foundation of this process is a current andaccurate, geocoded sign inventory. A speed limit sign inventory was completed byMPW several years ago; however, an update will be required prior to anyimplementation. The updated inventory should include all speed limit sign andmarking locations within the USD.
PLANS AND PROCESS
Following the inventory update, a basic plans package should be prepared forcontractors. The plans package should include details for each replacementscenario, quantities, and plan sheets indicating geo-located signage andpavement marking replacement locations. The plan set should be acceptable forbidding.
The design plans should reflect implementation on all locally classified streetswithin the USD. Implementation is recommended to include the replacement of allexisting 30 MPH speed limit sign faces within the USD. Replacement signs shouldread 25 MPH. All existing 20 MPH or 25 MPH speed limit signs should remain.
Furthermore, all damaged sign posts should be replaced, and relocation should beconsidered, as identified in the signage inventory. Moreover, existing 30 mphspeed limit pavements markings should be removed and replaced. In limitedinstances, additional speed limit pavement markings may be recommended.
Locations requiring post replacement or relocation should be identified separately.An additional 72 hours will be required for TN One Call in these locations.
Additional Considerations: The MUTCD identifies retroreflective sign posts as an option on speed limit
signs. These should be considered for select locations. In well-defined neighborhoods, consider removal of redundant speed limit
signs.
CONSTRUCTION

Speed Reduction Feasibility Study April 2019
26 PROJECT# 15-0805
During construction, existing 30 mph speed limit pavement markings should beeradicated in advance of any sign replacement. This will reduce driver confusionduring the transition.
The replacement of speed limit pavement markings (if re-installed at all) mayfollow at any time after sign replacement is complete. This phasing will allowflexibility for the striping contractor, whose schedule requires flexibility due toweather fluctuations.
5.2 Schedule, Phasing, and Next Steps
SCHEDULE AND PHASING
The previous speed limit sign inventory indicates approximately 2,800 speed limitsigns are present on local streets within the Metro Nashville USD (excluding thoselocated within Walking Districts, as these will not change). Conservatively, ananticipated construction timeline for this project would be approximately one (1)year.
The sign inventory and plans preparation process will require additional time. It isestimated that the inventory and design process will take four to six months.
Based on a one-year construction timeframe, it is recommended the project bedivided into four relatively equal phases. The phases may be generallycategorized by council district. It is recommended that the most central, urbanizeddistricts be implemented first. These districts have environments that are the mostconducive for self-enforcing speed limits given characteristics of the builtenvironment, as well as having the greatest need given high volumes of vehicles,pedestrians, bicyclists, and other non-motorized users. The momentum gainedwithin these neighborhoods will help to increase the likelihood for neighborhoodslater in the implementation stages to comply with speed limit changes.
Following the updated signage inventory, this recommended phasing below maybe revised:
Phase 1:1. District 22. District 53. District 64. District 175. District 186. District 197. District 21
Phase 2:1. District 7
2. District 83. District 94. District 135. District 146. District 157. District 29
Phase 3:

Speed Reduction Feasibility Study April 2019
1 PROJECT# 15-0805
1. District 162. District 263. District 284. District 305. District 31*6. District 327. District 33
Phase 4:1. District 1*
2. District 3*3. District 4*4. District 205. District 22*6. District 237. District 248. District 259. District 2710. District 34*
* Very small portion of this District is located within the USD
NEXT STEPS
As part of the Vision Zero effort, many cities have established a task force orcommittee comprised of a spectrum of stakeholders in order to approach safetyfrom the most holistic approach possible while ensuring strategies are equitable.These task forces typically include representatives from a variety of sectors,including transportation, public health, police, fire, policy makers, and advocategroups.
Most often, these task forces are charged with the development of a Vision ZeroAction Plan or similar near-term (5-year) guiding document. These plans presentthe goals of the community in terms of creating safer streets, outlines the near-term and long-term steps needed to achieve those goals, and details who isresponsible for each step in working towards accomplishing those goals.
These task forces also typically play an active role in monitoring progress towardsachieving goals outlined in the near-term action plan as well as providing directionto the municipality in further implementation of action items. This provides flexibilityfor the municipality to appropriately respond to and refine strategies based on dataoutcomes, as they become known. A similar task force in Nashville, whetherspecifically tailored towards Vision Zero or not, could provide a venue for severalof the countermeasures discussed in Section 4, such as the sharing of databetween MPW and MNPD.National practice points to the need for a multi-faceted approach (education,engineering, and enforcement) in addressing the complexities associated withroadway safety and shifting cultural attitudes towards driving behaviors. While thisstudy envisions a specific strategy of countermeasures to be identified by a groupof representatives (ideally, a task force), specific countermeasures discussed inSection 4 that could be beneficial as part of a multi-pronged approach towardsimproving roadway safety in Nashville, include:
Education – carry out a media blitz, “on-site” awareness campaigns, andestablish a Pace Car Program.
Engineering – continue to fund the Traffic Calming Program to evaluateroadways at a granular level and construct engineering countermeasures.

Speed Reduction Feasibility Study April 2019
28 PROJECT# 15-0805
Enforcement – the concept of enforcement is not limited to ticketing. Datasharing, education of the new speed limit by the police, and aNeighborhood Speed Watch Program are examples of enhancedenforcement that could have beneficial application in Nashville. Thecommunity should look to the experiences and creative strategies applied inVision Zero cities to identify an appropriate enforcement strategy that doesnot unduly burden any specific populations, particularly those traditionallyunderserved.
The strategy should be rooted upon a strong foundation of data, and should beperiodically monitored, to evaluate progress on meeting safety goals, whileallowing Nashville-Davidson County to tailor its strategy accordingly.
5.3 Opinion of Costs
Without a current and accurate sign inventory, an engineer’s opinion of probablecost must be based on general assumptions. Using the approximately 2,800 signsin the previous inventory as a base for assumptions, the estimated cost isapproximately $750,000 to $1,000,000. Included in this opinion is the update to thesignage inventory, four sets of design plans (one per phase), construction,construction engineering and inspection, an educational rollout, and acontingency.

Speed Reduction Feasibility Study April 2019
29 PROJECT# 15-0805
6. CONCLUSION
In conclusion, the goal of the speed limit reduction on local streets within the USDis to increase safety for all roadway users. A slower operating speed for vehiclesincreases driver reaction times, reduces vehicle-stopping distances, and canincrease sight distance, in turn, reducing the number and severity of collisions.This is especially true for our roadway’s most vulnerable users – pedestrians,bicyclists, and other non-motorized users. The speed limit reductionimplementation strategy is an important step in achieving the City’s greatertransportation, safety, and mobility goals as the region continues to grow andevolve.
The recommended implementation strategy is as follows: Speed limit reduction (30 mph to 25 mph) would apply to all locally
classified streets with the Urban Services District (USD); however, a district-wide reduction in the GSD is not recommended. Neighborhoods andpockets of residential streets in the GSD could petition, however, to beincluded within the reduction.
A reduction requires all existing 30 mph speed limit sign faces be replaced.Metro Public Works’ speed limit sign inventory (with geocoded locations)will be updated, while also noting existing speed limit pavement markinglocations, using MPW’s photolog.
Conservatively, the sign face replacement process would occur over thecourse of one (1) year with the project divided into four relatively equalphases. The phases may be generally categorized by council districts. Themost central, urbanized districts will be implemented first, and thenexpanding outward from there. The opinion of probable cost isapproximately $750,000 to $1,000,000.
Countermeasures for addressing potential issues and concerns with thespeed limit reduction are detailed in this report. They fall within threegeneral categories – education, engineering, and enforcement. Theeducation component will likely be the most effective before, during, andimmediately following construction in supporting this broad scale change.Countermeasure strategies should be periodically monitored and evaluatedin order to maximize resources and associated impacts on safety.
A task force focused on improving roadway safety should be considered toidentify a specific countermeasure strategy tailored to meet Nashville-Davidson County’s dynamic needs. This task force could also provideimportant analyses of, and guidance on, the evolution of this strategy.