effectiveness of nighttime speed limit reduction in
TRANSCRIPT

Effectiveness of Nighttime Speed Limit Reduction in Reducing Wildlife-Vehicle Collisions
WYDOT Project Champion
Keith Compton District Engineer, District 3
3200 Elk Street Rock Springs, WY
Principal Investigators
Corinna Riginos Research Ecologist
Northern Rockies Conservation Cooperative P.O. Box 2705
Jackson, WY 83001
Marcel Huijser Research Ecologist
Western Transportation Institute P.O. Box 174250
Bozeman, MT 59717
Submitted to Wyoming Department of Transportation
Programming Research Unit 5300 Bishop Blvd.
Cheyenne, WY 82009
Date July 19, 2016

i
Table of Contents Problem Statement and Background .......................................................................................... 2 Study Objectives ........................................................................................................................ 3
Study Objectives .................................................................................................................... 4 Study Benefits ........................................................................................................................ 4 Output and Outcome Measures ............................................................................................. 4 Performance Measures .......................................................................................................... 4
Applicable Questions ................................................................................................................. 5 Statement of Work ..................................................................................................................... 5
Work Plan/Scope ................................................................................................................... 5 Deliverables ..........................................................................................................................16 Work Schedule ......................................................................................................................16
Budget ......................................................................................................................................18 Change Order Information and Agreements ..............................................................................19 Implementation Process ............................................................................................................19 Technology Transfer .................................................................................................................19 Personnel ..................................................................................................................................19 References ...............................................................................................................................20 Data Management Plan ............................................................................................................23

2
Problem Statement and Background Collisions between vehicles and large wild mammals pose a serious threat both to
highway safety and to wildlife populations. Across the United States, an estimated 1-2 million wildlife-vehicle collisions (WVC) occur every year (1). In Wyoming, an average of 2,228 WVCs were reported over the last three years, accounting for 15 percent of all reported collisions (2,3,4). Our analysis of Wyoming Department of Transportation (WYDOT) collision and carcass data (the latter of which is not included in collision statistics) revealed that an average of more than 5,000 deer-vehicle collisions have occurred annually over the last three years (5), although the actual number is likely closer to 10,000 given that approximately half of carcasses are never retrieved (6). Mule deer are involved in more than 85 percent of all wildlife-vehicle collisions in Wyoming.
These collisions pose a safety hazard and are costly; they often result in significant damage to vehicles, injury to their occupants, and are almost always lethal to the animal. Collisions may occur when a vehicle strikes an animal or when a vehicle swerves to avoid an animal and instead drives off the road or into the oncoming lane. In some cases, wildlife-vehicle collisions are fatal to human occupants of the vehicle. WYDOT’s estimated costs per reported collision are $11,600 in injury and property damage costs and $4,000 in the unclaimed restitution value for each deer that is killed (restitution values vary somewhat for other species, e.g. $75,00 for each moose). Taken together, deer-vehicle collisions alone total approximately $24-29 million per year in Wyoming in injury and damage costs and an additional $20-23 million per year in wildlife costs (not including the potentially much higher number of actual lost deer since not all carcasses are retrieved).
Highways and vehicle collisions also have a significant negative impact on wildlife populations – reducing their numbers and impeding their movements through their seasonal ranges and along their migratory corridors (7,8). Where highways create a partial or complete barrier to wildlife movements, they threaten populations by impairing their ability to access the resources they need (8). Wyoming supports one of the largest populations of ungulates in North America, and these animals are important economic and cultural players in the state. However, mule deer populations in Wyoming are in decline, as they are across most of the West (9), and conserving their populations is an extremely high priority for the Wyoming Game and Fish Department (WGFD) (10). Roads have been identified as posing a significant threat to mule deer populations in Wyoming and across their range (11).
The Wyoming Department of Transportation continues to work extensively to reduce the problem of wildlife-vehicle collisions, both to improve highway safety and to reduce negative impacts on wildlife populations. Recently completed highway under-and over-passes (“crossing structures”), coupled with fencing, have reduced wildlife-vehicle collisions by 80-90% in both the Nugget Canyon and Pinedale areas (from Pinedale to north of Daniel Junction) (12-13). Although highly effective, crossing structures are very costly and are not always feasible given constraints on road design and the fencing necessary to funnel animals towards safe crossing structures. Consequently, there is a need to test and develop alternative means of reducing wildlife-vehicle collisions that allow for improved driver and wildlife safety.
One possible mitigation measure is to reduce posted speed limits in areas known to have high wildlife-vehicle collision rates, particularly at night when the majority of collisions occur. A number of broad-scale analyses of the landscape variables associated with high wildlife-vehicle collision rates have shown that posted speed limit is positively related to collision rates (14-18). In Wyoming, our own analyses have indicated 92% more deer-vehicle collisions in places with speed limits of 75 mph compared to 55 mph (19). Although these findings suggest that reducing speed limits will reduce wildlife-vehicle collisions, this may not be the case because drivers tend to drive at the speed for which the road is designed rather than the posted speed limit (1,20). This problem may — or may not — be addressable through greater

3
enforcement of the speed limit (1). Further, there is concern that variable driver compliance to the speed limits will lead to speed dispersion (some vehicles traveling at posted speed, others traveling at design speed), which has been shown to increase collision rates even though the average speed is lower (1).
There have been two documented studies that have explicitly tested the effect of reducing speed limits on wildlife-vehicle collisions. In Jasper National Park, Canada, a study compared bighorn sheep crash rates for eight years before and eight years after changes in posted speed limit and found a slight increase in number of crashes, but this was complicated by significant increases in traffic volume and changes in bighorn sheep behavior (habituation to vehicles and failure to leave the road) (21). In a recent study conducted by the Colorado Department of Transportation, WVC rates were compared for two years before and two years after posted speed limit reductions in 14 areas (22). The study concluded that drivers did not comply with posted speed limits. Changes in WVC rates ranged from substantial decreases to substantial increases. The poor driver compliance and mixed results led CDOT to conclude that reducing nighttime speed limits was not effective.
Both of these studies have suffered from the same design problem: comparing WVC rates before and after the speed limit change, but with no control areas. This design rests on the assumption that all other factors are equal across years, when in reality wildlife populations, vehicle numbers, and other factors change from year to year or season to season. This can substantially muddy our ability to understand whether the speed limit change had any impact or not. Given these design challenges, the currently-available information about the effectiveness of reducing posted speed limits should be considered inconclusive.
Further, there is reason to believe that speed limit reductions may be more effective under some circumstances than others. Research on the effectiveness of signs warning drivers of the high potential for wildlife in the road indicates that these signs are not effective when present year-round, but can be effective if put in specific locations for a discrete period of time, e.g. peak collision season (23-24). Drivers are generally thought to habituate to these signs and stop heeding them the longer the signs are up. By the same logic, drivers may be expected to heed changes in posted speed limit if they are in place for a limited duration. Drivers are also thought to adhere to posted speed limits more under adverse driving conditions, e.g. wet or slippery roads and/or poor visibility.
Recently, WYDOT raised the speed limit from 65 mph to 70 mph on many of Wyoming’s two-lane roads. Concerns about the impacts of this on wildlife-vehicle collisions have led WYDOT engineers to consider reducing nighttime speed limits in known “hotspots” of wildlife-vehicle collisions. There is an urgent need to understand whether such a measures would be effective in reducing WVCs, and whether they would be more effective under certain circumstances than others. Given the lack of well-designed studies from other places, there is a clear need for a soundly-designed, experimental test of the effects of reduced nighttime speed limit on both driver behavior and wildlife-vehicle collision rates.
Study Objectives Our overarching objective is to provide transportation planners with scientifically-
defensible and robust information about whether reducing nighttime speed limits is an effective means of reducing vehicle collisions with wildlife. Doing so will help to justify future management decisions, either to implement reduced nighttime speed limits in multiple locations or to pursue other ways of reducing wildlife-vehicle collisions. This information will help increase the cost-effectiveness of WYDOT’s WVC mitigation measures and will be vital to reducing the rising problem of wildlife-vehicle collisions while maintaining and enhancing landscape connectivity for wildlife in Wyoming.
4
Study Objectives We will use a robust experimental design at a minimum of three known winter-and-
migration (November-April) mule deer collision hotspots in western Wyoming: 1. The effects of seasonal speed limit reductions on actual vehicle speeds and gaps
between vehicles; 2. The effects of these speed limit reductions on interactions between wildlife and
vehicles, including the percentage of times that animals exhibit unsafe versus safe behavior in relation to vehicles; and
3. The effects of these speed limit reductions on number of observed collisions. We will also test the effectiveness of speed limit reductions in two migration-only
hotspots, where speed limits need to be reduced only for the short duration of the migration, two months per year (October-November and April-May). By comparing these sites against the winter-long speed limit reduction sites, we will be able to:
4. Compare the effectiveness of speed limit reduction in winter-and-migration versus migration-only hotspots and recommend whether speed limit reductions are more effective in the latter, or similarly effective (or ineffective) in both conditions.
Study Benefits The results of this study will help to:
Increase the cost-effectiveness of WVC collision mitigation measures by testing the effectiveness of one mitigation method (reducing nighttime speed limits) under consideration for multiple parts of Wyoming.
Improve safety by reducing collisions with wildlife.
Output and Outcome Measures Output measures support WYDOT’s Strategic Goals (25) of:
1. Keeping people safe on the state transportation system, and 2. Exercising good stewardship of our resources
Outcome measures include:
1. Cost Benefit: This project will provide valuable information about the effectiveness of reducing nighttime speed limits on wildlife-vehicle collisions; by doing so, this project will help improve WVC mitigation performance and overall cost to benefit ratios for WVC mitigations. If reducing nighttime speed limits is effective, then it is a low-cost measure that can be implemented in multiple locations in Wyoming. If it is not effective, then it will be clear that the costs to WYDOT and inconvenience to drivers are not justified.
2. By improving WYDOT’s efforts to reduce WVC, this project will improve safety by avoiding harm, injury, loss, and risk to members of the public using Wyoming’s highways.
Performance Measures This proposed work is part of an ongoing set of projects in partnership between WYDOT and the Principal Investigator. The overall goals of this larger set of projects is to:
a. (Cost Benefit) – Improve wildlife-vehicle collision mitigation performance by 50-80%
5
(respectively, the maximum reasonable effectiveness of fence-less mitigations, and the effectiveness of well-sited fences with crossing structures) over a time period of 20 years by using the best available data, such as will be generated by this proposal.
b. (Safety) – Reduce roadway collisions to <1 per thousand people per year by reducing WVC by 80%.
Applicable Questions 1. Are there any potential barriers to implementation? None 2. Are there strategies to mitigate each potential barrier? N/A 3. What is the expected time frame for implementation? Two and a quarter years,
beginning in September 2016 (see below) 4. Does the project involve action on Federal lands or other conditions that will require
NEPA documentation? No 5. What are the major uncontrollable factors and/or unknowns in the project? Field data
collection involves some degree of uncontrollable factors such as weather and equipment failures, but these typically only cause small delays or obstacles.
6. Are there contingencies to address these uncontrollable factors and unknowns in the proposal and are there additional costs if there are delays due to uncontrollable variables? N/A
7. Should the project be segmented into phases with go/no-go decision points based on known unknowns? Based on the findings from these first two years of study, we may seek to continue the study in order to evaluate the long-term effectiveness of speed limit reductions and potential long-term driver habituation.
8. If the project involves evolution of one or more technologies, is a technology roadmap provided showing how these technologies fit together? N/A
9. Will a Buy American Waiver be necessary? N/A
Statement of Work
Work Plan/Scope The core of this study will focus on three “hotspots” of wildlife-vehicle collisions. From
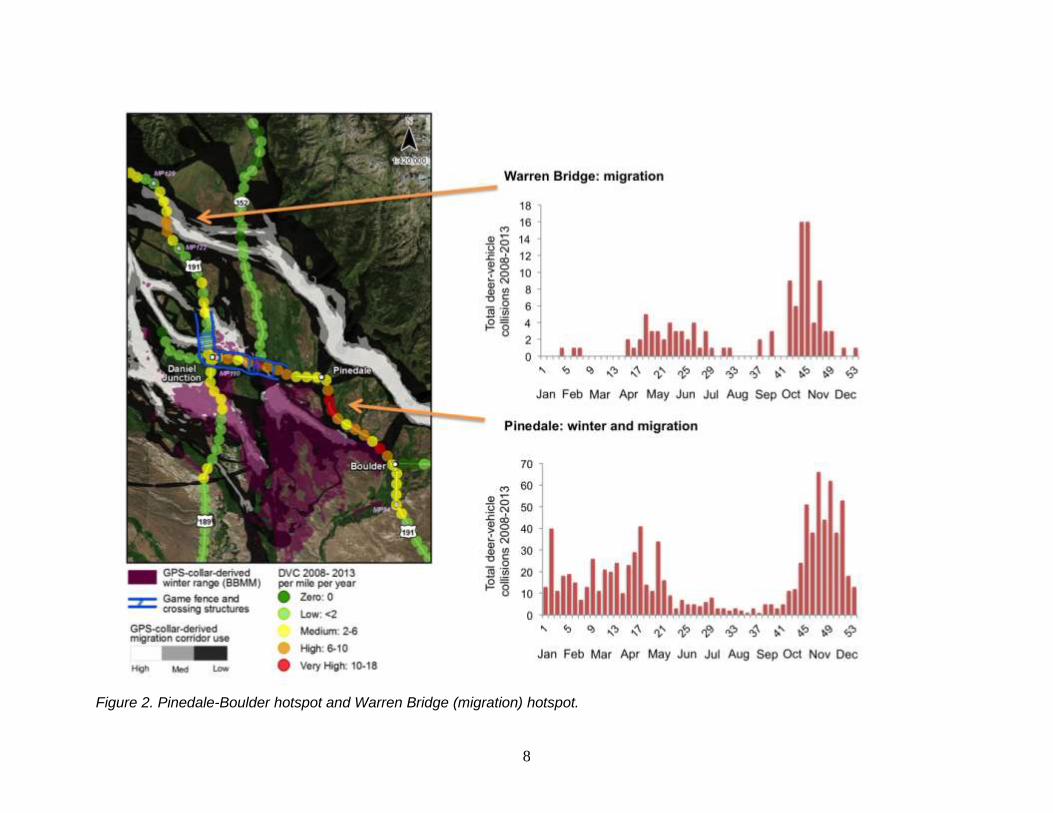
our previous work, we know where and when these hotspots occur for deer in Wyoming (Figure 1; 19). We have selected several candidate hotspots that have peak collision rates from November to April, associated with mule deer migrating into and out of their winter range and overwintering there. We will experimentally test the effects of reducing nighttime speed limit on driver behavior, deer-vehicle interactions, and deer-vehicle collision rates using a robust before-after-control-impact study design. Deer will be the main focus of the study, due to their greater numbers and high vehicle collision rates; however, we will also collect data on any other large mammals observed during the course of the study, with particular interest in moose due to their declining populations.
Candidate hotspots for this study include: • US 191 Pinedale-Boulder (MP 88-91) [Figure 2] • US 189 La Barge-Big Piney (MP 80-103) [Figure 3] • WY 89 N. of Evanston (MP 1-11) [Figure 5] • US 189 S. of Kemmerer (MP 4-20) [Figure 4] • US 26/287 E. of Dubois (MP 56-72) [Figure 6] We will work with WYDOT District 3 and District 5 staff to identify the sites that best lend
themselves to this study, considering both management and research needs.

6
In addition, we will study the effects of short-term (two-month) speed limit reductions for two locations where deer migration routes cross highways, leading to highly episodic (October-November and April-May) peaks in collision rates. Proposed sites are:
US 191/189 south of Warren Bridge (MP 122-129) [Figure 2]
US 30 north of Cokeville (MP 5-8) [Figure 7]

7
Figure 1. Heat map showing hotspots of deer-vehicle collisions across Wyoming, using carcass and collision records from 2008-2013. Collision hotspot locations are highly stable from year to year, although the absolute number of collisions per hotspot varies from year to year.
8
Figure 2. Pinedale-Boulder hotspot and Warren Bridge (migration) hotspot.

9
Figure 3. La Barge - Big Piney hotspot.

10
Figure 4. North of Evanston hotspot.

11
Figure 5. 189 S. of Kemmerer hotspot.

12
Figure 6. Dubois hotspot.

13
Figure 7. Cokeville (migration) hotspot.

14
Core study: winter-and-migration sites At each of the three winter-and-migration sites, we will use a before-after-control-impact
study design to compare two time periods (year 1, year 2) and two locations (splitting each hotspot in half: half 1, half 2). The before-after-control-impact (BACI) design compares a treatment (speed limit reduced) area with a control (no speed limit reduction) area, both before and after the treatment is applied. This design helps to remove the variation associated with temporal differences due to factors not being manipulated (e.g. more deer crossing the road in one year than another).
In year 1, each hotspot will have its normal speed limit (e.g., 70 mph) throughout the entire peak collision season (November-April). During the second year, half of the hotspot (the “impact” half) will have a reduced nighttime speed limit (e.g. 55 mph) while the other half will continue to have its normal “control” speed limit (Figure 7a). This will allow us to evaluate driver compliance to speed limit over an extended (six month) period of time that represents a realistic management scenario; testing a reduced speed limit over a shorter period of time may yield results that are not representative of actual driver responses, since we expect driver compliance to be higher if speed limits are reduced for a shorter period of time.
At the core winter-and-migration study sites, we will evaluate the effects of reduced speed limits on driver behavior, deer-vehicle interactions, and deer collision rates. We will collect field data on driver behavior and wildlife-vehicle interactions in each hotspot, rotating among hotspots throughout the six-month field season. A possible sampling schedule would be: week 1 - hotspot 1, week 2 - hotspot 2, week 3 - hotspot 3, week 4 - break, repeat. In addition to these, we will work with WYDOT to collect collision data in the experiment. By collecting and analyzing these three different responses to the experimental manipulation of speed limit, we will get a comprehensive picture of the effectiveness of nighttime speed limit reduction on wildlife-vehicle collisions.
Figure 7. Experimental design for (a) winter-and-migration sites, where a before-after-control-impact (BACI) experimental design is proposed over two years, and (b) migration-only sites, where a before-after study design is proposed. In both cases, the line represents an individual hotspot of wildlife-vehicle collisions, with green representing a “control” speed limit and red representing a “treatment” of reduced nighttime speed limit. Data collection points are indicated with an “x”.

15
Migration-only sites At migration-only sites, the hotspot length is too short to conduct a before-after-control-
impact study. At these sites we will instead conduct a before-after study (Figure 7a), acknowledging the limitations of this design and balancing them against this opportunity to study speed limit reductions under the circumstances where they are most likely to be effective (short duration, short extent of road). These study areas will not make up the core of our study due to experimental design limitations, but results from these areas will be important to informing our overall conclusions about the effectiveness of reduced nighttime speed limit and the circumstances under which this measure is most likely to be effective. Driver behavior
Driver behavior will be measured primarily as vehicle speed. We will use four autonomous radar recorders (e.g. Jamar Technologies Radar Recorder and TraxPro software) in each hotspot: one at each end of each half of the hotspot. This will allow us to compare vehicle speeds just after and several miles after the first signs drivers see posting reduced nighttime speed limits (and the same locations during control, or normal posted speed limit, times). To the extent possible, the radar recorders will be situated in the same places where wildlife-vehicle observations are made (see below). Measures of driver behavior we will analyze are: average speed, range and variance of speed, average gap, range and variance of gaps (all by the hour of the day). We will also compare driver behavior under benign and adverse road conditions; data on road conditions will be collected by field technicians. Finally, we will work with local law enforcement agencies to obtain information about number of tickets issued in each study area under control and treatment conditions, so that we can evaluate the role of enforcement in affecting driver behavior. Wildlife-vehicle interactions
While vehicle speed is a good indicator of whether drivers respond to changes in posted speed limit, speed alone does not tell us how vehicles and wildlife interact. We will use thermal video cameras to directly observe the interactions between vehicles and wildlife attempting to cross roads. This can tell us (a) the proportion of times that vehicles are able to respond to wildlife in the road (e.g. by slowing down or swerving) to avoid a collision, (b) the proportion of times that animals attempt to cross the highway and succeed versus (c) the proportion of times that animals attempt to cross and give up the attempt. These are pieces of data that cannot be obtained from collision records alone; collisions tell us only about the number of animals that attempted to cross the highway and got hit by a vehicle, with no information about the situations where animals did not get hit. In order to fully understand the impacts of reduced speed limit on wildlife-vehicle interactions, we need to observe these interactions directly.
We will use automated FLIR (Forward-Looking Infrared) cameras, connected to a battery and laptop, to record video footage of wildlife-vehicle interactions. This is a method we have used before in a previous study for WYDOT. First, we will observe deer roadside locations (e.g. in adjacent fields) at dusk and dawn; this is a good indicator of where deer frequently attempt to cross the road. From this information, we will select two locations in each half-hotspot at which to set up the automated FLIR systems. On each day of each sampling period, automated FLIR systems will be set up before dusk in each of the four locations per hotspot and left to record until after dawn the next morning. Cameras will be turned off and batteries swapped out for charging each day.
Video footage will be reviewed and each attempted deer (or other species) road-crossing attempt will be scored for the following data:
1. Number of attempts to cross 2. Ultimate success versus failure to cross (failure = animal abandons attempting)

16
3. Whether animal crosses in a “safe” way (approaches road cautiously, crosses in a large gap between vehicles) versus an “unsafe” way (runs into road without stopping first and/or runs in front of oncoming vehicles)
4. Whether, and how, driver modified his/her behavior (e.g. slowed, swerved) We will compare deer-vehicle interactions at each location (two per half-hotspot), before
and after the speed limit reduction and in treatment versus control sections of the road. Collisions
We will also measure the number of collisions between vehicles and wildlife that occur during the experiment. Collisions can be measured via both reported collisions and roadside carcass counts. Reported collisions (“crashes”) typically have GPS coordinates taken as part of the reporting process; we will thus be able to determine whether the collision occurred in a control or treatment zone, based on the location and the date of the collision. Carcass data are typically not collected with the same degree of precision; often carcass locations are rounded to the nearest whole mile marker. We will work with Maintenance supervisors and for each hotspot to ensure that maintenance crews removing carcasses are equipped with and trained to use a GPS to record the coordinates of each carcass. This will enable us to determine whether the collision occurred in a control or treatment zone. Using combined data from crashes and carcasses, we will compare the number of collisions in each half-hotspot, before and after the speed limit reduction and in treatment versus control sections of the road.
Support for this project will also enable us to continue maintaining and updating the state-wide collisions database that we have compiled for 1990-2014. This database combines WYDOT crash and carcass records -- removing duplicate records and performing quality control procedures to produce the most accurate possible geo-database of the location, timing, species involved, and other available information for wildlife-vehicle collisions across the state.
Deliverables 1. One-page summary document providing recommendations. 2. Updating the carcass/collisions database to include 2015, 2016, and 2017 records, and
continued sharing of this database with WYDOT the Wyoming Migration Initiative, and WYGISC. The Wyoming Migration Initiative and WYGISC are using these data for their Migration Viewer online tools.
3. Quarterly, interim, and final reports to WYDOT detailing specific methodologies and findings.
4. Presentations of major findings to WYDOT engineers. 5. Presentations to interested members of the general public. 6. Scientific journal articles and conference presentations.
We will share all final products with WYDOT and the Wyoming Game and Fish Department. All deliverables except scientific journal articles will be completed by December 2018.
Work Schedule We anticipate a two-and-a-quarter year project, to be completed by December 2018. However, if speed limit reductions are found to be effective during the first two years of this study, we will seek additional support to extend the study for several additional years to evaluate the long-term effectiveness of reducing nighttime speed limit. This is important because driver compliance to a posted reduction in speed limit is expected to drop off over time.

17
2016-2018 schedule of work:
Sept-Nov ‘16
Dec-Feb ‘17
Mar-May ‘17
June-Aug ‘17
Sept-Nov ‘17
Dec-Feb ‘18
Mar-May ‘18
June-Aug ‘18
Sept-Dec ‘18
Preparation and field data collection
Review and management of speed and video data
GIS analysis
Data analysis
Report writing Outreach and tech transfer

18
Budget
Project Costs Y1
Project Costs Y2
Total Percent of
Total
DIRECT COSTS $125,088.00 $102,208.00 $227,296.00 90.91
Total personnel costs $86,208.00 $86,208.00 $172,416.00 68.96
Principal investigator (CR) $25,800.00 $25,800.00 $51,600.00 20.64
Principal investigator (MH) $8,000.00 $8,000.00 $16,000.00 6.40
Field tech 1 (lead) $24,768.00 $24,768.00 $49,536.00 19.81
Field tech 2 $20,640.00 $20,640.00 $41,280.00 16.51
GIS analyses $7,000.00 $7,000.00 $14,000.00 5.60
Travel $14,000.00 $14,000.00 $28,000.00 11.20
Total equipment costs $22,880.00 $2,000.00 $24,880.00 9.95
Software $1,000.00 $1,000.00 $2,000.00 0.80
Jamar Radar Recorders (4, plus software) $12,180.00 $12,180.00 4.87
Forward-looking IR camera (1)* $3,000.00 $3,000.00 1.20
Batteries (8) $2,000.00 $2,000.00 0.80
Laptops (4) $1,500.00 $1,500.00 0.60
Boxes, cases, poles $1,000.00 $1,000.00 0.40
Hard drives, cables, etc. $600.00 $600.00 0.24
GPS units (6) $600.00 $600.00 0.24
Misc. other supplies $1,000.00 $1,000.00 $2,000.00 0.80
TECH TRANSFER $2,000.00 $2,000.00 $4,000.00 1.60
Travel for conference and presentations $1,000.00 $1,000.00 $2,000.00 0.80
Publication costs $1,000.00 $1,000.00 $2,000.00 0.80
INDIRECT COSTS $12,508.80 $10,220.80 $22,729.60 9.09
Project administration $12,508.80 $10,220.80 $22,729.60 9.09
TOTAL $137,596.80 $112,428.80 $250,025.60
*Three units already purchased by WYDOT from a previous study

19
Change Order Information and Agreements We understand that any changes in the duration of the contract, in the work plan / scope, work schedule, or costs must be in writing and approved by the RAC.
Implementation Process We will work closely with our WYDOT partners and project partners through all phases
of the project to ensure that our findings are relevant and actionable. Our deliverables will provide valuable implementation recommendations about the benefits (or lack of benefits) associated with reducing speed limits in areas with high rates of wildlife-vehicle collisions.
Technology Transfer Technologies and results from this project will be shared with WYDOT staff in several
ways. WYDOT District 3 Engineer Keith Compton and Wildlife Specialist Tom Hart will be consulted throughout the project to ensure that the project meets their needs and expectations and to solicit their ideas for improvements to the project. WYDOT will receive written or verbal (in-person presentations) quarterly reports over the course of the project.
At the end of the project, we will provide a comprehensive final report, including research results, conclusions and recommendations, and raw data and metadata. Our deliverables (see above) will provide specific recommendations. We will be available to assist WYDOT staff with data interpretation and integration of results into transportation planning. We will also be available to assist county government and wildlife managers with interpretation of our results.
Education, Outreach, and Scientific Products 1. Presentations to interested members of the general public and targeted interest groups:
We will create a presentation that highlights study findings and emphasizes how WYDOT uses data to help mitigate WVC.
2. Video footage for driver education: Video footage of deer-vehicle interactions is a very
powerful tool to communicate with diverse audiences. We will continue to compile a set of video clips illustrating the challenges that deer and drivers face when they meet on roadways and how driver behavior matters to the outcome of this interaction.
3. Scientific journal articles and conference presentations: We will prepare and submit at least one manuscript detailing the results of the study to a peer-reviewed scientific journal. We will present findings at a regional scientific conference.
4. Project Evaluation: We will evaluate the outputs of the education phase to ensure that
project outcomes were achieved.
Personnel Dr. Corinna Riginos is a Research Ecologist with 15 years of experience in wild herbivore-habitat interactions and more than 25 peer-reviewed publications. She led all analyses, final reporting, and outreach for three previously-funded WYDOT grants (RS03210: Understanding mule deer movement and habitat use patterns in relation to roadways in NW Wyoming; and RS05212: Evaluating the effects of deer delineators on wildlife-vehicle collisions in NW

20
Wyoming; and RS03215: Planning Support for Mitigation of Wildlife-Vehicle Collisions and Highway Impacts on Migration Routes in Wyoming) and is leading a currently-funded WYDOT grant (RS04216: Traffic Thresholds in Deer Road-Crossing Behavior). Together, these projects are beginning to yield a more comprehensive picture of wildlife-vehicle collisions, their causes, and their mitigations across Wyoming. Dr. Riginos has broad expertise on the issue of wildlife-vehicle collisions and the statistical tools necessary to carry out this proposed work. She holds degrees in ecology from the University of California, Davis (Ph.D.) and Brown University (B.S.). Dr. Marcel Huijser is a Research Ecologist with 24 years of experience. Specializing in road ecology since 1995, he has conducted research in Europe, North America, South America and Asia. His focus is on the ecological impacts of transportation infrastructure as well as mitigation measures aimed at reducing these impacts. Most of his research relates to reducing large mammal-vehicle collisions, providing safe crossing opportunities for wildlife, and cost-benefit analyses regarding the implementation of mitigation measures. Dr. Huijser has taught a road ecology course for MSc and PhD students and has also provided several multiple day courses to various agencies and toll road companies. Dr. Huijser has led several dozen road ecology projects and has written many reports, handbooks, book chapters and scientific articles in peer reviewed journals.
References 1. Huijser, M.P., McGowen, P., Fuller, J., Hardy, A., Kociolek, A., Clevenger, A.P., Smith, D. and
Ament, R. (2008a). Wildlife-Vehicle Collision Reduction Study: Report to Congress. U.S. Department of Transportation, Federal Highway Administration. FHWYA-HRT-08-034 254 pp.
2. Wyoming’s 2013 Report on Traffic Crashes, Wyoming Department of Transportation, Cheyenne, WY.
3. Wyoming’s 2014 Report on Traffic Crashes, Wyoming Department of Transportation, Cheyenne, WY.
4. Wyoming’s 2015 Report on Traffic Crashes, Wyoming Department of Transportation, Cheyenne, WY.
5. Riginos, C., Graham, M.W., Davis, M., Smith, C., and Johnson, A. 2015. Effects of wildlife warning reflectors (“deer delineators”) on wildlife-vehicle collisions in central Wyoming. Report to the Wyoming Department of Transportation. Federal Highway Administration. FHWA-WY-15/03F
6. Bissonette, J. A. and D. Olson. 2013. The Olson- Bissonette Report for vehicle related
mortality of mule deer in Utah. UTCFWRU 2014 (5): 1–152. 7. Forman, R.T., and Alexander, L.E. 1998. Roads and their major ecological effects. Annual
Review of Ecology and Systematics, 207–C2.
8. Beckman, J.P. and Hilty, J.A. 2010. Connecting wildlife populations in fractured landscapes. In Safe Passages: Highways, Wildlife, and Habitat Connectivity. Beckman, J.P., Clevenger, A.P, Huijser, M.P., and Hilty, J.A. eds. Island Press: Washington, DC.

21
9. de Vos, Jr. J. C., M. R. Conover, and N. E. Headrick. 2003. Mule deer conservation: issues and management strategies. Berryman Institute Press, Utah State University, Logan, USA.
10. Mule Deer Working Group. 2009. The Wyoming Mule Deer Initiative. Wyoming Game and
Fish Department. 11. Wakeling, B.F., J.W. Gagnon, D. Olson, D.W. Lutz, T.W. Keegan, J. Shannon, A. Holland, A.
Lindbloom, and C. Schroeder. 2015. Mule Deer and Movement Barriers. Mule Deer Working Group, Western Association of Fish and Wildlife Agencies, U.S.A.
12. Sawyer, H., C. Lebeau, and T. Hart. 2012. Mitigating roadway impacts to migratory mule
deer: A case study with underpasses and continuous fencing. Wildlife Society Bulletin 36: 492–498.
13. Sawyer, H., P.A. Rodgers, and T. Hart. Pronghorn and mule deer use of underpasses and
overpasses along U.S. Highway 191. Wildlife Society Bulletin, in press. 14. Gunson, K.E., G. Mountrakis, and L.J. Quackenbush. 2011. Spatial wildlife-vehicle collision
models: a review of current work and its application to transportation mitigation projects. Journal of Environmental Management 92: 1074–1082
15. Seiler, A. 2005. Predicting locations of moose-vehicle collisions in Sweden. Journal of
Applied Ecology 42: 371-382. 16. Danks, Z.D. and Porter, W.F. (2010). Temporal, spatial, and landscape habitat
characteristics of moose–vehicle collisions in Western Maine. Journal of Wildlife Management 74: 1229–1241.
17. Ng, J.W., C. Nielson, and C.C. St Clair. 2008. Landscape and traffic factors influencing
deer-vehicle collisions in an urban environment. Human-Wildlife Interactions 2: 34–47. 18. Found, R., and M.S. Boyce. 2011. Predicting deer-vehicle collisions in an urban area.
Journal of Environmental Management 92: 2486–2493. 19. Riginos, C., H. Copeland, C. Smith, H. Sawyer, K. Krasnow, T. Hart. 2016. Planning-
Support for Mitigation of Wildlife-Vehicle Collisions and Highway Impacts on Migration Routes in Wyoming. Report in final review.
20. Bissonette, J.A., and C.A. Kassar. 2008. Locations of deer–vehicle collisions are unrelated
to traffic volume or posted speed limit. Human-Wildlife Conflicts 2: 122–130. 21. Bertwistle, J. The Effects of Reduced Speed Zones on Reducing Bighorn Sheep and Elk
Collisions with Vehicles on the Yellowhead Highway in Jasper National Park. In the Proceedings of the International Conference on Wildlife Ecology and Transportation. Held in Missoula, MT, September 13 to 16,1999, pp. 727 to 735.
22. Colorado Department of Transportation Final Report – HB 1238 Wildlife Crossing Zones.
2014.
23. Sullivan, T.L., A.F. Williams, T.A. Messmer, and L.A. Hellinga. 2004. Effectiveness

22
of temporary warning signs in reducing deer-vehicle collisions during mule deer migrations. Wildlife Society Bulletin 32: 907-915.
24. Huisjer, M.P., C. Mosler-Berger, M. Olsson, and M. Strein. 2015. Wildlife warning signs and
animal detection systems aimed at reducing wildlife-vehicle collisions. In Handbook of Road Ecology. van der Ree, R., D.J. Smith, and C. Grilo, eds. Wiley Blackwell: Chichester, UK.
25. Wyoming Department of Transportation Strategic Plan 2012-2015.

23
Data Management Plan Data type and storage:
Observational data on wildlife behaviors and traffic counts, to be stored as .csv spreadsheets
GIS data on carcass and collision locations will be stored as an ArcGIS geodatabase
Data will be regularly backed up on hard drives and in the cloud over the duration of the project
All data are reproducible
Data organization, documentation, and meta-data:
All data will be organized and a meta-data file will be generated explaining: o the purpose of the project o how the data were generated o structure and organization of the files o transformations of the data from the raw data through analyses o variable names and descriptions o explanations of any codes or classification schemes
Directories will be named with the project title as the main directory and with subtopics (e.g. deer_behavioral_observations) as folders within that directory. Individual files will be named descriptively and with yyyy.mm.dd added to the name.
Data access and intellectual property:
There are no access concerns
All data will be handed over to WYDOT on completion of the project
Copies of the data will remain with the PI and with the Northern Rockies Conservation Cooperative. The PI retains the right to publish data in peer-reviewed journals and to post on open-access websites such as Figshare
No embargo periods other than those imposed during the research period Data sharing and re-use:
There are no restrictions on re-use. Anybody wishing to re-use the data should submit a request in writing to the PI with a clear explanation of what the data will be used for an agreement to acknowledge the PI appropriately.
Potential audience for re-use are researchers wishing to perform a meta-analysis of similar studies
Data will be published within a year of project completion in a journal such as Bulletin of the Wildlife Society.
Data preservation and archiving:
Data will be archived as .csv files
Data will be uploaded the Wyoming State Archives upon termination of the embargo period
Disclosures A long-term data preservation plan will be used to store the data beyond the life of the project. The data will be deposited into the Wyoming State Archives online repository.