38 nighttime detection of bicycles
TRANSCRIPT

38
NIGHTTIME DETECTION OF BICYCLES
Helmut T. Zwahlen, Ohio University, Athens, Ohio
BACKGROUND
The purpose of this paper is to summarize what research has been done, what we have learned so far and what suggestions can be made with regard to the nighttime detection problem of bicycles.
Most of the suggestions are based upon research studies carried out at Ohio University (O.U.). Details about these research studies are given in a six-volume O.U. human factors engineering and design laboratory report (1). Volume I describes a computer model developed-to simulate the performance of a reflectorized object, such as a corner cube reflector, located ahead of a vehicle with a selected headlamp system at night.
Tables and graphs illustrate the performance of selected corner cube reflectors at night for various geometric, vehicle and headlamp configurations, as well as for various environmental conditions. Reflector performance is expressed in terms of how many times the illumination at the eyes of an observer is above the 98% detection threshold level for a selected representative background luminance (for detection threshold levels as a function of the background luminance see Fig. 3-lf9, p. 3-35, IES Lighting Handbook, 1972) (Z).
Volume II contains a computer analysis dealing with the visual detection of point light source signals such as a tail lamp at night or during daytime. Volume II also contains an extensive review of the visual threshold data and background luminance data published in the literature.
Volumes III, IV, V and VI describe field experiments dealing with the foveal and peripheral detection of bicycle and shoe reflectors at night. Volume III provides field research results for detecting, ahead of a stationary car at night, a bicycle equipped with pedal reflectors and a rear wide angle reflector moving parallel to the car's axis. Volume IV provides field research results with regard to the detection of static vs. dynamic pedal reflectors at night. Volume V provides field research results with regard to massed vs. distributed reflectors at night, and Volume IV provides field research results with regard to detection of shoe reflectors at night. Volumes III through VI report not only the distances at which the various reflectors or reflector arrangments were detected, but also information as to how many times the illumination level at the eyes of the observers was above the 98% detection threshold level for a representative background luminance of the experimental environment.
REVIEW OF RESEARCH LITERATURE
Only a few studies can be found that deal with the nighttime detection of reflectorized objects in the field. There exist many studies in the literature, however, which deal with the visual detection of targets against various backgrounds, the detection of point sources, or the detection of chromatic light sources in the laboratory. For examples or references, see pp. 3-33 to 3-39, IES Lighting Handbook, 1972 or W.E.K. Middleton's book "Vision through the Atmosphere," 1952 (l), or the Visibility Issue of Applied Optics, May 1964, Vol. 3, No. 5 (4). Four studies will be discussed here only briefly. -They are reviewed in detail in the Ohio University volumes described above.
The report by K.G. Cook entitled: "Reflector Analysis," 1969 (.2_), provides useful information
about reflectors, reflector usage, reflector standards and tests, the computational aspects and methods to analytically assess reflector performance, results of an analytic assessment of reflector performance and results of controlled field observations of reflective materials.
Burg and Beers report in the Journal of Safety Research, on two studies that were conducted to test the relative effectiveness of prismatic retroreflectors and retroreflective sidewall tires (6). Primary emphasis was on increasing the conspicuf ty of bicycles and motorcycles viewed from the side. The main findings were: 1) from a pure threshold detection standpoint, brighter stimuli are better, regardless of color, and point light sources such as prismatic reflectors are better than extended reflectors such as reflectorized sidewalls of equal brightness; and 2) in the night environment with moderately high visual clutter a relatively high luminance contrast as provided by prismatic reflectors does not result in easy recognition of a stationary or slowly moving stimulus object, however, the unique closed circular shape of reflectorized sidewall tires is very distinative and thus far more effective as a recognition clue than the higher point brightness of prismatic reflectors. McGinnis reports on an analytic computer study dealing with the reflectorization of railroad rolling stock (7). Although this study does not directly deal with the bicycle detection problem, the approach, many of the calculations and the results have relevance to the bicycle detection problem. This author has used his own computer model and recomputed the visibility regions given by McGinnis. Figure 1 illustrates a number of selected threshold multiple curves (1.0, 7.8, 20, 50, 100, 500, 1000) for a pickup truck (driver eye height of 5 feet, horizontal distance from eyes to headlamps 6 feet, headlamps 2.125 feet above ground and 5 feet apart, and driver at 1.25 feet to the left of the car axis~. Because of the larger observation angles for the pickup truck, visibility regions for the truck are smaller than for a typical car.
Another source of information is the Stoovelaar and Groot report on a study conducted under the auspices of the Royal Dutch Touring Club ("A Visible Bicycle," 1976) (8). This study emphasizes pattern-recognition rather than the factors used in classical visibility studies such as luminance and contrast.
Discussion of SAE and CPSC Reflex Reflector Standards
To this author, the ~AE J594f (9)and the Consumer Product Safety Connnission (10) reflex reflector standards have a number of shortcomings. First, both standards, are strictly stated in photometric terms and make no reference or justifications with regard to human capabilities and limitations. Second, both standards do not prescribe a minimum reflector area. Third, both standards specify the minimum photometric requirements for only two observation angles (0.2° and 1.5°, exception CPSC standard for pedal reflectors, additional observation angle 0.3°). And fourth, the specified photometric values are highly inadequate from a safety point of view and far below the state of the art capability of the reflex reflector manufacturing technology. It is also this author's opinion that the increases in the photometric values (50%) for the 0.2° obser-
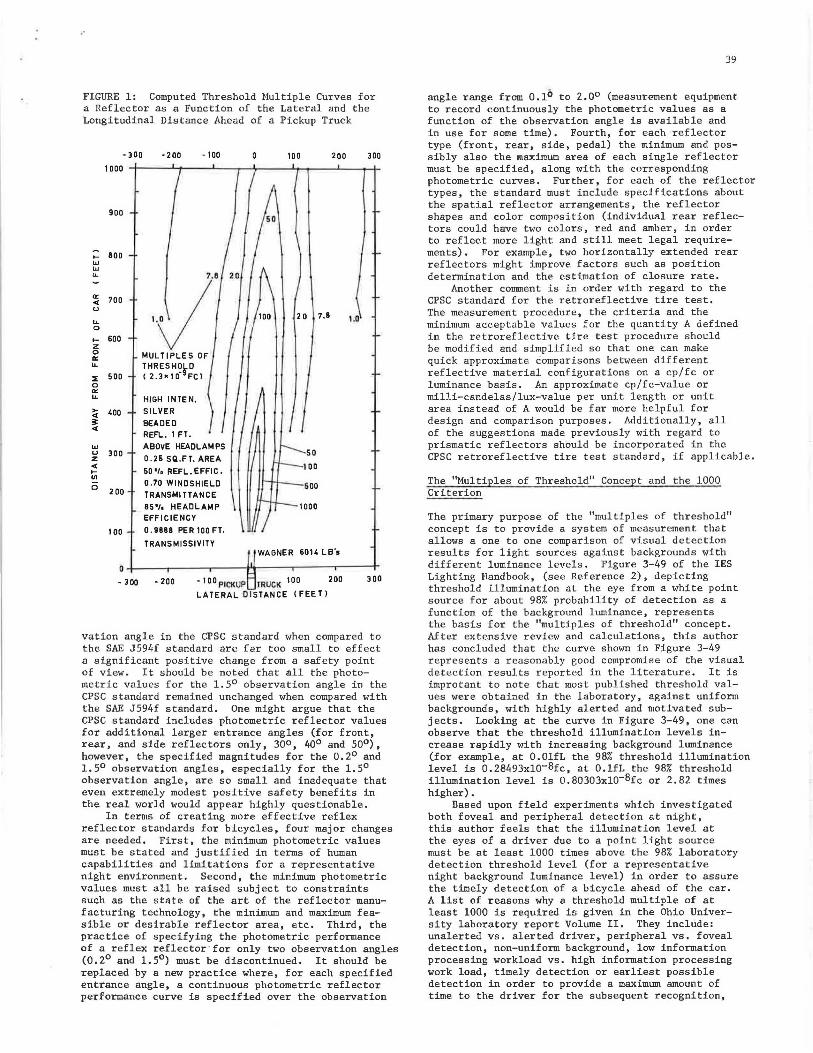
FIGURE 1: Computed Threshold Multiple Curves for a Reflector as a Function of the Lateral and the Longitudinal Distance Ahead of a Pickup Truck
1000
900
.... 800 LU LU u.
~ 700 u
u. 0
.... 600 z 0
"' u.
::E 500 0
"' ... ~ 400 ;;:: <(
LU u 300 z <( ... UJ
• 300 ·200 . 100
. v· MULTIPLES OF THRESHOfD C 2. 3 x 1 o· FC)
HIGH INTEN.
SILVER
BEADED REFL . 1 FT .
D 200
ABOVE HEADLAMPS
0 . 25 SQ .FT. AREA
50 •/, REFL . EFFIC •
0.70 WINDSHIELD
TRANSMITTANCE
85'1• HEADLAMP EFFICIENCY
100 0 . 9888 PER 100 FT.
TRANSMISSIVITY
100
2 0 7.8
50
1 00
500
1000
200
WAGNER 6014 LB's
300
1.0
o-+-~~..-~~-.-~~-+'11--~~.-~~-.~~-r
• 3 DO • 200 • lDD PlCKUP TRUCK lOO LATERAL D ISTANCE CFEET)
200 300
vation angle in the CPSC standard when compared to the SAE JS94f standard are far too small to effect a significant positive change from a safety point of view. It should be noted that all the photometric values for the l.S0 observation angle in the CPSC standard remained unchanged when compared with the SAE JS94f standard. One might argue that the CPSC standard includes photometric reflector values for additional larger entrance angles (for front, rear, and side reflectors only, 300, 40° and so0 ),
however, the specified magnitudes for the 0.2° and l.S0 observation angles, especially for the l.S0
observation angle, are so small and inadequate that even extremely modest positive safety benefits in the real world would appear highly questionable.
In terms of creating more effective reflex reflector standards for bicycles, four major changes are needed. First, the minimum photometric values must be stated and justified in terms of human capabilities and limitations for a representative night environment. Second, the minimum photometric values must all be raised subject to constraints such as the state of the art of the reflector manufacturing technology, the minimum and maximum feasible or desirable reflector area, etc. Third, the practice of specifying the photometric performance of a reflex reflector · for only two observation angles (0.2° and l.S0) must be discontinued. It should be replaced by a new practice where, for each specified entrance angle, a continuous photometric reflector performance curve is specified over the observation
39
angle range from O.lo to 2.0° (measurement equipment to record continuously the photometric values as a function of the observation angle is available and in use for some time). Fourth, for each reflector type (front, rear, side, pedal) the minimum and possibly also the maximum area of each single reflector must be specified, along with the corresponding photometric curves. Further, for each of the reflector types, the standard must include specifications about the spatial reflector arrangements, the reflector shapes and color composition (individual rear reflectors could have two colors, red and amber, in order to reflect more light and still meet legal requirements). For example, two horizontally extended rear reflectors might improve factors such as position determination and the estimation of closure rate .
Another conunent is in order with regard to the CPSC standard for the retroreflective tire test. The measurement procedure, the criteria and the minimum acceptable values for the quantity A defined in the retroref lective tire test procedure should be modified and simplified so that one can make quick approximate comparisons between different reflective material configurations on a cp/fc or luminance basis. An approximate cp/fc-value or milJ.i-candelas/lux-value per unit length or unit area instead of A would be far more helpful for design and comparison purposes. Additionally, all of the suggestions made previously with regard to prismatic reflectors should be incorporated in the CPSC retroreflective tire test standard, if applicable.
The "Multiples of Threshold" Concept and the 1000 Criterion
The primary purpose of the "multiples of threshold" concept is to provide a system of measurement that allows a one to one comparison of visual detection results for light sources against backgrounds with different luminance levels. Figure 3-49 of the IES Lighting Handbook, (see Reference 2), depicting threshold illumination at the eye from a white point source for about 98% probability of detection as a function of the background luminance, represents the basis for the "multiples of threshold" concept. After extensive review and calculations, this author has concluded that the curve shown in Figure 3-49 represents a reasonably good compromise of the visual detection results reported in the literature. It is improtant to note that most published threshold values were obtained in the laboratory, against uniform backgrounds, with highly alerted and motivated subjects. Looking at the curve in Figure 3-49, one can observe that the threshold illumination levels increase rapidly with increasing background luminance (for example, at O.OlfL the 98% threshold illumination level is 0.28493xlo-8fc, at O.lfL the 98% threshold illumination level is 0.80303xl0-8fc or 2.82 times higher).
Based upon field experiments which investigated both foveal and peripheral detection at night, this author feels that the illumination level at the eyes of a driver due to a point light source must be at least 1000 times above the 98% laboratory detection threshold level (for a representative night background luminance level) in order to assure the timely detection of a bicycle ahead of the car. A list of reasons why a threshold multiple of at least 1000 is required is given in the Ohio University laboratory report Volume II. They include: unalerted vs. alerted driver, peripheral vs. foveal detection, non-uniform background, low information processing workload vs. high information processing work load, timely detection or earliest possible detection in order to provide a maximum amount of time to the driver for the subsequent recognition,

40
decision and control action phases, environmental factors such as fog or rain, other traffic, age effects, CO, drugs including alcohol effects, dirt on headlamps and/or inside-outside windshield, etc. The 1000 times above laboratory threshold illumination level criterion requires (for a representative night driving background luminance level of O.OlfL) 2.85x10⁻⁶fc, or 3.07xlo-5lux, or 79.4 miles candles, or 30.7km candles. Using a representative background luminance of O.OlfL, a transmissivity value of 0.99 per 100 feet (clear to light haze), the 1000 times above laboratory threshold would be obtained by a light source of 2cp intensity located 805 feet away. In light fog (transmissivity 0.88), the corresponding distance would be 579 feet. Considering the present state of the art about decision sight distance requirements (for 50mph design speed 750-1025 feet, for 60mph design speed 1000-1275 feet, "Decision Sight Distance for Highway Design and Traffic Control Requirements," (11), the 1000 times threshold multiple is certainly no~excessive or unrealistic and actually a rather modest proposal. Further, looking at Figure 21, p. 816, of Breckenridge's and Douglas' publication dealing with the "Development of Approach-and Contact-Light Systems" (Illumination Engineering, November, 1945) the 1000 times above threshold value for O.OlfL background luminance lies between the human brilliancy ratings of "satisfactory'' and "bright". Here, illumination levels corresponding to the brilliancy ratings form a geometric series, the brilliancy scale goes from visible, faint, weak, satisfactory, bright, glaring, to blinding and the increase of one step in the rating required about a fourfold increase in the illumination level at the eyes of the observers.
Foveal vs. Peripheral Detection
Figure 2 illustrates typical eye fixation locations for a driver when driving on a straight level two-lane rural road at night with low be~ms, from data recently recorded and analyzed at Ohio University. Looking at Figure 2, one can observe that in spite of the severly limited richness of the visual scene at night there exists quite a dispersion among the eye fixations both in the horizontal and vertical directions (the spatial dispersions of the eye fixations are somewhat larger when driving through curves). Therefore, the initial detection of a bicycle with a bicyclist on the road ahead will most likely occur peripherally, rather than foveally. The results from a number of field detection experiments conducted at Ohio University indicate that the illumination detection thresholds are lowest for foveal detection and increase (U-shape) with increasing distance away from the fovea (both nasal and temporal). For example, at -10 degrees (left) in the periphery the illumination detection thresholds are on the average about 2 to 40 times higher than at the fovea. It should be noted that all field experiments employed highly alerted drivers who had no other task than to detect an approaching bicycle with a specific reflector arrangement.
It is common knowledge that a high visual workload and a high information processing level, as exist when a driver negotiates a curve, have detrimental effects upon the peripheral detection of visual stimuli. For these reasons, any field studies dealing with the nighttime detection of bicycles must include the measurement of a driver's peripheral detection capabilities along with the foveal detection capabilities. Further, when investigating a driver's recognition capabilities, peripheral recognition capability must be investigated along with foveal recognition capability. A peripheral angle of 10 or 15 degrees might be the most repre-
sentative angle at which a driver's peripheral performance (detection and/or recognition) ought to be investigated for night driving conditions.
The Neecl for an Adequate Bicycl e Taillight in Add i t i on to Adequate Reflectors
A bicyclist with a bicycle outfitted with the best state of the art reflectors and reflector arrangement is still at the mercy of the motorist. Reflectors are a passive system of illumination and if the headlights of a car are misaimed, covered with dirt, or even worse, i f the left headlight is burned out, the reflectors may not return enough light to assure timely detection, timely recognition, etc. An energized lighting system (taillight) also has an advantage in sharp vertical or horizontal curves , where the reflector performance at higher entrance angles is considerably lower. Again, any standard for an energized vehicle or bicycle rear lighting system must be expressed or justified in terms of human visual detection capabilities and a threshold has been proposed.
In the context of the earlier discussed decision sight distance requirements, a distance of 800 f eet (approximately 10 seconds driving time at 55 mph) has been selected as a representative detection distance value. Figure 3 indicates that to meet the 800 feet detection distance and the threshold multiple of 1000 criteria in relatively clear weather (transmissivity 0 . 99 per 100 feet), with a representative background with a luminance level of O.OlfL, a 2cp light source is needed. Since the taillight would be red, the actual candlepower of the bulb behind the red lens would have to be Sep. The SAE J585e standard for taillarnps (rear position lamps) specifies a minimum candlepower requirement of 2.0cp for H-V and a maximum of 18cp at H or above. Actually most automobile taillamps "run" at around 8cp. Table 1 proposes minimum cp-values specified in the SAE .T5$5e st1.1nd1.1rn .
There is no reason why a bicyclist should not enjoy "equality" on the road in terms of the minimum cp-values for a taillight. While these values appear rather high, especially considering what has been available in the past, a specifically designed highly efficient sealed beam taillamp using about 1 watt of power (about one third of generator output) could probably meet the proposed minimum requirements. This author feels that in the past, too large a fraction of the power output by the generator has been used for the bicycle headlamp and too small a fraction has been used for the taillamp. It is hoped that future energized bicycle lighting systems will be so designed that both forward and rearward visibility needs are considered. Using up to 40% of a generator's output for the taillight would not be excessive and not too detrimental to the front visibility needs.
Some Compute r Model Results of 11!~.!.l!.ating Ni gh t time Detection of Reflectorized Obj ec t s
Input for this FORTRAN computer model consists of: 1) geometric input related to the road geometry (straight or curved), 2) car dimensions including headlamp aim and driver eye position, 3) background luminance and corresponding minimum 98% detection threshold, 4) transmissivity value of the atmosphere, 5) reflector area, position and orientation, 6) cp-matrix (horizontal and vertical) for beam pattern, and 7) cp/fc/area-matrix for reflector (as a function of observation and entrance angles.
The output consists of a number of selected distance values ahead of the car for which the following variable values are printed out: 1) observation

FIGURE 2: Driver Eye Fixation Plot for Night Driving
- .00 - . 00 -11.00 DEGREES
- .00 o.oo 2.00 11.00 11.00
+ < 1 %
D :1°/o g "' DRIVER D. 8., EYE HEIGHT 3 .75 FEET, N =113 FIXATIONS
STRAIGHT LEVEL TWO-LANE ROAD, SIX 800 FEET SECTIONS
AVERAGE SPEED 44 MPH. NIGHT DRIVING. 4000 LOW BEAMS ~ AVG. X-DIRECTION -0 .18° I STD. DEV. 2.62°
AVG. Y-DIRECTION -1.84° ,STD.DEV. 1.35° AVG. FOVEAL PREVIEW DISTANCE 117 FEET
(()
:tl8 IC • c:>"' IU 0
FIXATION TIME DURATIONS: AVG . 0 .46s, STD.DEV . 0.34s
+ + +
e.oo 10 0
-Cl
.,;
s + a+ a + 8 ci+-~~~~~~~~~~~~~~~~'="'~~~~~~~~~~~~~~~~~-+ci
+ ,a a a + a I
+ I + a I
I
+
+ +
+ i N I
Iii ,+. + i ;~· ~~--.~~~r-~~-.L--~~...-~~....--~~.......-~~-.-~~~~~~~~--+m -10.uo -II.OD - II.DO -'1.00 -z.oo Q_ • .!10 z.oo 'I.DO 11.00 II.DD 10.
100
DEGREES
FIGURE 3: Detection Distances for Point Light Sources for Selected Threshold Multiples as a Function of Source Intensity
... LLI LLI LL
LLI u z
"' ... "' a z 0 ... tJ LLI
t;j 103 c
MIN . 98'/o DETECTION THRESHOLD 2 .U93• 10-9FC
BACKGROUND LUMINANCE: D. 01 Fl
TRANSMISSIVITY: 0.99 PER 100 FEET
SOURCE INTENSITY (CPl
41

42
TABLE 1: Proposed Minimum Design Candlepower Requirements for Bicycle Taillamps (Improved SAE JS8Se Standard)
Test Points, Candlepower degrees (for One Section Taillamp)
Vertical Horizontal
lOU lOL 1.2 and v 1.6 lOD lOR 1. 2
20L 1.2 lOL 1.6
SU SL 2.0 and v 2.0
SD SR 2.0 lOR 1.6 20R 1.2
20L 1.6 lOL 2.0
SL 2.0 H v 2.0
SR 2.0 lOR 2.0 20R 1.6
Note: The SAE JS8Se standard does also specify that the signal from lamps on both sides of the vehicle shall be visible through a horizontal angle from 4S degrees to the right. To be considered visible, the lamp must provide an unobstructed projected illuminated area of the outer lens surface, excluding reflex, at least 2 square inches 912.5cm2) in extent, measured at 4S degrees to the longitutinsl axis of the vehicle.
With regard to the proposed bicycle taillamp standard the above specification of the SAE JS8Se standard ought to be stated in a different way and as follows: 1) the maximum horizontal angle of 4S0
ought to be at least doubled, 2) at additional selected test points such as ·t 45° and + 90o horizontal and -100, oo and 10° vertical candf;power values ought to be specified (in the range from 0.1 to 0.3cp), and 3) as recommended in a previous section for the reflectors, all candlepower values could be specified as continuous curves (rather than for single points) for selected horizontal and/or vertical angles.
angle for left headlamp and for right headlamp, 2) entrance angle for headlamp and for right headlamp, 3) candlepower value for left headlamp and for right headlamp, 4) illumination at reflector due to left headlamp and due to right headlamp, S) cp-value at reflector due to left headlamp and due to right headlamp, 6) total illumination at the eyes of the driver, and 7) number of times illumination at the driver's. eyes is above the minimum 98% threshold value,
The model does not use any geometric simplif ications or approximations and can handle one or more headlamps. Any headlamp type and reflector material (prismatic or beaded reflectors) can be investigated, provided that adequate information about the beam pattern (isocandela distribution and/or cp-matrix) and the reflector material (cp/fc/area or cp/fc
curve as a function of observation angle for selected entrance angles and/or cp/fc/area or cp/fc matrix) is available. Additional information about the model, beam patterns, reflector matrices and selected analyzed nighttime detection situations can be found in Volume I of the O.U. report.
Table 2 illustrates one type of program output. Reflector performance is given as a function of the distance ahead of the vehicle, in this case a pickup truck with two type 6014 low beam headlamps. The reflector ahead of the vehicle is positioned along a curve section with a radius of 1438.lS feet with the reflector optical axis tangential to the arc. The distance ahead of the vehicle is defined as the shortest distance between the front of the vehicle (center of car between the two headlamps) and the position of the reflector. The selected measure of reflector performance is the number expressing how many times the illumination due to the reflector at the eyes of a driver is above the minimum 98% laboratory detection threshold level, for a representative background luminance of O.OOlfL. The last column in Table 2 shows that the threshold multiples decrease in an exponential fashion as the distance ahead of the vehicle increases. Table 2 also illustrates that an observation angle of 0.2° or smaller is reached only at distances above 800 feet (LHL 820 feet).
Table 2 illustrates clearly that reflectors must perform weil not only at an observation angle of 0.2° but also at somewhat larger observation angles, for instance, up to 0.8°. It is hoped that future prismatic reflectors will be <lesigned so that some of the present high optical performance within the observation angle range from 0° to O. 2 is "shifted" into the observatioti angle range from 0.2° to 0.8°. While this would improve performance in that range, increased reflector area and :iJDproved reflector quality will probably produce the major performance improvements.
It should be noted that the observation angles used in Table 2 are relatively large, because the vehicle assumed is a pickup truck rather than a car. For a car, using a 3.7S feet eye height, an observation angle for the left headlamp (LHL) of 0.2° or less is obtained for distances above 460 feet. The larger observation angles obtained for a pickup truck are due to the longer vertical distance between the eyes and the headlamp (34. S" for pickup vs. 19.S" for car). It should also be noted that the reflector performance in left curves is worse than in right curves and on straight roads when driving with low beams, since the low beams are slightly aimed down and to the right (to reduce glare to the oncoming motorist). For example the 6014 low beam pattern used to compute the results has its "hottest point" (2601Scp) 2. o0 down and 2.so to the right.
The table also shows that the cp-values for the left and right low beam headlamps for any distance ahead in the left curve are rather modest, between one and two orders of magnitude smaller when compared with the "hottest point" (2601Scp). One can observe too that the entrance angles for the left and right headlamps, after an initial dip between 70 to 100 feet, increase in a linear fashion with increasing distance (these entrance angles would get smaller and smaller exponentially with increasing distance for a straight road). While the entrance angles are sensitive to horizontal curvature, the observation angles show only relative small changes and are not that sensitive to horizontal curvature. For example, for a straight road at 70 feet, the entrance angles for LHL and RHL are both 2.060 (3.4S0 and 0.69° for 1438') and the observation angles for LHL and RHL are 2.4S0

43
TABLE 2: Reflector Performance as a Function of Distance Ahead of the Vehicle
C/JRVATIJRE OF ROAD TO LEFT: H3R. 15 FT . DACKGROllND LllMINANCr:: 0.00 1 Fl.. TRA ll.;HSS I VITY: o.~q PF.n 100 FT . REPLEC TOR T YPE & CO LOR : WIDB ANG!.£ RED RF.-200 RH LEC TOR , 6 . 16 ~QUAf•F. I NC !ll':S Aild, ;ntt. THRESllOI.n 2 . HF.-09 re . AEAM PATTERN : TWO 60 1 ~ LOW il EA ~s RF.FLECTOR HEIG HT mo.~ GROU~O !.EVEL : 2g lN. ~PSILON :O . HEIGHT OF HF.AO LAll PS F ROM GROONO L EVEL :2.125 FT . DISTANCE UETWEE N ll E A DLA~P·; : o . O F'T' . EY E !IEIGll'f :5. 0 FT . DISTA NCE BETWEE N ~YE g CAR AXI S : 1 .25 FT. OI ST ANCE DET l!f.EN EYE AND rnc •• T OF CAH :6.0 FT • • P fCKU P 'T'H! IC K. UH ANG LE OF rn-C IJRV E HEADL A~P IN llORIZONTA L PLA~ F. :O. ATM ANGLE OF 011 '1'- CUUVE HEADLAMP I N ll OPIZO NTH PUN[ : O. AI M ANG LE OF I N-CijUVE HEADLA.~ P IN VERTICAL PLANE :O. AI~ ANGL E OF 01/T-C'IRVE llEADi,A ;1p IN VERTICU PLANE : Q.
DIST OBS. ANGLE ENTR. ANGLE CANDLE POWER ILLU~. AT REPL REFL. CP ILLU~. NO: OF ANCE LHL RffL LHL Rift LHL RHL LllL RffL LHL RHL AT EYP. TIMES PEET PC FC PC THRESHOLD
40 4. lO 5 .36 4. 40 2.81 2619.64 539. 64 1.751305 0.334017 0.258869 0.041688 0. 140 9 E-03 61274.41 70 2.40 3.79 3.45 0.69 2499.02 6 42. 97 0.506655 0.129903 0.083186 0.016001 O. 1703E-04 7404.62
100 1.69 2. 71 3. 43 0.59 1249.26 662. 72 0.123BH 0.065453 0. 023 574 O.OOB914 0.2B61E-05 1243.95 130 1. JO 2. 12 3.69 1.50 991.61 650. 19 0.057994 0.0.17904 O.OH119 0. 00593 9 0.1070£-05 465.]0 160 1.06 1. 7 5 4.08 2.30 798.40 627. 04 o. 030736 0.0 24055 0.010921 0.004297 0.5435E-06 236.JO 190 o. B9 1. 4 9 4. 54 ].04 715. 44 609. BO 0.019474 0.016541 0.010785 o. 00333 3 ,0• 360 6E-06 156.78 220 o. 75 1 .31 5. 04 .l. 74 660.02 589. 23 0.013360 0.0118B5 0.010736 0.0028B9 0.2610E-06 113.47 250 o. 67 1. 16 5.56 4.42 620.54 570. 26 0.009698 0.008iJB1 0.0108B6 0. 00 2 64 9 0.2015P.-06 01.5q 280 o. 5 9 1.05 6.10 5.0B 5 90.B4 54 9. 92 0.0073)9 o. 006B07 0.01065B o. 002533 O. 156 8E-06 6 8 . 19 310 o. 54 0.96 6.65 5. 73 566.16 526. 64 0.005720 0.005304 0 . 010967 o. 00253 3 o. 131 lE-0 6 57.00 340 0.4 9 0.88 7. 21 6. 37 539. 97 522.34 0.004522 0.004359 0.010769 0.002576 0.1078E-06 4 6 .86 .l70 o. 45 0.82 7. 77 7.01 513. 0 6 551.65 0.003617 0.003875 0.010614 o. 00 2 716 O. 90A9E-07 39.52 400 o. 41 0.76 8.35 7.64 545.61 512. 17 0.001281 0.003069 0.011196 o. 002603 D. 804 5E-07 34.98 430 0. 3 8 0.72 A.93 8.27 524. 70 4 26. 61 0.002722 0.002206 o.011on o. 00 2 207 0. 6706E-07 2 9 .16 460 o. 36 0. 6 B 9. 51 B.90 431. 74 433. 64 o. 001952 0.001953 0.009363 o. 002274 0.5120E-07 22. 2 6 490 o. )J 0. 6 4 10.10 9.52 434.36 440.36 0.001725 0.001743 0.008811 0.002319 0. 4309E-07 18.74 5 2 0 o. 31 0.61 10.69 10. 14 435.43 375. 78 0.001531 0.001317 0.008727 0.001585 0. 35) qp,-07 15 . 3 9 550 O. JO o. 5 8 11. 20 10. 77 3 67.00 .149. 31 0.001150 0.001091 0.007279 0.001457 0.2676E-07 11. 63 580 o. 28 0.56 11. 88 11. 3 9 352.66 366. 37 0.000991 0.001026 0.007228 o. 001500 0.23991'!-07 10.4) 610 0. 27 o. 53 12. 47 12. 01 369.07 335. 87 0.000935 0.000847 0.007647 0.001337 0.2228E-07 9.69 640 o. 26 o . 5 1 13.07 12.64 324. 11 299. 34 0.000743 0.000584 0.006692 0.0011 5 0 0. 1763E-07 7.67 670 0.24 0. 4 9 13.68 13. 26 303.06 J 11. 14 o. 000632 0.000647 0.006174 0.001195 0. 1509E-07 6.56 700 o. 2] 0.48 14. 26 1].69 315. ]J 302. 03 o. 000601 0.000573 0.006 293 0.001226 0.14 07E-07 6 . 12 710 0.23 0.46 '14. 89 14.51 28 9 .59 268. 17 0.000506 0. 0 004 6 7 0.005614 0.001125 0. 116 lE-07 5.05 760 0.22 0.45 15.50 15. 14 OUT OF RANGE OF THE Cp '!'ABLE 790 o. 21 o. 43 16.12 15. 77 OUT OF RANGE OF THE CP TABLE R20 o. 20 0.42 16. 7) 16.40 OUT OF RAYGE OF THE CP TABLE 850 0.20 0. 4 1 11. 35 17. 03 OU T OF HNGE OP THE CP TABLE 880 o. 19 o. 4 0 17. 97 17.66 OUT OP RANGE OF THE CP TABLE 910 0. 19 0.3 9 18.59 18. 29 OOT OP RANGE OP THE CP TABLE 940 o. 18 O. 3 8 19. 22 18.9] OUT OP RANGE DP THE CP TABLE
and 3.70°, (2.40° and 3.79° for 1438'), 340 feet, the entrance angles for LHL and RHL are both 0.42° (7.21° and 6.37° for 1438') and the observation angles for LHL and RHL are o.s2° and 0.79° (0.49° and 0.88° for 1438').
The 6014 low beam pattern used to obtain the results in Tables 2 and 3 is based upon actual laboratory measurements of 20 GE 6014 low beam headlamps (each cp-matrix value represents the average of 20 measurements). A comparison between the isocandela distribution for the averaged actual data and the isocandela distribution given in GE drawing 381.B.1478 indicates that the averaged actual pattern is shifted 0.5° further down than GE pattern (i.e. "hottest point" in averaged actual data is 2° down while "hottest point" for GE data is only l.S0 down). With the exception of the o.s0
vertical shift of the whole beam pattern, the isocandela curves for the averaged actual data and the GE data compare reasonably well with each other.
The reflector values used to represent the optical performance of the red "cat eye" RR-280 wide angle reflector will be briefly described below. For an entrance an~le of o0 and observation angles of 0.1°, 0.2°, 0.3 • o.s0 , 0.8° and l.S0 the cp/fc values (actually measured) are: 19.0, 9.3, S.4, 1.9, 0.61 and a.18. For an entrance angle of 2a0 and observation angles of 0.1°, 0.2°, 0.3°, o.s0 , 0.8° and l.S0 the cp/fc values (actually measured) are: 10.4, 6.lS, 3.70, l.3S, 0.43 and a.08. The reflector values used to represent the optical performanc e of the amber RR-0218 pedal reflectors (see Table 3) will be briefly described below. For an entrance angle of a0 and observation angles of a.1°, 0.2°, 0.3°, a.s0 , a.8° and l.S0 , the cp/fc values (actually measured) are: 8.3, 7.6, 6.4, 4.a, 2,lf and 1.07.
For an entrance angle of 2a0 and observation angles of a.1°, a.2°, 0.3°, 0.5°, a.8° and 1. 5°, t.he measured cp/fc values are: 3.9, 3.4, 2.8, 1.5, O.S7 and a .18S. These values are based on the 1. 2 square inch reflector area of one pedal. The computer model assumes two static pedal reflectors of about 2 square inch area.
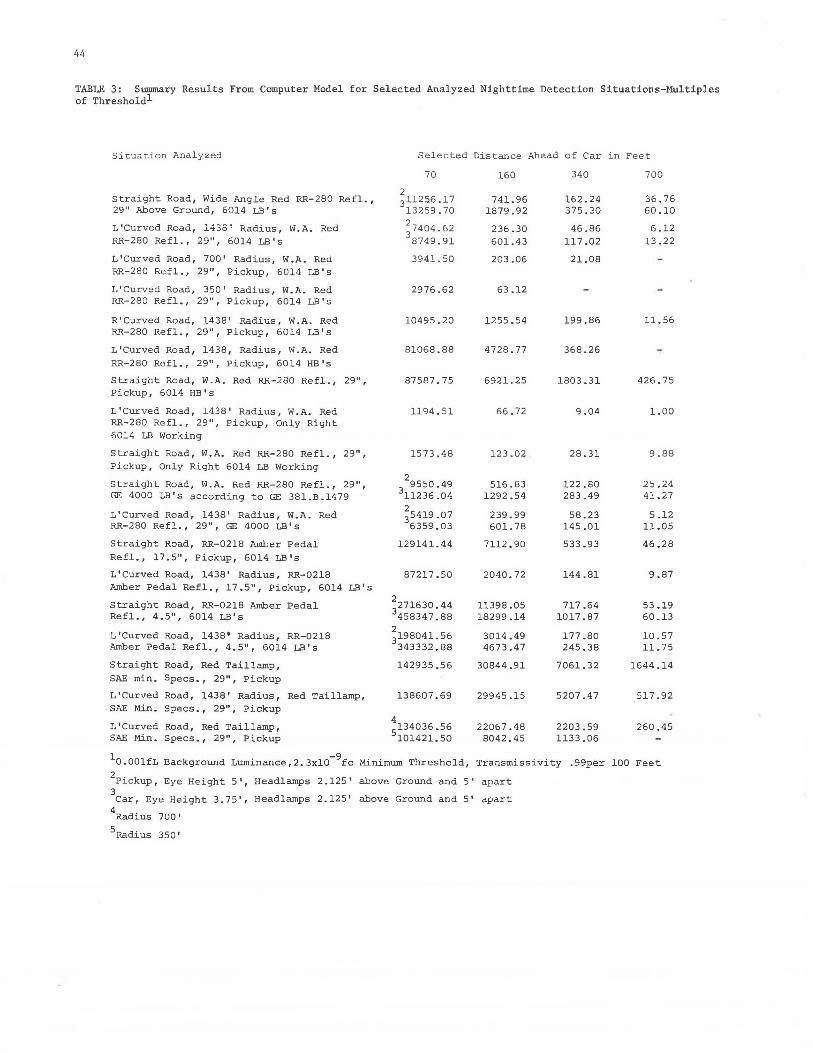
Table 3 presents summary results for selected nighttime' detection situations. Four distances ahead of the vehicle (70, 160, 340, 700 feet) were chosen to provide insight into the nature of the nighttime detection problem. In all instances, the points are taken from smooth monotonically decreasing curves, thus making interpolation within the given range from 70 to 70a feet feasible. All results given in Tables 2 and 3 are based upon head-· lamps operating at 100% efficiency and vehicle windshields transmitting 100% of the light. The mini mum 98% laborator9 detection threshold level is assumed to be 2.3xl0- fc (for a background luminance level of approximately O.OOlfL). If one is interested in obtaining multiples of threshold for a O.OlfL background luminance level (2.8493xlQ-9fc) one might simply multiply the multiples of threshold given in Table 2 and 3 by 0.8072. Table 3 also contains infonnation about the performance of a red taillamp operating at the SAE minimum specified cp-values (see SAE JS8Se using a special model.)
Table 3 shows clearly the increased nighttime danger of driving a pickup truck, of driving through sharp left-curved roads and the extreme danger of driving with only the right low beam headlamp working. The table further indicates the relative superiority of amber pedal reflectors and the superiority of a red taillamp operating at the SAE J58Se minimum specified cp-values. The superiority of the
44
TABLE 3: Summary Results From Computer Model for Selected Analyzed Nighttime Detection Situations-Multiples of Thresholdl
Situa tion Ana lyzed Selected Distance Ahead of Car in Fe et
Straight Road, Wide Angle Red RR-280 Refl., 29" Above Ground, 6014 LB' s
L'Curved Road, 1438' Radius, W.A. Red RR-280 Re fl., 29", 6014 LB' s
L'Curved Road, 700' Radius, W.A. Red RR-280 Refl., 29", Pickup, 6014 LB's
L'Curved Road, 350' Radius, W.A. Red RR-280 Refl., 29", Pickup, 6014 LB's
R'Curved Road, 1438' Radius, W.A. Red RR-280 Refl., 29", Pickup, 6014 LB's
L'Curved Road, 1438, Radius, W.A. Red RR-280 Refl., 29", Pickup, 6014 HB 's
Straight Road, W .A. Red RR-280 Refl., 29", Pickup, 6014 HB's
L'Curved Road, 1438' Radius, W.A. Red RR-280 Refl., 29", Pickup, Only Right 6014 LB Working
Straight Road, W.A. Red RR-280 Refl., 29" I
Pickup, Only Right 6014 LB Working
Straight Road, W.A. Red RR-280 Refl., 29", GE 4000 LB's according to GE 381.B.1479
L'Curved Road, 1438' Radius, W. A. Red RR-280 Refl., 29", GE 4000 LB' s
Straight Road, RR-0218 Amber Pedal Refl., 17.S", Pickup, 6014 LB's
L'Curved Road, 1438' Radius, RR-0218 Amber Pedal Refl., 17.S", Pickup, 6014 LB's
Straight Road, RR-0218 Amber Pedal Refl., 4.S", 6014 LB's
L'Curved Road, 1438' Radius, RR-0218 Amber Pedal Refl., 4. S", 6014 LB' s
Straight Road, Red Taillamp, SAE min. Specs., 29", Pickup
L'Curved Road, 1438' Radius, Red Taillamp, SAE Min. Specs., 29", Pickup
L'Curved Road, Red Taillamp, SAE Min. Specs., 29", Pickup
70
2 311256.17
1 3259.70
~7404. 62 874 9 . 9 1
3941.50
2976.62
10495.20
81068.88
87587.75
119 4. 5 1
1S73 . 48
29SS0.49
3ll236.04 2 35419.07 6359.03
1 29141. 44
87217 .so
2271630.44
3458347.88
~198041.S6 343332.88
14293S.S6
138607 .69
:134036.S6 101421.50
160 340 700
741.96 162.24 36.76 1879.92 37S.30 60.10
236.30 46.86 6.12 601.43 ll7.02 13 .22
203.06 21.08
63 . 12
1255.54 199.86 ll.S6
4728.77 368.26
6921. 25 1803.31 426.7S
66.72 9.04 1.00
12 3 .02 28.31 9.88
Sl6.83 122.80 2S.24 1292.S4 283.49 41.27
239.99 S8.23 5.12 601.78 145.01 11.0S
7ll2.90 S33.93 46.28
2040. 72 144.81 9.87
11398 .OS 717.64 S3.19 18299.14 1017.87 60.13
3014.49 177 .80 l0.S7 4673.47 24S.38 11. 7S
30844.91 7061.32 1644.14
29945.lS S207.47 Sl7.92
22067.48 2203.59 260.4S 8042.45 ll33.06
10.00lfL Background Luminance,2.3xl0-
9fc Minimum Threshold, Transmissivity .99per 100 Feet
2Pickup, Eye Height S', Headlamps 2.12S' above Ground and S' apart
3 Car, Eye Height 3.7S', Headlamps 2.12S' above Ground and S' apart
4Radius 700'
SRadius 3SO'

.·
red taillamp over the reflectors would be even more pronounced if the cp-values proposed in Table 3 were used in the calculations, especially for left and right curve situations.
Summary Resul ts of Nightt ime Detection Field Studies
The objective of this section is to present briefly a typical field study and a few selected results from the O.U. detection studies, The field study selected deals with the question of "massed" vs. "distributed" reflectorization. The objective was to test, for both foveal and peripheral detection, whether Cook's statement (p. 69, Reference S) that massed reflectors were better than separate small patches was true.
A. Reflectors and Arrangement Two pairs of photometrically matched amber
bicycle pedal reflectors (#17SO, Signal Products Division) were used. For an entrance angle of o0 and observation angles of 0.10, 0.20, 0.3°, a.so, o.s0 and l.S0 the typical cp/fc values (actually measured) of one #17SO pedal reflector are: 10.3S, 9.7S, 6.40, 3.20, 1.99 and 0.41. For an entrance angle of 20° and observation angles of 0,10, 0.2°, 0.3°, o.s0 , o.s0 and l.s0 the typical cp/fc values (actually measured) of one #17SO pedal reflector are: 4.40, 4.40, 3.SO, l.7S, O.SS and 0.2SS. For the "massed" experimental condition, the two pedal reflectors were fastened close together (longer side parallel to ground, one above the other) on a special bicycle fixture (flat black) extending beyond the front wheel of the test bicycle. The cent~r of the two pedal reflectors c9incided with the vertical axis of the bicycle and was 11 inches above the ground. For the "distributed" experimental condition two other pedal reflectors were fastened (longer side parallel to ground) at the ends of a horizontal bar of the special bicycle fixture, each reflector being 20 inches away from the vertical bicycle axis (total horizontal distance between the two pedal reflectors 40", height above ground 11"). No other reflectors were visible on the test bicycle when viewed from the front.
B. Test Car The test car was a 1976 Ford LTD with type
4000 low beams. Photometric measurements of the beam patterns and the background were taken with a Pritchard photometer. The dry concrete surface straight ahead of the car at 16S feet had luminance values from O.OlS to 0.029fL, at 43S feet from 0.012 to O.OlSfL, at SSS feet from 0.011 to 0.016fL, and the sky close to the horizon from O.OOS to O.OlSfL depending upon car heading angle, moon size and position and extent of cloud cover.
C. Test Site The test site was unused 7S feet wide con
crete airport runway located at the edge of a small city and a small shopping mall. A two-lane state highway with moderate traffic is located parallel (about 2SO feet away) to the runway. A number of luminaires and a few lighted advertising signs were within the field of view of the subjects (mainly in left periphery along highway).
D. Subjects Two groups of five subjects each were used.
The five subjects in the first group were tested only with the "massed" reflectors, while the five subjects in the second group were tested only with "distributed" reflectors. All subjects appeared to be well motivated, adequately dark adapted and highly alerted. They had nothing to do but detect
4S
the approaching bicycle with the reflectors (i.e., low visual workload and low information processing load). All subjects had valid driver licences and many were students.
E. Procedure The bicycle approached the stationary test
car (with about lOmph) from the dark along one of three paths parallel to the runway axis. The front center of the test car was placed above the center line of the runway. Looking forward from the car, path 1 was 12.S feet to the left of center, Path 2 was 6.2S feet to the right of center (fairly representative lateral position for a bicycle ahead of a car on a straight road) and path 3 was 2S feet to the right of center. Paths 2 and 3 were included to create some uncertainty with regard to detection location and to simulate curve situations.
The car heading angles were -100 (car axis aimed 10° to the left of the runway center line), o0 (car axis above runway axis), loo, 20° and 40° to the right of the runway axis. The different car heading angles were necessary to investigate the peripheral detection capabilities (subjects were instructed to look in the direction of the car axis), The order of presentation for car heading angles was random. All observations for a given car heading angle were made consecutively since it took some time and effort to correctly place the test car. Thus, for each car heading angle, subjects made 9 consecutive observations since there were 3 paths and the bicycle approached the test car 3 times on each path. The order of presentation for the three paths was random, subject to the requirement that each path had to have 3 approaches. Each subject had a total of 4S presentations (S car heading angles, 3 paths, 3 replications). The subjects, who sat comfortably in the stationary test car with low beams on and the engine in idle, were instructed to switch on the high beams for a moment as soon as they detect the reflectors and/or the approaching bicycle (the bicycle rider wore dark clothing and dark shoes).
A simple manual method was used to mark and record the detection distances. Four experimenters were used to conduct the detection experiments (one at test car, one on test bicycle, two to measure and record detection distances).
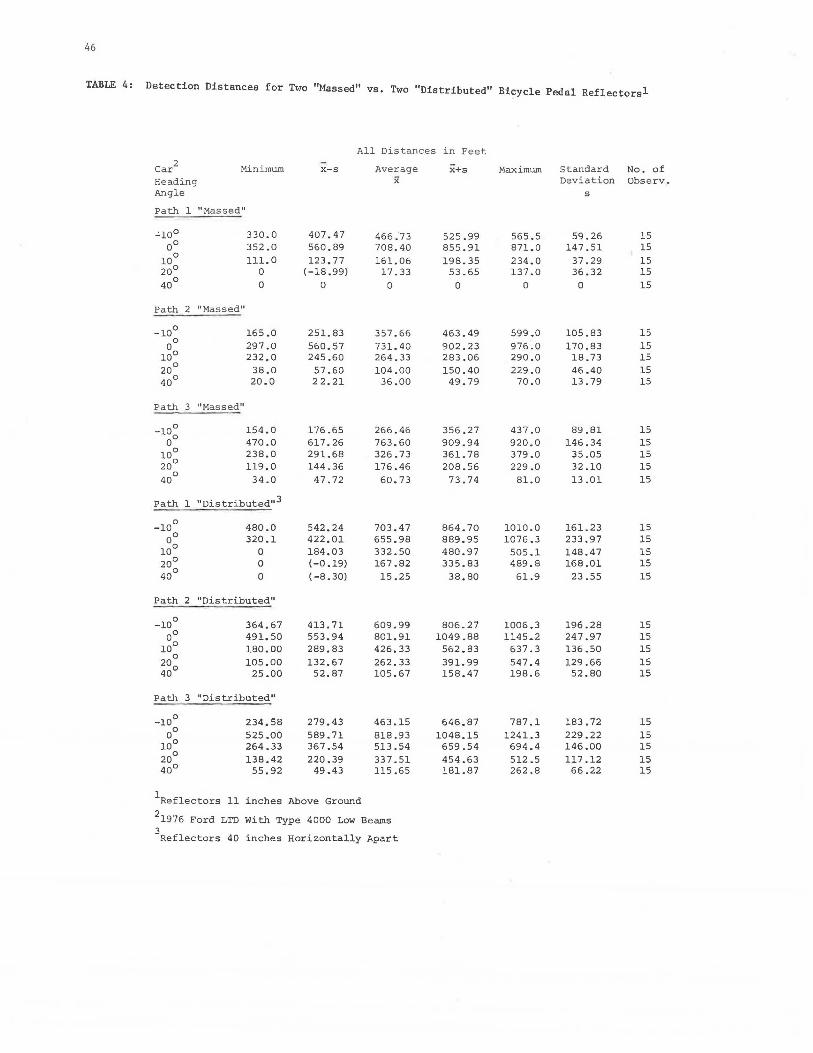
F. Results Table 4 provides the analyzed detection
distance statistics for the "massed" and the "distributed" reflector conditions. In general, the detection distance statistics for the "massed" condition are considerably shorter than the corresponding values for the "distributed" condition, especially for the peripheral angles.
These detection distance statistics have been further used as input into a FORTRAN program containing the appropriate beam pattern, reflector matrix, test car and driver dimensions, path geometry, representative background luminance and representative transmissivity value. This program calculates the visual detection angle and the threshold multiples, and produces the output for Figures 4 through S. These figures illustrate the typical relationships between the threshold multiples (plotted logarithmically) and peripheral visual detection angles for the "massed" and the "distributed" conditions.
The threshold multiples for the "massed" and for the "distributed" condition based upon the minimum, x-s, x, X+s and the maximum detection distance statistics, are shown in Figures 4 and S. The large range in threshold multiples between the minimum (most relevant from a safety point of view)
46
TABLE 4: Detection Distances for Two "Massed" vs. Two "Distributed" Bicycle Pedal Reflectorsl
All Distances in Feet
Car 2 Minimum Average x+s Maximum Standard No. of x-s
Heading x Deviation Observ. Angle s
Path l "Massed"
.:.10° 330.0 407.47 466.73 525.99 565.5 59.26 15 00 352.0 560.89 708.40 855.91 871.0 147.51 15
10° 111.0 123.77 161.06 198.35 234.0 37.29 15 20° 0 (-18.99) 17.33 53.65 137.0 36.32 15 40° 0 0 0 0 0 0 15
Path 2 11 Massed 11
-10° 165.0 251. 83 357.66 463.49 599.0 105.83 15 0
297.0 560.57 731.40 902.23 976.0 170.83 15 0 10° 232.0 245.60 264.33 283.06 290.0 18.73 15 20° 38.0 57.60 104.00 150.40 229.0 46.40 15 40° 20.0 2 2.21 36.00 49.79 70.0 13. 79 15
Path 3 "Massed"
-100 154.0 176.65 266.46 356.27 437.0 89.81 15 00 470.0 617.26 763.60 909.94 920.0 146.34 15
10° 238.0 291.68 326.73 361. 78 379.0 35.05 15 20° 119.0 144.36 176.46 208.56 229.0 32.10 15 40° 34.0 47.72 60.73 73.74 81.0 13 .01 15
Path l "Distributed" 3
-10 0
480.0 542.24 703.47 864.70 1010.0 161. 23 15 00 320.l 422.01 655.98 889.95 1076.3 233.97 15
10° 0 184.03 332.50 480.97 505.l 148.47 15 20° 0 (-0.19) 167.82 335.83 489.8 168.01 15 40° 0 (-8.30) 15.25 38.80 61.9 23.55 15
Path 2 "Distributed"
-10° 364.67 413.71 609.99 806.27 1006.3 196.28 15 00 491.50 553.94 801.91 1049.88 1145-2 247.97 15
10° 180.00 289.83 426.33 562.83 637.3 136.50 15 0
15 20 105.00 132.67 262.33 391. 99 547.4 129.66 40° 25.00 52.87 105.67 158.47 198.6 52.80 15
Path 3 "Distributed"
-10° 234.58 279.43 463.15 646.87 787.l 183.72 15 00 525.00 589. 71 818.93 1048.15 1241.3 229.22 15
10° 264.33 367.54 513.54 659.54 694.4 146.00 15 20° 138.42 220.39 337.51 454.63 512.5 117.12 15 40° 55,92 49.43 115 .65 181.87 262.8 66.22 15
1Reflectors 11 inches Above Ground
21976 Ford LTD With Type 4000 Low Beams 3 Reflectors 40 inches Horizontally Apart

.·
FIGURE 4: Multiples of Thresholds for Two "Massed" Bicycle Pedal Reflectors Based Upon Selected Detection Distance Statistics for Path 2 as a Function of the Peripheral Visual Detection Angle
T:0.99/100 FT L: 0.01 FL i
1 l I
'',,, \' ' , ...--·•MINIMUM
40 ~'\. , , \ ,
1 / '_,,. CETECTION
' '• ~ ,/ DISTANCE "', '-,, \ ' ./ i .. I
' ''\, '-·--~\'\ -
2Q• \' • • I
1\\ I 1·\ / -
1.(J•'\ \ • I x+ I
\\ \ / ' \•,\i / ~MAXIMUM
' I • \\ / /- 10" \\,',/ v o•
CAR HEADING ANGLE
1u° -4-~~~~ ....... ~~"T""~--+~~_,....~_..,..--~-1-
- 40 ·30 -20 -10 10 20 30 PERIPHERAL ANGLE <DEGREES>
and the maximum detection distance statistics is clear. The U-shape of the threshold multiples as a function of the peripheral visual angle is clearly visible. Figures 4 and 5 also show that the range of the threshold multiples extends from less than 10 to more than 105.
The curves in Figure 4 ("massed") are somewhat steeper than in Figure 5 ("distributed") indicating that, especially in the periphery, two "distributed" reflectors of equal total area are more easily detected than two similar "massed" reflectors. Figure 6, which shows the threshold multiple curves for the average detection distance statistics for "massed" vs. "distributed" reflector pairs, illustrates this phenomenon even more distinctively.
Figures 7 and 8 illustrate the threshold multiples for the average detection distance statistics for paths 1, 2 and 3 for "massed" vs. "distributed" reflectors. The threshold multiples differ little between paths 1, 2 and 3. Again, the threshold multiples curves for paths 1, 2, 3 are steeper for the "massed" reflectors than for the "distributed" reflectors. At the -10° peripheral angle (representative of driving into a left curve), the threshold multiples for the "massed" reflectors (based upon x, average for paths 1, 2 and 3) are about 700 and the corresponding threshold multiples for the "distributed" reflectors are about 100 or seven times smaller.
G. Discussion of Results The "massed" vs. "distributed" reflector
results demonstrate that in the periphery two distributed visual stimuli are detected earlier than a single visual stimulus of equal total strength. In fact, the "distributed" reflectors are even slightly better for the case of foveal or near foveal detection when compared with the "massed" reflectors. The advantage of the "distributed" reflectors over
47
FIGURE 5: Multiples of Thresholds for Two "Distributed" Bicycle Pedal Reflectors Based Upon Selected Detection Distance Statistics for Path 2 as a Function of the Peripheral Visual Detection Angle
c ..J 0 x UI w ~ 103 ... ... 0
T:0.99/ 100FT L= 0.01 FL
' ., ., '\.
'\ . '·,., ,,
' '"' "· ' '· 40'\ ·, ' ·,
" '· '
\ \
\ .. ---·~ MINIMUM
:'ii-•
'\ -.... , .,_ ' , .... , " _,..i ', ...... ,.__.-
\,, ___ ,·-., 10'"'.. '\.....-----•i +s
'-~ CAR HEADING ANGLE o• - - -..0' MAXIMUM
- 1 DETECTION DISTANCE
2.asx10" 9 Fc 20' 1rP .+-~_..,..--~--.-~~..--~-.-~~-..-~---.~~-+
• 40 ·JO -20 ·10 0 10 20
PERIPHERAL ANGLE !DEGREES>
30
FIGURE 6: Multiples of Threshold Based Upon the Average Detection Distances for Path 2 for Two "Massed" and Two "Distributed" Bicycle Pedal Reflectors as a Function of the Peripheral Visual Detection Angle
c ..J 0 x UI
~ 10 3 x
... 0
T:0.99/100FT L:0.01FL
20°
MASSED ii
PERIPHERAL ANGLE (DEGREES)

48
FIGURE 7: Multiples of Threshold Based Upon the Average Detection Distances for Two "Massed" Bicycle Pedal Reflectors for Paths 1, 2 and 3 as a Function of the Peripheral Visual Detection Angle
c ...J 0 :r "' ~ 103 :r ..... ... 0
T:0.99/100FT L=0.01FL
CAR HEADING ANGLE 0'
- 30 ·20 - 10 10 20 PERIPHERAL ANGLE (DEGREES>
30
the "massed" reflectors gets larger with increasing peripheral angle. This study might serve as a good example to demonstrate that foveal visual performance should not be "extrapolated" to include peripheral visual performance without having appropriate research results to justify such an extrapolation.
A case has been made in this paper for the importance of peripheral visual detection in the nighttime bicycle detection prob~_em. Based upon the findings of this field study, a reflector arrangement consisting of two horizontally separated high performance rear reflectors in combination with an improved taillight and improved pedal reflectors would seem highly promising and beneficial with regard to the rear conspicuity (detection) problem of bicycles at night.
More research is needed to get a better understanding of the human visual detection mechanisms involved in foveal vs. peripheral detection at night. Also more research is needed to examine the detection distance statistics and threshold multiples for more than two reflectors, for various reflector arrangements and separation distances, for various reflector or visual stimulus intensity levels and to determine appropriate correction f actors to be used when performing engineering illumination or visibility calculations involving peripheral visual detection.
CONCLUSIONS
The information presented here suggests that there exists an adequate level of knowledge, adequate analytical and engineering design methods and an adequate state of the art manufacturing technology to effect il!Dilediate major improvements with regard to the bicycle conspicuity problem. While a number of suggestions to improve the night conspicuity of
FIGURE 8: Multiples of Threshold Based Upon the Average Detection Distances for Two "Distributed" Bicycle Pedal Reflectors for Paths 1, 2 and 3 as a Function of the Peripheral Visual Detection Angle
c ...J 0 :i::
13103
"' :i::
LL 0
....
...J
i!
101
T:0.99/ 100FT L=0.01FL
CAR HEADING ANGLE 0'
2 .85 K 10" 9 FC
.10:,.. PA}H 3 , ·" x
·" · PATH 2 i
PATH 11
10° -t-~~..-~-.,.--~-...~~-.-~~.-~--.~~-t. ,0 • 30 ·20 -10 0 10 20 30
PERIPHERAL ANGLE <DEGREES>
bicycles have been made here, there is still no doubt that the bicycle conspicuity problem is far from being solved.
Future conspicuity research must not be limited to the detection phase, but must include the recognition phase, the decision phase and the driver control action phase . The use of a driver eye movement and recording system in an instrumented car would appear to aid any future conspicuity field experiments. The effectiveness of reflective clothing or reflective stripes, bands or patches (contour or silhouette striping) for bicyclists must be determined in the real world.
All new reflector and lighting designs must be examined in terms of a cost-benefit framework. While this author believes that every traffic participant (including the bicyclist) is entitled to some minimum level of safety benefits regardless of the magnitude of cost-benefit ratios, the cost-benefit ratios could be helpful when comparing various design alternatives on a relative basis.
The day conspicuity problem must also be further researched and any solutions must be integrated into the design approach to solve the night conspicuity problem. It is hoped that bicycle designers will use an appropriate systems design methodology that considers from the start the conspicuity and visual safety requirements on an equal basis with the aesthetic, structural and dynamic force requirements. With such a systems design methodology, bicycles may recieve frame changes and additional brackets for more protective and reliable reflector, generator and lamp placements.
Last but not least, inexpensive micro-electronic devices could contribute to solving the nighttime and/or daytime bicycle conspicuity problem. Small scale scanning laser systems located close to the

drivers eyes, ultrasonic or infrared object detector tors (now used in cameras and which could be used both for cars and/or bicycles), new high efficiency sealed beam lamps with micro electronic power regulation equipment (generator and/or battery) for bicycle lighting, new high efficiency bicycle generators built with new improved magnetic materials and combined with micro-electronic controls, could be used. Inexpensive, more efficient, more compact and more reliable solar cells and sturdy light weight solar panels combined with micro electronic controls to collect energy from light could also be used to power bicycle lamps.
REFERENCES
1. Zwahlen, H.T. Ohio University Human Factors Engineering and Design Laboratory Report 80-1, Detection of Reflectorized Objects and Point Light Source Signals, Volumes I through VI, July 1980.
2. IES Lighting Handbook, Fifth Edition, 1972, Illumination Engineering Society, 345 East 47th Street, New York, N.Y. 10017.
3. Middleton, W.E.K. Vision Through the Atmosphere, University of Toronto Press, 1952.
4. Visibility Issue of the Applied Optics Journal, May 1964, Vol. 3, No. 5, pp. 549-598.
5. Cook, K.G. Reflector Analysis, Final Report, Contract No. FH-11-6950, NTIS DOT/HS-800302, PB195176, August 1969.
6. Burg, A. and Beers, J, Reflectorization for Nighttime Conspicuity of Bicycles and Motorcycles, Journal of Safety Research, Su11llller 1978, Vol. 10, No. 2, pp. 69-77.
7. McGinnis, R.G. Re.flectorization of Railroad Rolling Stock, Transportation Research Board, Transportation Research Record 737, 1979, pp. 31-43.
49
8. Stoovelaar, F. and Groot, R.E. A Visible Bicycle, Report of a study conducted under the auspices of the Roya l Dutch Touring Club ANWB, January 1976.
9. SAE Handbook Supplement HS 34, 1979 Edition, Lighting Equipment and Photometric Tests. Published by Society of Automotive Engineers, Inc., 400 Coromonwealth Drive, Warrendale, PA 15096.
10. Consumer Products Safety Commission, Bicycles, Republication of Safety Standard, Federal Register, Part IV, Vol. 41, No. 19, Wednesday, January 28, 1976, pp. 4144-4154.
11. McGee, H.W. et.al. Decision Sight Distance for Highway Design and Traffic Control Requirements, Final Report No. FHWA-RD-78-78, February 1979. Available through NTIS.
ACKNOWLEDGEMENTS
The author wishes to acknowledge the valuable contributions of Balakrishan Vinod and Juan R. del Gallego, graduate students at Ohio University, who were involved in the computer analysis and the field experiments. Further, the author wishes to acknowledge the support of Mr. Roger L. Pardieck of Seymour, Indiana.