speech discrimination monosyllabic words it … · 2018-11-13 · sam-tr-66-55 an expanded test for...
TRANSCRIPT

SAM-TR-66-55
AN EXPANDED TEST FOR SPEECH DISCRIMINATIONUTILIZING CNC MONOSYLLABIC WORDS
It Northwestern University Auditory Test No. 6
TOM W. TILLMAN, Ph.D.RAYMOND CARHART, Ph.D.
t 1TKKI!WN USE, E1rDiRAL 8CSIENTIFIC AND
T CHCAL I UNFRATION
JueC96 SEP291966
C
USAF School of Aerospace MedicineAerospace Medical Division (AFSC)
Brooks Air Force Base, Texas
AN EXPANDED TEST FOR SPEECH DISCRIMINATION UTILIZING CNCMONOSYLLABIC WORDS
Northwestern University Auditory Test No. 6
TOM W. TILLMAN, Ph.D.RAYMOND CARHART, Ph.D.
4
FOREWORD
This report was prepared in the Auditory Research Laboratory of NorthwesternUtiversity under contract No. AF 41(609)-2643 and task No. 775508. The paper wasmonitored by Captain James E. Endicott, ENT Branch of the USAF School of Aero-
space Medicine. It was submitted for publication 1 April 1966. The work wasaccomplished between 16 January 1964 and 15 April 1965.
j/
I I
This report has beenreviewed and is approved.
/ AColonel, MC, USAF
Commander
4.. ii
ABSTRAC'
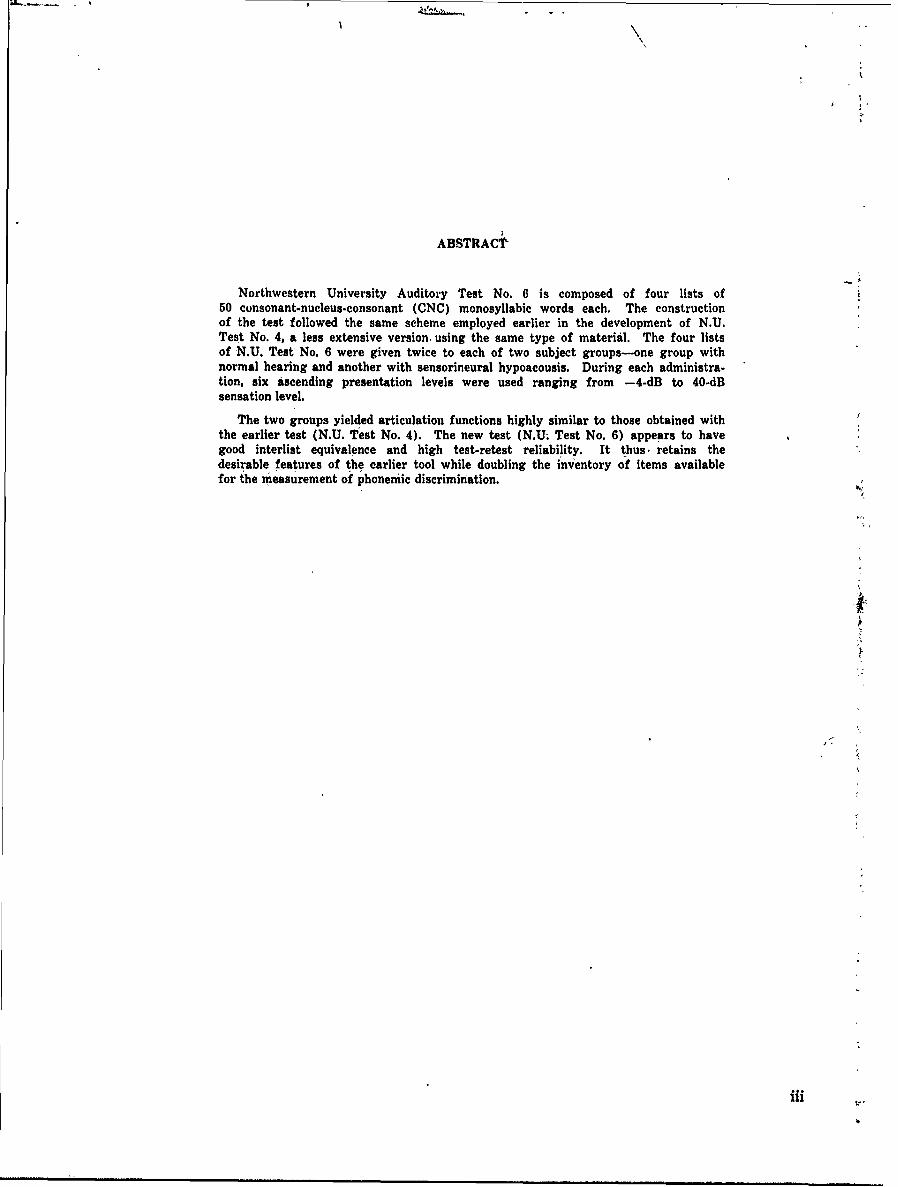
Northwestern University Auditory Test No. 6 is composed of four lists of50 consonant-nucleus-consonant (CNC) monosyllabic words each. The constructionof the test followed the same scheme employed earlier in the development of N.U.Test No. 4, a less extensive version. using the same type of material. The four listsof N.U. Test' No. 6 were given twice to each of two subject groups-one group withnormal hearing and another with sensorineural hypoacousis. During each administra-tion, six ascending presentation levels were used ranging from -4-dB to 40-dBsensation level.
The two groups yielded articulation functions highly similar to those obtained withthe earlier test (N.U. Test No. 4). The new test (N.U. Test No. 6) appears to havegood interlist equivalence and high test-retest reliability. It thus. retains thedesirable features of the earlier tool while doubling the inventory of items availablefor the measurement of phonemic discrimination.
iii:
111.

[i AN EXPANDED TEST FOR SPEECH DISCRIMINATION UTILIZING CNCMONOSYLLABIC WORDS
Northwestern' University Auditory Test No. 6
I. INTRODUCTION lists which retained the worthwhile features ofthe original pair. That is, we wished to achieve
In 1963, a new test for speech discrimina- a new tool with maximum interlist equivalencetion was described by Tillman et al. (4). It' and high reliability, and one which would, yield
-42 consisted of six randomizations of each of two articulation functions with approximately the50-word lists and was designated North- same slopes as those associated with thewestern University Auditory Test 'No. 4. The original test.monosyllabic words used in qonstructing thetest were of the consonant-ndcleus-consonant The difficulties which Peterson and Lehiste(CNC) variety and were selected from a pool (2) encountered in constructing ten lists of.of such words compiled by Lehiste and Peter- 50 CNC words F-) that all lists incorporated the,son (1). The -scheme of phonemic balance same phonemic balance, led ,us to set a goal'-offollowed in constructing the two parent lists only four, such lists. A new speech, discrimina-was described in detail earlier (4). 4% tion test-comprising four phonemically equiiva-
lent lists .has now bden developed and evaluated.This new tool, N.U: Test No. 4, was utilized The test, Northwestern University Auditory
extensively in the Auditory Research Labora- Test NO. 6, is described in
tories at Northwestern for a two-year period.It proved to be a valuable addition to thearray of materials available for the measure- II. NATURE oF N.U. AUDITORY TESTment of' phonemic discrimination. In both its NO. 6original form and under conditions of differen- Characteristics of the word lists
1A tial filtering it has been shown to possess highinterlist equivalence and good reliability. The In developing the two lists of words which
major shortcoming of the test has evolved from comprise N.U. Auditory Test No. 4, Tillmanthe fact that the pool of test materials which et al. (4) were careful to conform as rigorouslyit makes available is too restricted. Even with as possible to the scheme of phonemic balancesix equivalent forms of each list, the explora- advbcated by Lehiste and Peterson (1). Thistion of a large number of listening conditions pattern was developed by selecting all the
cannot be accomplished without several repe- 1,263 monosyllables of the consonant-vowel-titions of the various forms and lists. Such consonant type which Thorndike and Lorge (3)repetition, of course, adds variables such as listed as occurring at least once per million
arning factors which may exert differential words. Lehiste and Peterson then determinedeffects over subjects. the frequency with which each initial, medial,
and final phoneme occurred in this pool of 1,263Because of the limitation just described, it words. They specified that each such phoneme
became desirable to revise and expand N.U. should appear in a single list of 50 words withAuditory Test No. 4. The foremost considera- the same relative incidence as it exhibited intion was to produce a larger repertoire of test the total pool of words.
i"1
_ J________________
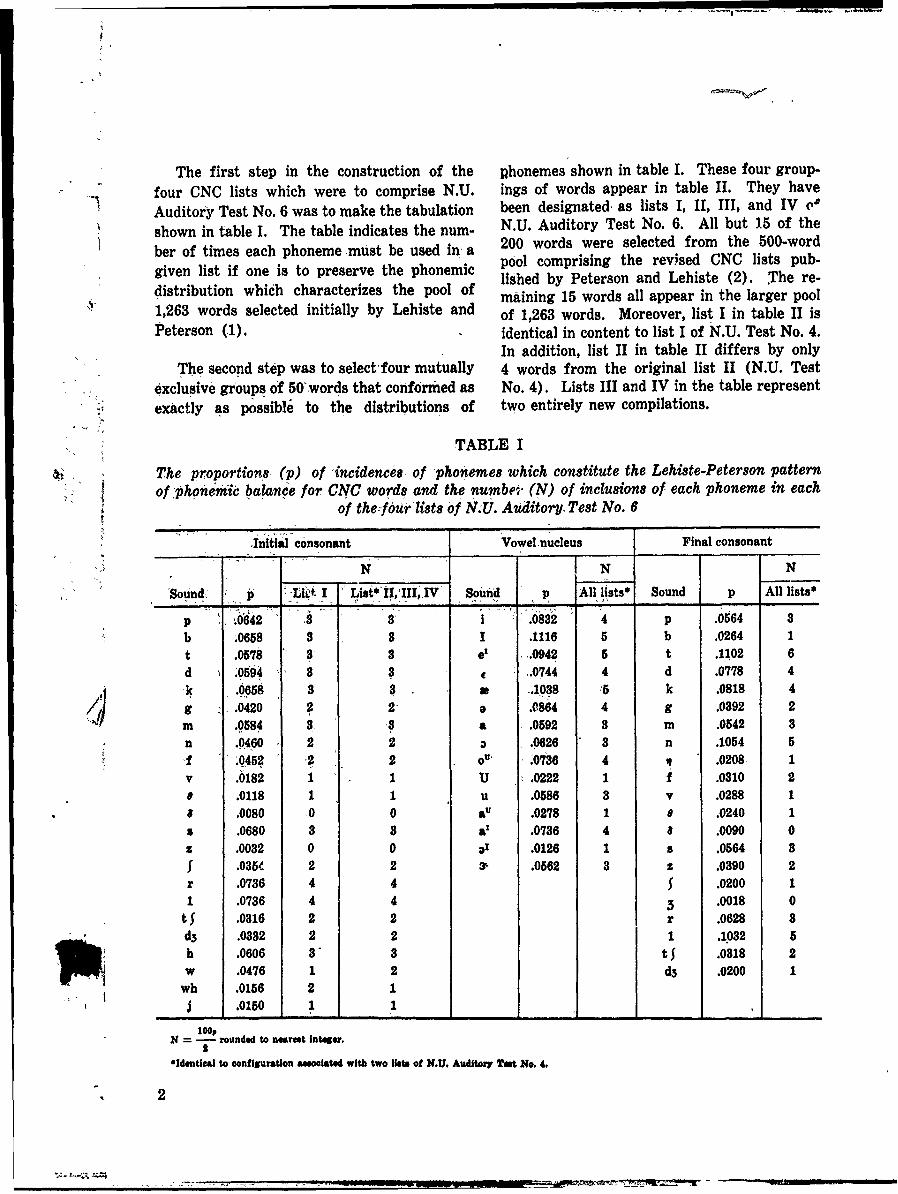
The first step in the construction of the phonemes shown in table I. These four group-
four CNC lists which were to comprise N.U. ings of words appear in table II. They have
Auditory Test No. 6 was to make the tabulation been designated, as lists 1, 11, III, and IV 0'
shown in table I. The table indicates the num- N.U. Auditory Test No. 6. All but 15 of the
ber of times each phoneme must be used in a 200 words were selected from the 500-word
given list if one is to preserve the phonemic pool comprising the revised CNC lists pub-lished by Peterson and Lehiste (2). The re-
distribution which characterizes the pool of maining 15 words all appear in the larger pool1,263 words selected initially by Lehiste and of 1,263 words. Moreover, list I in table II isPeterson (1). identical in content to list I of N.U. Test No. 4.
In addition, list II in table II differs by onlyThe second step was to select four mutually 4 words from the original list II (N.U. Test
exclusive groups of 50"words that conformed as No. 4). Lists III and IV in the table representexactly as possible to the distributions of two entirely new compilations.
TABLE I
The proportions, (p) of 'incidences of phonemes which constitute the Lehiste-Peterson patternof phonemic balance for CNC words and the numbei, (N) of inclusions of each phoneme in each
of thefour lists of N.U. Auditory, Test No. 6
'initial consonant Vowel nucleus Final consonant
N N
'Sound,' p it I Llst* ilI1iIV Sound p All lists* Sound p All lists*
p .0642 3 3 i .0832 4 p .0664 3b .0658 3 3 I .1116 5 b .0264 1
t .0578 3 3 .0942 5 t .1102 6d .'05964 3 3 £ .0744 4 d .0778 4
k .0658 3 8 a .1038 '5 k .0818 4
g .0420 2 2 a .0864 4 g .0392 2
m .0584 a 3 .0592 3 m .0542 3
n .0460 2 2 0 .0626 3 n .1054 5
f 0452 2 2 o .'0736 4 .0208 1
v .0182 1 1 U .0222 1 f .0310 2
* .0118 1 1 u .0586 3 v .0288 1
a .0080 0 0 aU .0278 1 0 .0240 1s .0680 3 3 at .0736 4 a .0090 0
z .0032 0 0 OT .0126 1 0 .0564 8I .035 2 2 3- .0562 3 z .0390 2
r .0736 4 4 5 .0200 1
1 .0736 4 4 .0018 0
tf .0316 2 2 r .0628 3
d3 .0332 2 2 1 .1032 5.0606 3" 3 ts .0318 2
w .0476 1 2 d3 .0200 1wh .0156 2 1j .0150 1 1
N = P rounded to nearest integer.2
*MdeUtlCA to configuration asociated with two Hats of N.U. Auditor7 Test No. 4.
2

'TABLE II
Alphabetical arrangement of CNC monosyllabic words comprisingthe four lists of N.U. Auditory Test No. 6
List I List II List III List IV
bean* met bite merge* bar* mouse backt mobboat mode* book* mill base* name bath* mood*burn moon bought* nice* beg note* bone nearchalk nag* calm numb cab* pain came neat*choice page chair pad* cause pearl* chain* pass*death* pool chief pick* chat* phone check* peg*dime* puff* dab* pike cheek pole dip* perch*door rag* dead* rain cool rat* dog* red*fall* raid* deep* read* date ring doll ripe*fat* raise* fail room ditch* road* fit* rose*gap reach* far* rot* dodge* rush* food rough*goose sell* gaze said five* search gas* sailhash* shout* gin* shack* germ seize gets shirthome size* goal shawl good* shall hall shouldhurl* sub hate* soap* gun* sheep* have* sour*jail sure haze south* half soup hole* such*jar take hush" thought* hire* talk join tapekeen third juice ton* hit* team judge* thumb*,kiig tip* keep tool jug* "tell* kick* time*kite* tough* keg turn* late thint kill* tire*knock vine* learn voice lid* voids- lean votetlaud week* live wag* life* walk* lease wash'-limb which '16af white* luck -when long wheat*lot whip lore witch mess wire* lose wife*-love* - - yest match young mop* youth* make yearn
OAlso in originalPB-0 lists.
The third step in the development of N.U. based on the average of the ten Peterson-Test No. 6 was to randomize each of the four Lehiste (2) revised CNC lists. Note that theparent lists four times. This procedure yielded average list of N.U. Test No. 6 is quite similarfour forms (A, B, C, D) of each of the four lists, to the average Peterson-Lehiste list so far asThese randomizations were subsequently re- the relative distribution of test words amongcorded on magnetic tape. these seven classes is concerned. Furthermore,
as was the case with the previous test (N.U.Since the relative familiarity of test items Test No. 4), the four lists of N.U. Test No. 6
is a significant variable in intelligibility test- include a sizeable proportion of very commoning, it is important to describe N.U. Test No. 6 words and at the same time cover a wide rangein terms of this characteristic before recount- of familiarity.ing the procedure followed in recording thenew test. Table III reports the number of Recording procedureswords in each test list which fall into each of The apparatus and technical procedure em-seven categories of word familiarity. Also ployed in storing the four lists of N.U. Testshown in the table is analogous information No. 6 on magnetic tape were essentially the
3

TABLE III
Distribution according to frequency of usage of the CNC monosyllablesin N.U. Auditory Test No. 6 and in the revised Peterson-Lehiste test
Average Average per listFamiliarity rating List I List II List III List IV of four for Peterson-
lists Lehiste test
Among most common 500 words 11 13 14 14 13 10.8
Among next most common 500 words 11 9 6 12 9.5 8.4
More than 100 occurrences permillion words 2 0 2 3 1.8 0.8
50 through 99 occurrences permillion words 3 6 12 5 6.5 7.7
25 through 49 occurrences permillion words 10 6 6 9 7.8 8.3
10 through 24 occurrences permillion words 9 5 8 5 6.8 7.8
1 through 9 occurrences permillion words 4 11 2 2 4.8 6.2
same as those described in relation to N.U. III. METHOD OF EVALUATIONTest No. 4 (4). However, in order to achieve
Administration of lists at selecteda-better signal-to-noise ratio on the new test,,the record gain of the tape recorder was ad- presentation levelsjusted so as to achieve a VU level, of 0 dB Interlist equivalence, test-retest reliabilitiesrather than .the -20-dB level used previously, and other characteristics of N.U. Auditory Test
In the recording of N.U. Test No. 6, a No. 6 were evaluated using two groups of sub-
32-year-old male spoke the test items. In con- jects. One of these groups contained 24 normal
nected discourse his dialect may be described hearing individuals while the remaining group
as General American, Southern Fringe (south- was composed of 12 persons with sensorineural-
west Oklahoma-region). Prior to this activity, type hearing impairments.he had extensive experience in the monitored Each of the 36 subjects involved was ex-live voice technic of speech audiometry. Never- amined twice. During each sessio, all fourtheless, he practiced extensively with the lists of the test were administered to thematerials to be recorded prior to the final subjects six times beginning at a presentationrecording session. level 4 dB below the subject's spondee thresh-
As stated earlier, each of the four lists of old (SRT). Succeeding presentations were atN.U. Test No. 6 was prepared in four alternate progressively higher intensity levels. Theforms. In order to insure equivalence from rationale for this procedure was discussed in anform to form in the recorded tapes, only earlier report (4).form A of each of the four lists was actuallyspoken by the talker. This tape was then A modified Latin-square design was utilizedcopied four times and through a process of so as to counterbalance as completely as pos-cutting and splicing, master copies of each list sible both list and form order of presentation.in its four forms (randomizations) were pre- Since only four forms of each of the four listspared in the manner detailed in an earlier were available and it was necessary to presentreport (4). each list a total of six times, two forms of a
4
given list were repeated once in each test difference in acuity between ears, the bettersession. Care was taken to insure that a given ear served as the test ear. Otherwise the testform never recurred until three other forms of ear was selected arbitrarily.the list had intervened.
Test proceduresSubjects As stated earlier, each of the 36 subjects
The 24 normal hearing subjects used in the examined in this study participated in two testexperiment were drawn from the student pop- sessions. Considering both groups, the inter-ulation at Northwestern University. The group val between the test and retest sessions rangedconsisted of 7 males and 17 females ranging in from 6 to 17 days with a mean interval ofage from 19 to 28 years with a mean age of 8.8 days. The two sessions differed from each21.1 years. In 12 subjects the left ear served other in only one respect-namely, the pureas the test ear, while in the remaining 12 the tone audiometry necessary for subject selectionright ear was selected for test. No subject was was carried out only in the initial session.included who failed to respond in a screeningtest to pure tones from 125 through 8000 cps Prior to presentation of any CNC materialsat a 10-dB hearing level (re ASA 1951 norm). in-either test session, the'SRT for the test.earin his test ear. The nontest ear was not held was measured after the :subject had ben fa-to this criterion because all measurements were miliarized with thespondee test vocabulary inconducted monaurally. the manner described previously, (4). These
materials were deliv'ered. to, the subject via aThe 12 hypoacousic subjects :used in evalu- speech audiometer (Grason-Stadler, model 162),
ating Test No. 6 were drawn from the files of calibrated to conform to -the ASA norm whichthe Northwestern University Hearing Clinics. specifies 22 dB re: 0.0002. microbar as theThey were individuals who had experienced strength of the signal at 0-dB hearing level.progressive hearing loss during adulthood, and The taped test materiais, were reproducedby athey were selected primarily from the diag- tape recorder (Ampex, model 351-2) whosenostic categories of sensorineural loss and output drove the external input to one of thelabyrinthine otosclerosis. No person was channels of the speech audiometer. In all: in-chosen as a potential subject unless his audio- stances, the level of the 1000 cps calibrationmetric data on file in the- hearing ,clinic indi- tone, recorded- on the tapes -at the level of thecated that his spondee threshold hearing level test materials, was set so that the VU meterfell within the range of 20 to 60 dB and his of the speech audiometer registered 0 dB.discrimination -score exceeded 70%. The final Actual determination of the SRT followed thedecision to include a subject in this group was procedure described below.made, on the basis of audiometric tests con-ducted at the time of his initial visit. If the An initial presentation level, 10. to 20 dBresults of this examination indicated signifi- above the estimated SRT, was selected and twocant change in the individual's hearing since test words were presented at this level. Thehis last examination in the hearing clinic, he initial presentation level was selected so thatwas not included in the experimental group. the subject correctly repeated a minimum of
five of the first six test items. In the eventThe 1 1 females and 1 male finally selected that this criterion was not met with the initial
ranged in age from 41 to 67 years showing an selection of a starting level, a higher presenta-average age of 52.3 years. In all cases, the tion level was chosen and the test run washearing loss had first been noted prior to begun anew. The intensity of the signal wasage 50. As a group, these individuals were then attenuated by 2 dB and two more wordscharacterized by a mild to moderate gradually were presented. This procedure was continuedsloping, bilaterally symmetrical audiometric until the subject either failed to respond I orconfiguration. In those persons who showed a responded incorrectly to six consecutive 'test
5

Vr
words. Threshold was then computed by sub- of presentation of lists and forms was rotatedtracting the number of words correctly re- over subjects to guard against systematic order
peated from the intensity of the signal at the effects. However, for a given subject, thestarting level and then adding 1 dB to compen- same - ,quence of presentation was followed in,sate for the fact that the 50%-criterion is not the two test sessions.fully met via this procedure.
IV. RESULTS
In each test session, the spondee threshold
was established in two consecutive runs and Articulation functions for normal hearingthe lower (better) of the two values was ac- subjectscepted as the reference level from which to
presnt he CC wrds Sine te atenutor Table IV displays the data obtained withPresent theCNC words. Sircethe attenuator normal he, ring subjects during the first test
of -the' speech ..audiometer was calibrated inora e igsbet uigtefrttsoB teseech udinether ase ofaiteger irun, while table V summarizes the like infor-2dB steps, in\the case of an -odd-integer mation obtained in the retest session. In thesespondee threshold, the reference intensity two tables, means, medians, and standardused was the level 1-dB'higher than -the actual" SRT.deviations of discrimination scores are reported
separately for each of the four lists at each
presentation level. The mean values reportedThe nextstep in the.procedure involved the i hs w alsaedslydi rpimeasurementin these two tables are displayed in graphicofmtea urte t fists. A ste for tah form in figure 1. Since the data points clus-
earler, t tered within a relatively narrow range of dis-sensation levels of presentation were expressed crimination scores, a single articulationrelative to the SRT measured in the particular function was utilized to describe them (seeSession. That is, in the event of a change in fig. 1).the' SRT from test to retest, the new level,regardless of- whether it -was higher or lower The data in' tables IV and Vand in figure 1than- the initialSRT, served as 0-dB sensation reveal that the four lists yielded articulation,level in the retest session. The six sensation functions of essentially equivalent slope.levels at which the CNC materials were pre- Further, it is apparent that for a given list,sented were: -4, 0, '8, 16, 24, and 32 dB. As the slope of the function changed little fromstated-previously, so far- as possible, the order test to retest.
ATAbLE IV
Median (Med), mean (M), and standard deviations (SD) of discrimination scores obtainedwith N.U. Auditory Test No. 6 for subjects with normal hearing during the first test session
(scores represent percent of items correctly repeated)
Sensationevel of - List I List II List III List IVpresentation* Med M SD Med M SD Med M SD .Med M SD
-4 6 8.2 8.2 8 9.4 9.8 6 6.7 5.9 6 8.8 7.7
0 29 30.9 14.1 24 28.1 16.1 25 25.7 10.8 32 31.1 15.3
8 74 70.8 14.8 72 72.8 12.1 74 73.8 9.4 77 74.1 10.6
16 89 88.6 10.6 98 91.8 7.2 94 92.8 5.8 94 92.5 6.1
24 98 96.0 5.2 98 97.8 2.8 99 96.6 8.1 98 97.7 2.8
32 100 98.6 3.8 100 99.8 1.5 100 99.6 1.0 100 99.5 2.4
*Man BUiT - 21.9 dD 8PL re: 0.0002 mlerobar.
6

I .
TABLE V
Median (Med), mean (M), and standard deviations (SD) of discrimination scores obtainedwith N.U. Auditory Test No. 6 for subjects with normal hearing during retest session
(scores represent percent of items correctly repeated)
Sensation level of List I List II List III List IVpresentation* Med M SD Med M SD Med M SD Med M SD
-4 6 8.2 7.7 7 8.7 9.0 3 5.8 5.9 6 8.1 7.4
0 32 31.5 13.0 38 37.4 13.1 30 29.6 12.9 33 34.1 13.0
8 76 75.8 10.0 81 79.8 6.8 84 79.6 11.1 77 77.8 9.8
16 94 92.0 5.4 94 94.4' 3.6 94 94.2 3.5 96 94.0 6.8
24 98 97.5 2.4 100 98.9 2.0 98 98.3 2.0 100 97.8 4.4
32 100 99.7 1.0 100 99.8 0.7 100 99.3 2.2 100 99.2 3.3
$Mean SRIT 21.2 dB SPL re: 0.0002 microbar.
100 As was the case with N.U. Auditory TestVA No. 4 (4), the characteristic feature of the
curve in figure 1 is that it represents a linear0 function which undergoes saturation. The
lower segment of the curve is linear and risesz at the rate of apProximately 5.6% per decibel
0 increase in signal presentation level. Thelinear segment appears to terminate at a sen-zsation level of about 9 dB where the averagediscrimination score approaches 80%. Thesecharacteristics are almost identical to those of
so o LIST 1 TEST the earlier test (N.U. Test No. 4). As wasu LIST I RETEST also the case with this latter test, the ,,pper
A LIST 2 TESTA LIST 2 RETEST portion of the function in figure 1 describes aZ 0 - LIST 3 TEST curvilinear progression in which scores in-a LIST 3 RETESTV LIST 4 TEST crease less and less with progressive elevation
30 LIST 4 RETEST in signal strength, finally reaching an asymp-tote, characterized by almost perfect discrimi-
20 nation. This asymptote is not reached until apresentation level of 32 dB is achieved. Withthe previous test (N.U. Test No. 4) the asymp-totic level was reached at the 24-dB sensationlevel.
-4 0 a 16 24 32 40 46SENSATION LEVEL IN Another way of considering the features
just discussed is to examine the variability ofFIGURE 1' scores at the different presentation levels (seetables lV and V). In this consideration the
Mean discrimination scores yielded by normal hear- values at the --4 IndB sensation level are ex-ing group for lists 1, II, III, and IV during both test veand retest sessions. A single articulation function fit cluded, since at this level the range of scoresall sets of data. was restricted by the fact that negative scores
7

'II
cannot occur and the standard deviation is, itrticulation function for these latter materialstherefore, not an adequate measure of vari- is not shown in figure 1 because it would be
ability. Note, however, that at the 0-dB and essentially indistinguishable from the curve8-dB sensation levels, both of which fall within displayed there.the linear portion of the articulation functions,the variability of the discrimination scores was Articulation functions for subjects withgreat. Observe further that as the stimulus, sensorineural lossintensity ecame high enough to saturate thecurve with correct responses, variability de- Our previous experience with N.U. Testcreased markedly and systematically. In fact, as No. 4 had revealed that the basic pattern of thethe asymptote of the function is approached- articulation function for subjects with coh-i.e., at 32-dB sensation level-the standard ductive hearing losses was essentially the samedeviations approach zero, ranging from 0.7% to as that for normal subjects. Thus, in the3.8%. At this level, variation in response evaluation of N.U. Test No. 6 a sample ofamong normal hearing subjects is probably subjects with conductive losses was not in-
* due predominantly to occasional errors arising cluded. However, since subjects with sensori-from lack of attention, masking produced by neural hearing impairment had differedhead movement or vocal productions and other markedly from those of normal subjects whensecondary factors, exposed to Test No. 4, the various lists of Test
No. 6 were administered to agroup of subjectsAs emphasized above, the important fea- with sensorineural impairment. The data
tures of the articulation functions for N.U. yielded by these subjects in the test and retestTest No. 6 were essentially invariant from list sessions are summarized in tables VI and VII.to list and from test to retest. It is true that The mean data from these two tables are dis-careful examination of the data presented so played graphically in figure 2. In two respects,far reveals-that minor changes in performance these data closely approximate those reporteddid occur as a consequence of both these vari" earlier for the normal hearing subjects. How-ables. However, it may be stated that the ever, one also notes three major discrepancies.characteristics of N.U. Test No. 6, as thesereveal themselves through data collected from As was the case with the normal hearingnormal hearing subjects, are almost identical group, the articulation functions yielded by theto those of N.U. Test No. 4 (4). In fact, the hypoacousic subjects for the four lists are
TABLE VI
Median (Med), mean (M), and standard deviations (SD) of discrimination scores obtainedwith N.U. Auditory Test No. 6 for subjects with sensorineural hearing loss during the first
test session (scores represent percent of items correctly repeated)
Sensation level of List I List II List III List IV
presentation* Med M SD Med M SD Med M SD Med M SD
-4 7 7.5 6.3 4 8.8 9.8 3 6.0 7.1 8 8.2 7.2
0 16 16.8 10.7 18 20.7 14.7 11 16.7 13.1 18 17.3 12.5
8 55 49.0 17.5 49 47.3 19.6 41 41.0 17.3 49 46.2 16.1
16 75 71.0 16.2 74 71.3 18.2 74 67.2 24.1 78 70.8 17.3
24 87 85.8 9.2 91 87.8 10.2 84 81.8 13.9 93 89.2 9.3
32 91 90.7 5.3 96 93.2 6.5 92 89.3 8.5 96 93.3 5.1
*Mean SRT - 57.6 dD SPL re: 0.0002 microber.
8

TABLE VIIMedian (Med), mean (M), and standard de'viations (SD) of discrimination scores obtained
with N.U. Auditoryj Test No. 6- for subjects with sen8orineural hearing loss during -theretest sess'ion& (scores represent percent of items correctly repeated)
f enaio lvl fList I 'List 11 List III List IVpresentation* Med M SD -Med _M ISD) Med M SD Med M SD
-4 5 7.0 7.2 7 9.7 10.2 1 4.7 9.6 81 8.8 7.7(0 21 19.8 11.3 17 21.0 10.7 10 14.5 10.5 16 17.3 10.48 57 53.5 20.5 61 54.8 17.7 38 -42.2 21.2 47 -48.0 18.4
16 82 '74.5 16.4 82 77.5 15.1 76' -67;7 21.4 -80 '73.7 17.9
24 90 85.7 12.8 94 91.0 6.7 87 81.5 17.5 -94 87.5, 12.332 3 9.7 10.4 95 -93.0- 5.7 t2,86.09 8.,9,
*Nean SRT 5 6.6 dB SPL re: 0.0002 microbar.
100 -highly equivalent to, one 'another in~configura--A AVtion. In, fact,, # single ,unc I ion describes the
entire array of, data points rather well (seefig. 2). As was true with 'the.-normal. :grdup,
so the pattern of the arfictlation 'functions, forz thesensorineurial group-i~oi6espeak)o -1 atua70 tion curve With-the p'ii ofidtnlinkrity:occur-
Zring at -a score of "approxi~teY %U(16-dB 'SL). itecall. tat this_,bit curredx ~~~at about 80%o SL -d)fo te norml
group.so
The first discrep~aticy. betwfiq,.the results,-0 LIST I -TEST - for* -the normnal -group and the -sensorineural0IT1 RETEST -fucin o hvroslss hl h lna40 A LISTl2 TEST group, concerns the slope of the "articulation
I 30 U~ LIST 3 TEST 'toso h-3 L- 3otin RoES the finctioiis-" ielded by the normnalV LIST 4 TEST hearing subjects rose at the rate of 'About.5.69v
20 V~~~~~~~ LISTA4 RETESTpedeieinrae ntsiy thieas insinlitntyth
functions for the 'heain" ;impaired, group10 -sloped more gradually, approximately 3.4%o
per decibel in 'the linear segment. As a con-comitant, the nonlinear uppr segments of the
-4 0 S 16 24 32 40 48 functions 'for the sefisorinieural group do notSENSTIO LEVL I d6reach full saturation within the range of pres-SENSTIO LEVL I dSentation levels employed in this experiment.
At the maximum level, 32-dB SL, the averagescore was approximately 91%o. If one extrap-olates the functions as has been done in fig-
FIGURE 2ure 2, it appears that the average saturationMea dscrmiatin cors ieledby ubect wth asymptote would occur at a mean discrimina-
veneorineural hearing lose for lists 1, II, 11I, and IV to cr fapoiaey99'adta iiduring both test and retest seesons. A single ariua mean score would have occurred at a sensationtion function fit# all set of data. level of about 40 dB.
9
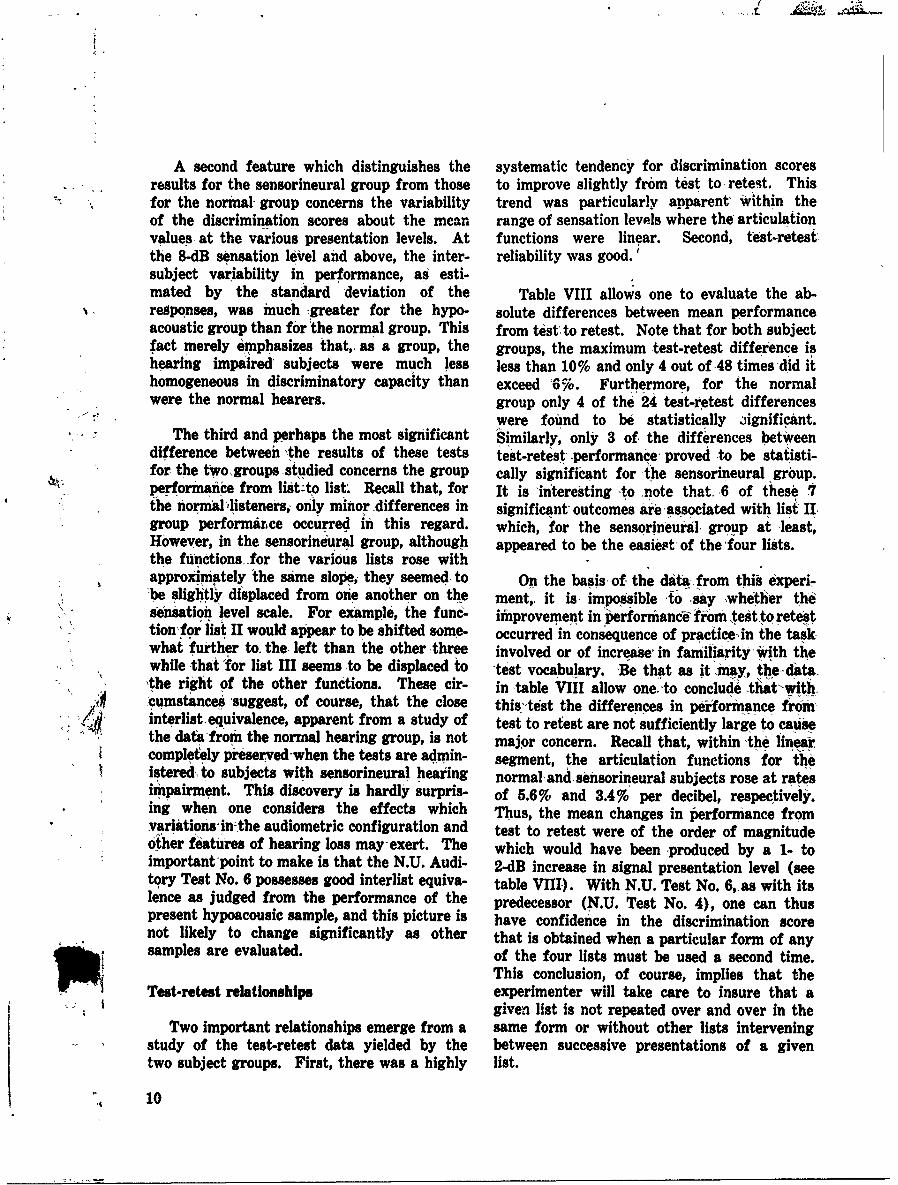
A second feature which distinguishes the systematic tendency for discrimination scoresresults for the sensorineural group from those to improve slightly from test to retest. This
* for the normal group concerns the variability trend was particularly apparent, within theof the discrimination scores about the mean range of sensation levels where the articulationvalues at the various presentation levels. At functions were linear. Second, test-retest-the 8-dB sensation level and above, the inter- reliability was good.'subject variability in performance, as esti-mated by the standard 'deviation of the Table VIII allows one to evaluate the ab-responses, was much greater for the hypo- solute differences between mean performanceacoustic group than for the normal group. This from test to retest. Note that for both subjectfact merely emphasizes that,, as a group, the groups, the maximum test-retest difference ishearing impaired subjects were much less less than 10% and only 4 out of 48 times 'did ithomogeneous in discriminatory capacity than exceed '6-. Furthermore, for the normalwere the normal hearers, group only 4 of the 24 test-retest differences
were found to be statistically jignificant.The third and perhaps the most significant Similarly, only 3 of, the differences between
difference between 'the results of these tests test-retest performance' proved to be statisti-for the tWogroups studied concerns the group cally significant for the sensorineural group.performance from list-to list . Recall that, for It is 'interesting 'to note that 6 of these Vthe normal'.isteners; only minor differences in significant outcomes are associated with list IIgroup performarce occurred in this regard. which, for the sensorineural group at least,However, in the sensorineural group, although appeared to be the easiest of the four lists.the functions for the various lists rose withapprox!mately the same slope, they seemed to On the basis of, the dat, from this experi-be slightly displaced from one another on the ment, it is' impossible to say whether the
*, sensation level scale. For example, the func- improvement in ijeoriianc' from testto retesttion for list II would appear to be shifted some- occurred in consequence of practicein the task-what further to. the left than the other three involved or of increase' in familiarity with thewhile that for list III seems to be displaced to -test vocabulary. Be that as it may, the data'the right of the other functions. These cir- in table VIII allow one, to conclude that'withcumstancei 'suggest, of course, that the close this'test the differences in performance from-interlist. equivalence, apparent from a study of test to retest are not sufficiently large to caUsethe data-from the normal hearing group, is not major concern. Recall that, within 'the linear,completly preserved-when the tests are admin- segment, the articulation functions for theistered t subjects with sensorineura! hearing normal, and sensorineural subjects rose at ratesimpairment. This discovery is hardly surpris- of 5.6% and 3.4% per decibel, respectively.ing when one considers the effects which Thus, the mean changes in performance fromvariations-in-the audiometric configuration and test to retest were of the order of magnitudeother-features of hearing loss may-exert. The which would have been produced by a 1- toimportant point to make is that the N.U. Audi- 2-dB increase in signal presentation level (seetory Test No. 6 possesses good interlist equiva- table VIII). With N.U. Test No. 6,,as with itslence as judged from the performance of the predecessor (N.U. Test No. 4), one can thuspresent hypoacousic sample, and this picture is have confidence in the discrimination scorenot likely to change significantly as other that is obtained when a particular form of anysamples are evaluated, of the four lists must be used a second time.
This conclusion, of course, implies that theTest-retest relationships experimenter will take care to insure that a
given list is not repeated over and over in theTwo important relationships emerge from a same form or without other lists intervening
study of the test-retest data yielded by the between successive presentations of a giventwo subject groups. First, there was a highly list.
10

The test-retest reliability of the four lists of .27 to a high of .59. Secondly, in the sen-of N.U. Test No. 6 can be judged by a study of sorineural group, the correlations are againthe correlation coefficients shown in table IX. all positive and generally much higher, rangingIf one disregards the data for the -4-dB from .36 to .93. This difference between thesensation level, where the distribution of scores two groups is undoubtedly related to the factwas obvioualy truncated, and confines atten- that the range of discriminatory capacities intion to the data obtained in the remainder of the normal group was qufte restricted relativethe region where the articulation function rose to that of the sensorineural group. Otherwith a'liniaerlope, the following facts emerge. things being equal, such a restriction in theFirst, in thenormal hearing group the correla- range of the characteristic under study tendstions are all p0sitive andthey range from a low to reduce the magnitude of the Pearson r.
TABLE ViII
Difference between mean discrimination scores from test to retest at the several presentationlevels for the two groups, on N.U. Auditory Test No. 6 (nigative difference indicates
higher score in retest than in test session)
Sensation level of Normal hearinggroup Sensorineural loss grouppresentation List I List II List IlII List IV List, I List II List III List IV
-4 -0.1 0.8 0.8 0.8 0.6 -0.8 1.3 -0.70 -0.6 -9.3" -3.9 -3.0 -3.0 -0.3 2.2 0.0
8 -4.9 -7.5t -. 8 -3.7 -4.5 -7.5t -1.2 -1.8
16 -3.4 -3.1* -1.9 -1.5 -8.5 --6.2* -0.5 -2.8
24 -1.5 -1.2 -1.8 -0.2 0.2 -3.7" 0.3 1.7
32 -1.1 -0.4 0.2 0.3 0. 0.2 3.3 0.5
*t stttic smociated with difference equals or exceeds that requirid for significance at, 6% confidence level
ttM statistic associated with difference equals or exceeds that required for signifiance at 1% conf de ce level
TABLE IX
Coefficients of correlation* (Pearson r) between test and retest for N.U. Auditory Test No. 6administered, to subjects with normal hearing and subjects with sensorineural hearing loss
Normal hearing group Sensorineural loss groupSensation level
List I List II List III List IV List I List II List III List IV
-4 .80 .29 .84 .15 .59 .84 .74 .48
0 .41 .35 .41 .36 .47 .72 .62 .50
8 .54 .27 .43 .59 .93 .92 .83 .79
16 .92 .86 .98 .91
*For each group, analysis is restricted to the range of ensation levels within which the slopes of the articulation functions were Judgedto be linear.
11
The array of test-retest correlations shown N.U. Auditory Test No. 6 compares favorablyin table'IX compa'e favorably with that asso- with its predecessor (N.U. Test No. 4) in inter-ciated' with N.U. Auditory Test No. 4 (4). list equivalence and test-retest reliability. InMoreover, the various values reported in the addition, the new tool yields articulation func-table are of the general order of magnitude tions which rise with approximately the sameusually considered 'to indicate acceptable test- slope as those associated with the original test.retest reliability. As stated earlier, N.U. Test No. 4 has proved
to be a highly useful tool for the measurementof phonemic discrimination in the laboratory
V. CONCLUSIONS as well as in the clinical setting. We thus ex-pect N.U. Test No. 6, which possesses twice the
On the basis of the material presented here, vocabulary of the original test, to be a valu-we conclude that we have achieved the goal able addition to the armamentarium of thethat we were seeking. It seems clear that audiologist.
REFERENCES
1. Lehiste, I., and G. E. Peterson. Linguistic con- 3. Thorndike, E. L., and I. Lorge. The teacher'ssiderations in the study of speech intelligibility, word book-of 30;000 words. New York: Colun-J., Acoust. Soc. Amer. 31:280-286 t(1959). bia University Teachers College, 1944.
4. Tillman, T. W., R. Carhart, and L. Wilber. A test2. Peterson, G. E., and 1. Lehiste. Revised CNC lists fo pehdsciiaincopsdo N-' for speech discrimination composed of CNC
for auditory tests. J. Speech Hearing Dis. imonosyllabic words (4.U. auditory test No. 4).27:62-70 (1962). SAM-TDR-62.135, Jan. 1963.
12

UnclassifiedSecurity Classification DO U E T C N R L A A 1- I D
(Security classification of title, body of abstract and indexing annotation must be entered when the overall report Is 9eaifiedt)
1. ORIGINATING ACTIVITY (Corporate author) 41a. REPORT SECURITY C LAISIFICATIONAuditory Research-Laboratory UnclassifiedNorthwestern University 2b. RouPEvanston, Ill, ______________________
3. REPORT TITLE
AN EXPANDED TEST FOR SPEECH DISCRIMINATION UTILIZING CNC MONOSYLLABIC WORDS:N.U. AUDITORY TEST NO. 6
4. DESCRIPTIVE N OTES (Type of report and Inclusive date*)
16 Jane 1964. - 15 Apr. 1965S. AUTHOR(S) (Loot name. first name,inlitiai)
Tillman, Tomn W.Carhart, Raymond
6. REPORT DATE 7.TTLN.O AE "b O FRF
June 1966 1ea. CONTRACT OR G.RANT NO. A '4±(bUOf2bI4. So. OC;RIQINAT9R#P RSPORT IIUMDER(5)
b. PROJECT NO. sAk-TR-66-55
Task No., 775508 9b. oTI4.R m PORT NO(8) (Any other nun"#@r that may be aeied
d.
10. A VA IL AILITY/LIMITATION NOTICES
Distribution of this document is unlimited-,
11. SUPPLEMENTARY NOTES 12. SPONSOOING'MILITARif ACTIVITYUSAF School of'Aerospace Medicine,Aerospace Medical Division (APC),Brooks Air Force Base,, TCe
13. AUSTtACTNorthestern UniversityAuditory Test No. 61is composed of four lists of 50p
consonant-nucleus-consonant (kCNC) monosyllabic words each.' The constru~tion ofthe test followed the same scheme employed earlier'in the deveilopment of N.U.Test No. 14, a less extensive Version using the samie type of material. The fourlists of NeU. Test No. 6 were given' twice to each of'two subject groups-onegroup with normal hearing and another with sensorineural bypoacousis. Duringeach administration, six ascending presentation levels were used ranging from-14-0B to 4O-dB sensation level.
The two groups yielded articulation functions highly similar to thoseobtained with the earlier test (N.U. Test No. 14). The new test (N.U. Test No. 6)appears to have good interlist equivalence and high test-retest reliability. Itthus retains the desirable features of the earlier tool while doubling theinventory of items available for the measurement of phonemic discrimination.
FOR-
DD IJN6 1473 UnclassifiedSecurity Cla ssificationi

UnclassifiedSecurity Classification ,,,
14. LINK A LINK S LINK CKEY WORDS ROLlE WT ROLE WT ROLM WT
Otolaryngology
Audiology
Speech discrimination
Articulation function
CNC words
N.U. Test No.
N,U. Test No.6
INSTRUCTIONS
1. ORIGINATING ACTIVITY: Enter the name and address Imposed by security classification, using standard statementsof the contractr, subcontractor, gra~nt*6, Department of Do- such as:
fense activity or other organization (coaporate author) issuing (1) "Qualified requesters may obtain copies of thisthe report. report from DDC.co
2a. REPORT SECURTY CLASSIFICATION: Enter the over- (2) "Foreign announcement and dissemination of thisall security classification of the report. Indicate whether report by DDC is not authorized.""Restricted Data" is included. Marking ii to be in acc'ord •
•nce with appropriate security regulations. (3) "U. S, Government agencies may obtain copies ofthis rrt d4iietly from DDC. Othequlfd D2b. GROUP: Automatic downgrading is specified in DOD Di user irecty fer qualified DDC
,rective 5200.10 and Armed Forces Indnstrisl Manual. Enter tuthe group number. Also, when applicible. show tliat optional . .. .... _._._ ."markings have been used for Group 3 and Gro-p4 ,as author. (4) "U. S iry anmD. Ot i copifi thisUPz(4) "U. mi alitary agencies mayoobtaln cop'ies~of/thi•ized. ,eporf directly from DDC. Othei qualifis& 4 sers-3. REPORT TITLE. Enter the complete report title in all shall request throughcapital letters. Titles•in all cases should beunhhlssified ,If a meaningful title camot be selected Withouit clissifica-tion, show-title classification in all capitals inparenthesis (5) "All distribution of this report is controlled. 'Quimmediately following the.title. ified'DDC users shall request through/ 4. DESCRIPTIVE NOTES: If appropriate, enter the type of ,;report, e.g., interim, progress,summary, annual, of final, If the report has been furnished tc the Office of TechnicalGive the inclusive dates when a specific reporting period'is Services, 'Depatment of Commerce,, for sale to the public, indi-covered. cate this fact'and enter the price, if known,
S. AUTHOR(S): Enter the name(i) of author(s),as shown on 1L SUPPLEMENTARY NOTES: Use for additional explana-or in the report. Entet last name, first name, middli initial. tory notes.If military, show rank rind branch of, service. The name ofthe principal atthor is an absolute minimum requirement. 12. SPONSORING MILITARY ACT!IVITY: Enter the name of
the-departmetal project office or laboratory sponsoring (pay.6. REPORT DATE. Enter the date of the report is day, ing for) the research'and development. Include address.'month, year or month, year. 'If more than one date appears,on the report, use date of publication. 13. ABSTRACT: Enter an abstract giving a brief and factual7a. TOTAL NUMBER OF PAGES: The total page count Isummary of the, document indicative of the report, even though7h TOLo NUMBROFrPAGE&Thetotal pae cunt tit may also appear elsewhere in the body of the technical re-should follow normal pagination procedures, L., enter the port. If additional space is required, a continuation sheet shallhnumber of pages containing information. be attached.
7b. NUMBER OF REFERENCES Enter the total number of It is highly desirable that the abstract of classified reportsreferencei cited in the se rt. be unclassified. Each paragraph of the abstract shall end with8s. CONTRACT OR GRANT NUMBER: If appropriate, enter an indication of the military security classification of the in-the applicable number of the contract or grant under which formation in the paragraph, represented as (TS), (S), (C), or (u).the report was written. There Is no limitation cn the lenth"of the abstract. How-Sb, Sc, & Sd. PROJECT NUM1ER: Enter the appropriate ever, the suggested length is from IS0 to 22S words.
military department identification, such as project number,subproject number, system numbers, task number, etc. 14. KEY WORDS: Key words are technically meaningful terms
or short phrases that characterize a report and may be used as9a. ORIGINATOR'S REPORT NUMBER(S): Enter the offi- index entries for cataloging the report. Key words must hecial report number by which the document will be identified selected so that no security classification is required. Identi-and controlled by the originating activity. This number must fters, such as equipment model designation, trade name, military
be unique to this report. project code name, geographic location, may be used as key
9b. OTHER REPORT NUMBER( ): If the report has been words but will be followed by an indication of technical con.assigned any other report numbers (either by the orilinator text. The assignment of links, rules, and weights is optional.or by the sponsor), also enter this number(s).
10. AVAILABILITY/LIMITATION NOTICES: Enter any lim.itations on further dissemination of the report, other than thosel
01 O 646.651Unclassified
Securitv Classiflcation