speculations on the impact of subduction initiation on the
TRANSCRIPT

1
Speculations on the impact of subduction initiation on the 1
Earth System 2
F.O. Marques1,2*, B.J.P. Kaus2 3
1Universidade de Lisboa, 1749-016 Lisboa, Portugal 4
2 Institut für Geowissenschaften, Johannes Gutenberg-Universität, Mainz, Germany 5
6
*Corresponding author. Tel.: 351 217500000; Fax: 351 217500064 7
E-mail address: [email protected] 8
9
Abstract 10
The physics of subduction initiation can be studied with numerical models of lithosphere 11
dynamics, to the extent where we can now test the potential consequences of a catastrophic 12
subduction initiation event on the Earth system. The South American Atlantic passive margin is 13
here used to show that, once subduction has catastrophically initiated there, a major geodynamic 14
reconfiguration of the South American plate (SAm) is likely to take place: (1) compression in the 15
east will be inverted to extension, because ridge push will be replaced by subduction rollback 16
and trench retreat; (2) compression in the west will be inverted to extension due to absolute 17
rollback; and (3) without buttressing from the east and west, the Andes will collapse. Extension 18
at both margins of continental SAm will produce two new volcanic arcs, several thousands of 19
kilometres long each, bounded by trenches and two new back-arc basins. The spreading rate of 20
the Mid-Atlantic Rift will significantly increase, because of the cumulative effect of ridge-push 21
and slab-pull in the same direction. The substantially increased volcanism all around SAm and in 22
the MAR will most likely release massive amounts of greenhouse and toxic gases into the 23
atmosphere and oceans, which might lead to major oceanic and atmospheric circulation changes. 24
2
We present new numerical modelling that supports the proposed evolution of the SAm after 25
subduction has catastrophically initiated at its eastern passive margin. 26
27
Keywords: subduction initiation; passive margin; geodynamic setting; global changes; biotic 28
crisis; Earth system; numerical modelling 29
30
1. Introduction 31
When discussing global changes and impact on life on Earth, one has to account for the 32
time range of the process: it must be large scale and catastrophic (short time), so that the 33
biosphere does not have the time to adapt to the new conditions, especially in atmosphere and 34
hydrosphere. We can look at this relationship as a Deborah number (De): the time of subduction 35
initiation divided by the characteristic time living beings take to adapt to new conditions. If De < 36
1, then catastrophic subduction initiation at a passive margin (< 1 Ma) is a process capable of 37
producing a biotic crisis. Otherwise, there is time for adaptation because environmental changes 38
take place slowly over a long period of time (>> 1 Ma). Therefore, here we concentrate on the 39
fast end-member of subduction initiation, the catastrophic initiation capable of producing sudden 40
global changes and impact on life on Earth. Using well-known constitutive equations and 41
parameters determined experimentally (e.g. Weertman, 1968; Hirth and Kohlstedt, 2003; 42
Korenaga and Karato, 2008), here we show numerically that subduction can initiate in less than 1 43
Ma, which seems insufficient time for a great part of the biosphere to adapt to extreme new 44
conditions (Wignall and Twitchett, 1996; Wignall, 2001). We conclude that catastrophic 45
subduction initiation at a passive margin can be responsible for mass extinctions. 46
At the surface, subduction is responsible for catastrophic events like explosive volcanism, 47
large earthquakes and major tsunamis, which obviously impact human societies. Although 48
omnipresent, mature subduction does not seem capable of triggering fast global changes that 49
3
would impact the whole Earth system. In contrast, subduction initiation at a passive margin can 50
be catastrophic, in terms of time and transformations. 51
McKenzie (1977) mathematically analysed the problem of subduction initiation at a 52
passive margin, and concluded that the development of a new trench and sinking slab occurs 53
through a finite amplitude instability, because elastic and frictional forces prevent trenches from 54
arising spontaneously. This means that an external force is needed to initiate subduction. The 55
compressive stress required is about 80 MPa, and the rate of approach must be greater than about 56
l.3 cm/yr. Two immediate sources of compressive stress in a passive margin are ridge-push and 57
topography push from the passive margin. The difference in mean density between continental 58
and oceanic crusts produces a horizontal force (e.g. Niu et al., 2003; Marques et al., 2014) 59
similar to the push caused by elevated mid-oceanic ridges (ridge-push). If the difference in 60
elevation between a continent and adjacent ocean is 7 km, with 2 km above sea level and 5 km 61
below (as at the Brazilian margin), it can maintain a compressive stress of 85 MPa. If to these 62
stresses we add the stresses due to Andean topography and deep roots, which can amount to 100 63
MPa if the estimated 1E13 N/m (e.g. Artyushkov, 1987; Husson et al., 2008) are integrated along 64
a 100 km thick lithosphere, then the South American Plate (SAm) seems the best place for 65
subduction to initiate at a passive margin. The probability of subduction to initiate along the 66
eastern American Atlantic margins has been numerically evaluated by Nikolaeva et al. (2011) 67
and Marques et al. (2013), who concluded that the SE Brazilian margin has the highest 68
probability for subduction initiation to occur there. According to Marques et al. (2013), 69
subduction could likely be initiating at the Brazilian passive margin, because of additional 70
forcing by the current massive Andean Plateau and its very deep crustal roots (which are hot and 71
of low-density). Given the favourable geodynamic setting for subduction initiation, here we 72
concentrate on SAm’s possible future evolution. 73
If the current theoretical analyses and the physics governing subduction initiation are 74

4
accepted, then a major question arises: what is the impact of subduction initiation on the Earth 75
system? The answer to this question is the aim of this article. We use current knowledge about 76
the SAm and numerical models to predict what will happen to the SAm in the future, and 77
evaluate the impact these changes can have on the Earth system if subduction initiates 78
catastrophically at a passive margin. 79
The main premises of this work relate to (1) catastrophic subduction initiation at a 80
passive margin, (2) the rheology of the sub-lithospheric mantle, (3) the support of mountain belts 81
(buttressing), and (4) the motion of the subduction hinge: 82
(1) Catastrophic subduction initiation – Hall et al. (2003) and Nikolaeva et al. (2010) have 83
analysed numerically subduction initiation at a passive margin, and both have concluded that 84
self-sustained subduction can take off in about 1 Ma (see also Lu et al., 2015). Nikolaeva et al. 85
(2010) carried out a parametric study that shows that the thickness of the continental lithosphere 86
can lead to catastrophic (< 1 Ma) subduction initiation at a passive margin (cf. their Fig. 6). 87
Using the current geological and geophysical knowledge of the SAm, we further tested the 88
effects of rheology (diffusion and dislocation creeps) and activation volume on the velocity of 89
subduction initiation. 90
(2) Rheology of the sub-lithospheric mantle – the rheological properties of the mantle are critical 91
to its dynamics; however, fundamental issues as the dominant flow mechanisms are still not 92
consensual. Laboratory studies and geophysical and geological data indicate that both diffusion 93
and dislocation creep can occur in the mantle (Karato and Wu, 1993). However, according to 94
Bürgmann and Dresen (2008), broadly distributed deformation in the asthenosphere probably 95
occurs by dislocation creep, with a stress-dependent power-law rheology. Therefore, we used 96
dislocation creep (power-law creep) as the rheology of the sub-lithospheric mantle in our 97
models. However, we tested the influence of rheological law (diffusion or dislocation creep), and 98
of activation volume on subduction initiation (see also Billen and Hirth, 2005, 2007). 99
5
(2) Buttressing – it is long known that mountains like the Himalaya or the Andes are supported 100
by the surrounding lithosphere; if this support vanishes, the mountain belt collapses. This is 101
what has happened to all orogens worldwide and through the Earth’s history; when 102
convergence and compressive forces cease, the mountain belt collapses and the deep 103
continental roots isostatically rebound, denudation removes the topographic relief, and the 104
Moho returns to its normal position at 30-40 km depth. 105
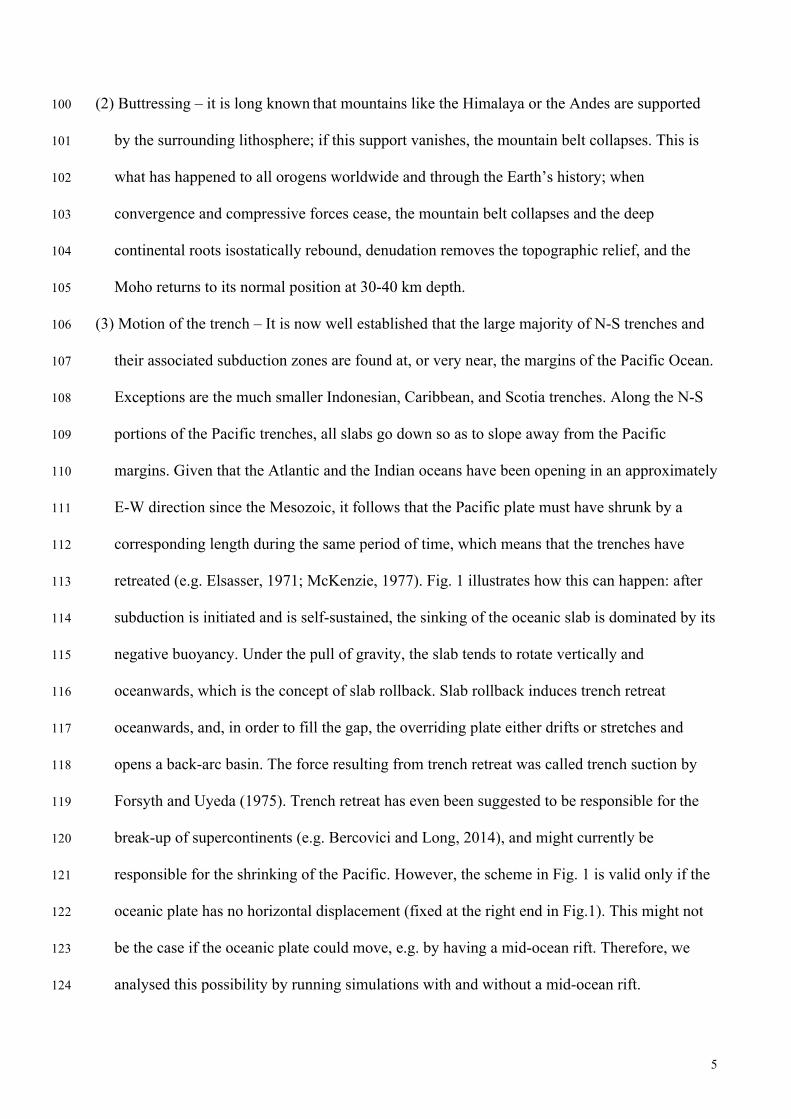
(3) Motion of the trench – It is now well established that the large majority of N-S trenches and 106
their associated subduction zones are found at, or very near, the margins of the Pacific Ocean. 107
Exceptions are the much smaller Indonesian, Caribbean, and Scotia trenches. Along the N-S 108
portions of the Pacific trenches, all slabs go down so as to slope away from the Pacific 109
margins. Given that the Atlantic and the Indian oceans have been opening in an approximately 110
E-W direction since the Mesozoic, it follows that the Pacific plate must have shrunk by a 111
corresponding length during the same period of time, which means that the trenches have 112
retreated (e.g. Elsasser, 1971; McKenzie, 1977). Fig. 1 illustrates how this can happen: after 113
subduction is initiated and is self-sustained, the sinking of the oceanic slab is dominated by its 114
negative buoyancy. Under the pull of gravity, the slab tends to rotate vertically and 115
oceanwards, which is the concept of slab rollback. Slab rollback induces trench retreat 116
oceanwards, and, in order to fill the gap, the overriding plate either drifts or stretches and 117
opens a back-arc basin. The force resulting from trench retreat was called trench suction by 118
Forsyth and Uyeda (1975). Trench retreat has even been suggested to be responsible for the 119
break-up of supercontinents (e.g. Bercovici and Long, 2014), and might currently be 120
responsible for the shrinking of the Pacific. However, the scheme in Fig. 1 is valid only if the 121
oceanic plate has no horizontal displacement (fixed at the right end in Fig.1). This might not 122
be the case if the oceanic plate could move, e.g. by having a mid-ocean rift. Therefore, we 123
analysed this possibility by running simulations with and without a mid-ocean rift. 124
6
125
Figure 1. Sketch illustrating slab rollback and consequent trench retreat. The overriding 126
continent may either drift or rift, in the latter case to form a back-arc basin. 127
128
Natural examples (e.g. Gvirtzman and Nur, 1999; Rosenbaum and Lister, 2004; Schellart 129
et al., 2006; Spakman and Hall, 2010) and theoretical analysis of subduction initiation at a 130
passive margin (e.g. Faccenna et al., 1999; Nikolaeva et al., 2010, 2011; Marques et al., 2013, 131
2014) have shown that rollback is a natural consequence immediately following subduction 132
initiation (e.g. Kincaid and Olson, 1987; Hall et al., 2003; Kincaid and Griffiths, 2003; 133
Funiciello et al., 2003a, b, 2006, 2008; Gurnis et al., 2004; Schellart, 2005, 2008, 2010, 2011; 134
Stegman et al., 2006; Schellart et al., 2006, 2007, 2008, 2011; Lallemand et al., 2008; Di 135
Giuseppe et al., 2008, 2009; Capitanio et al., 2010; Schellart and Rawlinson, 2010; Stegman et 136
al., 2010a, b; Rodríguez-González et al., 2012, 2014; Niu, 2014; Holt et al., 2015). Therefore, the 137
passive margin, originally (before subduction initiation) under compression due to ridge-push 138
and margin topography, may undergo extension when self-sustained subduction initiates (Fig. 1). 139
In order to test this hypothesis, we used numerical modelling as presented below. 140
141
2. Geodynamic setting 142
The SAm (Fig. 2) is bounded in the north and south by two transform faults, in the east 143

7
by the MAR axis, in the west by the Chile trench, and at the base by the asthenosphere. 144
145
Figure 2. Simplified present-day tectonic setting of the South America lithospheric plate. Arrows 146
represent horizontal plate motion with the African plate fixed. Background image is a 147
shaded relief image from ETOPO5 digital data 148
(http://www.ngdc.noaa.gov/mgg/global/relief/etopo5/images/tif/slides_t/slide15.tif). 149
150
The SAm has two major topographic reliefs along its eastern (MAR) and western 151
(Andes) boundaries (Fig. 2), which produce topographic forces that keep the SAm under 152
compression (e.g. Coblentz and Richardson, 1996). The SAm’s western boundary is currently 153
being pushed from the west by relative subduction roll-forth (e.g. Russo and Silver, 1996), which 154
works as an effective backstop. Otherwise the Andes would collapse to the west. Push from the 155
west coupled with MAR push from the east guarantees the existence of the Andes, in particular 156
the impressive Andean Plateau, by supporting the mountain belt from east and west. 157
The Andes are hot and weak, therefore: (1) they can spread horizontally, and therefore 158
push the SAm plate eastwards; and (2) they cannot directly transmit the stresses born from 159

8
relative roll-forth of the Chile Trench into the rigid SAm, because they deform internally thus 160
dissipating the stresses born from a relatively advancing trench. The continental SAm is thick 161
and rigid, and therefore a privileged guide to the stresses imposed from the east (MAR) and west 162
(Andes). Because the Brazilian shield and the Atlantic oceanic lithosphere are very strong, they 163
convey stress into the weak (thinned and rifted) Brazilian margin, where continental and oceanic 164
lithospheres meet and strain should preferentially concentrate. Here, the stresses can be increased 165
by the Brazilian Plateau (almost 3,000 m of altitude close to the Brazilian margin), as a result of 166
the density contrast and the more than 7,000 m elevation difference between continent (less 167
dense) and ocean (denser) (Marques et al., 2014). The sum of the forces acting on SAm has been 168
numerically shown to be enough to initiate subduction at a passive margin (Nikolaeva et al., 169
2011; Marques et al., 2013), and should therefore be enough to break the Brazilian margin and 170
initiate self-sustained subduction. Once this happens, a series of events will take place that 171
affects plate kinematics and force balance, and thus the SAm’s geodynamic configuration (Figs. 172
2, 3). Currently the SAm is compressed from west and east by Andes and MAR opposing pushes 173
(e.g. Assumpção, 1992; Coblentz and Richardson, 1996; Cogné et al., 2011, 2012, 2013)(Fig. 174
2a), but this stress state can dramatically change with subduction initiation. 175
Considering the general case of a 2-D Earth and steady state, the force balance on a plate 176
can be written as: 177
178
Frp + Fsp + Fmd + Fff + Fbf + Fip = 0 179
180
where Frp = ridge push; Fsp = slab pull; Fmd = mantle drag; Fff = fault friction; Fbf = boundary 181
forces exerted by other plates; Fip = intra-plate forces. 182
183

9
184
Figure 3. Sketch, in vertical cross-section, of the 2-D force balance in the South American Plate 185
at steady state. 186
187
In the particular case of the SAm (Fig. 3), the forces can be evaluated as follows: (1) once 188
we know the average age of the oceanic crust along the SAm’s continental margin, we can 189
estimate Frp. (2) Fsp = 0 because the contribution of the slab-pull force to the dynamics of the 190
SAm has been considered negligible (e.g. Meijer and Wortel, 1992; Coblentz and Richardson, 191
1996). The topographic forces like MAR-push, Brazilian Plateau-push, and Andes-push are the 192
main contributors to the intraplate stress field. (3) Fmd is a force that cannot be neglected, but, as 193
a first approximation, we will assume it to be a constant resistive force. (4) Fff occurs at the 194
northern and southern SAm’s boundaries, but it is most probably negligible, because transform 195
faults are typically weak (e.g. Zoback, 1991), and their area is much smaller than the area 196
subjected to Fmd. (5) Fbf corresponds to the Andean push, which can be estimated. (6) Fip is 197
mostly restricted to the Brazilian Plateau, but given its small size compared to the entire SAm, 198
the topographic force is relevant locally. We conclude that only three forces are relevant 199
regarding the SAm: the MAR push (FMAR-p), the Andean push (FAndes-p) and the mantle drag 200
(FMd). 201
202
3. Numerical Modelling 203
The objective of our numerical modelling was not to investigate subduction initiation at a 204
passive margin per se, but rather to test back-arc rifting in the overriding continental plate, by 205
10
slab rollback and trench retreat immediately following subduction initiation. Therefore, the 206
model was designed so as to guarantee that subduction initiates at the model Brazilian margin, in 207
a model setup similar to the SAm in a cross-section from the Altiplano to the MAR through the 208
SE Brazilian margin. Here the continent and the ocean are about 3,000 km long each. 209
210
3.1. Numerical code and boundary conditions 211
The numerical code employed here, MVEP2, is a further-development of 212
MILAMIN_VEP, which has been described in detail elsewhere (Kaus, 2010; Thielmann and 213
Kaus, 2012; Schmeling et al., 2008). For completeness, a brief summary is provided in Johnson 214
et al. (2014). 215
The incompressible Stokes system of equations is solved with the extended Boussinesq 216
approximation. Both shear heating and adiabatic (de)compression are taken into account in the 217
energy equation. Density in the models is a function of rock type, pressure and temperature. A 218
viscoplastic constitutive relationship is used, in which the dominant rheology is diffusion creep, 219
dislocation creep or plastic yielding. For mantle rocks we used dislocation creep (Hirth and 220
Kohlstedt, 2003), whereas the crust was assumed to have a wet quartz rheology (Ranalli, 1995). 221
The constitutive equations used in the present modelling have the form: 222
223
𝜀 = 𝜎$ ∗ 𝑓𝐻(𝑂* ∗ 𝐴 ∗ exp (−𝐸 + 𝑃𝑉) 𝑅 ∗ 𝑇 for dislocation creep 224
and 225
𝜀 = 𝜎$ ∗ 𝑑:; ∗ 𝐴 ∗ exp (−𝐸 + 𝑃𝑉) 𝑅 ∗ 𝑇 for diffusion creep 226
227
where A is a constant, n is the stress exponent, d is the grain size, p is the grain size exponent, 228
fH20 is the water fugacity, r is the water fugacity exponent, E is the activation energy, V is the 229
activation volume, R is the gas constant, and T is the temperature. 230
11
The parameters in the Arrhenius term reflect the viscosity of the rock, and some have 231
reasonably well constrained values but others do not. This is the case of V for olivine (the major 232
constituent of the mantle), for which experimentally determined values vary significantly, 233
statistically in the range 13±8 cm3 mol-1 (Korenaga and Karato, 2008). In order to be on the 234
conservative side, we used the average value 13 in the present models. However, we tested the 235
effects of varying V on subduction initiation, and present the corresponding graphs below. 236
We also used dry and wet rheologies to simulate water-poor (lithospheric and sub-237
lithospheric mantles) and water-rich (oceanic and continental crust) rocks, respectively. Note that 238
wet rheology means weaker rock. 239
Cohesion and angle of internal friction control the plastic behaviour. The smaller their 240
values the weaker the rock. 241
With the constitutive equations and parameters from Hirth and Kohlstedt (2003) that we 242
used in the simulations, the viscosity becomes very large in the mantle lithosphere (larger than 243
1025 Pa s), whereas strain rates in some other areas are sufficiently high to result in viscosities 244
lower than 1016 Pa s. Given that nine orders of magnitude cannot be handled by the numerical 245
code, we imposed viscosity lower and upper cut-offs of 1018 and 1023 Pa s, respectively (in 246
agreement with what is done in other lithosphere dynamics codes). 247
An overview of the model parameters used in the current set of simulations is given in 248
Table 1. 249
250
Table 1. Summary of model parameters. 251

12
252
253
The governing equations were solved with the 2-D finite element code MVEP2. The code 254
is written in MATLAB, and has been made more efficient by employing the techniques 255
described in Dabrowski et al. (2008). Tracers are used to track material properties, and the code 256
is used in ALE mode with regular remeshing to ensure that elements do not become too 257
distorted. It has been benchmarked for a large number of test problems, as well as against 258
various analytical solutions (e.g. SolCx or weak/strong inclusion setups), as described in a 259
number of publications (Gerya and Yuen, 2007; May and Moresi, 2008; Schmeling et al., 2008; 260
Crameri and Kaus, 2010; Yamato et al., 2011; Crameri et al., 2012; Thielmann and Kaus, 2012). 261
The model employs a computational mesh of 257x257 nodes, which is refined towards 262
the lithosphere, such that there is a resolution of 3.9 km (horizontal) by 2.1 km (vertical) in the 263
lithosphere, and 3.9 by 3.2 km below a depth of 330 km. Compositions are tracked on tracers of 264
which there are initially ~0.8 million. The code injects particles in finite elements that have less 265
Phaseρ
(kg/m3)C
(MPa)φ (º)
V (cm3/mol)
Max yield (MPa) Creep law
OC 3100 5 2 1 50 Wet olivineSOLM 3300 20 30 15 50 Dry olivineCC 2850 5 2 0 50 Wet quartziteSCLM 3250 20 30 15 50 Dry olivineWLPB 3300 5 2 1 50 Wet olivineSLM 3300 20 30 13* 50 Dry olivineVLW 3250 1 1 1 50 Wet quartzite
ρ = density; C = cohesion ; φ = angle of internal friction; V = activation volume; Max yield = maximum yield stress regarding plasticity; Creep law = wet and dry olivine from Hirth and Kohlstedt (2003), and wet quartzite from Ranalli (1995)
OC = oceanic crust; SOLM = sub-oceanic lithospheric mantle; CC = continental crust; SCLM = sub-continental lithospheric mantle; WLPB = weak layer at plate boundary; SLM = sub-lithospheric mantle; VLW = vertical lithospheric weakness
* Varied from 6 to 20 in the experiments to test the effects of V
13
than two particles during a simulation. 266
The boundary conditions in all models were “free slip” at the bottom and sidewalls, and 267
“free surface ” or “stress free” at the top. Given that topography is due to isostatic equilibrium, 268
and that the boundary condition at the top of the model is “no stress”, topography could build up 269
in the initial stages reproducing to a first order the observed topography in the SAm: higher and 270
positive where the continental crust and lithospheric mantle are thick, still positive but lower 271
where the continental crust and lithospheric mantle are thinner, and negative and deep in the 272
oceanic domain. Later the topography reflected the evolution of the simulations. 273
In all models, no velocities were imposed at the sidewalls, which means that all 274
simulations were fully driven by gravity. 275
276
3.2. Model setup 277
The 2-D model domain was 6,000 km wide and 1,400 km deep (Figs. 4 and 5). It 278
comprised two domains, one continental and one oceanic , each 3,000 km wide. The contact 279
between oceanic and continental domains had a dip of 45º toward the west, and comprised a 15 280
km thick weak layer between the continental and oceanic phases. The continental SAm had a 281
lithospheric structure similar to the one deduced from geophysics for the SAm (Heit et al., 2007 282
for the Andean sector; Artemieva and Mooney, 2001, and Feng et al., 2007 for the remaining 283
lithosphere to the east of the Andes): (1) a deep crust 60 km thick and 600 km wide (model 284
Andean Plateau) bounded by the western wall. East of the model Andean Plateau, the crust was 285
40 km thick. (2) A sub-continental lithospheric mantle 140 km thick and 700 km wide below the 286
model Andean Plateau, followed to the east by a 150 km thick and 1,600 km wide lithosphere, 287
which finally wedged out to 100 km thick in the last 700 km before the contact with the oceanic 288
plate. The oceanic domain comprised an 85 km thick and 3,000 km wide sub-oceanic 289
lithospheric mantle, capped by a 15 km thick and 3,000 km wide oceanic crust. We are aware 290
14
that 15 km might seem too thick, but this is equivalent to the thickness of oceanic crust plus 291
capping sediments near the margin. Additionally, 15 km are needed for the code to properly 292
resolve the phase. Continental and oceanic domains were underlain by a sub-lithospheric mantle 293
till –1,400 km. 294
In order to complete the model setup, we added two relatively small weak layers: (1) one 295
was oblique, 100 km long and 15 km thick (true orthogonal thickness), along the westward 45º 296
dipping contact between ocean and model SAm; (2) the other was vertical, 20 km thick and 110 297
km deep, just within the sub-continental lithospheric mantle, therefore with top at –40 km. The 298
inclusion of this vertical lithospheric weakness is justified, because the Brazilian continental 299
lithosphere is deeply cut by lithospheric-scale shear zones (e.g. Vauchez and Tommasi, 2003), 300
many of them approximately parallel to the Brazilian continental margin. They extend from N 301
Uruguay to S Brazil (e.g. Tommasi et al., 1994; Passarelli et al., 2010), some stretch across 302
Central Brazil (e.g. Passarelli et al., 2010), and other deep shear zones occur in NE Brazil (e.g. 303
Vauchez et al., 1995; Vauchez and Tommasi, 2003). Some of these have been reactivated to 304
produce the Cretaceous Basins in NE Brazil (e.g. Matos, 1992), and most of them have 305
subsequently have been reactivated again to produce inversion of the earlier formed basins (e.g. 306
Gurgel et al., 2013; Marques et al., 2014; Nogueira et al., 2015). Current reactivation of the 307
major shear zones has been reported for NE Brazil (e.g. Bezerra and Vita-Finzi, 2000). 308
We used the following temperature profile in the continental SAm and sub-lithospheric 309
oceanic SAm: linear with a slope of 13 ºC/km from 0 to –100 km; linear with a slope of 0.67 310
ºC/km from –100 to –400 km, so that temperature was 1500 ºC at 400 km (top of transition zone, 311
experimentally controlled by olivine to spinel phase change); linear with a slope of 0.74 ºC/km 312
from –400 to –670 km, so that temperature was 1700 ºC at 670 km (bottom of transition zone, 313
experimentally controlled by spinel to perovskite + oxides phase change); and linear adiabatic 314
temperature gradient of 0.3 (Ranalli, 1995), so that the temperature increased till the bottom of 315
15
the model domain (–1,400 km), where initially it was 1919 ºC. In the model including a mid-316
ocean ridge, the thermal profile in the oceanic domain was that of an oceanic lithosphere from 317
the rift to the continental margin (Turcotte and Schubert, 2014). Thermal boundary conditions 318
were isothermal at the top and bottom (in accordance with the initial geotherm), and flux-free at 319
the side boundaries. 320
321
3.3. Model results 322
Here we present the results of three main models: Model 1 – composed of one continent 323
and one ocean without a mid-oceanic rift (MOR), in order to serve as reference for comparison 324
with the model with a MOR. Model 2 – composed of one continent and one ocean with a MOR, 325
to simulate subduction initiation in a section from the Andes to the MAR. Model 3 – similar to 326
Model 2, but with a full Atlantic and part of Africa. The lengths of model SAm and Atlantic are 327
similar to the natural lengths in a section through the Altiplano and SE Brazil. 328
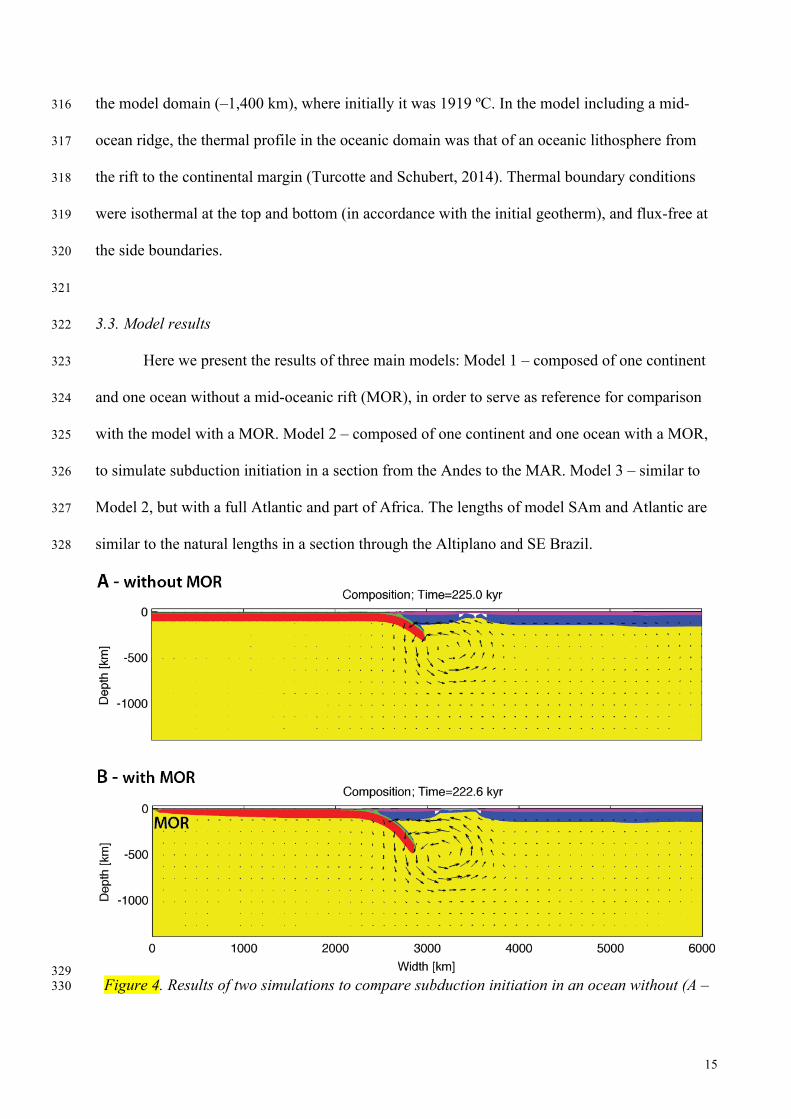
329 Figure 4. Results of two simulations to compare subduction initiation in an ocean without (A – 330
16
Model 1) and with (B – Model 2) a mid-ocean rift (MOR). The only difference in the initial setup 331
between the two models was the temperature profile in the oceanic lithosphere. Note that 332
subduction initiated faster when there was a MOR. 333
334
Model 1 335
Given the objectives that we defined for these simulations, we only present one result for 336
comparison with Model 2 (Fig. 4). Despite the only difference in the initial setup between the 337
two models being the temperature profile in the oceanic lithosphere, subduction initiated 338
significantly faster in the model with a MOR. From these results we infer that ridge-push added 339
to the other topographic forces to make subduction initiation faster. 340
341
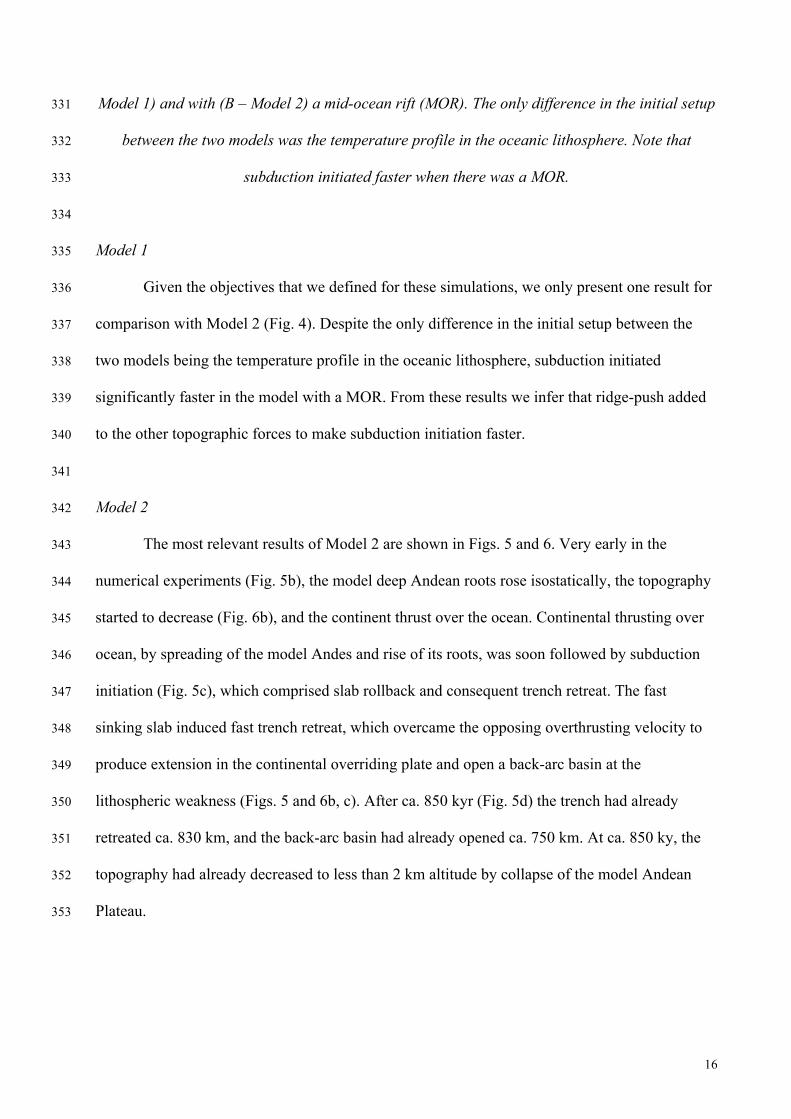
Model 2 342
The most relevant results of Model 2 are shown in Figs. 5 and 6. Very early in the 343
numerical experiments (Fig. 5b), the model deep Andean roots rose isostatically, the topography 344
started to decrease (Fig. 6b), and the continent thrust over the ocean. Continental thrusting over 345
ocean, by spreading of the model Andes and rise of its roots, was soon followed by subduction 346
initiation (Fig. 5c), which comprised slab rollback and consequent trench retreat. The fast 347
sinking slab induced fast trench retreat, which overcame the opposing overthrusting velocity to 348
produce extension in the continental overriding plate and open a back-arc basin at the 349
lithospheric weakness (Figs. 5 and 6b, c). After ca. 850 kyr (Fig. 5d) the trench had already 350
retreated ca. 830 km, and the back-arc basin had already opened ca. 750 km. At ca. 850 ky, the 351
topography had already decreased to less than 2 km altitude by collapse of the model Andean 352
Plateau. 353
17
354
Figure 5. A to D are images of Model 2 at different time steps, showing: (A) initial setup; (B) 355
early continental overthrusting, trench retreat and break-up in the overriding SAm; (C) 356
subduction proper, and consequent opening of back-arc basin (BAB); and (D) beginning of 357
18
slow-down in trench retreat due to faster spreading in the MAR, as shown by different slopes in 358
dashed and dotted lines (cf. graph in Fig. 8). Note that the initial deep Andean roots rose and 359
almost vanished before 1 Ma. 360
361
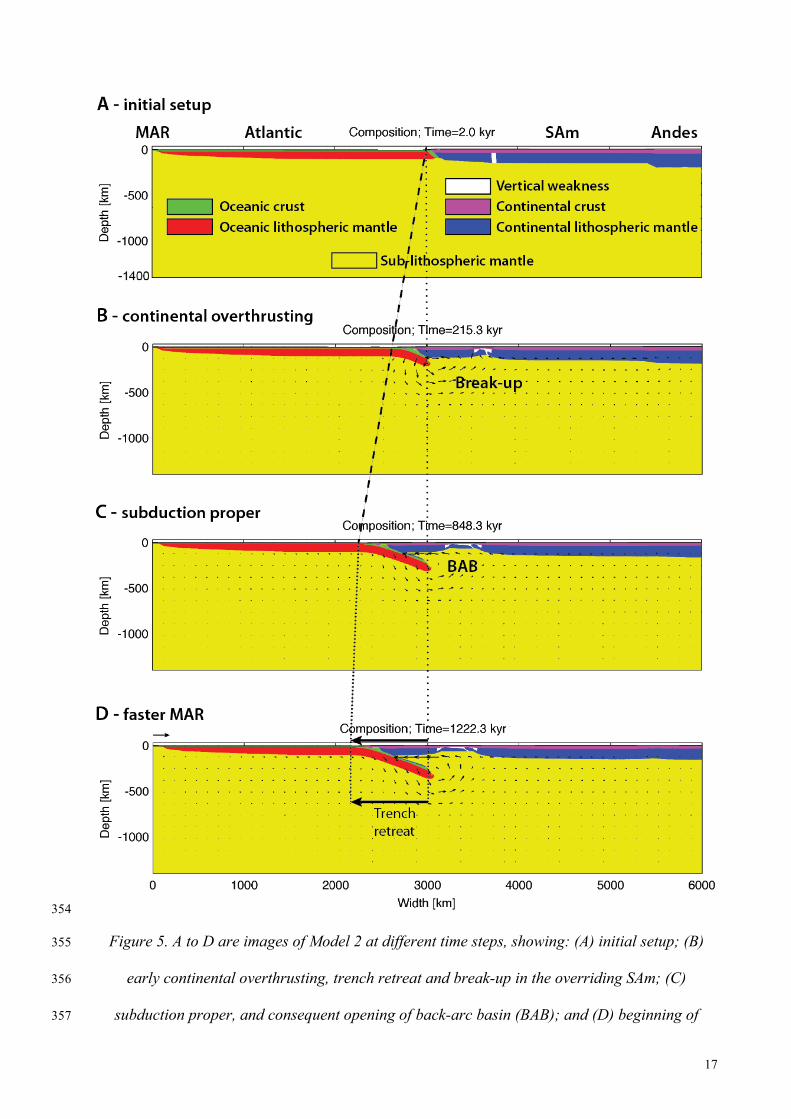
Figure 6. Images depicting the topographic evolution in Model 2. In the initial stage (A) there is 362
a model Andean Plateau at ca. 4 km height (as in the Andes), which decreases altitude by 363
gradual collapse and horizontal spreading (B, C), until less than 2 km altitude before 1 Ma (C). 364
Spreading of the model SAm produces thrusting of continent over ocean, and ultimately 365

19
subduction initiation with development of a deep trench (B). Self-sustained subduction includes 366
rollback, which produces trench retreat and a back-arc basin (BAB) (C, D). Vertical scale 367
exaggerated 330 x for a clear view of the topography. 368
369
In the beginning, the collapse of the Andes induces thrusting of continent over ocean at 370
the margin, therefore the whole continent is under compression (Fig. 5a). When subduction 371
initiates, the trench retreats, and at a certain time step trench velocity overcomes continental 372
spreading and a back-arc starts to form (this can be more clearly seen in the supplementary 373
videos). At this stage, the force balance shown in Fig. 3 is changed, and the back-arc basin 374
widens (Fig. 5c). 375
Given that the position of the rift did not change until ca. 1 Ma (Fig. 5c, d), we infer that 376
slab-pull was not enough to drag the oceanic lithosphere over the underlying mantle. Therefore, 377
trench retreat was fast. Conversely, after ca. 1 Ma the MOR was spreading (Fig. 5d), which 378
means that the oceanic lithosphere was sliding over the mantle and, therefore, trench retreat 379
slowed down to the lowest velocities. 380
The temperature map (Fig. 7a) shows the initial temperature profile, including the typical 381
oceanic profile wedging out toward the MOR, and the temperature evolution after ca. 850 ky. 382
Noticeable at this stage is the cold slab in a hot mantle due to thermal disequilibrium between 383
slab (colder by fast advection of low temperatures to depth with small thermal re-equilibration 384
with host mantle) and host mantle (hotter). The great temperature contrast between slab (cold 385
and therefore denser, as shown in Fig. 7b) and host mantle was in great part responsible for the 386
fast subduction. The temperature profile at ca. 850 ky also shows a hot back-arc basin, with 387
sharp contacts between hot rising mantle and cold continental lithosphere. 388
The stress map (Fig. 7b) shows stress concentration in the oceanic lithosphere in the early 389
stages, gradually increasing from the MOR towards the contact with the continental lithosphere. 390

20
On the continental side, stresses concentrated mostly close to the weak zones, i.e. the Andean 391
roots, the ocean/continent contact, and the lithospheric vertical weakness. Later on, stresses 392
concentrated mostly in the sinking slab, and between the Andes and the newly formed back-arc 393

21
basin. 394
22
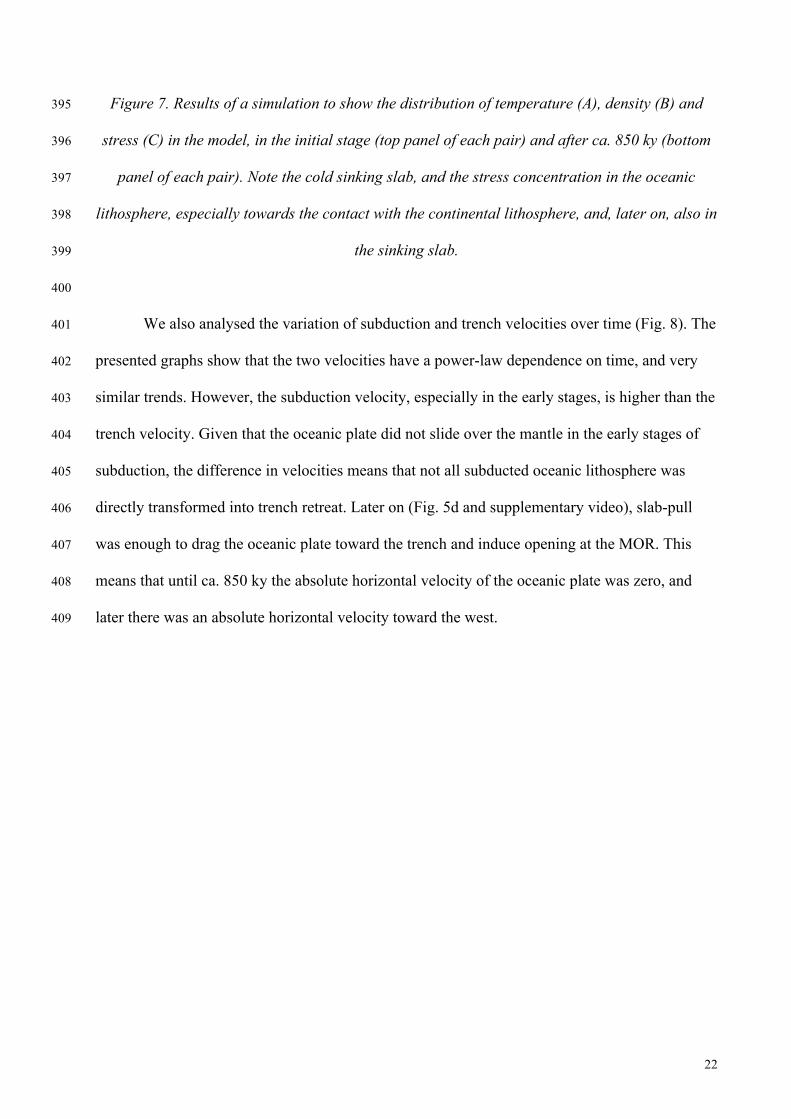
Figure 7. Results of a simulation to show the distribution of temperature (A), density (B) and 395
stress (C) in the model, in the initial stage (top panel of each pair) and after ca. 850 ky (bottom 396
panel of each pair). Note the cold sinking slab, and the stress concentration in the oceanic 397
lithosphere, especially towards the contact with the continental lithosphere, and, later on, also in 398
the sinking slab. 399
400
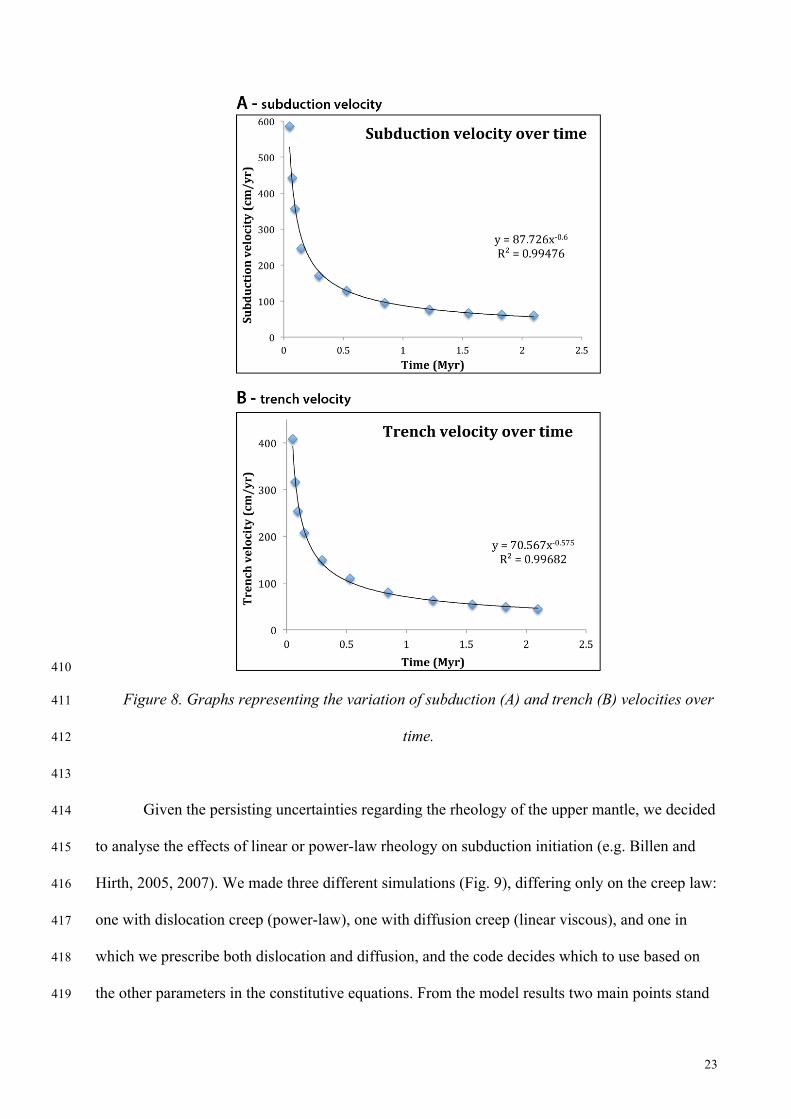
We also analysed the variation of subduction and trench velocities over time (Fig. 8). The 401
presented graphs show that the two velocities have a power-law dependence on time, and very 402
similar trends. However, the subduction velocity, especially in the early stages, is higher than the 403
trench velocity. Given that the oceanic plate did not slide over the mantle in the early stages of 404
subduction, the difference in velocities means that not all subducted oceanic lithosphere was 405
directly transformed into trench retreat. Later on (Fig. 5d and supplementary video), slab-pull 406
was enough to drag the oceanic plate toward the trench and induce opening at the MOR. This 407
means that until ca. 850 ky the absolute horizontal velocity of the oceanic plate was zero, and 408
later there was an absolute horizontal velocity toward the west. 409
23
410
Figure 8. Graphs representing the variation of subduction (A) and trench (B) velocities over 411
time. 412
413
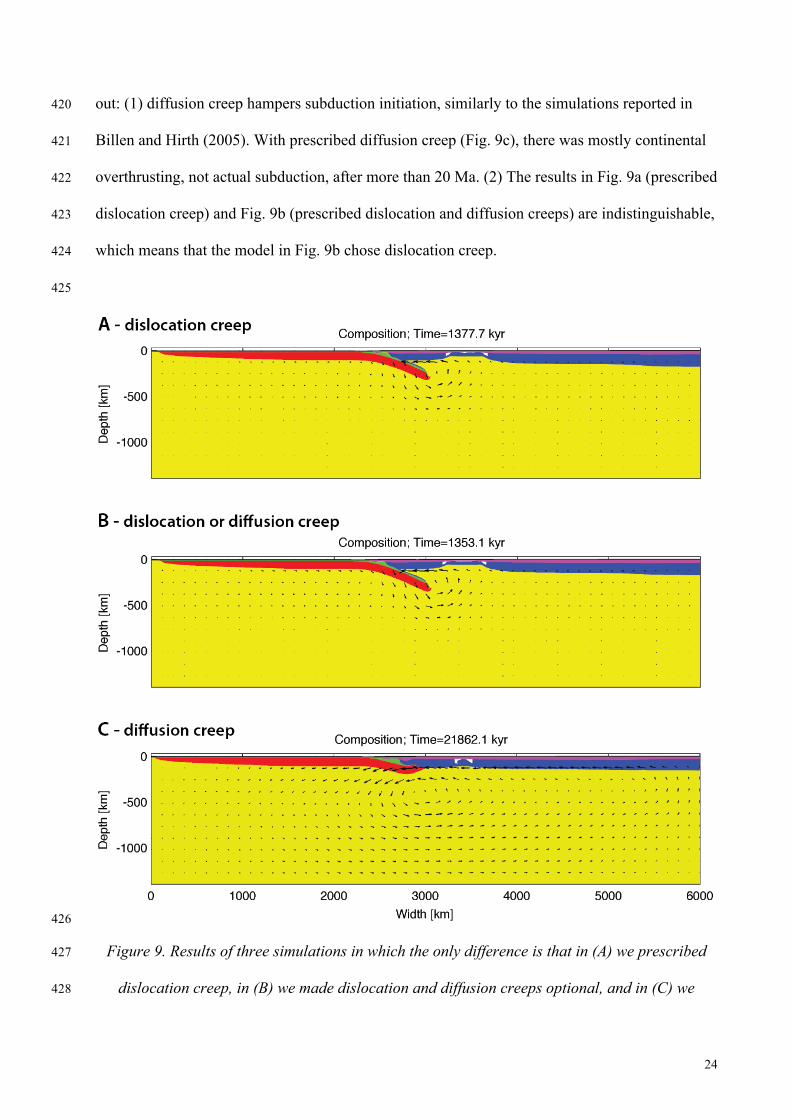
Given the persisting uncertainties regarding the rheology of the upper mantle, we decided 414
to analyse the effects of linear or power-law rheology on subduction initiation (e.g. Billen and 415
Hirth, 2005, 2007). We made three different simulations (Fig. 9), differing only on the creep law: 416
one with dislocation creep (power-law), one with diffusion creep (linear viscous), and one in 417
which we prescribe both dislocation and diffusion, and the code decides which to use based on 418
the other parameters in the constitutive equations. From the model results two main points stand 419
24
out: (1) diffusion creep hampers subduction initiation, similarly to the simulations reported in 420
Billen and Hirth (2005). With prescribed diffusion creep (Fig. 9c), there was mostly continental 421
overthrusting, not actual subduction, after more than 20 Ma. (2) The results in Fig. 9a (prescribed 422
dislocation creep) and Fig. 9b (prescribed dislocation and diffusion creeps) are indistinguishable, 423
which means that the model in Fig. 9b chose dislocation creep. 424
425
426
Figure 9. Results of three simulations in which the only difference is that in (A) we prescribed 427
dislocation creep, in (B) we made dislocation and diffusion creeps optional, and in (C) we 428
25
prescribed diffusion creep. Note that the results in A and B are indistinguishable, which means 429
that the model in (B) chose dislocation creep. Also note that, with prescribed diffusion creep (C), 430
after more than 22 Ma there was mostly continental overthrusting, not actual subduction. 431
432
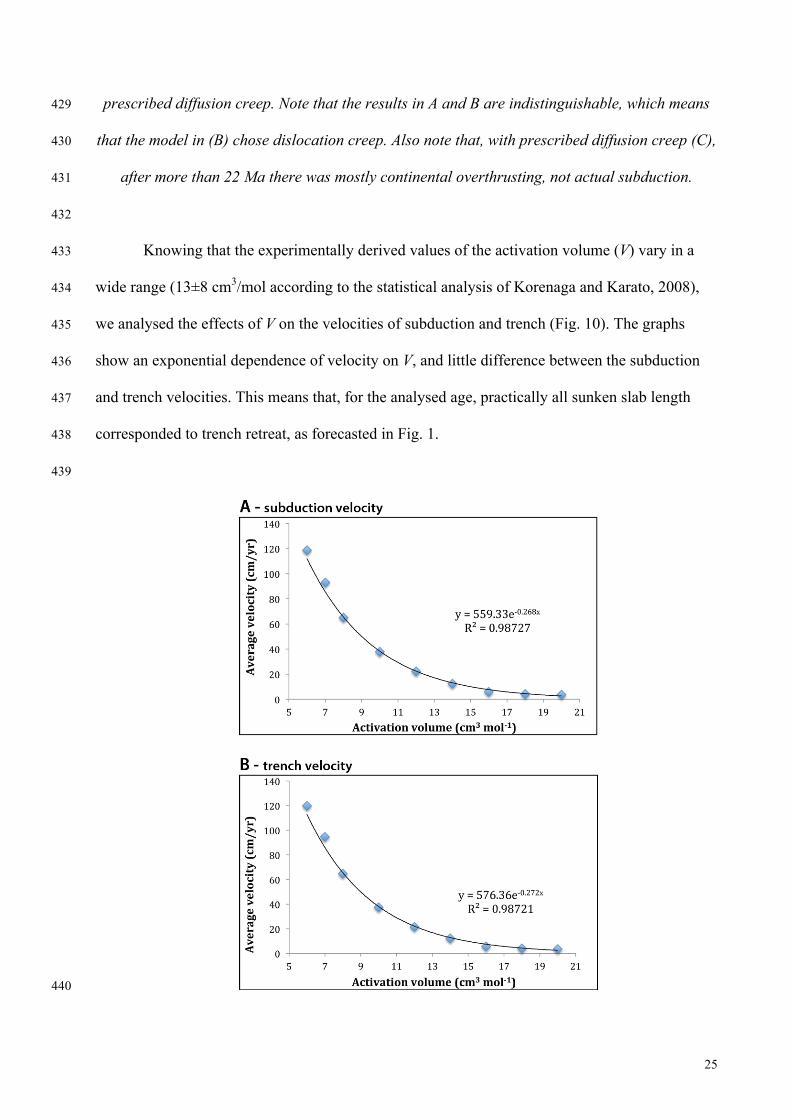
Knowing that the experimentally derived values of the activation volume (V) vary in a 433
wide range (13±8 cm3/mol according to the statistical analysis of Korenaga and Karato, 2008), 434
we analysed the effects of V on the velocities of subduction and trench (Fig. 10). The graphs 435
show an exponential dependence of velocity on V, and little difference between the subduction 436
and trench velocities. This means that, for the analysed age, practically all sunken slab length 437
corresponded to trench retreat, as forecasted in Fig. 1. 438
439
440

26
Figure 10. Graphs to show the effects of activation volume (V) on the velocities of subduction 441
(A) and trench (B). Note the small difference between the two velocities. 442
443
Model 3 444
This model is an extension of Model 2 to encompass a full ocean with a MOR (model of 445
Atlantic with the MAR) and the continent on the opposite side of the ocean (model Africa). We 446
limit ourselves to presenting Fig. 11 (and supplementary video 2) with the most representative 447
time steps for comparison with Model 2 in Fig. 5. 448
27
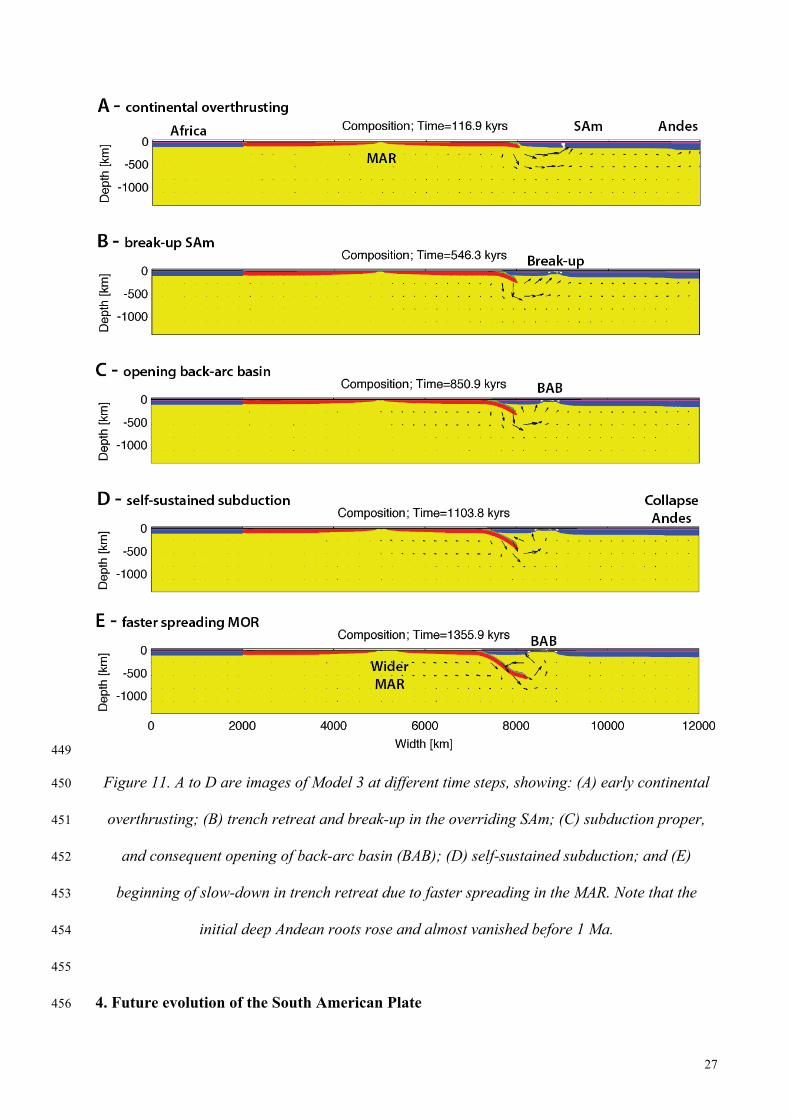
449
Figure 11. A to D are images of Model 3 at different time steps, showing: (A) early continental 450
overthrusting; (B) trench retreat and break-up in the overriding SAm; (C) subduction proper, 451
and consequent opening of back-arc basin (BAB); (D) self-sustained subduction; and (E) 452
beginning of slow-down in trench retreat due to faster spreading in the MAR. Note that the 453
initial deep Andean roots rose and almost vanished before 1 Ma. 454
455
4. Future evolution of the South American Plate 456

28
When the SAm breaks up along the Atlantic passive margin to initiate subduction, the 457
force balance depicted in Fig. 3 will change significantly, because two new plates will form that 458
were previously welded together and now move independently: the continental SAm (CSAm) 459
and the oceanic SAm (OSAm). Once subduction has initiated, a major geodynamic 460
reconfiguration of the SAm will take place, because the stresses will shift from compressive (cf. 461
Fig. 3) to tensile on the continental SAm, as well illustrated by the numerical modelling with the 462
opening of a back-arc basin. 463
464
465
Figure 12. Sketch of forecasted evolution stages, in W-E sections, after subduction initiation at 466
the Brazilian passive margin. A – current tectonic setting. B – subduction initiation at the 467
Brazilian margin will induce, by trench retreat, formation of an island arc and a back-arc 468
basin in the overriding plate. The Andes will collapse because the present compressive 469
29
stresses will invert to tensile, and thus lose support. A new island arc will form with a back-470
arc basin. C – final stage after a few millions of years, in which the Andes are replaced by 471
an island arc with a back-arc basin, similarly to the setting 150 Ma ago with a back-arc 472
basin known as the Neuquén Basin. Full arrows represent velocities, and half arrows 473
indicate fault kinematics. 474
475
The ridge push from the east (MAR push) will no longer affect the CSAm, because the 476
current Atlantic margin will become a trench (Figs. 3, 12b, 13) and ridge-push will add 477
positively to the newly born slab-pull and promote fast subduction similarly to the presented 478
simulations (Figs. 4 and 5d). If subduction initiation is accompanied by subduction roll-back and 479
trench retreat, as indicated by previous and here presented models (Figs. 4 and 5), the continental 480
SAm will be under extension, instead of the current compression. Given that the subduction roll-481
forth (compression due to trench advance) in the west (Nazca Plate) is just relative (e.g. Russo 482
and Silver, 1996, in particular their Fig. 3), the trench motion will go back to absolute trench 483
retreat to the west, so inducing extension in the overriding SAm, because the westward velocity 484
of South America will flip to eastward velocity. Without buttressing from east (ridge push) and 485
west (relative roll-forth)(Fig. 3), the Andes will collapse (Figs. 5, 6 and 12b, c). The sinking of 486
the new subducting Atlantic slab, and associated rollback subduction and trench retreat (Figs. 5, 487
6 and 12b), will drive extension in the overriding plate with formation of an island arc (like the 488
Japanese), with a back-arc basin (like the Sea of Japan). If an oceanic rift initiates in the back-489
arc, then a new plate will form comprised of the new island arc. 490

30
491
Figure 13. Forecasted scenario for the reconfiguration of the South American plate. Background 492
image is a shaded relief image from ETOPO5 digital data 493
(http://www.ngdc.noaa.gov/mgg/global/relief/etopo5/images/tif/slides_t/slide15.tif). 494
495
The new slab pull associated with the sinking Atlantic lithosphere will add positively to 496
the MAR push (similarly to the East Pacific Rise where full spreading rates can amount to 120 497
mm/yr), and therefore increase the MAR spreading rate substantially (presently only ca. 30 498
mm/yr), similarly to what we observed in the numerical simulations (Fig. 5d, and supplementary 499
videos). Then, the shape of the MAR will also change, especially by increasing its volume 500
(similarly to the East Pacific Rise). The CSAm’s velocity will flip from westward to eastward 501
directed, due to new eastward trench suction in the east, and loss of westwards MAR push. 502

31
Without the westward CSAm’s velocity, the relative roll-forth of the Nazca plate will become 503
absolute rollback (Russo and Silver, 1996), and the push of the hinge roll-forth on the western 504
boundary of the CSAm will vanish and invert to trench suction. With pull from the east and west 505
(trench suction, opposite to current push), the Andes will completely collapse (Figs. 6 and 12b, 506
c). Due to Nazca absolute rollback, an island arc will form in western CSAm, with a back-arc 507
basin separating the new island arc from the CSAm (Fig. 12c), similarly to what has already 508
happened in the past with the opening of the Neuquén Basin (cf. Fig. 3 in Russo and Silver, 509
1996). If an oceanic rift initiates in the back-arc, then a new tectonic plate will form comprised 510
of the new island arc. Rifting along the E and W boundaries of the SAm will isolate the old, 511
thick and resistant Brazilian shield, which will then comprise a new tectonic plate (Figs. 12c, and 512
13). 513
One can argue that the velocities in our models are too high, and question if such fast 514
rates are reasonable or not in the Earth; that models have limitations, and how the model results 515
compare with previous work and observations in nature; that there are no known natural 516
counterparts in the current known subduction velocities, and we should validate the numerical 517
results with natural examples; that the Andes could be supported by mantle drag so preventing 518
collapse; and that the three-dimensional nature of the prototype is not taken into account in our 519
2-dimensional models. In the following we discuss these questions. 520
First of all, we recall the reader that the objective of this study is the catastrophic end-521
member of subduction initiation, which is the one capable of producing catastrophic 522
consequences in the Earth system. Having made this point clear, the main question is if such fast 523
rates are reasonable or not in the Earth. There is only one answer to this question: yes, if we use 524
the current knowledge of Earth’s rheology through the experimentally deduced constitutive 525
equations and experimentally determined parameters. This is what we did in our models; using 526
well-known equations and conservative values of the parameters that are still less well 527

32
established, we show that subduction can initiate very fast. In fact, previous models (cf. Fig. 6 of 528
Nikolaeva et al., 2010) showed that the velocities of subduction initiation can be of the order of 529
the ones now obtained in our models. We just tested different parameters. Moreover, we also 530
tested the effects of diffusion and dislocation creeps, and the models show that under the used 531
setup the code chose dislocation creep. 532
Regarding mantle drag, the current knowledge about the SAm has shown that the stresses 533
born from topography gradients in the SAm are propagated throughout the SAm (e.g. Coblentz 534
and Richardson, 1996), which means that the mantle is not resistive to the point of preventing 535
stresses to propagate through the entire plate. Moreover, it goes against all evidence of current 536
deformation along the SAm’s Atlantic continental margin and interior Brazil (e.g. Bezerra and 537
Vita-Finzi, 2000; Marques et al., 2014; Nogueira et al., 2015; Cogné et al., 2001, 2012, 2013). If 538
mantle drag could support the Andes, then the forces available to initiate subduction at the 539
Brazilian margin would most likely be insufficient to initiate subduction (Nikolaeva et al., 2011). 540
Based on the current knowledge of stress distribution in the SAm, one main premise of our 541
modelling is that the Andes push the entire SAm lithosphere to the east, thus being able to trigger 542
subduction initiation at the Brazilian margin. This is also what our models show. With well-543
known constitutive equations and reasonable parameters used by geodynamic modellers, mantle 544
drag exists in our models but not to the point of preventing Andean collapse and propagation of 545
the stresses to the Brazilian margin, with consequent subduction initiation. 546
The remaining questions have no straightforward answer. Our models cannot be directly 547
compared with previous models, because our models were fully gravitational (which is not the 548
case of most previous models, in which velocities are prescribed at the boundaries and therefore 549
do not reflect natural gravitational forces), incorporated the effects of topographical forcing (only 550
comparable to Nikolaeva et al., 2011; Marques et al., 2013), and had a pressure-dependent 551
density (which does not exist in analogue modelling and has not been used in numerical 552

33
modelling). We cannot compare simulated subduction initiation with present-day subduction, 553
because everywhere in the Earth subduction is mature, and nowhere is at the early stage of 554
subduction initiation that we analyse in our models. We are aware of the three-dimensional 555
effects on subduction initiation (Marques et al., 2014). These authors showed that the curvature 556
of a passive margin can influence the timing of subduction initiation, but this does not mean that 557
subduction will not initiate. 558
Finally, the argument that the model has not been validated by natural examples is 559
misleading, because: (1) the “Absence of evidence is not evidence of absence”. (2) To our 560
knowledge, there is no known record of the very early stages of subduction initiation at a passive 561
margin of Atlantic type, even in the Cainozoic (e.g. Stern, 2004); therefore we cannot compare 562
our models with nature. Subduction initiation in the Bay of Biscay (e.g. Le Pichon and Sibuet, 563
1971; Boillot et al., 1979; Alvarez-Marrón et al., 1996; Alvarez-Marrón et al., 1997) underwent 564
only the first stage as defined by Nikolaeva et al. (2010), which is thrusting of continental Iberia 565
over oceanic Bay of Biscay. However, the statement there is no known record of the very early 566
stages of subduction initiation at a passive margin of Atlantic type does not mean that it does 567
exist. It means that it has so far not been found. Our hope is that the present study, based on well-568
established Physics, although speculative about the consequences, motivates geologists to go and 569
look for the missing evidence. 570
571
5. Impact on the Earth system 572
The Andean cordillera stretches north south for ca. 7,000 km, it includes the impressive 573
Altiplano-Puna Plateau with an average altitude of ca. 4 km, and it spreads most types of climate. 574
If we accept that the Andean cordillera is a first order control of atmospheric circulation (Insel et 575
al., 2010), then its collapse will produce significant changes in atmospheric circulation, and thus 576
drive climate change. If our predictions are correct, then SAm’s reconfiguration will include the 577

34
opening of large-scale oceanic circulation between the Pacific and the Atlantic, currently 578
restricted to SAm’s southern end. Once the new oceanic circulation initiates, it will have a 579
significant impact on the thermohaline circulation, whose large heat transport makes it critical 580
for atmospheric circulation, and therefore climate change (Manabe and Stouffer, 1993; 581
Rahmstorf, 1997; Stocker and Schmittner, 1997; Clark, et al., 2002; Rahmstorf, 2002). 582
Two new island arcs (and possibly two new rifts) and a much faster spreading MAR, 583
each able to reach 5 to 7,000 km length, might throw significant amounts of greenhouse and 584
toxic gases into the hydrosphere and atmosphere, whose effects on climate change (Cox et al., 585
2013; Cox et al., 2008; Lewis et al., 2009; Malhi et al., 2008) and biotic crisis have been 586
extensively discussed (Kennett and Stott, 1991; MacLeod and Huber, 1996; Wignall and 587
Twitchett, 1996; Wignall, 2001; Grasby et al., 2011; Song et al., 2013; Richoz et al., 2012). The 588
great reconfigurations of SAm and MAR might produce sea-level changes, but this is very 589
difficult to evaluate because there seem to be opposing effects, like the increase in volume of the 590
faster spreading MAR (sea-level rise), and the opening of new seas/oceans (sea-level drop). 591
Anyway, sea level changes are a major concern, and can be produced by variations in the ice 592
caps by climate change (Miles et al., 2013; Hanna et al., 2013). If subduction initiation along 593
the Atlantic SAm propagates to the North American Atlantic margin (complete reconfiguration 594
of the South and North American tectonic plates), then the impact of subduction initiation on 595
global changes can be even much greater. If it is true that flood basalts can be responsible for 596
great mass extinctions in 1 Ma (Duncan and Pyle, 1988; Courtillot et al., 1988), then the 597
geodynamic reconfigurations here forecasted will produce dramatic global changes, because the 598
scale of transformations associated with the subduction initiation process is many orders of 599
magnitude greater. A comparison cannot be made with the impact human activity may have on 600
climate change, but scenarios have been proposed that include natural and anthropogenic causes 601
(Moss et al., 2010). 602
35
To conclude, the substantially increased volcanism all around the South American Plate 603
and in the MAR might release large amounts of greenhouse and toxic gases into the atmosphere 604
and oceans, and the plate reconfiguration will lead to major oceanic and atmospheric circulation 605
changes. Ultimately, these large-scale transformations will trigger global changes and impact the 606
whole Earth system. 607
608
References 609
Alvarez-Marrón, J., et al., 1996. Seismic structure of the northern continental margin of Spain 610
from ESCIN deep seismic profiles. Tectonophysics 264, 355-363. 611
Alvarez-Marrón, J., Rubio, E., Torne, M., 1997. Subduction-related structures in the North 612
Iberian Margin. J. Geophys. Res. 102, 2497-2511. 613
Artemieva, I.M., Mooney, W.D., 2001. Thermal thickness and evolution of Precambrian 614
lithosphere: A global study. Journal of Geophysical Research 106, 16,387–16,414. 615
Artyushkov, E.V., 1987. The forces driving plate motions and compression of the crust in fold 616
belts. In: Composition, Structure and Dynamics of the Lithosphere-Asthenosphere System. 617
Fuchs, K., Froidevaux, C. (Eds.). Geodynamics Series 16, 175-188, AGU. 618
Assumpção, M., 1992. The regional intraplate stress field in South America. Journal of 619
Geophysical Research 97, 11889-11903. 620
Bercovici, D., Long, M.D., 2014. Slab rollback instability and supercontinent dispersal, 621
Geophys. Res. Lett. 41, doi:10.1002/2014GL061251. 622
Bezerra, F.H.R., Vita-Finzi, C., 2000. How active is a passive margin? Paleoseismicity in 623
northeastern Brazil. Geology 28, 591-594. 624
Billen, M.I., Hirth, G., 2005. Newtonian versus non-Newtonian upper mantle viscosity: 625
Implications for subduction initiation. Geophys. Res. Lett. 32, L19304. 626
Billen, M.I., Hirth, G., 2007. Rheologic controls on slab dynamics. Geochem. Geophys. Geosyst. 627

36
8, Q08012. 628
Boillot, G., Dupeuble, P.A., Malod, J., 1979. Subduction and tectonics on the continental margin 629
off northern Spain. Mar. Geol. 32, 53-70. 630
Bürgmann, R., Dresen, G., 2008. Rheology of the Lower Crust and Upper Mantle: Evidence 631
from Rock Mechanics, Geodesy, and Field Observations. Ann. Rev. Earth Planet. Sci. 36, 632
531-567. 633
Capitanio, F.A., Stegman, D.R., Moresi, L.N., Sharples, W., 2010. Upper plate controls on deep 634
subduction, trench migrations and deformations at convergent margins. Tectonophysics 483, 635
80–92. 636
Clark, P.U. et al., 2002. The role of the thermohaline circulation in abrupt climate change. 637
Nature 415, 863−869. 638
Coblentz, D.D., Richardson, R.M., 1996. Analysis of the South American intraplate stress field. 639
Journal of Geophysical Research 101, 8643-8657. 640
Cogné, N., Cobbold, P.R., Riccomini, C., Gallagher, K., 2013. Tectonic setting of the Taubaté 641
Basin (southeastern Brazil): Insights from regional seismic profiles and outcrop data. J. South 642
Am. Earth Sci. 42, 194-204. 643
Cogné, N., Gallagher, K., Cobbold, P.R., 2011. Post-rift reactivation of the onshore margin of 644
southeast Brazil: Evidence from apatite (U-Th)/He and fission-track data. Earth Planet. Sci. 645
Lett. 309, 118-130. 646
Cogné, N., Gallagher, K., Cobbold, P.R., Riccomini, C., Gautheron, C., 2012. Post-breakup 647
tectonics in southeast Brazil from thermochronological data and combined inverse-forward 648
thermal history modelling. Journal of Geophysical Research 117, B11413, 649
doi:10.1029/2012JB009340. 650
Courtillot, V., Feraud, G., Maluski, H., Vandamme, D., Moreau, M.G., Besse, J., 1988. Deccan 651
flood basalts and the Cretaceous/Tertiary boundary. Nature 333, 843-846. 652

37
Cox, P.M. et al., 2008. Increasing risk of Amazonian drought due to decreasing aerosol 653
pollution. Nature 453, 212–215. 654
Cox, P. M. et al., 2013. Sensitivity of tropical carbon to climate change constrained by carbon 655
dioxide variability. Nature 494, 341–344. 656
Crameri, F., Kaus, B., 2010. Parameters that control lithospheric-scale thermal localization on 657
terrestrial planets. Geophys. Res. Lett. 37, L09308. 658
Crameri, F. et al., 2012. A comparison of numerical surface topography calculations in 659
geodynamic modelling: an evaluation of the ‘sticky air’ method. Geophys. J. Int. 189, 38–54. 660
Dabrowski, M., Krotkiewski, M., Schmid, D.W., 2008. MILAMIN: MATLAB-based finite 661
element method solver for large problems. Geochemistry, Geophysics, Geosystems 9, 662
Q04030. 663
Di Giuseppe, E., Faccenna, C., Funiciello, F., van Hunen, J., Giardini, D., 2009. On the relation 664
between trench migration, seafloor age, and the strength of the subducting lithosphere. 665
Lithosphere 1, 121–128. 666
Di Giuseppe, E., van Hunen, J., Funiciello, F., Faccenna, C., Giardini, D., 2008. Slab stiffness 667
control of trench motion: Insights from numerical models. Geochem. Geophys. Geosys. 9, 668
Q02014. 669
Duncan, R.A., Pyle, D.G., 1988. Rapid eruption of the Deccan flood basalts at the 670
Cretaceous/Tertiary boundary. Nature 333, 841-843. 671
Elsasser, W.M., 1971. Sea-floor spreading as thermal convection. Journal of Geophysical 672
Research 76, 1101–1112. 673
Faccenna, C., Giardini, D., Davy, P., Argentieri, A., 1999. Initiation of subduction at Atlantic 674
type margins: insights from laboratory experiments. J. Geophys. Res. 104, 2749–2766. 675
Feng, M., van der Lee, S., Assumpção, M., 2007. Upper mantle structure of South America from 676
joint inversion of waveforms and fundamental mode group velocities of Rayleigh waves. 677

38
Journal of Geophysical Research 112, B04312, doi: 10.1029/2006JB004449. 678
Forsyth, D.W., Uyeda, S., 1975. On the relative importance of the driving forces of plate motion. 679
The Geophysical Journal of the Royal Astronomical Society 43, 163–200. 680
Funiciello, F., Faccenna, C., Giardini, D., Regenauer-Lieb, K., 2003a. Dynamics of retreating 681
slabs: 2. Insights from three-dimensional laboratory experiments. Journal of Geophysical 682
Research 108 (B4), 2207. doi:10.1029/2001JB000896. 683
Funiciello, F., Faccenna, C., Heuret, A., Lallemand, S., Giuseppe, E.D., Becker, T.W., 2008. 684
Trench migration, net rotation and slab-mantle coupling. Earth Planet. Sci. Lett. 271, 233-685
240. 686
Funiciello, F., Moroni, M., Piromallo, C., Faccenna, C., Cenedese, A., Bui, H.A., 2006. Mapping 687
mantle flow during retreating subduction: laboratory models analyzed by feature tracking. 688
Journal of Geophysical Research 111, B03402. doi:10.1029/2005JB003792. 689
Funiciello, F., G. Morra, K. Regenauer-Lieb, D. Giardini, 2003b. Dynamics of retreating slabs: 690
1. Insights from two-dimensional numerical experiments, J. Geophys. Res. 108, 2206, 691
doi:10.1029/2001JB000898. 692
Gerya, T.V., Yuen, D.A., 2007. Robust characteristics method for modelling multiphase visco-693
elasto-plastic thermo-mechanical problems. Phys. Earth Planet. Int. 163, 83–105. 694
Grasby, S. E., Sanei, H., Beauchamp, B., 2011. Catastrophic dispersion of coal fly ash into 695
oceans during the latest Permian extinction. Nature Geosci. 4, 104–107. 696
Gurgel, S.P.P., Bezerra, F.H.R., Corrêa, A.C.B., Marques, F.O., Maia, R.P., 2013. Cenozoic 697
uplift and erosion of structural landforms in NE Brazil. Geomorphology 186, 68-84. 698
Gurnis, M., Hall, C., Lavier, L., 2004. Evolving force balance during incipient subduction. 699
Geochem. Geophys. Geosyst. 5, Q07001, doi:10.1029/2003GC000681. 700
Gvirtzman, Z., Nur, A., 1999. The formation of Mount Etna as the consequence of slab rollback. 701
Nature 401, 782−785. 702
39
Hall, C.E., Gurnis, M., Sdrolias, M., Lavier, L.L., 2003. Catastrophic initiation of subduction 703
following forced convergence across fracture zones. Earth and Planetary Science Letters 212, 704
15–30. 705
Heit, B., Sodoudi, F., Yuan, X., Bianchi, M., Kind, R., 2007. An S receiver function analysis of 706
the lithospheric structure in South America. Geophys. Res. Lett. 34, L14307, doi:10.1029/ 707
2007GL030317. 708
Hirth, G., Kohlstedt, D., 2003. Rheology of the upper mantle and the mantle wedge: A view 709
from the experimentalists. In J. Eiler (ed) Inside the Subduction Factory, Geophysical 710
Monograph American Geophysical Union, Washington, D.C. 138, 83–105. 711
Holt, A., Becker, T.W., Buffett, B.A., 2015. Trench migration and overriding plate stress in 712
dynamic subduction models. Geophys. J. Int. 201, 172–192, doi:10.1093/gji/ggv011. 713
Husson, L., Conrad, C.P., Faccenna, C., 2008. Tethyan closure, Andean orogeny, and westward 714
drift of the Pacific Basin. Earth Planet. Sci. Lett. 271, 303-310. 715
Insel, N., Poulsen, C.J., Ehlers, T.A., 2010. Influence of the Andes Mountains on South 716
American moisture transport, convection, and precipitation. Climate Dynamics 35, 717
1477−1492. 718
Johnson, T.E., Brown, M., Kaus B.J.P., Van Tongeren, J.A., 2014. Delamination and recycling 719
of Archean crust caused by gravitational instabilities. Nature Geoscience 7, 47-52. 720
Karato, S.-I., Wu, P., 1993. Rheology of the Upper Mantle: A Synthesis. Science 260, 771-778. 721
Kaus, B., 2010. Factors that control the angle of shear bands in geodynamic numerical models of 722
brittle deformation. Tectonophysics 484, 36–47. 723
Kennett, J.P., Stott, L.D., 1991. Abrupt deep-sea warming, palaeoceanographic changes and 724
benthic extinctions at the end of the Palaeocene. Nature 353, 225−229. 725
Kincaid, C., Griffiths, R.W., 2003. Laboratory models of the thermal evolution of the mantle 726
during rollback subduction. Nature 425, 58–62. 727
40
Kincaid, C., Olson, P., 1987. An experimental study of subduction and slab migration. J. 728
Geophys. Res. 92, 13,832–13,840. 729
Korenaga, J., Karato, S.-I., 2008. A new analysis of experimental data on olivine rheology. J. 730
Geophys. Res. 113, B02403, doi:10.1029/2007JB005100. 731
Lallemand, S., Heuret, A., Faccenna, C., Funiciello, F., 2008. Subduction dynamics as revealed 732
by trench migration. Tectonics 27, TC3014, doi:10.1029/2007TC002212. 733
Le Pichon, X., Sibuet, J.C., 1971. Western extension of the boundary between European and 734
Iberian plates during the Pyrenean orogeny. Earth Planet. Sci. Lett. 12, 83-88. 735
Lewis, S.L. et al., 2009. Increasing carbon storage in intact African tropical forests. Nature 457, 736
1003–1006. 737
Lu, G., Kaus, B., Zhao, L., Zheng, T., 2015. Self-consistent subduction initiation induced by 738
mantle flow. Terra Nova 27, 130–138. doi:10.1111/ter.12140 739
MacLeod, K.G., Huber, B.T., 1996. Reorganization of deep ocean circulation accompanying a 740
Late Cretaceous extinction event. Nature 380, 422−425. 741
Malhi, Y. et al., 2008, Climate change, deforestation, and the fate of the Amazon. Science 319, 742
169–172. 743
Manabe, S., Stouffer, R.J., 1993. Century-scale effects of increased atmospheric CO2 on the 744
ocean-atmosphere system. Nature 364, 215−218. 745
Marques, F.O. et al., 2013. Testing the influence of far-field topographic forcing on subduction 746
initiation at a passive margin. Tectonophysics 608, 517−524. 747
Marques, F.O., Cabral, F.R., Gerya, T.V., Zhu, G., May, D.A., 2014a. Subduction initiates at 748
straight passive margins. Geology 42, 331−334. 749
Marques, F.O., Nogueira, F.C.C., Bezerra, F.H.R., de Castro, D.L., 2014b. The Araripe Basin in 750
NE Brazil: An intracontinental graben inverted to a high-standing horst. Tectonophysics 630, 751
251-264. 752
41
Matos, R.M.D., 1992. The Northeast Brazilian rift system. Tectonics 11, 766–791. 753
May, D.A., Moresi, L., 2008. Preconditioned iterative methods for Stokes flow problems arising 754
in computational geodynamics. Phys. Earth Planet. Int. 171, 33–47. 755
McKenzie, D.P., 1977. The initiation of trenches: a finite amplitude instability. In: Talwani, M., 756
Pitman III, W.C. (Eds.), Island Arcs, Deep Sea Trenches and Back-arc Basins. American 757
Geophysical Union, Maurice Ewing Series 1, 57–61. 758
Miles, B.W.J., Stokes, C.R., Vieli, A., Cox, N.J., 2013. Rapid, climate-driven changes in outlet 759
glaciers on the Pacific coast of East Antarctica. Nature 500, 563–566. 760
Moss, R.H. et al., 2010. The next generation of scenarios for climate change research and 761
assessment. Nature 463, 747–756. 762
Müller, R.D., Hanna, E., et al., 2013. Ice-sheet mass balance and climate change. Nature 498, 763
51–59. 764
Nikolaeva, K., Gerya, T.V., Marques, F.O., 2010. Subduction initiation at passive margins: 765
numerical modeling. Journal of Geophysical Research 115, B03406, 766
doi:10.1029/2009JB006549. 767
Nikolaeva, K., Gerya, T.V., Marques, F.O., 2011. Numerical analysis of subduction initiation 768
risk along the Atlantic American passive margins. Geology 39, 463-466. 769
Niu, Y., 2014. Geological understanding of plate tectonics: Basic concepts, illustrations, 770
examples and new perspectives. Global Tectonics and Metallogeny, DOI: 771
10.1127/gtm/2014/0009. 772
Niu, Y.L., O’Hara, M.J., Pearce, J.A., 2003. Initiation of subduction zones as a consequence of 773
lateral compositional buoyancy contrast within the lithosphere: A petrologic perspective. J. 774
Petrol. 44, 851–866. 775

42
Nogueira, F.C.C., Marques, F.O., Bezerra, F.H.R., de Castro, D.L., Fuck, R.A., 2015. Cretaceous 776
intracontinental rifting and post-rift inversion in NE Brazil: insights from the Rio do Peixe 777
Basin. Tectonophysics in press. 778
Passarelli, C.R., Basei, M.A.S., Wemmer, K., Siga Jr., O., Oyhantçabal, P., 2010. Major shear 779
zones of southern Brazil and Uruguay: escape tectonics in the eastern border of Rio de La 780
plata and Paranapanema cratons during the Western Gondwana amalgamation. International 781
Journal of Earth Sciences, Doi:10.1007/s00531-010-0594-2. 782
Rahmstorf, S., 2002. Ocean circulation and climate during the past 120,000 years. Nature 419, 783
207−214. 784
Rahmstorf, S., 1997. Risk of sea-change in the Atlantic. Nature 388, 825−826. 785
Ranalli, G., 1995. Rheology of the Earth, 2nd ed. Chapman & Hall, London. 786
Richoz S. et al., 2012. Hydrogen sulphide poisoning of shallow seas following the end-Triassic 787
extinction. Nature Geosci. 5, 662–667. 788
Rodríguez-González, J., Negredo, A.M., Billen, M.I., 2012. The role of the overriding plate 789
thermal state on slab dip variability and on the occurrence of flat subduction. Geochem. 790
Geophys. Geosys. 13, Q01002. 791
Rodríguez-González, J., Billen, M.I., Negredo, A.M., 2014. Non-steady-state subduction and 792
trench-parallel flow induced by overriding plate structure. Earth Planet. Sci. Lett. 401, 227-793
235. 794
Russo, R.M., Silver, P.G., 1996. Cordillera formation, mantle dynamics, and the Wilson cycle. 795
Geology 24, 511-514. 796
Rosenbaum, G., Lister, G.S., 2004. Neogene and Quaternary rollback evolution of the 797
Tyrrhenian Sea, the Apennines, and the Sicilian Maghrebides. Tectonics 23, TC1013. 798
doi:10.1029/2003TC001518. 799
Schellart, W.P., 2005. Influence of the subducting plate velocity on the geometry of the slab and 800

43
migration of the subduction hinge. Earth Planet. Sci. Lett. 231, 197–219. 801
Schellart, W.P., 2008. Subduction zone trench migration: Slab driven or overriding-plate-driven? 802
Phys. Earth Planet. Inter. 170, 73–88. 803
Schellart, W.P., 2010. Evolution of subduction zone curvature and its dependence on the trench 804
velocity and the slab to upper mantle viscosity ratio. J. Geophys. Res. 115, B11406, 805
doi:10.1029/2009JB006643. 806
Schellart, W.P., 2011. A subduction zone reference frame based on slab geometry and 807
subduction partitioning of plate motion and trench migration. Geophys. Res. Lett. 38, L16317, 808
doi:10.1029/2011GL048197. 809
Schellart, W.P., Freeman, J., Stegman, D.R., Moresi, L., May, D., 2007. Evolution and diversity 810
of subduction zones controlled by slab width. Nature 446, 308–311. 811
Schellart, W.P., Lister, G.S., Toy, V.G., 2006. A Late Cretaceous and Cenozoic reconstruction of 812
the southwest Pacific region: Tectonics controlled by subduction and slab rollback processes. 813
Earth Sci. Rev. 76, 191–233. 814
Schellart, W.P., Rawlinson, N., 2010. Convergent plate margin dynamics: New perspectives 815
from structural geology, geophysics and geodynamic modelling. Tectonophysics 483, 4–19. 816
Schellart, W.P., Stegman, D.R., Farrington, R.J., Moresi, L., 2011. Influence of lateral slab edge 817
distance on plate velocity, trench velocity, and subduction partitioning. J. Geophys. Res. 116, 818
B10408, doi:10.1029/2011JB008535. 819
Schellart, W.P, Stegman, D., Freeman, J., 2008. Global trench migration velocities and slab 820
migration induced upper mantle volume fluxes: Constraints to find an Earth reference frame 821
based on minimizing viscous dissipation. Earth-Sci. Rev. 88, 118–144. 822
Schmeling, H. et al., 2008. A benchmark comparison of spontaneous subduction models: 823
Towards a free surface. Phys. Earth Planet. Int. 171, 198–223. 824
Song, H., Wignall, P.B., Tong, J., Yin, H., 2013. Two pulses of extinction during the Permian-825
44
Triassic crisis. Nature Geosci. 6, 52–56. 826
Spakman, W., Hall, R., 2010. Surface deformation and slab–mantle interaction during Banda arc 827
subduction rollback. Nature Geosci. 3, 562−566. 828
Stegman, D., Farrington, R., Capitanio, F., Schellart, W.P., 2010a. A regime diagram for 829
subduction styles from 3-D numerical models of free subduction. Tectonophysics 483, 29–45. 830
Stegman, D.R., Freeman, J., Schellart, W.P., Moresi, L., May, D., 2006. Influence of trench 831
width on subduction hinge retreat rates in 3-D models of slab rollback. Geochem. Geophys. 832
Geosyst. 7, Q03012, doi:10.1029/2005GC001056. 833
Stegman, D.R., Schellart, W.P., Freeman, J., 2010b. Competing influences of plate width and 834
far-field boundary conditions on trench migration and morphology of subducted slabs in the 835
upper mantle. Tectonophysics 483, 46–57. 836
Stern, R.J., 2004. Subduction initiation: Spontaneous and induced. Earth Planet. Sci. Lett. 226, 837
275–292. 838
Stocker, T., Schmittner, A., 1997. Influence of CO2 emission rates on the stability of the 839
thermohaline circulation. Nature 388, 862−865. 840
Thielmann, M., Kaus, B., 2012. Shear heating induced lithospheric-scale localization: Does it 841
result in subduction? Earth Planet. Sci. Lett. 359-360, 1–13. 842
Tommasi, A., Vauchez, A., Fernandes, L.A.D., Porcher, C.C., 1994. Orogen-parallel strike-slip 843
faulting and synkinematic magmatism in the Dom Feliciano Belt, Southern Brazil. Tectonics 844
13, 421-437. 845
Turcotte, D.L., Schubert, G., 2014. Geodynamics. Cambridge University Press, 3rd Edition. 846
Printed in the USA by Sheridan Books Inc. 847
Vauchez, A., Neves, S.P., Caby, R., Corsini, M., Egydio-Silva, M., Arthaud , M., Amaro , V.E., 848
1995. The Borborema shear zone system. J. South Am. Earth Sci. 8, 247-266. 849
Vauchez, A., Tommasi, A., 2003. Wrench faults down to the asthenosphere: Geological and 850
45
geophysical evidence and thermo-mechanical effects. In: Storti, F. Holdsworth, R.E. & 851
Salvini, F. (eds) Intraplate Strike-Slip Deformation Belts, Geol. Soc. London Spec. Publ. 210, 852
15-34. 853
Weertman, J., 1968. Dislocation climb theory of steady state creep. Trans. Amer. Soc. Metals 61, 854
681-694. 855
Wignall, P.B., 2001. Large igneous provinces and mass extinctions. Earth-Science Reviews 53, 856
1-33. 857
Wignall, P.B., Twitchett, R.J., 1996. Oceanic anoxia and the end Permian mass extinction. 858
Science 272, 1155-1158. 859
Yamato, P., Kaus, B., Mouthereau, F., Castelltort, S., 2011. Dynamic constraints on the crustal-860
scale rheology of the Zagros fold belt, Iran. Geology 39, 815–818. 861