spectral characterization of different marsh land
TRANSCRIPT
6th EUFAR-OPTIMISE Training Course SWAMP, 6-16 July 2015, Obrzycko-Rzecin (POLWET), Poland
Scientific Report
1
Spectral characterization of different marsh land vegetation types with multi-angular UAV measurements
SWAMP Scientific report - group E
Faddi Kizel1, Antonio Padovano2, Zhihui Wang3, Wojciech Ciężkowski4,Andreas Burkart5,Helge Aasen6
1. Technion-Israel Institute of Technology, Haifa, Israel; [email protected] 2. EURAC, Institute for applied Remote Sensing, Bolzano, Italy; [email protected] 3. University of Twente, Enschede, Netherlands; [email protected] 4. Warsaw University of Life Sciences, Department of Hydraulic Engineering;
[email protected] 5. Research Centre Jülich, Jülich, Germany; [email protected] 6. University of Cologne, Department of Geosciences, Cologne, Germany; helge.aasen@uni-
koeln.de
INTRODUCTION and aim of the experiments
Remote sensing measures the reflected solar radiation from surface, which is influenced by the solar/viewing geometry, and structure of the surface, etc. This phenomenon is characterized by the

6th EUFAR-OPTIMISE Training Course SWAMP, 6-16 July 2015, Obrzycko-Rzecin (POLWET), Poland
Scientific Report
2
bidirectional reflectance distribution function (BRDF) including all combinations of incident and re-flected angles (1). The BRDF effects on one hand cause uncertainties in variable retrieval; on the other hand, provide extra information of the surface which may improve the variable retrieval (2). The BRDF modeling can be applied to eliminate the effects of a particular sun-sensor geometry and makes measurements consistent (1). Also multi- angular observations is capable of assessing three-dimensional vegetation structures that cannot be detected by nadir observation alone (3,4), which were used to give more accurate estimate of LAI (5). In this regard, BRDF has been an ac-tive topic.
An unmanned aerial vehicle (UAV) becomes favored by remote sensing communities in recent years because of the low cost and flexibility compared with air- or space borne platform. Combined with multi- or hyper- spectral sensors, it has been used for detecting water stress(6-8), and esti-mating leaf carotenoid content (9).
Recently, some studies have investigated UAVs as a novel platform for goniometric measure-ments. Asurvey over ice fields using a fixed-wing UAV equipped with an on-board spectrometer was performed by (10). Principally due to maneuvering and incident wind, the flight patterns of this platform introduced banking levels of up to ±30°, causing the spectrometer to collect multi-angular hyperspectral measurements of numerous points that were overflown. Further test was conducted by to explore BRDF effects overwheat and evaluate the angular dependency of reflectance(11).
The UAVs offer a way of collecting multi-angular hyperspectral data over almost every kind of ter-rain and scale with a flying spectrometer. Such applications have been mainly performed over ag-ricultural sites, but rarely on a wetland which plays a great role in carbon cycle. Furthermore, the BRDF effects need to be investigated across different vegetation types rather than one species. Therefore, with the aid of UAVs and hyperspectral sensor, this study aimed to evaluate the angular sensitivity of reflectance and common vegetation indices, and test the response from different veg-etation types.
Description of the test site
Measurements take place in western Poland on a Rzecin wetland site (Figure 1), which is owned by Poznan University of Life Sciences (PULS). This is mesotrophic, geogenous, terrestrialisation peatland, located in the middle of the Notecka Primeval Forest in Western Poland. Isolation and lack of human activities made it unique place in this part of Europe. Because of that Agrometeorol-ogy Department of PULS created here as well equipped study site called POLWET (12,13).
The studied wetland area is approximately 87 ha and it is surrounded mostly by extensively used grasslands and some very small crop fields. The vegetation is dominated by the following plant species: Sphagnum sp., Dicranum sp., Carex sp., Phragmittes communis, Typha langifolia, Vac-cinium oxicoccus, Drosera rotundifolia, Potentilla palustris, Ranunculus acris, an Menyantes trifoli-ate. In the middle of the peatland, there is a 70-cm thick floating carpet of peat-substrate over-grown mostly by mosses underlain by a free water layer and saturated sediment. The distance between the peatland surface and the mineral bedrock increases from 2 m at the periphery to 11 m towards the centre of the peatland. In the eastern part of the peatland, there is a shallow ~16 ha decaying lake, which has been overgrown by Typha latifolia L., and Phragmites australis (Cav.) Trin. ex Steud (12,13).
The annual mean air temperature is equal to 8.5ºC, annual sum of precipitation is equal to 526 mm, and western wind is prevailing (14).

6th EUFAR-OPTIMISE Training Course SWAMP, 6-16 July 2015, Obrzycko-Rzecin (POLWET), Poland
Scientific Report
3
Figure 1. Location of the study site in Rzecin, Poland.
Small UAV measurements
We used the Falcon-8 octocopter UAV (Ascending Technology, Krailing, Germany), integrated with a STS-VIS spectrometer (Ocean Optics Inc. Dunedin, USA). This system was first developed by (15) and further applied for exploring the BRDF effects over wheat and evaluating the angular de-pendency of reflectance in (11). The FOV of the spectrometer is around 12˚. The spectral resolu-tion (full width at half maximum, FWHM) is 3 nm, with 1024 spectral bands.
Airborne hyperspectral measurements were conducted with the UAV spectrometer wirelessly syn-chronized with a second spectrometer on the ground which measured a white reference (Spectra-lon®) to adapt to changing illumination. Within the study area, four different targets were chosen to represent different types of vegetation. For each target, the spectra was collected at eight different angular position. And five spectra was collected at each position. To achieve this process, a flight pattern was predefined using the software mAngle (16), which can accurately determine the posi-tion of UAV and the aiming of the spectrometer. Details of configuration can refer to (11).
Four replicates of flights were performed in order to test the robustness of collected data. Each target has a unique code to distinguish it from other targets in this and in other experiments.
Figure 2 showed the area of interest and the position of the selected targets. The latitude and lon-gitude of each target, and the characteristics and conditions about the four flights were listed in Table 1. The characteristics of each target can be found in Figure 4.
6th EUFAR-OPTIMISE Training Course SWAMP, 6-16 July 2015, Obrzycko-Rzecin (POLWET), Poland
Scientific Report
4
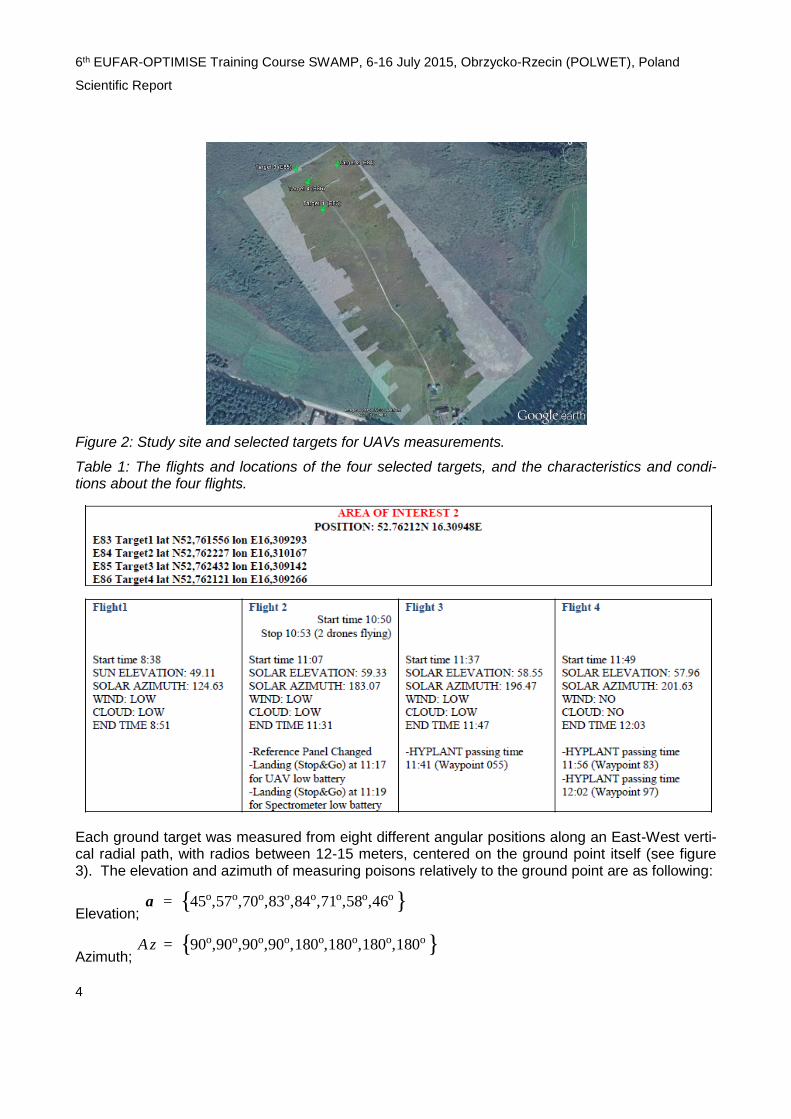
Figure 2: Study site and selected targets for UAVs measurements.
Table 1: The flights and locations of the four selected targets, and the characteristics and condi-tions about the four flights.
Each ground target was measured from eight different angular positions along an East-West verti-cal radial path, with radios between 12-15 meters, centered on the ground point itself (see figure 3). The elevation and azimuth of measuring poisons relatively to the ground point are as following:
Elevation; { }45 ,57 ,70 ,83 ,84 ,71 ,58 ,46a = o o o o o o o o
Azimuth; { }90 ,90 ,90 ,90 ,180 ,180 ,180 ,180Az = o o o o o o o o
6th EUFAR-OPTIMISE Training Course SWAMP, 6-16 July 2015, Obrzycko-Rzecin (POLWET), Poland
Scientific Report
5
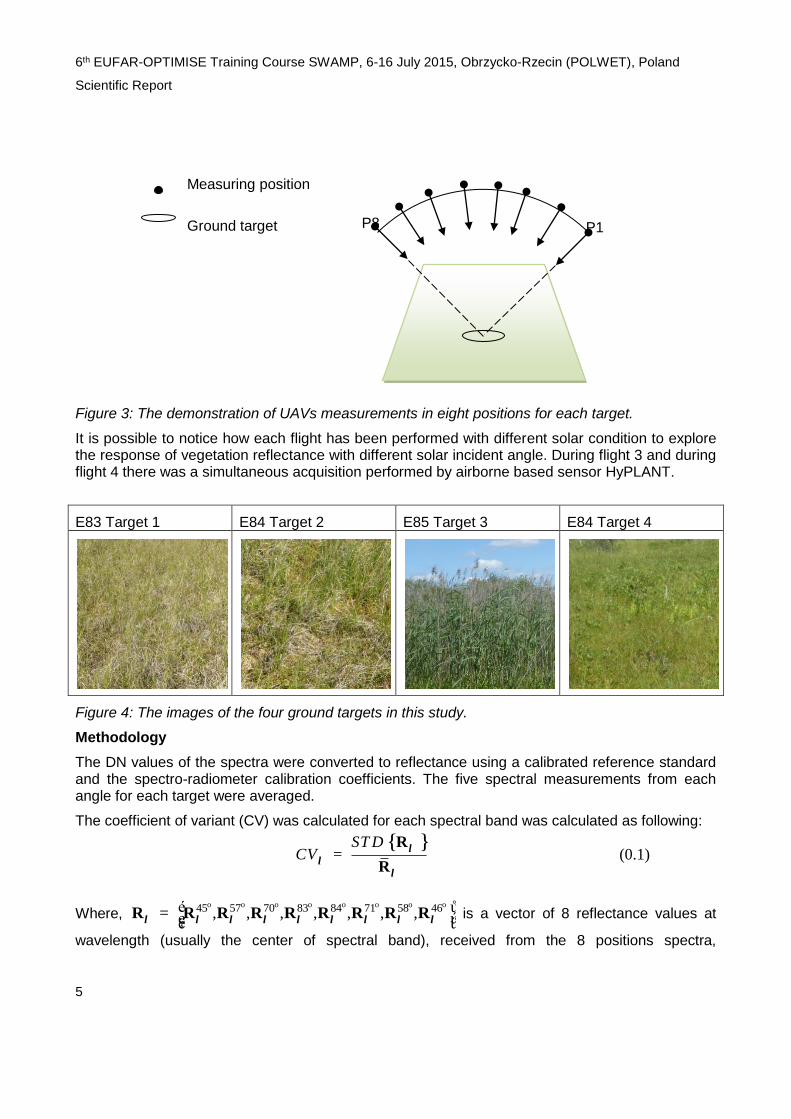
Figure 3: The demonstration of UAVs measurements in eight positions for each target.
It is possible to notice how each flight has been performed with different solar condition to explore the response of vegetation reflectance with different solar incident angle. During flight 3 and during flight 4 there was a simultaneous acquisition performed by airborne based sensor HyPLANT.
E83 Target 1 E84 Target 2 E85 Target 3 E84 Target 4
Figure 4: The images of the four ground targets in this study.
Methodology
The DN values of the spectra were converted to reflectance using a calibrated reference standard and the spectro-radiometer calibration coefficients. The five spectral measurements from each angle for each target were averaged.
The coefficient of variant (CV) was calculated for each spectral band was calculated as following:
{ }ST D
CVl
ll
=R
R (0.1)
Where, 45 57 70 83 84 71 58 46, , , , , , ,l l l l l l l l l
é ů= ę úë űR R R R R R R R R
o o o o o o o o
is a vector of 8 reflectance values at
wavelength (usually the center of spectral band), received from the 8 positions spectra,
Measuring position
Ground target P8 P1

6th EUFAR-OPTIMISE Training Course SWAMP, 6-16 July 2015, Obrzycko-Rzecin (POLWET), Poland
Scientific Report
6
{ }ST Dl
R and l
R are the standard deviation and average of l
R respectively. The CV was cal-
culated for reflectance from different angles, and for angular reflectance measured when sensor and solar were in the same or opposite direction.
The angular variation of the reflectance at the red and near-infrared region, together with two commonly used vegetation indices were also investigated, i.e. the normalized difference vegetation index (NDVI), and photochemical reflectance index (PRI). The red region reflectance at 680 nm is influenced by the strong chlorophyll absorption and the near-infrared reflectance at 800 nm is driv-en by leaf scattering caused by structure. The formula for the indices are listed in Table 2. NDVI is shown to be related to biomass, chlorophyll and LAI (17), and PRI is a good indicator of photosyn-thetic radiation use efficiency and can be used for plant stress detection (18). Calculate vegetation indices (NDVI/PRI) based on reflectance from different angles.
Table 2: Selected vegetation indices used in this study.
Index Formula Reference
NDVI (R800
-R670
)/(R800
+R670
) Tucker (1979)
PRI (R531
-R570
)/(R531
+R570
) Gamon et al. (1992)

6th EUFAR-OPTIMISE Training Course SWAMP, 6-16 July 2015, Obrzycko-Rzecin (POLWET), Poland
Scientific Report
7
Results
A) Multi-angular spectra for different targets from different flights:
Figure 5: The spectra measured in eight positions for four targets from each flight.
Figure 5 represents the 8 spectra collected in different viewing positions for each target from each flight. The variation of the spectra for the same target as function of the measuring position em-phasizes the influence of the BRDF effect on the registered sample at the sensor. The magnitude of this effect (expressed as the variance of the collected spectra for the same target) is vary as the measuring time during the day changes, i.e. different sun position.

6th EUFAR-OPTIMISE Training Course SWAMP, 6-16 July 2015, Obrzycko-Rzecin (POLWET), Poland
Scientific Report
8
Figure 6: The spectra averaged for eight positions for each target from each flight.
Figure 6 showed the mean spectra from eight angular positions for each target from each flight. It is easily noticed the average spectra is less biased during the different measuring time, i.e. less influenced by the BRDF effect. Regarding the different vegetation type of each target, the spectra exhibits similar features, i.e. a clear green peak, lowest reflectance in red region and highest val-ues in the near-infrared region for target 4 which has the greenest biomass (see Table 4). In con-trast, the green reflectance around 550 nm for target 3 is relatively flat, because of large propor-tions of woody, and non-photosynthetic materials. The reflectance of target 1 and 2 have a more obvious green peak, and intermediate values in the near-infrared spectral regions.

6th EUFAR-OPTIMISE Training Course SWAMP, 6-16 July 2015, Obrzycko-Rzecin (POLWET), Poland
Scientific Report
9
B) The coefficient of variant (CV) of the multi-angular spectra:
Figure 7: The coefficient of variant (CV) of the spectra measured in eight positions for each target from each flight.

6th EUFAR-OPTIMISE Training Course SWAMP, 6-16 July 2015, Obrzycko-Rzecin (POLWET), Poland
Scientific Report
10
Figure 8: The coefficient of variant (CV) of the spectra measured in forward (red) and backward (blue) direction for each target from each flight.
Figure 7 illustrates the CV of all the 8 measurements for the different four targets at the different measuring times. The reflectance of target 4 has the lowest CV values, showing least anisotropic effects in angular measurements. In comparison, the reflectance of target 3 has the highest CV value among the four targets, exhibiting largest angular sensitivity in spectral measurements. This can be explained by the composition and structure of target 4 (Table 4), which is more heteroge-neous. In addition, the CV is also affected by the measuring times, say the solar zenith angle. The CV values in the three later flights are much lower than the first flight, particularly for 1 and 2 (Fig-ure 7). Under proper illumination conditions, the anisotropic effects in spectra for intermediate het-erogeneous targets can be minimized to a certain extent (i.e. target 1 and 2). To shield a light on the effect of backward and forward scattering, figure 8 presents the CV values for the spectra re-ceived from first four and last four measuring position separately. The CV values calculated for spectra in forward and backward positions represents similar features with those calculated for all positons. The largest difference between CV for forward and backward position also happened for target 3 because of heterogeneity.

6th EUFAR-OPTIMISE Training Course SWAMP, 6-16 July 2015, Obrzycko-Rzecin (POLWET), Poland
Scientific Report
11
C) The angular variations of reflectance at red and near-infrared region:
Figure 9: The reflectance (negative values on x-axis indicate UAV position) at 680 nm (red) meas-ured from eight viewing positions for each target from each flight.
6th EUFAR-OPTIMISE Training Course SWAMP, 6-16 July 2015, Obrzycko-Rzecin (POLWET), Poland
Scientific Report
12
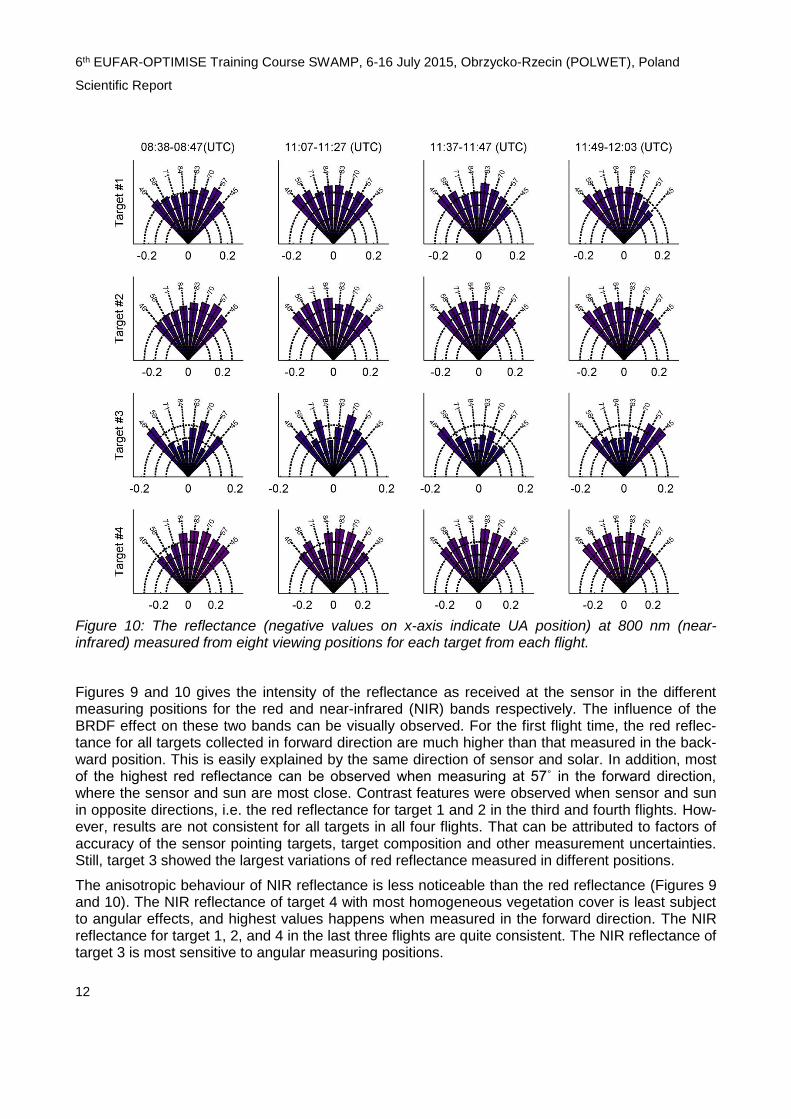
Figure 10: The reflectance (negative values on x-axis indicate UA position) at 800 nm (near-infrared) measured from eight viewing positions for each target from each flight.
Figures 9 and 10 gives the intensity of the reflectance as received at the sensor in the different measuring positions for the red and near-infrared (NIR) bands respectively. The influence of the BRDF effect on these two bands can be visually observed. For the first flight time, the red reflec-tance for all targets collected in forward direction are much higher than that measured in the back-ward position. This is easily explained by the same direction of sensor and solar. In addition, most of the highest red reflectance can be observed when measuring at 57˚ in the forward direction, where the sensor and sun are most close. Contrast features were observed when sensor and sun in opposite directions, i.e. the red reflectance for target 1 and 2 in the third and fourth flights. How-ever, results are not consistent for all targets in all four flights. That can be attributed to factors of accuracy of the sensor pointing targets, target composition and other measurement uncertainties. Still, target 3 showed the largest variations of red reflectance measured in different positions.
The anisotropic behaviour of NIR reflectance is less noticeable than the red reflectance (Figures 9 and 10). The NIR reflectance of target 4 with most homogeneous vegetation cover is least subject to angular effects, and highest values happens when measured in the forward direction. The NIR reflectance for target 1, 2, and 4 in the last three flights are quite consistent. The NIR reflectance of target 3 is most sensitive to angular measuring positions.

6th EUFAR-OPTIMISE Training Course SWAMP, 6-16 July 2015, Obrzycko-Rzecin (POLWET), Poland
Scientific Report
13
D) The angular variations of vegetation indices NDVI and PRI:
Figure 11: The angular NDVI values (negative values on x-axis indicate UAV position) for each target from each flight.
6th EUFAR-OPTIMISE Training Course SWAMP, 6-16 July 2015, Obrzycko-Rzecin (POLWET), Poland
Scientific Report
14
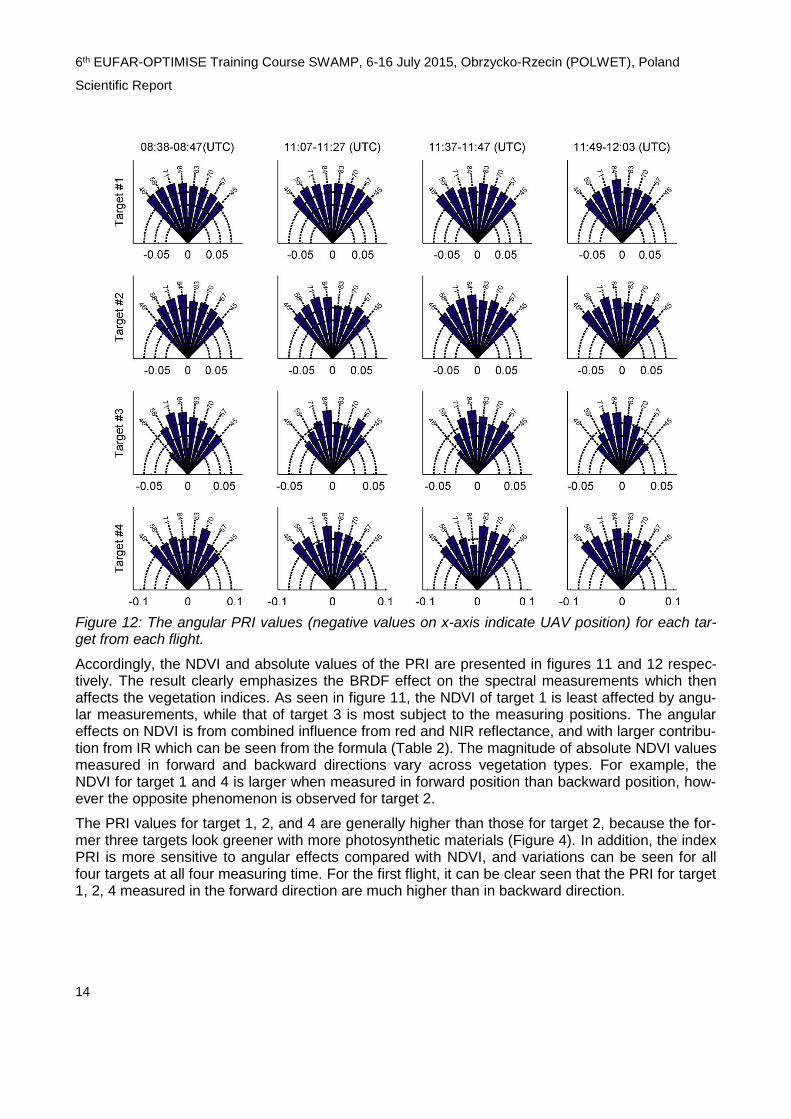
Figure 12: The angular PRI values (negative values on x-axis indicate UAV position) for each tar-get from each flight.
Accordingly, the NDVI and absolute values of the PRI are presented in figures 11 and 12 respec-tively. The result clearly emphasizes the BRDF effect on the spectral measurements which then affects the vegetation indices. As seen in figure 11, the NDVI of target 1 is least affected by angu-lar measurements, while that of target 3 is most subject to the measuring positions. The angular effects on NDVI is from combined influence from red and NIR reflectance, and with larger contribu-tion from IR which can be seen from the formula (Table 2). The magnitude of absolute NDVI values measured in forward and backward directions vary across vegetation types. For example, the NDVI for target 1 and 4 is larger when measured in forward position than backward position, how-ever the opposite phenomenon is observed for target 2.
The PRI values for target 1, 2, and 4 are generally higher than those for target 2, because the for-mer three targets look greener with more photosynthetic materials (Figure 4). In addition, the index PRI is more sensitive to angular effects compared with NDVI, and variations can be seen for all four targets at all four measuring time. For the first flight, it can be clear seen that the PRI for target 1, 2, 4 measured in the forward direction are much higher than in backward direction.
6th EUFAR-OPTIMISE Training Course SWAMP, 6-16 July 2015, Obrzycko-Rzecin (POLWET), Poland
Scientific Report
15
Conclusions
This study evaluates the angular effects of viewing and solar positions on spectra measurements in four different marsh land vegetation types with the use of an unmanned aerial vehicle (UAV) and a spectrometer. Results show that the canopy reflectance are highly affected by the viewing posi-tion, and the magnitude depends on the composition and structure of the vegetation cover. The coefficient of variant (CV) of reflectance can be suppressed to a certain extent under proper illumi-nation conditions (i.e. high solar zenith angle).
The anisotropic behaviour of red and NIR wavelength, as well as commonly used vegetation indi-ces NDVI and PRI are investigated. Results showed that their values depends on angel of view (figure 9- 12). It is caused mainly by vegetation structure (on more heterogeneous target values variability is higher). However there is no relationship between this indices and angel of view, be-cause wind changing leaves and UAV position, hence measurements are taking in different point. That highlight the importance of correcting the angular effects for establish the reliability in applica-tions. Further research is needed for assessing the angular effects in spectral measurements in more biomes and more complicated vegetation indices.
Acknowledgements
“The research leading to these results has received funding from the European Community's Sev-enth Framework Programme (FP7/2014-2018) under grant agreement n°312609 (EUFAR: Euro-pean Facility for Airborne Research in Environmental and Geo-sciences), COST Action ES1309 OPTIMISE (Innovative Optical Tools for Proximal Sensing of Ecophysiological Processes and the European Space Agency.
References
1 Snyder, W.C., & Zhengming, W. (1998). BRDF models to predict spectral reflectance and emissivity in the thermal infrared. Geoscience and Remote Sensing, IEEE Transactions on, 36: 214-225
2 Verrelst, J., Schaepman, M.E., Koetz, B., & Kneubuehler, M. (2008). Angular sensitivity analysis of vegetation indices derived from CHRIS/PROBA data. Remote Sensing of Environment, 112: 2341-2353
3 Chen, J.M., Liu, J., Leblanc, S.G., Lacaze, R., & Roujean, J.-L. (2003). Multi-angular optical remote sensing for assessing vegetation structure and carbon absorption. Remote Sensing of Environment, 84: 516-525
4 Gao, F., Schaaf, C.B., Strahler, A.H., Jin, Y., & Li, X. (2003). Detecting vegetation structure using a kernel-based BRDF model. Remote Sensing of Environment, 86: 198-205
5 Hasegawa, K., Matsuyama, H., Tsuzuki, H., & Sweda, T. (2010). Improving the estimation of leaf area index by using remotely sensed NDVI with BRDF signatures. Remote Sensing of Environment, 114: 514-519
6 Suárez, L., Zarco-Tejada, P.J., González-Dugo, V., Berni, J.A.J., Sagardoy, R., Morales, F., & Fereres, E. (2010). Detecting water stress effects on fruit quality in orchards with time-series PRI airborne imagery. Remote Sensing of Environment, 114: 286-298
6th EUFAR-OPTIMISE Training Course SWAMP, 6-16 July 2015, Obrzycko-Rzecin (POLWET), Poland
Scientific Report
16
7 Zarco-Tejada, P.J., González-Dugo, V., & Berni, J.A.J. (2012). Fluorescence, temperature and narrow-band indices acquired from a UAV platform for water stress detection using a micro-hyperspectral imager and a thermal camera. Remote Sensing of Environment, 117: 322-337
8 Zarco-Tejada, P.J., González-Dugo, V., Williams, L.E., Suárez, L., Berni, J.A.J., Goldhamer, D., & Fereres, E. (2013). A PRI-based water stress index combining structural and chlorophyll effects: Assessment using diurnal narrow-band airborne imagery and the CWSI thermal index. Remote Sensing of Environment, 138: 38-50
9 Zarco-Tejada, P.J., Guillen-Climent, M.L., Hernandez-Clemente, R., Catalina, A., Gonzalez, M.R., & Martin, P. (2013). Estimating leaf carotenoid content in vineyards using high resolution hyperspectral imagery acquired from an unmanned aerial vehicle (UAV). Agricultural and Forest Meteorology, 171: 281-294
10 Burkhart, J., Bogren, W., Storvold, R., Pedersen, C., & Gerland, S. (2010). A new measure of BRDF, banking on UAS measurements. In, AGU Fall Meeting Abstracts (p. 03)
11 Burkart, A., Aasen, H., Alonso, L., Menz, G., Bareth, G., & Rascher, U. (2015). Angular Dependency of Hyperspectral Measurements over Wheat Characterized by a Novel UAV Based Goniometer. Remote Sensing, 7: 725
12 Chojnicki, B.H., Michalak, M., Acosta, M., Juszczak, R., Augustin, J., Drösler, M., & Olejnik, J. (2010). Measurements of carbon dioxide fluxes by chamber method at the Rzecin wetland ecosystem, Poland. Polish Journal of Environmental Studies, 19: 283-291
13 Juszczak, R., & Augustin, J. (2013). Exchange of the Greenhouse Gases Methane and Nitrous Oxide Between the Atmosphere and a Temperate Peatland in Central Europe. Wetlands, 33: 895-907
14 Farat, R., Mager, P., & Pijewska, I. (2004). Climate Atlas of the Wielkopolska region. Institute of Meteorology and Water Management, Poznañ Branch, Poland
15 Burkart, A., Cogliati, S., Schickling, A., & Rascher, U. (2014). A novel UAV-based ultra-light weight spectrometer for field spectroscopy. Sensors Journal, IEEE, 14: 62-67
16 mAngle. In: Available online: https://github.com/wemperor/mAngle/releases
17 Tucker, C.J. (1979). Red and photographic infrared linear combinations for monitoring vegetation. Remote Sensing of Environment, 8: 127-150
18 Gamon, J., Penuelas, J., & Field, C. (1992). A narrow-waveband spectral index that tracks diurnal changes in photosynthetic efficiency. Remote Sensing of Environment, 41: 35-44