special report 258 transportation research board national
TRANSCRIPT

Contracting for Bus and Demand-ResponsiveTransit Services
T r a n s p o r t a t i o n R e s e a r c h B o a r d � N a t i o n a l R e s e a r c h C o u n c i l
Special Report 258
Contracting for Bus and Demand-ResponsiveTransit Services
A Survey of U.S. Practice and Experience
Committee for a Study ofContracting Out Transit Services
National Academy PressWashington, D.C. 2001

Transportation Research Board Special Report 258
Subscriber CategoryVI public transit
Transportation Research Board publications are available by ordering individualpublications directly from the TRB Business Office, through the Internet at TRB.org(national-academies.org/trb), or by annual subscription through organizational orindividual affiliation with TRB. Affiliates and library subscribers are eligible for sub-stantial discounts. For further information, contact the Transportation ResearchBoard Business Office, National Research Council, 2101 Constitution Avenue,N.W., Washington, DC 20418 (telephone 202-334-3214; fax 202-334-2519; ore-mail [email protected]).
Copyright 2001 by the National Academy of Sciences. All rights reserved.Printed in the United States of America.
NOTICE: The project that is the subject of this report was approved by the Gov-erning Board of the National Research Council, whose members are drawn fromthe councils of the National Academy of Sciences, the National Academy of Engi-neering, and the Institute of Medicine. The members of the committee responsiblefor the report were chosen for their special competencies and with regard for ap-propriate balance.
This report has been reviewed by a group other than the authors according tothe procedures approved by a Report Review Committee consisting of members ofthe National Academy of Sciences, the National Academy of Engineering, and theInstitute of Medicine.
This report was sponsored by the Federal Transit Administration of the U.S.Department of Transportation.
Library of Congress Cataloging-in-Publication Data
Contracting for bus and demand-responsive transit services : a survey of U.S.practice and experience / Committee for a Study of Contracting Out TransitServices.
p. cm. — (Special report ; 258)ISBN 0-309-07205-01. Local transit—United States. 2. Buses—United States. 3. Privatization—
United States. I. National Research Council (U.S.). Transportation ResearchBoard. Committee for a Study of Contracting Out Transit Services. II. Specialreport (National Research Council (U.S.). Transportation Research Board) ; 258.
HE4451 .C66 2001388.4'1322'0973—dc21
2001052030
The National Academy of Sciences is a private, nonprofit, self-perpetuating society of distinguishedscholars engaged in scientific and engineering research, dedicated to the furtherance of science andtechnology and to their use for the general welfare. Upon the authority of the charter granted to it bythe Congress in 1863, the Academy has a mandate that requires it to advise the federal government onscientific and technical matters. Dr. Bruce M. Alberts is president of the National Academy of Sciences.
The National Academy of Engineering was established in 1964, under the charter of the National Acad-emy of Sciences, as a parallel organization of outstanding engineers. It is autonomous in its adminis-tration and in the selection of its members, sharing with the National Academy of Sciences theresponsibility for advising the federal government. The National Academy of Engineering also spon-sors engineering programs aimed at meeting national needs, encourages education and research, andrecognizes the superior achievements of engineers. Dr. William A. Wulf is president of the NationalAcademy of Engineering.
The Institute of Medicine was established in 1970 by the National Academy of Sciences to secure theservices of eminent members of appropriate professions in the examination of policy matters per-taining to the health of the public. The Institute acts under the responsibility given to the NationalAcademy of Sciences by its congressional charter to be an adviser to the federal government and,upon its own initiative, to identify issues of medical care, research, and education. Dr. Kenneth I. Shineis president of the Institute of Medicine.
The National Research Council was organized by the National Academy of Sciences in 1916 to asso-ciate the broad community of science and technology with the Academy’s purposes of furthering knowl-edge and advising the federal government. Functioning in accordance with general policies determinedby the Academy, the Council has become the principal operating agency of both the National Acad-emy of Sciences and the National Academy of Engineering in providing services to the government,the public, and the scientific and engineering communities. The Council is administered jointly by boththe Academies and the Institute of Medicine. Dr. Bruce M. Alberts and Dr. William A. Wulf are chair-man and vice chairman, respectively, of the National Research Council.
The Transportation Research Board is a unit of the National Research Council, which serves the NationalAcademy of Sciences and the National Academy of Engineering. The Board’s mission is to promote in-novation and progress in transportation by stimulating and conducting research, facilitating the dissemi-nation of information, and encouraging the implementation of research results. The Board’s variedactivities annually engage more than 4,000 engineers, scientists, and other transportation researchers andpractitioners from the public and private sectors and academia, all of whom contribute their expertise inthe public interest. The program is supported by state transportation departments, federal agencies in-cluding the component administrations of the U.S. Department of Transportation, and other organiza-tions and individuals interested in the development of transportation.


Committee for a Study ofContracting Out Transit ServicesGorman Gilbert, Chair, Oklahoma State University, StillwaterJ. Barry Barker, Transit Authority of River City, Louisville,
KentuckySanto A. Grande, Delmarva Community Services, Inc.,
Cambridge, MarylandClarence W. Marsella, Jr., Regional Transportation District,
Denver, ColoradoJames J. McLary, Southeast Transit Management, Inc.,
Alexandria, VirginiaCharles L. Pettus, Sr., Amalgamated Transit Union, Baltimore,
MarylandPatrisha Piras, Pat Piras Consulting, San Lorenzo, CaliforniaElliott D. Sclar, Columbia University, New YorkRoger Tauss, Transport Workers Union of America, Washington,
D.C.Brian D. Taylor, University of California, Los AngelesRoger Teal, TWJ Consulting, Wilmette, IllinoisNigel H. M. Wilson, Massachusetts Institute of Technology,
Cambridge
Transportation Research Board Staff
Thomas R. Menzies, Jr.
Consultants
Daniel Boyle, Dan Boyle and Associates, San Diego, CaliforniaWilliam McCullough, Booz-Allen-Hamilton, Inc., San Francisco,
California


vii
Preface
Section 3032 of the Transportation Equity Act for the 21stCentury, enacted in June 1998, calls on the Transporta-tion Research Board (TRB) of the National Research
Council (NRC) to conduct a study of the effects of contractingout by public transit agencies for operations and administrativefunctions. The act specifically calls for an examination of the ra-tionale for decisions to contract for public transportation andan assessment of impacts on service cost and quality, availabil-ity, safety performance, and labor–management relations. Inresponse to this legislative mandate, the Federal Transit Administration funded the present year-long study beginningin June 2000.
To conduct the study, TRB assembled a 12-member com-mittee with expertise in transit operations, management, eco-nomics, and policy. Following NRC practice, the committeemembers served in the public interest without compensation.Gorman Gilbert, Head of the School of Civil and EnvironmentalEngineering and Director of the Transportation Center atOklahoma State University, chaired the committee.
In conducting this study, the committee undertook a na-tionwide survey of public transit agencies and their general man-agers. More than 500 agencies received the survey questionnaireand more than half completed it, including many that do not cur-rently contract for transit services. The survey consisted of twoparts. In the first part, agency respondents provided information

Contracting for Bus and Demand-Responsive Transit Servicesviii
on their contracts and contracting programs. In the second part, general man-agers explained why their agencies do or do not contract out for transit servicesand assessed their experiences, both positive and negative, with contracting.To enlarge and enrich its source of information, the committee also interviewedlocal labor representatives, transit managers, contractors, and elected officialsin five communities. These individuals offered their opinions on the advan-tages and disadvantages of contracting. The committee’s analyses of the surveyand interview results served as the basis for most of the study findings and con-clusions. Tabulations of the responses to the survey questions are provided inAppendix C (Survey Part 1) and Appendix D (Survey Part 2). In addition, a filecontaining the survey data records will be posted on the TRB website.
The committee convened five times. Most of these meetings were open tothe public. During these sessions, Robert Molofsky, General Counsel to theAmalgamated Transit Union, briefed the committee on issues of concern tomembers of his union—the largest representing public transit employees in theUnited States. Kelly Shawn of the Community Transportation Association ofAmerica explained the challenges faced by small and rural communities in pro-viding and procuring public transportation services. Richard Clair, Presidentof First Transit, and Timothy B. Collins, then Executive Vice President ofCoach USA Transit Services and now Senior Vice President of ATC/Vancom,discussed their companies’ experiences in supplying bus and paratransit ser-vices in communities across the country. Harold Morgan, Director of Researchand Education for the Taxicab, Limousine, and Paratransit Association, de-scribed how the members of his organization supply public transportation andthe issues they face in doing so.
Richard Steinmann, Director of the Office of Policy Development in theFederal Transit Administration, attended most of the committee meetings andoffered assistance throughout the study. Greg Hull, Director of Operations,Safety, and Security Programs for the American Public Transportation Associ-ation, also attended meetings and assisted in publicizing the survey amongtransit systems. William M. Lyons of the Volpe Transportation Systems Centerprovided data from the National Transit Database, often on short notice. Thecommittee extends its thanks to all three for their help.
In addition, special appreciation is expressed to the chief executives andstaff of the transit agencies that took the time to complete and return the sur-vey questionnaires. A list of the 269 responding agencies (as well as non-respondents) is provided in Appendix B. Thanks are also due to the transitagency general managers, local labor union officers, locally elected officials,
Preface ix
and private transit company managers who participated in the follow-oninterviews, which yielded many additional insights into contracting issues andpractices.
The study was managed by Thomas R. Menzies, Jr., who, under the guid-ance of the committee and the supervision of Stephen R. Godwin, Director ofStudies and Information Services, drafted the final report. A paper by com-mittee member Elliott D. Sclar formed the basis for the discussion on contract-ing theory in Chapter 3. William McCullough, under the direction of thecommittee, designed the survey, which is provided in Appendix B. DanielBoyle tabulated and analyzed the survey responses and conducted the follow-on interviews; his extensive quantitative and written analyses served as thebases for many of the findings in the study, and specifically for the materialpresented in Chapters 4 and 5 and Appendices C and D.
This report has been reviewed in draft form by individuals chosen for theirdiverse perspectives and technical expertise, in accordance with proceduresapproved by the NRC’s Report Review Committee. The purpose of this inde-pendent review is to provide candid and critical comments that will assist theinstitution in making the published report as sound as possible and to ensurethat the report meets institutional standards for objectivity, evidence, and re-sponsiveness to the study charge. The review comments and draft manuscriptremain confidential to protect the integrity of the deliberative process.
We wish to thank the following individuals for their review of this report:Timothy B. Collins, ATC/Vancom, Alexandria, Virginia; G. J. Fielding, Uni-versity of California, Irvine; Karen J. Rae, Capitol Metropolitan TransportationAuthority, Austin, Texas; Paul P. Skoutelas, Port Authority of Allegheny, Pitts-burgh, Pennsylvania; and Mildred E. Warner, Cornell University, Ithaca, NewYork. Although these reviewers provided many constructive comments andsuggestions, they were not asked to endorse the committee’s findings and con-clusions, nor did they see the final draft before its release. The review of thisreport was overseen by Lester A. Hoel, University of Virginia, Charlottesville.Appointed by the NRC, he was responsible for making certain that an inde-pendent examination of this report was carried out in accordance with insti-tutional procedures and that all review comments were carefully considered.Responsibility for the final content of this report rests entirely with the au-thoring committee and the institution.
Suzanne Schneider, Assistant Executive Director of TRB, managed thereport review process. Jocelyn Sands directed project support staff and over-saw production and distribution of the survey. The report was edited and pre-

Contracting for Bus and Demand-Responsive Transit Servicesx
pared for publication under the supervision of Nancy Ackerman, Director ofReports and Editorial Services. Rona Briere edited the report. Special thanksgo to Marion Johnson, Frances E. Holland, and Samuel Bardley for assistancewith meeting arrangements and correspondence with the committee and toAlisa Decatur for assistance with word processing and production of the finalmanuscript.
Contents
E X E C U T I V E S U M M A R Y 1
Introduction 15Study Purpose 21Approach and Scope 23Report Organization 25
Public and Private Provision of Transit in the United States 27Early Experience: Private, Regulated Transit Service 27Public Provision of Transit 34Summary 40
Conceptual Framework and Previous Studies on Contracting 46The Contracting Decision: Conceptual Framework 46Previous Studies of Effects of Transit Contracting 51Summary 56
Transit Service Contracting in the United States: Extent and Practice 61Survey Design and Method 61Survey Coverage and Representation 63Extent of Transit Contracting 69Contract Terms and Provisions 76Contracting Methods and Competition 84Summary of Results 94
11
22
33
44

Transit Contracting Experiences andAdvice from General Managers 98Reasons for Using and Not Using Contracting 99Contracting Experiences 108Overall Assessments of Contracting 117Responses on Whether General Managers Would Contract Now,
Given the Choice 121Advice from General Managers Who Contract 124
Summary and Assessment 128Key Survey Results 130Insights and Ideas for Further Evaluation 135
A P P E N D I X E S
A Transit Contracting and Privatization Initiatives in Western Europe 138
B Transit Contracting Survey Parts 1 and 2 with List of Recipients and Respondents 148
C Tabulations of Responses to Survey Part 1 186
D Tabulations of Responses to Survey Part 2 196
S T U D Y C O M M I T T E E B I O G R A P H I C A L I N F O R M A T I O N 207
55
66

1
Executive Summary
Each year more than 500 state, regional, and local govern-ment agencies receive aid from the Federal Transit Ad-ministration (FTA) for the provision of public transit.
They include the country’s largest urban transit agencies, eachcovering thousands of square kilometers, operating thousandsof vehicles, and serving hundreds of thousands of riders perweek. They also include some of the country’s smallest transitsystems covering mostly rural areas and operating only a hand-ful of vehicles, typically serving a few hundred passengers per day.Most of these agencies provide fixed-route bus and demand-responsive transit services, and some also provide other services,such as commuter and rapid rail. Given this assortment of sys-tem types and services, it is not surprising that one finds greatvariety in the way transit agencies deliver their services to thepublic—from the use of their own vehicles and personnel to theuse of outside contractors for some or all services.
In the interest of learning more about contracting as amethod of transit service delivery, the 1998 TransportationEquity Act for the 21st Century (TEA-21) called on the Trans-portation Research Board (TRB) to conduct a study of contract-ing by recipients of federal transit grants. The act called for anexamination of the extent and practice of transit service con-tracting and its effects on operating costs, customer service,safety, and other aspects of service quality and quantity.

Contracting for Bus and Demand-Responsive Transit Services2
To conduct the study, TRB convened a 12-member committee of expertsin public transportation management, labor, economics, and public policy. Incarrying out the study, the committee reviewed previous reports on transit ser-vice contracting; conducted its own nationwide survey of public transit sys-tems and their general managers; and interviewed transit managers, laborunion leaders, contractors, and members of transit policy boards.
The study focused on fixed-route bus and demand-responsive transitservices, which account for the vast majority of transit service contracts. Mostof the findings and conclusions presented in this report emerged from thecommittee’s survey of transit systems and their general managers. In the firstpart of the survey, transit systems from around the country were asked to pro-vide information on the extent to which they contract for bus and demand-responsive services and to describe their individual contracts and contractingprograms. In the second part of the survey, general managers were asked to ex-plain why they contract or do not, to relate their experiences with contracting,and to offer advice on how to make contracting work better. Part 1 yieldedmuch detail on the amount of contracting that goes on and how contracts areobtained and structured; the results from Part 2 offer important insights aboutthe effects of transit contracting on cost, quality, and other aspects of service.
Though highly informative, the national transit survey was a challengingundertaking, its design, administration, and analysis consuming much of thetime available to the committee for deliberation and analysis. While it wouldhave been desirable to evaluate and critique the results of other studies anddatabases in similar depth, doing so would have been a time-consuming andcontentious process that would have impeded the committee’s ability to col-laborate in conducting the survey. The committee believes, moreover, that thesurvey results in and of themselves are an important contribution to the fieldand anticipates their use by others to better understand and quantify the prac-tice and effects of transit contracting.
The committee drew on its own varied expertise and experience to inter-pret the large amount of empirical information obtained from the survey. Re-sulting findings and conclusions are summarized in the following pages, alongwith additional insights and ideas for follow-on study.
Extent of Transit Service Contracting in the United States
As part of the National Transit Database (NTD), FTA maintains a database of“purchased transportation” by transit systems that have received federal aid.

Executive Summary 3
The committee supplemented this information with the results of Part 1 of itssurvey of transit contracts and contracting programs. More than 250 systems,accounting for more than half of all federal aid recipients, responded to the sur-vey. These responses, augmented by NTD data, are highly informative aboutthe extent and methods of transit service contracting in the United States.
The survey findings reveal that transit contracting is neither rare normonolithic in practice. Hundreds of transit systems—of all sizes and types—now contract for some transit services, and many have done so for a numberof years. About one-third of all federal aid recipients contract for more than25 percent of their services, and about one-quarter contract for a smaller share.The remaining 40 percent do not currently contract at all, yet about one inthree of these systems has done so in the recent past (see Figure ES-1). Alto-gether, about 15 percent of all bus and demand-responsive vehicle-hours isprovided by contractors, a percentage that has changed very little during thepast 5 or 6 years (see Figure ES-2).
Contracting by System Size and Service Type
In general, larger systems (those with more than 50 total vehicles) are morelikely than smaller ones to contract for some transit services (see Figure ES-3).Yet when small systems do contract, they are much more likely to contract forall services. Many small transit systems are run by city and county agencies thatdo not specialize in transit. These general governmental agencies are twice aslikely as regional transit agencies to contract for all their transit services. Acorollary is that while regional transit agencies are more likely than city andcounty agencies to have some contracted services, they seldom contract formost of their services.
A majority of both small and larger transit systems contract for demand-responsive services; however, they differ significantly in their propensity to con-tract for fixed-route bus services. About half of small and two-thirds of largersystems contract for all their demand-responsive services. By comparison, one-third of smaller systems contracts for all fixed-route bus services, whereas onlyone-sixth of larger systems do.
Overall, contracting is much more common for demand-responsive thanfor fixed-route bus services. About 60 percent of transit systems that providedemand-responsive service contract for 25 percent or more of this service, andmore than half contract for all of it (see Figure ES-3). By comparison, onlyabout 30 percent of systems that provide fixed-route bus service contract for25 percent of more of this service, and about 25 percent contract for all of it.

Altogether, about two-thirds of demand-responsive service is providedthrough contractors, compared with only 6 percent of bus service (see Chap-ter 1, Figure 1-3, p. 5).
Possible Reasons for Contracting
The survey findings, coupled with NTD data, suggest some plausible reasonswhy transit agencies choose to contract. That a large number of systems con-tract for a relatively small proportion of services suggests that many are usingthe practice to fill service niches or to add or expand services quickly. Like-wise, the findings indicate that many small systems, run by city and countyagencies that do not specialize in transit, may be contracting for highly prag-matic reasons, such as the need to obtain certain specialized expertise.
Yet statistical data on the magnitude and incidence of contracting are notsufficient for assessing the validity of these possible reasons for contracting.Part 2 of the survey was therefore designed to elicit from general managers oftransit systems the factors influencing their decisions about contracting. Theiranswers are summarized next.
F I G U R E E S - 1 Estimated share of transit systems receiving federal aid and currentlycontracting for fixed-route bus and demand-responsive services (based on survey results augmentedwith data from the National Transit Database).
Contracting for Bus and Demand-Responsive Transit Services4

FI
GU
RE
E
S-
2Re
cent
tren
ds in
veh
icle
-hou
rs d
irect
ly o
pera
ted
and
purc
hase
d fo
r dem
and-
resp
onsi
ve a
nd fi
xed-
rout
e bu
sse
rvic
es, 1
994
to 1
998.
(NOT
E: Pe
rcen
tage
s ref
er to
shar
e of
tota
l veh
icle
-hou
rs p
urch
ased
. SOU
RCE:
Nat
iona
l Tra
nsit
Data
base
.)

0% 10% 20% 30% 40% 50% 60%
All ServiceContracted
26 to 99%Contracted
11 to 25%Contracted
1 to 10%Contracted
No Service Contracted
Percentage of Total Systems in Each Size Category
0%
10%
20%
30%
40%
50%
60%
70%
Bus Services
Demand-Responsive Services
Large Systems
Medium-SizedSystems
Small Systems
Per
cent
age
of S
yste
ms
(a)
(b)
All ServiceContracted
26 to 99%Contracted
11 to 25%Contracted
1 to 10%Contracted
No ServiceContracted
F I G U R E E S - 3 Contracting for fixed-route bus and demand-responsive transit servicesby (a) system size and (b) service type.
Executive Summary 7
Transit General Managers’ Rationale for Contracting
One could ask any number of individuals about factors influencing the deci-sion to contract for transit service and obtain a broad range of answers. Thecommittee chose to survey transit general managers because they are highlyidentifiable participants in the decision to contract and because they can pro-vide specific information on contracting procedures and effects. At the sametime, it must be recognized that the choice of contracting is often a policy-level decision influenced by political, legal, and institutional factors beyondthe control of transit managers. Comparable surveys of others involved in thedecision to contract, such as local elected officials and transit board members,would undoubtedly have yielded much additional information, and possiblydifferent answers, about the factors influencing contracting decisions andabout contracting outcomes. Yet while recognizing that the survey results rep-resent the particular vantage point of transit management, the committee be-lieves they offer much insight into why some transit agencies contract andothers do not.
Chief Reasons for Contracting
Survey respondents included general managers of systems that currently con-tract and those that do not, among them some that have contracted in the re-cent past but have since stopped doing so. The general managers of systemsthat presently contract gave several reasons for the practice. The most preva-lent were to start new services, reduce operating costs, and improve servicecost-efficiency. Relatively few cited state and federal laws and policies as a mainor important reason for contracting.
Chief Reasons for Not Contracting
In explaining why they do not contract, general managers cited a desire tomaintain control over their operations, low anticipated cost savings, and littlereason for changing current practice. Like the general managers of agencies thatdo contract, few general managers of agencies that do not contract cited stateand federal laws and policies, including the labor protection provisions in Sec-tion 13c of the Federal Transit Act, as influencing their decision.
Contracting for Bus and Demand-Responsive Transit Services8
Interest in Change
Nearly 80 percent of the general managers of transit systems that currently con-tract reported that they would do so again given their experience; about 15 per-cent said they would not, and 5 percent were uncertain. Likewise, more than70 percent of the general managers of systems that do not contract reportedthat they are not interested in adopting the practice to replace or supplementcurrent methods of in-house service delivery; 25 percent said they are inter-ested in doing so, and 5 percent were uncertain.
To be sure, some general managers indicating no desire to change may bedefending or rationalizing their current approach. Yet the findings also suggesta fair amount of satisfaction with existing practice. It is certainly plausible thatthose systems whose circumstances make them best suited to contracting arenow doing it, while those with less favorable circumstances are not. Taking asomewhat different perspective, however, the results also reveal that a sizableminority of general managers—one in seven who are now contracting and onein four who are not—have an interest in changing their current approach toservice delivery.
Methods of Structuring and Obtaining Contracts
The surveyed transit systems were asked to provide details about their twolargest fixed-route bus and two largest demand-responsive contracts. The sur-vey asked about the length of each contract, the basis of payment, the use ofperformance incentives and penalties, and other details of contract terms andprovisions. In addition, respondents were asked about the methods used to ob-tain the contract and the degree of competition experienced, including thenumber of bidders and contractor changes that occurred during each bid cycle.The answers to these questions, gleaned for nearly 300 contracts reported bymore than 150 systems, reveal much about the way service contracts are struc-tured and the degree of competition for contracts today.
Contract Specificity
Most transit service contracts are highly prescriptive and detailed agreements.They not only define the kinds of services to be offered, but also prescribe howthose services are to be provided; how service quantity and quality are to bemeasured and monitored; and who will provide the vehicles, facilities, main-

Executive Summary 9
tenance, and support services. Such specificity is often necessary to convey themultifaceted and sometimes intangible attributes of transit service, such as cus-tomer care. The survey findings suggest that detailed contracts are especiallyimportant as a means of ensuring that all parties understand each other’s re-sponsibilities and expected performance. Legal constraints that preclude thedevelopment of ongoing and informal relations between public agencies andparticular suppliers—as are often found among private organizations that reg-ularly buy and sell services from one another—can make such clarity andspecificity even more important for transit service contracting.
Contract Provisions
Most transit service contracts include provisions that prompt the contractor tocontrol costs and pay attention to service quality. Contractors are usually com-pensated on the basis of the amount of service they provide according to a spec-ified rate, such as a charge per revenue-hour; relatively few are compensatedon the basis of the costs they claim to have incurred in supplying the service.This approach shifts cost-containment responsibilities to the contractor. Fur-thermore, contract terms are often designed to foster competition. The mostcommon contract duration is 3 years with two 1-year options. This interval isapparently long enough to avoid repeated transaction costs associated with fre-quent rebidding, but short enough to ensure that incumbent contractors donot become complacent and that competitor interest is sustained. Most con-tracting agencies provide the vehicles and facilities for the service, especially inbus contracts. This practice, too, may foster competition by reducing contrac-tors’ capital risks and by allowing the agency to retake and rebid the service ifthe winning contractor fails to perform as required.
Competition for Contracts
The survey results indicate that the majority of transit systems obtain servicecontracts through procedures intended to attract competing bidders. Most re-ported contracts, especially the largest ones and those for bus services, have at-tracted multiple bidders. As might be expected, larger contracts, moreprevalent among the bigger transit systems, tend to attract greater numbers ofbidders and involve changes in contractors more often than do smaller con-tracts. In general, however, the numbers of bidders on contracts have been sta-ble in recent years, and many contracts continue to change hands even after
Contracting for Bus and Demand-Responsive Transit Services10
having been rebid numerous times, suggesting that incumbent contractors arefrequently subject to competition.
Effects of Contracting on Service Cost and Quality
During the past two decades, numerous studies have focused on the effects ofcontracting on the cost and quality of transit services. These studies have ad-dressed many pertinent questions, such as the extent to which contractingsaves or contributes to transit agency overhead and budgetary costs, and howcontracting’s effects on labor productivity, labor-management relations, andworker retention relate to the quality of service experienced by customers.
As noted, contracting is used in many different ways for multiple pur-poses. Because of variations in circumstances and analytical methods, it hasoften proven difficult to use the results of individual studies to draw generalconclusions about the nature and magnitude of contracting’s effects on cost,quality, and other aspects of transit service. A comprehensive analysis andsynthesis of previous research could not be undertaken within the time frameand resources available for this project. Instead of attempting to formulatesuch judgments about the effects of contracting by reviewing past studies, thecommittee chose to ask the transit general managers surveyed for their ownassessments of those effects. Respondents received no guidance on what con-stitutes a cost saving or a high quality of service; instead, they were simplyasked to use their judgment in identifying and rating various effects of transitservice contracting.
Most of the general managers of systems that are now contracting reportedthat their contracting programs are meeting expectations. More than half statedthat their expectations for contracting have been fully met overall, and another38 percent reported that their expectations have been partially met.
Almost all of the general managers of systems that are now contracting re-ported cost savings from the practice. Most of these general managers, fromsmall and large agencies alike, cited reductions in operating costs. Small agen-cies reported benefits from contractors’ assumption of supervisory and ad-ministrative burdens.
The negative effects of contracting mentioned most frequently by generalmanagers from systems that have contracted, including those that do so nowand those that have done so in the past, were the loss of operational control,shortcomings in service quality, and problems with customer service. Morethan half the general managers that reported having their expectations for con-

Executive Summary 11
tracting partially met identified service quality as an important problem. Gen-eral managers from systems that no longer contract also cited problems withservice quality.
General Managers’ Advice on Contracting
By and large, the general managers from transit agencies that are now con-tracting are satisfied with the cost savings achieved and less satisfied with thequality of service provided. Yet often through practical experience, the transitsystems that are contracting today have found ways of achieving acceptable lev-els of both cost savings and service quality. Many have advice to offer otheragencies that are considering contracting, including the following:
■ Anticipate the advantages and disadvantages of contracting, and set realis-tic expectations.
■ Establish a competitive procurement process that invites high-quality pro-posals and screens out unrealistic proposals and unqualified contractors.
■ Prepare an internal analysis of the cost of service contracting as a baselinefor examining bids.
■ Spell out all contractor responsibilities clearly, monitor performance closely,and communicate with the contractor frequently and openly.
Additional Insights and Ideas for Follow-On Study
In designing the survey, the committee sought to balance a desire for additionaldata against practical considerations involved in obtaining a sufficiently largenumber of responses that could be analyzed in a timely manner. Some relevantdata were therefore sacrificed, such as the overall magnitude of the benefits andcosts associated with contracting and general managers’ satisfaction with theirin-house services. Such information would undoubtedly have been helpful inproviding an appropriate context for assessing the survey findings on con-tracting’s results and cost-effectiveness. Nevertheless, the committee believesresearchers and practitioners will benefit from the perceptual information oncontracting outcomes obtained from the hundreds of general managers re-sponding to the survey.
Likewise, more information on the extent to which policy and political en-vironments have influenced the decision to contract would have been desir-able. While the general managers surveyed offer one perspective on such

Contracting for Bus and Demand-Responsive Transit Services12
influences, the experiences of individual committee members suggest thatpolitical considerations, especially at the local level, can be important in deci-sions about whether to contract. In subsequent research, the information fromthe committee’s survey of general managers must be supplemented with otherinformation, obtained in part from other participants in transit policy making,if the overall effect of political considerations on contracting decisions is to beunderstood.
The survey results nevertheless provide much new information for as-sessing transit service contracting. Collectively they demonstrate that con-tracting is a dynamic undertaking. At any given time, some agencies arecontracting for some or all their services, some are not contracting at all, andothers are about to begin or forego contracting. Certainly, transit agency needsand circumstances can change over time in ways that affect the comparativeadvantages of contracting and direct service provision. Reports from generalmanagers suggest that contracting can entail a trade-off between cost savingsand service quality. An agency’s original desire to contain costs through con-tracting may be tempered by concerns about ensuring service quality. Overtime, as transit agencies exert more control over service quality by imposingmore stringent performance requirements in contracts, it is reasonable to ex-pect contractor costs to rise. At the same time, labor unions may agree tochanges in collective bargaining agreements that make direct service provi-sion more cost-competitive with contracted service. Although decisions tocontract are sometimes portrayed as being politically or ideologically moti-vated, the committee believes that practical considerations and experiencessuch as these are important factors in the decision to start, stop, or continuecontracting.
A final and related insight concerns the nature of service contracting rela-tionships. The committee found much evidence of the need to define thor-oughly and formally in contract documents the quality of transit service to bedelivered. Yet not all the qualitative aspects of transit service can be articulatedwell in a written set of specifications. On the basis of past experience with in-dividual contractors, transit managers can come to value certain contractorqualities that may not be adequately described in a request for proposals or acontract document. The emergence of such positive relationships is perhapsmost evident in contracting for demand-responsive services; transit managersare reluctant to change contractors once they have found one that performswell by, for example, pleasing regular customers and generating few service
Executive Summary 13
complaints. The continuation of these types of relationships may be as advan-tageous to riders as to the agency and contractors involved. The extent to whichsuch service contracting relationships exist today in the transit industry andcan be fostered and maintained to the benefit of riders deserves further con-sideration in follow-on studies that assess the appropriate role of public tran-sit agencies in contract monitoring, oversight, and management.


1
15
Introduction
E ach year the federal government distributes grants for cap-ital investment and planning, as well as some operating assistance, to about 500 public transit systems across the
country. State and local governments match and supplementthese grants with funds for transit operations, equipment, and facilities. This large public investment continues a decades-longgovernment commitment to the provision of transit in the UnitedStates.
As the workhorses of urban transit, buses operating on fixedroutes are an especially important component of the nation’s pub-lic transportation system. They are the most ubiquitous and heav-ily used form of public transport, carrying more than 16 millionpassengers a day. Together with demand-responsive paratransitvehicles, which carry more than 300,000 people each day, the na-tion’s fleet of more than 75,000 transit buses accounts for abouttwo-thirds of all daily passenger trips by transit (see Figure 1-1).Though often associated with large cities, both fixed-route and demand-responsive transit services can be found throughout thecountry, in large and smaller communities alike.
Transit officials and policy makers at all levels of governmenthave a keen interest in finding the most efficient and effectivemeans of delivering bus and demand-responsive transit servicesto ensure good service and minimize the need for higher fares andpublic subsidies. Most public transit systems provide the major-ity of these services directly, using their own facilities, equipment,
1

FI
GU
RE
1
-1
Annu
al tr
ends
in a
vera
ge d
aily
pas
seng
er tr
ips
(unl
inke
d) b
y tra
nsit
mod
e in
the
Unite
d St
ates
, 198
4 to
200
0.
(SOU
RCE:
Amer
ican
Pub
lic T
rans
porta
tion
Asso
ciat
ion,
Pub
lic T
rans
porta
tion
Fact
Boo
k, 1
997
to 2
000.
)

Introduction 17
and vehicles, which are operated by their own personnel. Many, however, pro-cure some services from outside contractors. They may contract for a limitedamount of service on specific routes or for particular needs (such as express busor dial-a-ride paratransit services), or they may contract for all services in a givenarea or over their entire network.
According to Federal Transit Administration (FTA) data, most transit sys-tems that receive federal aid purchase at least some services from outside con-tractors (see Figure 1-2). Of the nearly 500 systems offering fixed-route bus anddemand-responsive services that received federal aid in 1998 (the most recentyear of available data), about 40 percent supplied all services directly, 39 per-cent purchased some services from outside contractors, and the remaining 21 percent purchased all their services.
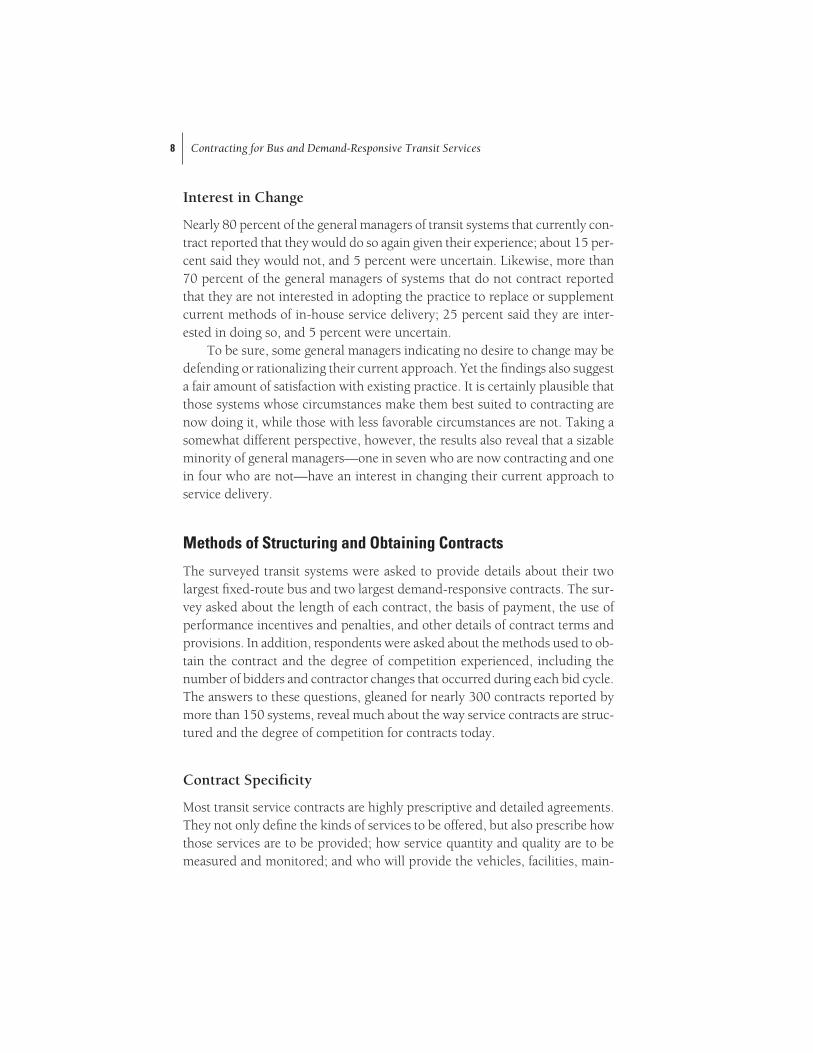
Again according to FTA’s National Transit Database, demand-responsiveservices are the most likely to be contracted out completely; nearly half of tran-sit systems receiving federal aid contracted all their demand-responsive servicesin 1998. A further one in six systems, or 16 percent, purchased some of theseservices. In almost a mirror image, 70 percent of systems directly operated alltheir fixed-route bus services, compared with only 18 percent that purchased
F I G U R E 1 - 2 Percent of transit systems that contract for all, some, and no bus and demand-responsive transit services: (a) total transit systems reporting (N = 483). (continued on next page)
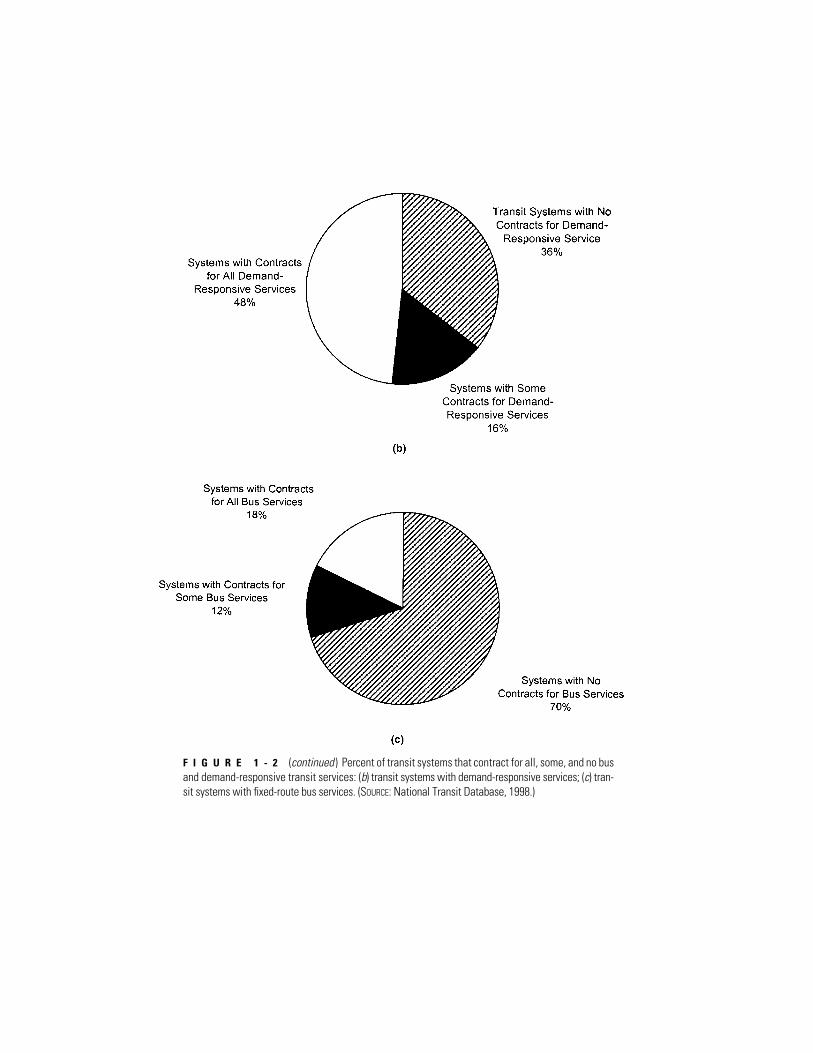
F I G U R E 1 - 2 (continued ) Percent of transit systems that contract for all, some, and no busand demand-responsive transit services: (b) transit systems with demand-responsive services; (c) tran-sit systems with fixed-route bus services. (SOURCE: National Transit Database, 1998.)

Introduction 19
all of these services from contractors. Altogether, about 6 percent of bus vehicle-hours (in revenue service) and about 67 percent of demand-responsive vehicle-hours was purchased from contractors (see Figure 1-3). In total, contractorsprovided about one in seven vehicle-hours in 1998. This ratio has changed verylittle during the past few years.
The aggregate data on purchased transportation collected by FTA providean incomplete picture of transit service contracting in the United States, how-ever. They provide little insight into the many different ways in which contractservices are obtained, used, and structured. The hundreds of transit systemsthat contract for services do so in a multitude of ways and for many differentreasons. For instance, most find and select contractors through procedures in-tended to attract competing bidders—awarding contracts according to pro-posal quality or making their decisions strictly on the basis of lowest price (as
F I G U R E 1 - 3 Recent trends in vehicle-hours directly operated and purchased for (a) fixed-route bus services. (continued on next page)

F I G U R E 1 - 3 (continued ) Recent trends invehicle-hours directly operated and purchasedfor (b) demand-responsive services, and (c) total, 1994 to 1998. (NOTE: Percentages refer to share oftotal vehicle-hours purchased. SOURCE: National Transit Database, 1998.)

Introduction 21
is often required by state or local law). These contracted services are usuallyrebid every 2 to 5 years. Yet other transit agencies have developed long-standingagreements with individual transit providers—both public and private—whose contracts are renegotiated periodically, but who, as a practical matter,are subject to little if any regular competition.
Transit service contracting received much attention during the 1980s andearly 1990s, when federal policies favoring outsourcing led to numerous ex-periments and studies of transit service contracting while stirring much debateabout its effects. The debate has subsided somewhat during the past decade asmore transit systems have gained experience with contracting and as federal aidrequirements have been more neutral with respect to the particular methods ofservice delivery used by transit systems. Nevertheless, much of the discussionand research on transit service contracting during the past decade has centeredon the experiences, sometimes controversial, of a few large transit systems thathave contracted for fixed-route bus services—even as the majority of contract-ing has taken place in smaller systems and for demand-responsive services.Thus after more than two decades of debate and study, there is still much to belearned about the wide array of transit service contracting practices and experi-ences across the country.
Study Purpose
As noted in the preface, this study was funded by FTA in response to a legisla-tive request to examine the effects of contracting out by public transit agenciesfor service operations and administrative functions (see Box 1-1). However, thestatement of task agreed to by the National Research Council (NRC) includes anexplicit recognition that the broad scope of the congressional request was notcommensurate with the time and resources provided for the study (see Box 1-2).Accordingly, the Transportation Research Board (TRB) charged the committeewith gathering and analyzing information about the scale and nature of transitservice contracting across the United States, and offering insight on those effectsof the practice for which information could be obtained and examined. In par-ticular, the committee sought answers to the following questions:
■ How much contracting is practiced, by whom, and for what kinds of tran-sit services;
■ How contracting has been changing over time, in both quantity and quality;■ Why some agencies contract for transit services while others do not;

B O X 1 - 1
Text of Congressional Request for Study
Transportation Equity Act for the 21st Century (TEA-21), Federal Transit Act of1998 Section 3032, Contracting Out Study:
(a) Study. Not later than 6 months after the date of enactment of this Act, theSecretary shall enter into an agreement with the Transportation ResearchBoard of the National Academy of Sciences to conduct a study of the effectof contracting out mass transportation operation and administrative functions on cost, availability and level of service, efficiency, safety, quality of services provided to transit-dependent populations, and employer-employee relations.
(b) Terms of Agreement. The agreement entered into in Subsection (a) shallprovide that(1) The Transportation Research Board, in conducting the study, consider
the number of grant recipients that have contracted out services, thesize of the population served by such grant recipients, the basis for de-cisions regarding contracting out, and the extent to which contractingout was affected by the integration and coordination of resources oftransit agencies and other Federal agencies and programs; and
(2) The panel conducting the study shall include representatives of transitagencies, employees of transit agencies, private contractors, academicand policy analysts, and other interested persons.
(c) Report. Not later than 24 months after the date of entry into the agreementunder Subsection (a), the Secretary shall transmit to the Committee onTransportation and Infrastructure of the House of Representatives and theCommittee on Banking, Housing, and Urban Affairs of the Senate a reportcontaining the results of the study.
(d) Funding. There shall be available under Section 5338(f)(2) of Title 49,U.S.C. to carry out this section $250,000 for fiscal year 1998.
(e) Contractual Obligation. Entry into an agreement to carry out this sectionthat is financed with amounts made available under Subsection (c) is a con-tractual obligation of the United States to pay the government’s share of thecost of the study.

Introduction 23
■ How contract provisions and contracting processes vary among agencies; and■ How contracting has affected the level and quality of transit service, transit ex-
penditures, safety performance, and relations between labor and management.
The aim in addressing these questions was to shed more light on the manypurposes, methods, and outcomes of transit service contracting—informationthat should prove valuable to transit policy makers and managers in decidingwhether to contract and how to make contracting programs work better.
Approach and Scope
Given the lack of detail on contracted services in FTA’s National Transit Data-base, as well as the agency-specific nature of most recent research on con-tracting, the committee decided to obtain additional data on the practice byconducting its own nationwide survey of public transit systems. A two-partsurvey questionnaire was mailed to the general manager in each of more than500 public transit agencies that receive grants from FTA (since the congres-sional request identified federal grant recipients as the primary focus of this
B O X 1 - 2
Study Statement of Task
To reach conclusions about effects on transit cost, service, safety, labor, and effi-ciency, this project will review available literature reporting on the experienceof U.S. transit agencies with contracting out some or all of their operational andadministrative functions. Current information about the amount and type ofcontracting that is under way will be gathered.
As required by Congress, the study will consider the number of grant recipientsthat have contracted out services, the size of the population served by suchgrant recipients, the basis for decisions regarding contracting out, and the extent to which contracting out was affected by the integration and coordinationof resources of transit agencies and other federal agencies and programs. Thecommittee will select a consultant to review and synthesize the literature and tosurvey a sample of transit agencies.
The committee then will use this information to address the questions posedby Congress to the extent possible. Although the committee may not be ableto answer the questions fully, it will identify those uncertainties that can beresolved with available information and those that cannot.

Contracting for Bus and Demand-Responsive Transit Services24
study).1 Further detail on the survey design, method, and pool of recipients isprovided in Chapter 4 and Appendix B.
The general managers were asked to forward the first part of the survey tothe members of their staff most familiar with agency contracting programs.This part asked for information on the types of services contracted; the historyof contracting agreements; and contracting methods, terms, and procedures.The general managers were asked to complete the second part of the survey,which contained more perceptional questions about their agencies’ reasons forcontracting and the outcomes, both positive and negative. This part of the sur-vey also sought the general managers’ advice on how to avoid and mitigateproblems in contracting and how to make contracting programs work better.General managers from agencies that do not now contract were asked to citethe reasons for this decision.
The survey focused specifically on contracting for fixed-route bus and demand-responsive transportation services, which account for the vast majorityof contracting practice in the United States. Nevertheless, transit systems wereasked whether they offer other kinds of transit service and if so, whether any ofthese are contracted. None of the 10 respondents with heavy rail systems andone of the 10 respondents with light rail systems reported contracting for theseservices. Several transit systems reported contracting for vanpool and ferryboatoperations (21 of 35 that offer these services), while most of the handful of re-spondents providing commuter rail service (7 of 11) reported using contractors.
In the interest of obtaining as much detailed information as possible, therespondents were asked to distinguish between fixed-route bus and demand-responsive services when reporting on their contracts and contracting methods.In the second part of the survey, however, the general managers were not al-ways asked to make this distinction when assessing their contracting experi-ences and programs. In retrospect, such a distinction would have been helpfulin examining contracting experiences by type of service—especially since manytransit systems have been contracting for demand-responsive services for manyyears. Yet it was important to keep the survey from becoming too long and bur-densome for respondents to complete, and some loss of specificity was acceptedin anticipation of higher response rates.
Also to keep the survey manageable, as well as to retain the study focus oncontracting for transportation services, recipients were not asked to provide in-formation on their contracts for administrative and support functions, such asmarketing, accounting, and vehicle maintenance (although such tasks may besubsumed within broader contracts for transportation service). Nor was infor-

Introduction 25
mation sought on contracts for management services. Although potentially in-formative, a wide-ranging examination of all kinds of outsourcing by transit sys-tems would have presented time and resource demands that would havecompromised the committee’s ability to fulfill the main purpose of the study.The practice of and experience with contracting for other transit functions, suchas maintenance and management, may merit closer study in the future.
More than half of the transit systems receiving the survey responded, pro-viding a wealth of information on service contracting practices and effects. Theinformation gleaned from the first part of the survey, completed by contract pro-gram staff, provides a snapshot of the extent and methods of contracting today,including contracting amounts, terms, and procedures by mode, communitysize, and region. Responses to the second part of the survey, completed by gen-eral managers, depict how well contracting is working, where improvements areneeded, and what steps can make the practice more effective.
To supplement and illuminate the survey results, the committee also selectedfive transit systems for more detailed telephone interviews with the transit agencymanagers, private contractors, and local labor union and elected officials mostknowledgeable about contracting decisions and programs to obtain their per-spectives on contracting experiences. Along with reports from the literature, theseinterviews provided ideas on how to analyze and interpret the survey results.
The findings presented in the following chapters are highly informativeabout the practice and outcomes of transit service contracting today. This reportdoes not, however, offer recommendations on contracting. Contracting practicesand experiences are varied, as are the individual circumstances of transit systems.Political environments and other exogenous factors (such as the available work-force) can influence both interest in contracting and its effects; the study did notaddress these broader influences. The aim of this report is to provide better in-formation for those who must make policy decisions regarding transit service de-livery, and to enable transit systems to learn from the experiences of others andadapt this information to their own situations as they see fit. Further analysis ofthe survey information will undoubtedly yield many more insights, and the sur-vey data have been made available to interested analysts for this purpose.
Report Organization
Chapter 2 provides a historical overview of the role of the public and privatesectors in the provision of transit services in the United States. The discussionranges from the early for-profit origins of urban transit to the factors leading to

Contracting for Bus and Demand-Responsive Transit Services26
widespread public ownership and subsidy of transit during the past four decades.The chapter concludes with a review of more recent policies and legislationaffecting the amount of transit contracting that takes place.
Chapter 3 offers a conceptual framework for the decision to contract fortransit services, drawing on the precepts of organizational behavior and contracteconomics. This is followed by a brief review of the effects of transit contractingon service cost, quality, and safety as identified and examined in past studies. Al-though time constraints precluded a comprehensive review of the literature, thechapter identifies several gaps in the previous research that the committee hasattempted to fill in the present study.
Chapters 4 and 5 present the survey findings. Chapter 4 describes the scopeof transit service contracting today, the terms and methods employed, and the ex-tent of competition—information obtained from Part 1 of the survey. Chapter 5summarizes the reports of transit general managers in Part 2 of the survey on thefactors influencing decisions about contracting, the positive and negative aspectsof the practice, and ways to improve contracting programs.
The final chapter summarizes the main findings of the study. Taken to-gether, these findings reveal much about the nature and extent of transit servicecontracting today, the motivations for and deterrents to the practice, and its ad-vantages and disadvantages. The committee offers its own insights and ideas forfurther study at the conclusion of the chapter.
Note1. The committee recognizes that some public transit providers receive aid from
other federal programs, such as Medicaid, and that others do not receive any fed-eral aid at all; however, tailoring and administering surveys to such a varied pop-ulation would have exceeded the time and resources available for this project.

2
27
Public and PrivateProvision of Transit in theUnited States
The contracting of transit services by public agencies isoften viewed as a recent phenomenon. Yet the public andprivate sectors have long collaborated in the provision of
urban transportation in the United States. While the nature ofthis collaboration has evolved over the years, public and privateinvolvement in transit has endured. This chapter describes theevolution of the public- and private-sector roles in transit pro-vision to provide historical context for the ensuing discussion oftransit contracting today. Also described are key legislation andpublic policies that have influenced transit service contractingin recent decades.
Early Experience: Private, Regulated Transit Service
Genesis of Local Transit Regulation
Long before electric streetcars and motor buses, horse-drawn ve-hicles provided urban transport on a for-hire basis. Early forms ofsuch vehicles included the hackney—a coach pulled by one ortwo horses—which flourished in England for more than 200 yearsbeginning in the 17th century. At the time, passenger transporta-tion needs were escalating in London and the other burgeoningcities of preindustrial Europe (Smerk 1992, 3–7). Although asmall proportion of city dwellers could afford hackneys, theEnglish government soon began to treat this mode of transport
2

Contracting for Bus and Demand-Responsive Transit Services28
as an essential public service. Partly for this reason, the government establishedrules governing how much the hackneys could charge, where they could travel,and how many of them could provide service. The degree to which such li-censing rules actually benefited urban travelers by ensuring sufficient serviceand fair pricing rather than benefiting the hackney operators by protecting themfrom competition is unclear, although the former benefits were their ostensiblepurpose.
Similar regulations were applied to successive forms of horse-drawn urbantransportation. One such successor, the omnibus, was introduced in London inthe early 1800s. Because it provided fixed-route and scheduled service, couldcarry up to 20 passengers, and was thus affordable to more people than the hack-ney, this wagon-like vehicle became immensely popular in Europe and to a lesserextent in the largest cities of the United States (Smerk 1992, 6–7). Like the hack-ney operators, those offering omnibus service were subject to public service reg-ulations governing the fares they could charge, routes they could ply, and kindsof services they could offer.
Lasting Effects of Early RegulationsThe decision to regulate the private suppliers of urban transportation has hadlasting effects. The early regulations were based on the principle that for-hirepassenger transportation in cities was important enough to the public that gov-ernment intervention was warranted to ensure sufficient and stable service. Theway taxicabs are regulated today is a legacy of the early hackney rules.1 Perhapsmore important, however, the early regulatory schemes established the basicmodel of transit service provision that would come to predominate in the UnitedStates through the first half of the 20th century. In this joint public–privatemodel, the public sector sets the standards for transit service, while the privatesector owns and operates the service.
Indeed, urban transit regulation, from its earliest applications, can beviewed as a form of public and private contracting. The agreement is straight-forward in principle. The public is promised enhanced safety through licensingand inspection of vehicles and drivers, protection from exploitive fares, and acertain steadiness of service. In return, the regulated operators receive a degreeof economic protection through limits on competitive entry and pricing (Meyeret al. 1965, 353–359).
A reason for regulating the early hackney and omnibus services was thatrelative ease of entry into the business would lead to an overabundance of will-ing suppliers. Neither service required large capital investments or specialized

Public and Private Provision of Transit in the United States 29
labor skills. Hence cities worried that aggressive competition would result inerratic and unstable services characterized by operators repeatedly enteringand exiting the business, leading to poor service quality. A longer-run concernwas that a small number of well-financed or colluding operators could with-stand the competitive onslaught, deter further competition through below-costpricing and other exclusionary tactics, and charge high fares by exploiting theirmarket power.2
Emergence of Franchised OperationsA common means by which cities regulated competition was by establishingfranchises for public transit operators. In return for exclusive rights to operatein a designated area, franchise operators agreed to provide stable service for aspecified period and to abide by limits on the fares they could charge ( Jones1985, 28–30). The operators were largely protected from competition (thoughnot from other modes) and promised a fare structure that would be sufficientto meet their operating costs and generate profits on invested capital sufficientto maintain the service ( Jones 1985; Meyer et al. 1965, 353–359).
In the United States, the early transit services followed this regulatory model.Franchises became even more popular following the introduction of street rail-ways (first horsecars and later electric streetcars) during the mid- to late 19th cen-tury (Smerk 1992, 7–10; Jones 1985, 28–30). Because most roads at the timewere unpaved, rail traction—by getting wheels out of the mud—greatly in-creased the speed and reliability of urban transportation and reduced the needfor horse power and its associated costs. However, the street railways requiredgreater capital investment than the omnibuses. Rather than pay for rail con-struction with public funds, most cities franchised streets to individual opera-tors, who then paid for the traction (Jones 1985; Smerk 1992). Urban historiansmaintain that this regulatory approach led to an overinvestment in street railwaysas operators sought additional street franchises and laid parallel track to preemptcompetition ( Jones 1985; Smerk 1992; St. Clair 1986, 104–107). Moreover,awards for street franchises were associated with public corruption during thelatter half of the 19th century, prompting calls for more stringent regulation oftransit fares and services ( Jones 1985).
Electric street railways were introduced in the 1880s. Electric power madeit possible to increase vehicle size and operating speeds dramatically whilereducing operating costs ( Jones 1985, 30–34). The streetcar operators couldtherefore extend their networks to reach more potential customers. Widespreadintroduction of electric street railways, as discussed below, occurred at a time

Contracting for Bus and Demand-Responsive Transit Services30
when American cities were undergoing rapid growth as a result of many newtechnologies (such as public water and sewer systems, structural steel, and ele-vators), industrialization, and immigration from the countryside and abroad(Tarr and Dupuy 1988). Although the electric streetcar, coupled with changesin the urban environment, revolutionized transit, most cities entering the 20thcentury continued to use franchises as the main means of regulating service.
Regulation of Private Transit Services: 1900 to 1960s
Rise of Electric Street RailwaysThe widespread introduction of electric streetcars at the close of the 19th cen-tury was a watershed event for American cities. The electric streetcars (alongwith rapid railways) allowed cities to expand outward by creating residentialareas on the city edges (Smerk 1992, 14). They also allowed city centers to growupward, as the street railways and their interurban lines carried millions ofworkers to centrally located high-rise office buildings and industrial sites(Pushkarev et al. 1982, 4–5; Warner 1978, 5–14). During the last decade of the19th century and the first two decades of the 20th century, private street rail-way companies laid more than 70,000 kilometers of track (Pushkarev et al.1982). By 1920, just about every U.S. city and town of any size had a publictransit system, and the majority of transit vehicles used in these systems wereelectric streetcars (St. Clair 1986, 4).
It is notable that in Europe, most electric streetcar systems were munici-pally owned and operated before World War I.3 Yet with few exceptions—suchas in San Francisco and Seattle—nearly all the street railways in the UnitedStates were privately owned and operated. Many were financed initially by realestate developers looking to extend residential and commercial areas outwardto tracts of undeveloped land (Black 1991).4 The street railways were majorusers of electricity, and as such they were often owned and operated by electricutilities ( Jones 1985, 37). Indeed, early in their development, the electric trac-tion companies produced their own power and sold the surplus to other in-dustrial and residential users; hence the streetcar companies were the electricpower companies in many localities.
By World War I, Americans living in cities averaged more than 250 street-car rides per year (Middleton 1987, 77; McKay 1988, 11). Yet by this time thenation’s ubiquitous urban railways were already showing signs of contraction.Land speculators, more interested in the opportunities presented by the auto-mobile, were no longer investing in them ( Jones 1985; Foster 1981; Altshuler

Public and Private Provision of Transit in the United States 31
et al. 1979, 396–397). Growth in demand for electricity and innovations in itsproduction and distribution made powering streetcars through a single utilitymore economical and feasible (Hilton 1985, 38–39). The industry began toconsolidate, and as it did so, many parallel and redundant services were aban-doned ( Jones 1985; Middleton 1987, 78–79; Hilton 1985, 38–39).
During this period of technology evolution, the basic regulatory model oftransit service remained unchanged. Most cities awarded franchises for specificroutes and charged operators franchise fees and levies for maintenance of bridgesand road surfaces around the tracks (Smerk 1992, 8–15). Yet frequent requestsfor fare concessions by streetcar companies were poorly received by a public thatwas growing weary of poor service quality. According to historical accounts,widespread public perceptions of oligopolistic and anticompetitive behavior onthe part of the streetcar companies alienated customers and government officialsalike, prompting calls for even more restrictive obligations each time a franchisecame up for renewal ( Jones 1985, 30–37; Saltzman 1992, 34–37). Even as costsincreased, many operators were not allowed to raise fares—long pegged at anickel—and high franchise fees and levies for street maintenance were oftenviewed as punitive by the franchise holders (Saltzman 1992, 35). Furthermore,the franchise approach to regulation, which gave the public sector the ability tocontrol fares and services, discouraged cities from assuming ownership or tak-ing action to reestablish a more competitive environment. Both the transit oper-ators and their unionized workforces were opposed to either a public takeoveror substantive regulatory reforms ( Jones 1985).
Decline of Street RailwaysThe above arrangements remained in place even as the popularity of the auto-mobile grew and demand for transit began to wane after World War I. Ameri-cans purchased millions of automobiles during the 1920s (TRB 2001). By 1927there was one registered automobile for every 3 or 4 residents in Detroit and LosAngeles, one for every 8 in Boston and Chicago, and one for every 12 in NewYork City—whereas two decades earlier there had been practically none (TRB2001; Schrag 2000, 58; Foster 1981). To accommodate the automobile, state andlocal governments invested in better roads and traffic control devices after thewar. Most interurban rail lines were abandoned during this period—some be-coming the rights-of-way for new highways—while many city lines were pavedover to make room for the automobile. City traffic engineers often viewed thelumbering and difficult-to-maneuver streetcars more as a source of traffic con-gestion than as a means of its alleviation (Middleton 1987, 168; Foster 1981).

Contracting for Bus and Demand-Responsive Transit Services32
Streetcar ridership declined throughout the 1930s, followed by a brief, al-beit dramatic, respite during World War II caused by the rationing of fuel, short-ages of automobile parts, and wartime industrial production that brought morepeople into the cities (Saltzman 1992, 28) (see Figure 2-1). The Public UtilityHolding Company Act of 1935 called on electric power companies to divestthemselves of ancillary holdings, including transit companies. Yet electric com-panies had already been divesting their transit operations voluntarily, havingearned higher returns from the generation and distribution of electricity to thepublic than from the provision of transit service ( Jones 1985, 48–50; Hilton1985; Saltzman 1992, 37–38).
F I G U R E 2 - 1 U.S. trends in annual passenger trips by transit mode, 1920 to 1998. (NOTE: Data on demand-responsive and commuter rail ridership are not available for the periods before1984 and 1973, respectively. SOURCE: American Public Transportation Association, Public TransportationFact Book, selected years, 1977–2000.)

Public and Private Provision of Transit in the United States 33
Switch to BusesDuring this period, motor buses were becoming the predominant mode of pub-lic transportation in many cities, especially after the reliable diesel bus and automatic bus transmissions were introduced shortly before the war (St. Clair1986, 4). Both the transit companies and smaller entrepreneurs—even owner–operators—began operating the free-wheeled buses, which could be redeployedmore easily and required far less capital than streetcars ( Jones 1985, 53–54).
Sometimes local authorities encouraged motor bus services as a means of dis-ciplining street railway companies unable or unwilling to provide quality service( Jones 1985, 54). Although controversy arose in the 1940s as some motor bussuppliers acquired distressed streetcar lines to replace them with bus operations,5
the rail-to-bus conversion was well under way even before World War II ( Jones1985, 1963–1964; Saltzman 1992, 38–39). Between 1930 and 1945, the mile-age of street railways declined by more than 40 percent, while bus route milesincreased by 50 percent (St. Clair 1986, 8).
The early motor buses were typically operated by a single driver rather thanthe two-person crews (operator and fare collector) found on streetcars and oftenstipulated in union contracts (Jones 1985). Buses were further advantaged bythe continued improvements in public roads. Even New York City, which hadinvested heavily in a subway system three decades earlier, was in the midst of abuilding boom of new parkways, tunnels, and bridges.
Despite the advent of motor buses, however, urban transit patronage con-tinued to decline following the temporary upsurge during World War II (seeFigure 2-1). By this time, most of the early streetcar lines had been abandoned;in 1950, less than 10 percent of the original rail network remained in service(Middleton 1987, 169; Pushkarev et al. 1983, 6–7). Much of the urban popu-lation of the United States had moved farther from the center cities. Transitworks best on dense corridors; hence, both streetcar and bus lines had longbeen configured to serve riders heading to and from downtowns (Levinson andWynn 1963). Yet these markets were dwindling as both people and businessesmoved to the lower-density suburbs (Meyer and Gómez-Ibáñez 1981, 41, 223).While suburbanization had been taking place in the United States since at leastthe 19th century (fostered by the streetcar, commuter railroads, and earlier formsof mass transportation), the private automobile—coupled with rising incomes,changing lifestyles, and the new federally funded urban freeways—allowed forincreasingly dispersed settlement patterns that proved difficult for private tran-sit operators to serve profitably (Lave 1985, 3; Smerk 1992, 18; Levinson 1996;Saltzman 1992, 26; St. Clair 1986).

Contracting for Bus and Demand-Responsive Transit Services34
Public Provision of Transit
Advent of Federal Aid: 1960s and 1970s
Between 1950 and 1960, transit patronage declined by more than 40 percent,and given the rapid increase in both urban populations and per capita auto use,the decline in transit’s share of total travel was even more precipitous (see Fig-ure 2-1). As a practical matter, the regulatory model that had been in place fordecades was no longer suitable for the provision of urban transit, as the num-ber of for-profit private firms was dwindling in the face of sharply decliningrider demand. In the two decades after World War II, more than 200 transitcompanies around the country folded, and many smaller cities lost transit ser-vice altogether (Hilton 1985, 46; Black 1991). Private transit operators that werestill providing service often were not earning profits sufficient to attract the cap-ital needed to purchase new equipment and add services ( Jones 1985). Manytransit companies were operating buses that were more than 20 years old, andmost of the remaining streetcars were antiquated, built before World War II.
Cities were the first level of government to respond to the emerging transitcrisis. By the 1940s, some large municipalities—most notably Boston, Chicago,Cleveland, and New York—had taken over the private railways in their juris-dictions and were supplementing farebox revenues with public funds to financephysical plant ( Jones 1985, 79). But the decades-long withdrawal of capitalfrom the industry had taken its toll; most systems were in dire need of newequipment and facilities. With few exceptions, most American cities—havinglost tax-generating households and businesses to the suburbs—were unwillingor unable to subsidize transit services (Jones 1985, 79; Meyer and Gómez-Ibáñez 1981).
Federal Aid for Public Ownership and Investment in TransitAs the declining fortunes of America’s cities gained national recognition duringthe 1960s, Congress passed legislation that for the first time gave the federal gov-ernment a prominent role in the provision of urban transit. The Urban MassTransportation Act of 1964 (later redesignated the Federal Transit Act) providedloans and grants for transit capital acquisition, construction, and planning activ-ities. The grants were offered on a two-to-one (federal to state and local) match-ing basis. The aid was restricted to capital acquisitions and planning assistancepartly on the grounds that federal operating subsidies for local transit agencieswould introduce a federal presence in decisions better left to state and local offi-cials (Meyer and Gómez-Ibáñez 1981, 9).

Public and Private Provision of Transit in the United States 35
Notably, only public entities could apply for the federal grants. Given theavailability of federal aid, many cities, states, and counties purchased or other-wise took over their local rail and bus systems. Thus by the 1970s, a largely newmodel of transit provision—public ownership—had become increasinglyprevalent in the United States. Many jurisdictions consolidated the operationsof smaller private and public systems under the auspices of regional transitauthorities. A few states, such as Connecticut, Rhode Island, and New Jersey,formed statewide transit agencies.
The evolution from public to private ownership, while not swift, was cer-tainly dramatic. In 1940, only 20 transit systems in the country were publiclyowned, and they accounted for just 2 percent of ridership (Black 1991, 69). By1960, although the vast majority of all systems were still in private ownership,properties in public ownership accounted for nearly half of all transit ridership,mainly because the country’s very largest systems were publicly owned (Jones1985, 79; Lave 1991, 117).6 By 1980, more than 500 systems were publiclyowned, accounting for 95 percent of ridership nationally (Black 1991, 69).
The federal aid was generally welcomed by states, localities, and distressedprivate transit companies alike (Jones 1985, 114–131). Transit labor unionsfavored public funding, but were concerned about possible adverse effects onunionized workers resulting from public ownership. The transit workforce hadbeen well organized for decades, especially in the largest American cities. Asearly as 1920, more than half the workforce of the private streetcar companieswas unionized ( Jones 1985, 23). Ironically given more recent union concernswith privatization, transit workers at the time were concerned that a shift topublic ownership would lead to their losing rights and benefits obtainedthrough collective bargaining (TRB 1995). At the time, public employeeswere exempt from coverage under the National Labor Relations Act, and sev-eral states expressly prohibited collective bargaining by government workers(TRB 1995). As a remedy, Congress included a provision in Section 13c of theUrban Mass Transportation Act requiring that the condition of existing transitworkers not be diminished through transit projects initiated with federal funds(see Box 2-1). This provision remains in effect today.
Federal Aid for Transit Operations and New ServicesBy the 1970s, nearly all urban transit systems in the United States were plannedand funded by state and local governments with the help of federal aid, and mostwere owned and operated by state, regional, or local agencies. Despite public ef-forts to improve transit systems, however, ridership continued to decline in most
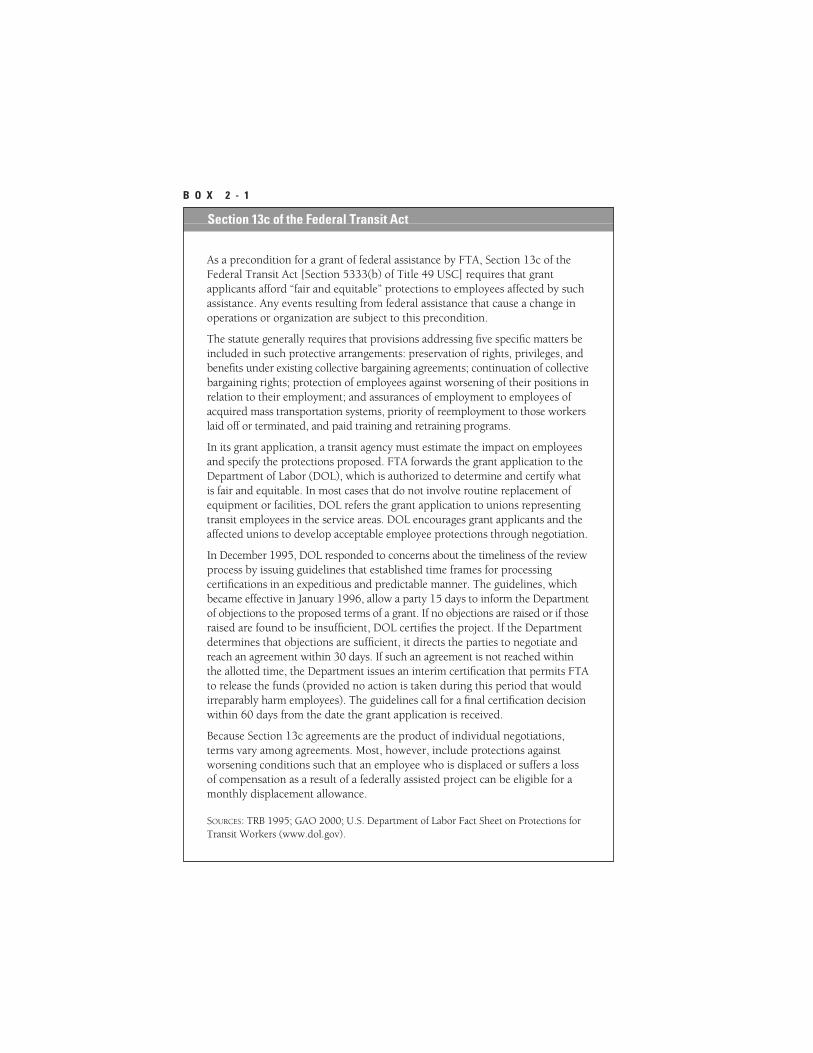
B O X 2 - 1
Section 13c of the Federal Transit Act
As a precondition for a grant of federal assistance by FTA, Section 13c of theFederal Transit Act [Section 5333(b) of Title 49 USC] requires that grant applicants afford “fair and equitable” protections to employees affected by suchassistance. Any events resulting from federal assistance that cause a change inoperations or organization are subject to this precondition.
The statute generally requires that provisions addressing five specific matters beincluded in such protective arrangements: preservation of rights, privileges, andbenefits under existing collective bargaining agreements; continuation of collectivebargaining rights; protection of employees against worsening of their positions inrelation to their employment; and assurances of employment to employees of acquired mass transportation systems, priority of reemployment to those workerslaid off or terminated, and paid training and retraining programs.
In its grant application, a transit agency must estimate the impact on employeesand specify the protections proposed. FTA forwards the grant application to theDepartment of Labor (DOL), which is authorized to determine and certify whatis fair and equitable. In most cases that do not involve routine replacement ofequipment or facilities, DOL refers the grant application to unions representingtransit employees in the service areas. DOL encourages grant applicants and theaffected unions to develop acceptable employee protections through negotiation.
In December 1995, DOL responded to concerns about the timeliness of the reviewprocess by issuing guidelines that established time frames for processing certifications in an expeditious and predictable manner. The guidelines, which became effective in January 1996, allow a party 15 days to inform the Departmentof objections to the proposed terms of a grant. If no objections are raised or if thoseraised are found to be insufficient, DOL certifies the project. If the Department determines that objections are sufficient, it directs the parties to negotiate andreach an agreement within 30 days. If such an agreement is not reached withinthe allotted time, the Department issues an interim certification that permits FTAto release the funds (provided no action is taken during this period that wouldirreparably harm employees). The guidelines call for a final certification decisionwithin 60 days from the date the grant application is received.
Because Section 13c agreements are the product of individual negotiations,terms vary among agreements. Most, however, include protections againstworsening conditions such that an employee who is displaced or suffers a lossof compensation as a result of a federally assisted project can be eligible for amonthly displacement allowance.
SOURCES: TRB 1995; GAO 2000; U.S. Department of Labor Fact Sheet on Protections forTransit Workers (www.dol.gov).

Public and Private Provision of Transit in the United States 37
systems. Having accounted for about 18 percent of urban travel in the UnitedStates as late as 1950, transit’s share had declined to less than 3 percent by 1975(Pushkarev and Zupan 1977; Altshuler et al. 1979, 21–22). As a result, manytransit agencies were forced to raise fares and seek additional government fund-ing to help cover operating costs. In 1974 Congress passed the National MassTransit Assistance Act, which provided transit agencies with federal aid for op-erating expenses. This funding was used by many agencies to expand service andstabilize or reduce fares in an effort to halt the decline in ridership (Pickrell 1983;Meyer and Gómez-Ibáñez 1981).
During the 1960s and 1970s, the government aid provided to transit agen-cies was accompanied by changing views of transit’s role in urban transporta-tion and the array of services it should encompass. The continued movement ofresidents and jobs to the suburbs meant that most transit systems were com-pelled to extend their services farther from the traditional center cities, ofteninto markets with little demand. Public officials from suburban districts thathelped fund transit systems sought additional service in return for their subsi-dies (Meyer and Gómez-Ibáñez 1981; Wachs 1989 and 1985). At the sametime, transit remained critical for the lower-income residents of inner cities, whohad limited access to automobiles, and for the elderly and those with disabili-ties. Increasingly, transit was viewed as an important means of reducing met-ropolitan air pollution and alleviating highway traffic congestion, promptingmany systems to offer services from distant suburbs into cities and increasinglyfrom suburb to suburb (Meyer and Gómez-Ibáñez 1981).
In amendments to the Urban Mass Transportation Act and other legislationduring the 1970s, the federal government agreed to provide funds for urban andrural demand-responsive transit systems, as well as for alternative forms of pub-lic transportation, such as vanpools and express buses. Before the 1970s, only afew transit authorities and many social service agencies had been offering spe-cialized transportation services for the elderly and riders with disabilities (TRB1998, 3–9). By the end of the 1970s, hundreds of systems were offering such ser-vices with the help of federal funds—both from the U.S. Department of Trans-portation and from human service agencies (Walther 1988). These expandedservices and increased expectations created both pressures and opportunities fortransit systems to seek new methods of service delivery.
Growth of Interest in Private Contracting: 1980s and 1990s
By 1980, transit revenues covered only 41 percent of operating costs, and annualdeficits covered by public subsidy totaled nearly $3.5 billion (Gómez-Ibáñez and

Contracting for Bus and Demand-Responsive Transit Services38
Meyer 1987, 64). Many reasons have been cited for these deficits, such as thecontinuing loss of riders, stable fares during an inflationary period, higher tran-sit administrative and labor expenses, the extension of service to low-densitysuburban markets, and the increasing array of costly services being added in re-sponse to new government mandates and views of transit as a social service(Cervero 1983; Pucher et al. 1983; Lave 1991).
Federal Emphasis on Private Involvement in Public TransitWhatever the cause of operating deficits, by the 1980s they had attracted the at-tention of public officials interested in finding ways to reduce them through thereintroduction of more privately operated services. The Urban Mass Transit Ad-ministration (UMTA) began promoting the idea of contracting with private com-panies for transit operations, vehicle maintenance, and administrative support.The agency predicted that the first-order benefit of contracting would be the useof lower-cost private operators for new services. Furthermore, UMTA officialsanticipated that in spurring competition, contracting would confer second-orderbenefits by prompting public agencies to make their own in-house services moreefficient and responsive to customer needs (Cervero 1988).
UMTA took particular interest in the experiences of small communities inpurchasing transit services, of some larger cities that had been contracting fordemand-responsive services for the elderly and those with disabilities, and of afew very large urban areas that had been contracting for all transit services (Lave1985). The agency funded several studies and concluded that large reductionsin operating costs—from 10 to 50 percent per unit of output—could be ex-pected from competitive contracting (Teal et al. 1987; Morlok and Harker 1988;Cervero 1988). UMTA also pointed to other observed benefits of contracting,such as the greater operating flexibility allowed, including the use of part-timedrivers to meet peak-period demands (Cervero 1988).
The agency demonstrated its commitment to privatization by requiringgrant applicants for discretionary funds to seek out and document private-sector participation in transit service planning and provision. Federal legislationwas cited to support this emphasis. Whereas Section 8(e) of the 1964 UrbanMass Transportation Act (Section 8e) had allowed public transit agencies to con-tract for services, the Surface Transportation Assistance Act of 1982 expresslyrequired federal grant recipients to develop their transit service programs in con-sultation with the private sector. In implementing this statutory provision,UMTA developed guidelines in 1984 calling on grant applicants to demonstratethat they were actively involving the private sector early in the transit planning

Public and Private Provision of Transit in the United States 39
process.7 Under these guidelines—which would remain in place for approxi-mately 10 years—grant applicants were required to consider “fairly and ade-quately” the use of private transportation companies when implementing newservices and to routinely compare public- and private-sector costs for existingservices, submitting documentation of such efforts to the federal agency (Black1991, 70).
State and Local ResponseThe new federal policy was resisted by some state and local governments thatobjected to the federal government’s dictating local practice (Black 1991, 70;Gómez-Ibáñez and Meyer 1987, 65). Many transit agencies were also uncertainabout how such involvement would work in practice, and they questionedwhether it would add more administrative and planning burdens (Black 1991;Teal 1987). Transit labor unions likewise were opposed to the new emphasison privatization (Black 1991, 71).
At the same time, however, the federal promotion of private involvement inpublic transit generated greater interest in contracting among a number of stateand local governments (Black 1991; U.S. Department of Transportation 1986).A few transit agencies in large cities, including Denver and Los Angeles, begancontracting for service on portions of their networks; Denver was required bystate law to contract for transit service.
Throughout the country, many small and rural communities had long con-tracted for transit services, in part because they did not have specialized transitorganizations and because they had routinely contracted for many other gov-ernment services (Teal 1987). According to a national survey conducted in 1985,one-third of demand-responsive services were being contracted to private firms,often to small taxi companies (Teal 1987). Private firms were also running ex-press bus services in many metropolitan areas, including greater Boston, NewYork, Houston, and Chicago (Giuliano and Teal 1985; Smerk 1986).
In some areas of the country, contracting for transit services—especiallyparatransit services—had become commonplace. In certain cases, competitionfor funds among individual units of government put pressure on transit pro-viders to control costs and reduce public subsidies by hiring private operators.In California, for example, substantial funding for transit was generated by the1971 Transportation Development Act (TDA), which extended the state salestax to motor fuels and dedicated one-quarter cent of the state sales tax to trans-portation purposes. Under TDA, funds were distributed back to counties inproportion to their share of state sales taxes. In large, urban counties, TDA

Contracting for Bus and Demand-Responsive Transit Services40
funds were dedicated almost exclusively to transit; in less urbanized counties,however, funds could be used for streets and roads once reasonable transitneeds had been met. In these counties, therefore, the desire to free up TDAfunds for streets and roads motivated some local governments to reduce tran-sit expenditures by contracting for transit services (Teal 1987, 30).8
Advent of Americans with Disabilities Act and Contracting for Demand-Responsive ServicesPassage of the Americans with Disabilities Act of 1990 (ADA), which requiredaccessible fixed-route transit systems and complementary paratransit servicesfor people with disabilities, further expanded the use of contracting for demand-responsive services. As interest in these services grew, many transit agenciesturned to the private sector to provide them, sometimes using brokers to obtainspecialized paratransit services from several private companies in the area. Tran-sit agencies also turned to nonprofit social service agencies, such as councils onaging, to provide specialized transportation for the elderly and people with dis-abilities (Roy P. Drachman Institute 1994).
Federal policies promoting the use of contracting and ADA’s effect in boost-ing demand for paratransit services led to an increase in the amount of transitcontracting from the 1980s to the mid-1990s (Teal 1987; FTA 1994). The U.S.experience in this regard was not atypical. As discussed in Appendix B, severalWestern European countries began contracting with private companies for tran-sit services during the 1980s and early 1990s. Yet as noted in Chapter 1, the totalamount of contracting, measured as a percentage of vehicle revenue-miles, hasremained relatively stable in the United States since the mid-1990s. In a 1994rulemaking, FTA rescinded its earlier guidance on the participation of private en-terprise in the provision of transit.9 Despite objections from private contractors,FTA cited as the main reasons for the recision the significant administrative bur-den associated with following and demonstrating compliance with the federalrules, as well as concerns about the infringement on local and state discretion.
Summary
The provision of transit in the United States began as private enterprise, oftensubject to local and state regulations to ensure sufficient and stable service. Pri-vate operators typically were awarded franchises and were subject to restrictionson the fares they could charge, the services they could offer, and the routes onwhich they could operate. In return, they were offered a degree of protectionfrom competition from other transit operators.

Public and Private Provision of Transit in the United States 41
For numerous reasons—including rising incomes and the emergence ofthe automobile—a decline in the demand for transit services began in theUnited States during the 1920s, accelerating after World War II. Private oper-ators, already unable to attract investment capital in a regulated environmentwith falling demand, found it increasingly difficult to cover operating costs. Bythe 1950s, hundreds of systems were failing or in severe financial distress.
During the 1960s, the federal government stepped in to provide state andlocal governments with capital and planning funds for the acquisition of pri-vate transit systems and new equipment and facilities. By the 1970s, mosturban transit systems in the United States were publicly controlled—eitherowned outright by state and local governments or planned and subsidized bythe public sector. Private operators remained, but mainly to provide contractservices to public transit agencies.
During the 1980s the federal government, pointing to concerns about risingtransit operating costs, promoted the involvement of the private sector in the pro-vision of transit services. Guidelines required federal aid recipients to take proac-tive steps to involve the private sector in both the provision and planning oftransit services, including the use of contracted service. Some state and local gov-ernments, especially in rural areas, had already been using private contracting;however, the federal emphasis prompted additional interest in the practice.
The 1990 Americans with Disabilities Act, which required more transit agen-cies to provide specialized services for people with disabilities, led to furtherincreases in private contracting, especially for demand-responsive services. Dur-ing the past decade, even as transit contracting was becoming more popular inWestern Europe, the U.S. government stopped actively promoting competitivecontracting in public transit. The private sector continues to play a meaningfulrole in the provision of transit services; however, the extent of this role variesfrom system to system.
The historical developments described in this chapter have influenced thelevel and amount of transit contracting practiced today. A more complete pictureof the current state and extent of transit service contracting in the United States,gleaned from the committee’s transit system survey, is provided in Chapter 4.
Notes1. Whether taxicab licensing rules that limit entry and pricing have conferred net
benefits on consumers is a matter of debate that is not considered here.2. Whether such concerns were warranted is a matter of debate. Many economists
have argued that below-cost pricing is difficult to sustain as an exclusionary tac-tic in industries that do not require large capital investments (applicable to the

Contracting for Bus and Demand-Responsive Transit Services42
early hackneys and omnibuses). They argue that even if a firm succeeds in de-pressing competition through such exclusionary (or “predatory”) pricing, once ittries to exploit its acquired market power by raising prices to levels above cost,new firms—seeing the potential to undercut the monopolist’s high prices—canand will enter the market since there is little capital risk to doing so. The would-be monopolist will therefore incur repeated losses through below-cost pricingwith little assurance of preserving a long-run monopoly position. The many rea-sons for transportation regulation and the effects on firms and consumers cannotbe treated adequately in this overview. A more complete review of the history,rationale, and effects of economic regulation in the transportation industries canbe found in Meyer et al. (1959) and more recently in Winston (1998).
3. In 1894, Glasgow was the first large city to take over the electric railway serviceswithin its jurisdiction. By World War I, publicly owned transit systems in WesternEurope carried four times more passengers than private operators (McKay 1988;Jacobson and Tarr 1996).
4. Another exception to the early reliance on private financing of transit in theUnited States was the subway and other rapid rail transit construction projectsin New York, Boston, and a few other cities. Because these projects required mas-sive capital outlays, they were paid for mainly with state and local funds. In mostcases, however, even these large urban railway systems were operated by privatecompanies before World War II.
5. In 1947, the Department of Justice sought an injunction against National CityLines (NCL), which had acquired more than 40 transit systems by 1946. The ac-quisitions were financed largely by suppliers of bus parts and fuel. Jones (1985)and others (see Saltzman 1992) argue that NCL represented mainly an effort byits backing companies to dominate the bus manufacturing industry, ensuringthat abandoned street car services would be replaced with their own buses ratherthan those of competitors.
6. According to Lave (1991, 117), 82 percent of transit agencies with $1 million ormore in annual passenger revenue were still privately owned in 1964.
7. Guidelines were published in the Federal Register in October 1984 (49 CFR 4310)and January 1986 (51 CFR 3306). They were further refined by UMTA in Circu-lars C7010.1 and C7005.1, issued December 5, 1986. As noted later in this chap-ter, FTA rescinded these guidelines in 1994.
8. Since its enactment in 1971, TDA has undergone many changes that, along withother state legislation, have affected the amount and methods of funding for pub-lic transit in the state. Because of these changes, TDA’s effect on transit servicecontracting in California has fluctuated during the past three decades. It is notpossible to recount all the legislative changes and their nuances here. The mainpoint is that state laws and policies have long had a large effect on the amount andpattern of transit service contracting in California, especially in rural areas.
9. In 59 FR 21890 (Final Notice of Recision of Private Enterprise Participation Guid-ance), FTA explains its rationale for the recision and summarizes comments received from parties favoring and objecting to the change.

Public and Private Provision of Transit in the United States 43
ReferencesABBREVIATIONS
APTA American Public Transportation AssociationFTA Federal Transit AdministrationTRB Transportation Research Board
Altshuler, A., J. P. Womack, and J. R. Pucher. 1979. The Urban Transportation Sys-tem: Politics and Policy Innovation, MIT Press, Cambridge, Mass.
APTA. Selected years. Transit Fact Book. Washington, D.C.Black, A. 1991. Privatization of Urban Transit: A Different Perspective. In Trans-
portation Research Record 1297, pp. 69–75.Cervero, R. 1983. Cost and Performance Effects of Transit Operating Subsidies in
the United States. International Journal of Transport Economics 10, 3: 535–562.Cervero, R. 1988. Transit Service Contracting: Cream-Skimming or Deficit-Skimming?
Report DOT-T-89-13, Urban Mass Transportation Administration, Washing-ton, D.C.
FTA. 1994. National Transit Database (data runs provided by Volpe TransportationSystems Center).
Foster, M. S. 1981. From Streetcar to Super Highway: American City Planners andUrban Transportation, 1900–1940. Temple University Press, Philadelphia, Pa.
Gómez-Ibáñez, J. A., and J. R. Meyer. 1987. Going Private: The International Experi-ence with Transport Privatization. The Brookings Institution, Washington, D.C.
Giuliano, G., and R. Teal. 1985. Privately Provided Commuter Bus Services: Expe-riences, Problems, and Prospects. In Urban Transit: The Private Challenge toPublic Transportation (C. A. Lave, ed.), Pacific Institute for Public Policy Re-search, San Francisco, Calif., pp. 49–78.
Hilton, G. W. 1985. The Rise and Fall of Monopolized Transit. In Urban Transit: ThePrivate Challenge to Public Transportation (C. A. Lave, ed.), Pacific Institutefor Public Policy Research, San Francisco, Calif.
Jacobson, C. D., and J. A. Tarr. 1996. Patterns and Policy choices in InfrastructureHistory: The United States, France, and Great Britain. Public Works Manage-ment and Policy, Vol. 1, July, pp. 60–75.
Jones, D. W. 1985. Urban Transit Policy: An Economic and Political History. Prentice-Hall, Inc., Englewood Cliffs, N.J.
Lave, C. A. 1985. Urban Transit: The Private Challenge to Public Transportation. PacificInstitute for Public Policy Research, San Francisco, Calif.
Lave, C. 1991. Measuring the Decline in Transit Productivity in the United States.Transportation Planning and Technology. Vol. 15, No. 2/4, pp. 115–124.
Levinson, H. 1996. Cities, Transportation, and Change. Transportation Quarterly.Vol. 50, No. 4.
Levinson, H. S., and F. H. Wynn. 1963. Effects of Density on Urban TransportationRequirements. In Highway Research Record 2, Highway Research Board, National Research Council, Washington, D.C., pp. 38–64.

Contracting for Bus and Demand-Responsive Transit Services44
McKay, J. P. 1988. Comparative Perspectives on Transit in Europe and the UnitedStates, 1850–1914. In Technology and the Rise of the Networked City in Europeand North America ( J. A. Tarr and G. Dupuy, eds.), Temple University Press,Philadelphia, Pa, pp. 3–21.
Meyer, J. R., M. J. Peck, J. Stenason, and C. Zwick. 1959. The Economics of Competi-tion in the Transportation Industries. Harvard University Press, Cambridge, Mass.
Meyer, J. R., and J. A. Gómez-Ibáñez. 1981. Autos, Transit, and Cities. Harvard Uni-versity Press, Cambridge, Mass.
Meyer, J. R., J. F. Kain, and M. Wohl. 1965. The Urban Transportation Problem.Harvard University Press, Cambridge, Mass.
Middleton, W. D. 1987. The Time of the Trolley: The Street Railway from Horsecar toLight Rail. Golden West Books, San Marino, Calif.
Morlok, E. K., and P. T. Harker. 1988. Privatization of Public Transit: Final Report.Report UMTA-PA-11-0032-88-1, Urban Mass Transportation Administration,Washington, D.C, p. 95.
Pickrell, D. 1983. The Causes of Rising Transit Operating Deficits. Urban Mass Trans-portation Administration, Washington, D.C.
Pucher, J., A. Markstedt, and I. Hirschman. 1983. Impacts of Subsidies on the Costsof Urban Public Transport. Journal of Transport Economics and Policy 17, 2:155–176.
Pushkarev, B. S., and J. M. Zupan. 1977. Public Transportation and Land Use Policy.Indiana University Press, Bloomington.
Pushkarev, B. S., J. M. Zupan, and R. S. Cumella. 1982. Urban Rail in America.Indiana University Press, Bloomington.
Roy P. Drachman Institute. 1994. The Impact of ADA on Special Services Provided byUrban Transit Systems. Federal Transit Administration, Washington, D.C.
Saltzman, A. 1992. Public Transportation in the 20th Century. In Public Transporta-tion, 2nd edition (G. E. Gray and L. A. Hoel, eds.), Prentice Hall, EnglewoodCliffs, N.J., pp. 24–45.
Schrag, Z. M. 2000. The Bus Is Young and Honest: Transportation Politics, Techni-cal Choice, and the Motorization of Manhattan Surface Transit, 1919–1936.Technology and Culture, Vol. 41, No. 1.
Smerk, G. M. 1986. Urban Mass Transportation: From Private to Public to Privati-zation. Transportation Journal, Vol. 26, No. 1. Fall 1986, pp. 83–91.
Smerk, G. M. 1992. Public Transportation and the City. In Public Transportation,2nd edition (G. E. Gray and L. A. Hoel, eds.), Prentice Hall, Englewood Cliffs,N.J., pp. 3–23.
St. Clair, D. J. 1986. The Motorization of American Cities. Praeger, New York.Tarr, J. A., and G. Dupuy. 1988. Technology and the Rise of the Networked City in
Europe and America. Temple University Press, Philadelphia, Pa.Teal, R. F. 1987. Transportation Privatization: Experience and Issues. Urban Re-
sources, Vol. 4, No. 1, pp. 7–12.Teal, R. F., G. Giuliano, E. K. Morlok, and J. M. Golob. 1987. Estimating the Cost Im-
pacts of Transit Service Contracting. Report UMTA-CA-06-0220-1, Urban MassTransportation Administration, Washington, D.C.
Public and Private Provision of Transit in the United States 45
TRB. 1995. Legal Research Digest 4: Transit Labor Protection—A Guide to Section 13(c)of the Federal Transit Act. Transit Cooperative Research Program, NationalResearch Council, Washington, D.C.
TRB. 1998. TCRP Synthesis of Transit Practice 31: Paratransit Contracting and ServiceDelivery Methods. Transit Cooperative Research Program, National ResearchCouncil, Washington, D.C.
TRB. 2001. Special Report 257: Making Transit Work: Insight from Western Europe,Canada, and the United States. National Research Council, Washington, D.C.
U.S. Department of Transportation. 1986. Public-Private Partnerships in Transporta-tion: A Casebook for Local Elected Officials. Washington, D.C.
U.S. General Accounting Office. 2000. Transit Grants: Need for Improved Predictabil-ity, Data, and Monitoring in Application Processing. Report GAO/RCED-00-260,Washington, D.C. (August).
Wachs, M. 1985. The Politicization of Transit Subsidy Policy in America. In Trans-portation and Mobility in the Era of Transition (G. Jansen, P. Nijkamp, and C. Riujgrok, eds.), North Holland, N.Y., pp. 353–366.
Wachs, M. 1989. U.S. Transit Subsidy Policy: In Need of Reform. Science, June,pp. 1545–1549.
Walther, E. 1988. Section 504: Realized Impacts and Projected Impacts. Presented atthe 11th Annual National Conference on Specialized Transportation, Sarasota,Fla. (November).
Warner, S. B. 1978. Streetcar Suburbs: The Process of Growth in Boston, 1870–1900,2nd edition. Harvard University Press, Cambridge, Mass.
Winston, C. 1998. U.S. Industry Adjustment to Economic Deregulation. The Journalof Economic Perspectives, Summer, Vol. 12, No. 3, pp. 89–110.
46
3 Conceptual Framework andPrevious Studies on Contracting
Drawing on the economic literature, this chapter addressesthe factors that influence the decision to contract for tran-sit services. The discussion first provides a conceptual
framework for examining how transit agencies make contractingdecisions. A review of past studies that have explored the effectsof contracting on transit service cost, quality, and safety is thenpresented.
The Contracting Decision: Conceptual Framework
A public transit agency can deliver transit services through oneof two methods: it can provide the service directly using its ownvehicles and personnel, or it can contract with another entity.The choice between these two methods is described in the eco-nomic literature as the “make or buy” decision. To understandhow this decision is made for transit services, it is useful toapply a conceptual framework drawn from two related bodiesof literature—organizational behavior and transaction-cost eco-nomics. The discussion that follows is condensed from Sclar(2000). The intent is to introduce the relevant concepts ratherthan explore them in depth; a selected bibliography from thetwo sets of literature is presented at the end of the chapter forthose wishing further detail.
3

Conceptual Framework and Previous Studies on Contracting 47
Complete and Incomplete Contracts
A contract contains the terms of a relationship between two parties. The con-tract can be a formal, written agreement or implicit and unwritten. It can bestructured in a highly standardized manner, like off-the-shelf computer soft-ware, or it can be tailored to meet specific needs, like a custom-designed com-puter program. A contract can specify delivery on a particular date or describeit in more general terms. Contracts can be for products, for services, or for both.
Contractual relationships are of two basic types—complete and incomplete.Complete contracts are typically drawn up for the supply of a well-defined prod-uct or service to be delivered within a clearly prescribed time frame. Such con-tracts usually involve limited interaction between the contracting parties in an“arm’s length” relationship that is often legalistically defined. The written con-tract delineates all the pertinent obligations and rights of the parties involved.Markets for such products and services are often well established and associatedwith conventional contracting terms. The contractual relationship is thereforeshaped and disciplined largely by the marketplace. If the supplier does not per-form as set forth in the contract, the buyer can opt for another supplier. Becauseof the routine nature of the transaction and the high volume of exchanges, theproduct or service usually has multiple buyers and sellers. If a contractual con-flict cannot be resolved through market mechanisms, the parties can seek reliefthrough the courts.
A contract is incomplete when it is impractical to specify all of the supplier’sresponsibilities under all contingencies. It may be incomplete because aspects ofthe deliverable, such as the quality of service to be provided, cannot be definedor measured precisely. Likewise, there may be uncertainty about other pertinentfactors during the period of the contract. In such situations, the parties often rec-ognize at the outset that the contract terms will be incomplete, so they do not tryto delineate all the issues and conditions that may arise. To avoid an unwieldyand expensive contract, they instead stipulate a means of settling unanticipateddisputes arising from contingencies, such as a method of arbitration.
Public transit agencies are parties to both complete and incomplete contracts.They usually contract for equipment, parts, fuel, and other commodity-like prod-ucts using complete contracts that specify the deliverable and a specific time ofdelivery. When they contract for transit services, however, the contracts often en-tail a certain amount of incompleteness and ambiguity. Some aspects of the ser-vice, such as safety performance and customer service, can be difficult to define

Contracting for Bus and Demand-Responsive Transit Services48
fully and explicitly in a contract document, and of necessity must remain impliedby the transit agency purchasing the service and the contractor supplying it.
Even if the contract terms clearly spell out detailed performance standardsand monitoring functions, it is seldom possible for all aspects of service provisionto be continually observed and evaluated, especially since transit services maybe provided throughout the day, 7 days a week. Because of the practical diffi-culties associated with specifying, monitoring, and enforcing all aspects of ser-vice, public transit managers may place a high value on being able to trust theservice provider.
The Decision To Contract in Light of Transaction Costs
A major reason transit agencies contract for transit services is to derive the ben-efits of market competition. By seeking bids from competing suppliers, anagency hopes to obtain the best combination of price and quality for the pre-scribed service. U.S. transit agencies employ many methods to procure bothgoods and services from other organizations through competitive means. Per-haps the most common are the request for proposals, the invitation for bid, anda two-step process that begins with a request for qualifications from bidders.These methods are described in Box 3-1.1
Savings in operating costs are typically the main reason to contract, as in-dicated by the literature and the results of the committee’s survey (discussed inChapters 4 and 5). In seeking to reduce these costs, a contractor may hire less-expensive labor than would a public agency. Yet there is no guarantee that laborcosts will be lower for contracted than for in-house services. Nevertheless, thetransit agency may still choose to contract for other cost-saving reasons, such asthe ability to use labor and assets more efficiently—for example, by being ableto use part-time drivers and to shift vehicles between public and private serviceduring peak and off-peak times. Because public transit systems face consider-able demand fluctuations throughout the day and week, they can reap signifi-cant benefits from being able to allocate and reallocate resources to matchswings in demand.
Apart from anticipated savings in operating costs, other factors may influ-ence the decision in favor of contracting. The agency may want to shift some ofthe risk of service provision to an outside entity. For instance, one risk of pro-viding a new service in house is that it may prove difficult to modify or withdrawthe service later if such change is essential for budgetary or other reasons. Hencepublic transit managers may place a high value on knowing that they can mod-ify or end the service when the contract expires, especially if in-house operations

B O X 3 - 1
Common Methods of Obtaining Contract Services
Perhaps the most commonly used method of obtaining transit services is therequest for proposal (RFP). Usually the public agency describes the product orservice it is seeking and openly solicits both technical and cost proposals. TheRFP is used when the product or service being sought is complex and difficultto describe in detailed specifications. The RFP typically contains a generaldescription of the desired product or service. Responding contractors thereforehave the opportunity to be creative and convincing about their capabilities. In thecase of an RFP for transit service, the agency may ask the contractor for a technicalproposal that describes its startup plans, transition plans, key managementpersonnel, inspection and maintenance programs, and personnel hiring andretention programs. Likewise, the contractor may be asked for a businessproposal that gives detailed cost assumptions, including expectations about wagerates and other factors that account for the proposed price. Each of the proposalsmay be scored separately, and the agency may then negotiate the specific contractterms with the winner. Thus, price may not be the primary determinant of thewinning proposal—although price typically remains a critical factor.
Another method of competitive procurement is the invitation for bid (IFB);however, this method is used more often for obtaining commonly transactedgoods and less frequently for the provision of services. When the IFB is used, theagency usually has a high degree of certainty about the bid price range because ofthe well-understood nature of the deliverable. The bids are commonly sealed,and the bidders and agency have limited opportunity for communication beforeand during the bid period. Final selection of the contractor is usually based onlow price. Nevertheless, even many IFBs contain language that limits the award tothe lowest “responsive” bidder; that is, the agency may refuse to award thecontract to a low bidder that does not meet minimum levels of licensing,bonding, and financial wherewithal.
A two-step procurement process is sometimes used to limit the pool of respondentsto those that meet certain qualifications. Bidders are prequalified through a requestfor qualifications to ensure technical capabilities; financial capacity; and otherqualifications, such as proper licensing and insurability. The RFP or IFB is issuedas part of the second step only to those contractors that have been approved.Sole-source procurements often occur, but usually for small purchases or in caseswhere a product or service is being sought from another government agency.
Because of the greater number of steps involved, the RFP and two-step methodsusually take longer to complete than an IFB. While the former processes mayentail less specification writing, they typically require more complex evaluation
(continued)

Contracting for Bus and Demand-Responsive Transit Services50
have proven difficult to change. Likewise, the agency may elect to contract inorder to avoid certain administrative costs, such as the time and expense associ-ated with personnel management. In many instances, such anticipated benefitsmay be secondary to savings in operating costs as reasons for contracting, yet forsome agencies, especially smaller ones with limited administrative capabilities,they can be a main motivation for contracting (as indicated by the survey results).
At the same time, a public transit agency must take into account varioustransaction costs associated with contracting. To illustrate the workings of thecompetitive process at its most basic level, economists often posit an idealizedsituation in which both the buyer and seller possess equal and adequate infor-mation with which to make decisions about exchanges they are making. Yeteconomists recognize that fully informed buyers and sellers seldom, if ever, existin practice. For instance, key product qualities may not be apparent to either orboth parties, or these qualities may be difficult to evaluate and measure. Whilethe ideal of complete information is by no means a prerequisite for market trans-actions, shortcomings in information do increase the costs and risks associatedwith exchanges in the marketplace. Consequently, organizations that use themarketplace to accomplish an end must factor in the time and other costs asso-ciated with obtaining necessary information for the transaction.
B O X 3 - 1 (continued)
Common Methods of Obtaining Contract Services
and selection processes, which can slow evaluation and decision making. Still,even the general specifications that accompany RFPs and the selection criteriaapplied are usually well defined to ensure fairness and meet minimum levels ofproposal quality. For instance, the RFP will often describe the basis forpayments (i.e., fixed price or based on costs or output); who is responsible forthe vehicles, equipment, and facilities; who is responsible for scheduling,marketing, and planning; how payments will be made and fare revenuestreated; how much insurance is needed and who will provide it; and even whois responsible for towing vehicles and maintaining radio systems and fare boxequipment. Respondents to the RFP are not expected to propose alternatives tothese specifications, but they may do so if they wish. Agencies choose themethod that best fits their circumstances and that conforms to their ownstatutory requirements, since procurement methods are often governed by stateand local law.
SOURCE: Morgan and Kaiser 1992.

Conceptual Framework and Previous Studies on Contracting 51
To be sure, transit agencies incur transaction costs when they contract outservices. At the outset, an agency encounters administrative expenses in devel-oping requests for proposals, soliciting bids, qualifying bidders, and assessingand awarding contracts. Service disruptions at the start and end of a contract, es-pecially when a contract changes hands, represent another potential cost of con-tracting a service. These costs can be episodic, occurring each time a contract isrebid, although to differing degrees each time.
Furthermore, the contracting agency may bear recurrent costs associatedwith contracting, such as the expense of monitoring contractor performance,handling and resolving contract disputes, and coordinating contractor and in-house services. Many transaction costs can be anticipated and estimated; how-ever, not all transaction costs are quantifiable. For instance, the loss of directcontrol over operations, and even the political ramifications of using contractorsand diverting resources outside the agency, can present management uncertain-ties that are intangible but real costs.
Apart from providing a service directly, one way to reduce some transactioncosts is through a network, or relational, approach to contracting, which is com-mon in the private sector. Private companies often develop ongoing relationshipswith a select set of suppliers that have proven reliable, possess the necessaryequipment and expertise, and are familiar with the buyer’s specialized needs. Al-though the buyer of a service may pay somewhat higher prices by favoring sup-pliers in this way, it may find that overall costs, including transaction costs, arereduced. At the same time, as public entities most transit agencies are subject tolegal and regulatory strictures that govern how they can obtain contracted ser-vices and whether they can employ such a relational approach to contracting.
Transaction-cost analysis provides a framework for understanding the fac-tors that influence the make-or-buy decision. In general, when transaction costsexceed the operating savings from contracting, plus any administrative savings,one would expect the transit agency to choose to operate the service in house.Conversely, when the savings in operating and administrative costs from con-tracting exceed transaction costs, the agency would be expected to contract theservice if this option is available.
Previous Studies of Effects of Transit Contracting
Studies of the effects of contracting for transit services vary significantly in bothscope and approach, and have sometimes been controversial. Much of thisresearch, though not all, has sought to estimate the changes in operating costs

Contracting for Bus and Demand-Responsive Transit Services52
and subsidies for a single transit operator after the initiation of contracting forsome or all service. While many of these studies have been published in schol-arly and peer-reviewed journals, at times they have taken the form of “dueling”studies of a single agency’s contracting experience, commissioned by competi-tors in a debate over contracting.
An area in which past studies have often disagreed is what effects of con-tracting should be measured and how they are best measured. As discussed inthe previous chapter, much of the early research on transit service contractingwas sponsored by the Urban Mass Transit Administration (UMTA) during the1980s (see, for example, Teal 1985; Teal et al. 1987; Morlok and Harker 1988).This research focused largely on the savings in operating costs obtained fromcontracting as compared with direct service provision.
For the most part, other effects of contracting on transit performance—bothpositive and negative—have been viewed as secondary reasons for contractingand have thus received little attention in the literature. Some previous studiesthat have examined other reasons for and outcomes of contracting, such as ef-fects on administrative expenses, service quality, and safety performance, havebeen largely audit-like examinations of contractor records on vehicle accidentsand breakdowns, on-time performance, vehicle inspections, and the like.2
Given the sometimes conflicting findings of competing studies on the ef-fects of transit service contracting on operating costs, the committee chose notto conduct a comprehensive, adjudicative review of the results of this research.Although such a careful review is needed, the focus here is on the approachestaken to examine contracting’s effects on transit costs (both operating and ad-ministrative), service quality, and safety.
Studies on Cost Savings
The early UMTA-sponsored studies revealed that contracting, when accompa-nied by vigorous competition, led to reduced operating costs due to (1) less com-pensation for operating personnel; (2) more flexibility in the use of labor as aresult of fewer work rules and greater ability to use part-time operators; (3) moreefficient vehicle maintenance procedures, such as management of parts inven-tory; and (4) streamlined management and administration cost in general (see,e.g., Black 1991). Most of this early research yielded estimated cost savings onthe order of 10 to 40 percent per unit (e.g., vehicle-mile, vehicle-hour) of con-tracted service, usually in comparison with the costs associated with providingthe service in house. In some of the studies it was postulated that contracting also

Conceptual Framework and Previous Studies on Contracting 53
had the secondary effects of reducing the cost and improving the quality of in-house service provision by compelling transit managers and unions to becomemore flexible, efficient, and responsive to customer needs—although the diffi-culty of obtaining empirical evidence of such effects was noted (see, e.g., Karlaftiset al. 1997).
The authors of one critical study of this early research (Sclar et al. 1989)questioned whether observed cost savings from contracting resulted from con-tractors submitting bid prices below cost to gain an early foothold in a marketor from misjudgment of the true cost of providing the service. Other criticsquestioned the use of comparisons of small single-mode systems and large multi-mode systems to draw conclusions about the cost savings from contracting, aswell as the extrapolation of such findings from one set of systems to another(see, e.g., McCullough et al. 1998).
Although much of the initial research on contracting focused on operatingcosts, some studies have examined other effects of contracting on agency costs.How best to treat transit agency overhead costs when projecting savings fromcontracting has been the subject of much controversy and disagreement. Someof the early UMTA studies estimated that longer-run, “fully allocated” cost sav-ings from contracting could be twice as high as initial savings in variable costsbecause of gradual reductions in transit agency administrative expenses andother overhead items passed along to the contractor.
Critics of such assumptions about savings in overhead costs argue that theyare simplistic, and that the cost-allocation models exaggerate prospective sav-ings because some expenditures on overhead (such as those for system plan-ning, advertising, and marketing) are unavoidable or correlated only weaklywith the actual amount of transit service provided by a transit agency (see Sclarand Watkins 1994). The examples in Box 3-2 illustrate how differing treatmentsof overhead costs have generated markedly different estimates of cost savings.
The early cost-saving studies have been criticized not only for assumingthat contracting would have large effects in reducing overhead costs, but alsofor not anticipating administrative and other costs incurred by contracting. Ex-amples are costs involved in administering contracts; monitoring contractorperformance; and coordinating contractor services with those provided by theagency, as well as other contractors (see Sclar and Watkins 1994).
One study of contracting in Orange County, California, indicated that ad-ministrative and monitoring costs represented about 14 percent of the contractamount (Teal 1990). Likewise, in another study of bus contracting in SanDiego, California, it was estimated that average administrative and monitoring
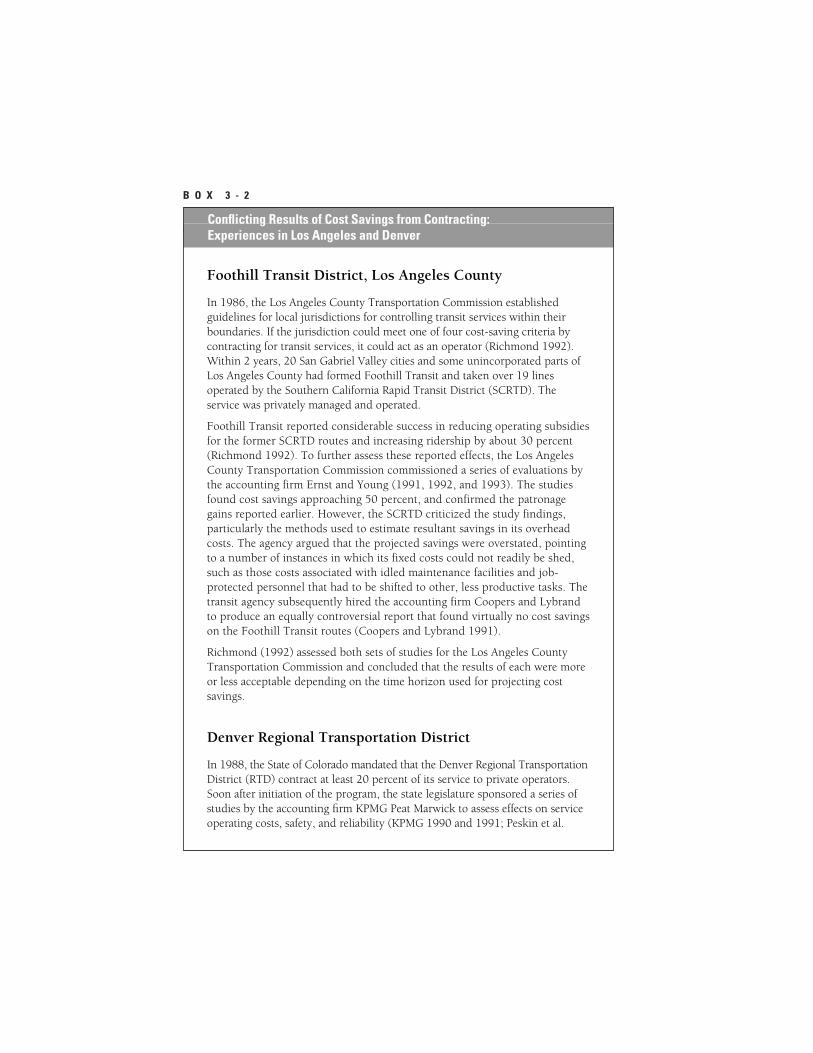
B O X 3 - 2
Conflicting Results of Cost Savings from Contracting: Experiences in Los Angeles and Denver
Foothill Transit District, Los Angeles County
In 1986, the Los Angeles County Transportation Commission establishedguidelines for local jurisdictions for controlling transit services within theirboundaries. If the jurisdiction could meet one of four cost-saving criteria bycontracting for transit services, it could act as an operator (Richmond 1992).Within 2 years, 20 San Gabriel Valley cities and some unincorporated parts ofLos Angeles County had formed Foothill Transit and taken over 19 linesoperated by the Southern California Rapid Transit District (SCRTD). Theservice was privately managed and operated.
Foothill Transit reported considerable success in reducing operating subsidiesfor the former SCRTD routes and increasing ridership by about 30 percent(Richmond 1992). To further assess these reported effects, the Los AngelesCounty Transportation Commission commissioned a series of evaluations bythe accounting firm Ernst and Young (1991, 1992, and 1993). The studiesfound cost savings approaching 50 percent, and confirmed the patronagegains reported earlier. However, the SCRTD criticized the study findings,particularly the methods used to estimate resultant savings in its overheadcosts. The agency argued that the projected savings were overstated, pointingto a number of instances in which its fixed costs could not readily be shed,such as those costs associated with idled maintenance facilities and job-protected personnel that had to be shifted to other, less productive tasks. Thetransit agency subsequently hired the accounting firm Coopers and Lybrandto produce an equally controversial report that found virtually no cost savingson the Foothill Transit routes (Coopers and Lybrand 1991).
Richmond (1992) assessed both sets of studies for the Los Angeles CountyTransportation Commission and concluded that the results of each were moreor less acceptable depending on the time horizon used for projecting costsavings.
Denver Regional Transportation District
In 1988, the State of Colorado mandated that the Denver Regional TransportationDistrict (RTD) contract at least 20 percent of its service to private operators.Soon after initiation of the program, the state legislature sponsored a series ofstudies by the accounting firm KPMG Peat Marwick to assess effects on serviceoperating costs, safety, and reliability (KPMG 1990 and 1991; Peskin et al.

Conflicting Results of Cost Savings from Contracting:Experiences in Los Angeles and Denver
Conceptual Framework and Previous Studies on Contracting 55
costs were $0.10 to $0.25 per vehicle-mile (Hurwitz 1995). For the most part,however, the research in this area has been scant, in part because many of theassociated costs can be difficult to isolate and quantify.
More sophisticated cross-sectional and time-series studies of effects onagency overhead costs—controlling for the influence of many factors apart fromcontracting—would be helpful. However, such studies would require the ap-plication of considerable judgment in the allocation of costs, as well as sufficienttime and data from many transit agencies. As noted above, most previousstudies of savings from contracting have been conducted over very short timeperiods—1 or 2 years—and for a single or only a few systems.
B O X 3 - 2 (continued)
1992). The auditors found that in the second full year of the program, thecontractor prices were 12.5 percent lower than the costs incurred by RTD inproviding similar service directly, not including projected savings in overhead.When such fully allocated cost projections were included, the savings morethan doubled—although the analysts preparing the study noted that some ofthe fixed-cost savings would take many years to appear.
The KPMG studies revealed no consistent difference between RTD’s direct andcontracted operations with respect to accident rates and severity, on-timeperformance, maintenance reliability, and complaints and commendations.The contractors, however, were found to have higher rates of employeeturnover than RTD, explainable in part by lower worker compensation. TheKPMG auditors also concluded that the private operators had earned little, ifany, profits in the first 2 years, and questioned whether the original bids hadbeen set low to “get a foot in the door” in the Denver market (Peskin et al.1992). A critic disputed the claims of lasting savings in Denver; for instance,Sclar (1997, 2000) argued that Denver’s contracting costs per revenue vehicle-hour had exceeded the costs incurred on directly operated routes. Hemaintained that the market for competitive bidders had never materialized inDenver, and that three large firms had captured the market (Sclar 1997).
The Denver RTD (2001) recently released its own analysis of its experiencewith contracting in Denver during the past 10 years. The agency estimates thatit saved a total of $40 million through the use of private contractors from 1991to 1999, including $7.8 million in 1999.
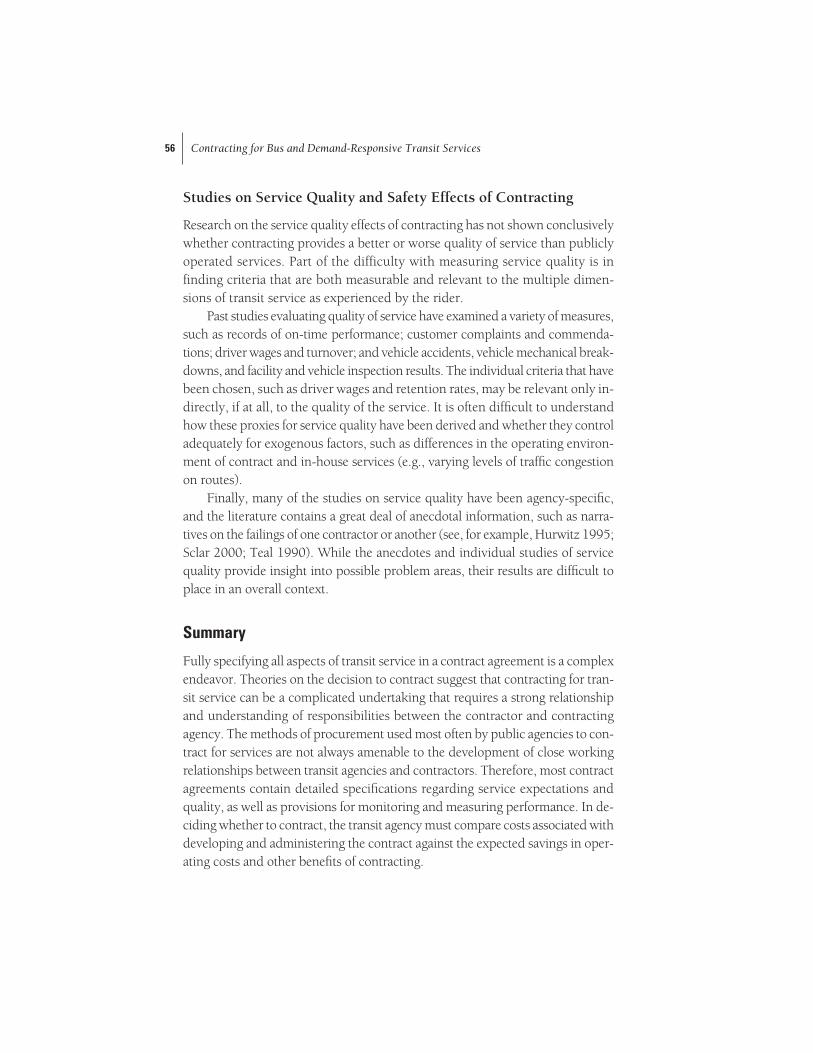
Contracting for Bus and Demand-Responsive Transit Services56
Studies on Service Quality and Safety Effects of Contracting
Research on the service quality effects of contracting has not shown conclusivelywhether contracting provides a better or worse quality of service than publiclyoperated services. Part of the difficulty with measuring service quality is infinding criteria that are both measurable and relevant to the multiple dimen-sions of transit service as experienced by the rider.
Past studies evaluating quality of service have examined a variety of measures,such as records of on-time performance; customer complaints and commenda-tions; driver wages and turnover; and vehicle accidents, vehicle mechanical break-downs, and facility and vehicle inspection results. The individual criteria that havebeen chosen, such as driver wages and retention rates, may be relevant only in-directly, if at all, to the quality of the service. It is often difficult to understandhow these proxies for service quality have been derived and whether they controladequately for exogenous factors, such as differences in the operating environ-ment of contract and in-house services (e.g., varying levels of traffic congestionon routes).
Finally, many of the studies on service quality have been agency-specific,and the literature contains a great deal of anecdotal information, such as narra-tives on the failings of one contractor or another (see, for example, Hurwitz 1995;Sclar 2000; Teal 1990). While the anecdotes and individual studies of servicequality provide insight into possible problem areas, their results are difficult toplace in an overall context.
Summary
Fully specifying all aspects of transit service in a contract agreement is a complexendeavor. Theories on the decision to contract suggest that contracting for tran-sit service can be a complicated undertaking that requires a strong relationshipand understanding of responsibilities between the contractor and contractingagency. The methods of procurement used most often by public agencies to con-tract for services are not always amenable to the development of close workingrelationships between transit agencies and contractors. Therefore, most contractagreements contain detailed specifications regarding service expectations andquality, as well as provisions for monitoring and measuring performance. In de-ciding whether to contract, the transit agency must compare costs associated withdeveloping and administering the contract against the expected savings in oper-ating costs and other benefits of contracting.

Conceptual Framework and Previous Studies on Contracting 57
Past studies on contracting effects have focused primarily on savings in operating costs, and most have found such savings. Effects on administrativecosts have received less attention. Because most studies have focused on the ex-periences of individual agencies over relatively short time horizons, it is difficultto reach general conclusions about overall effects. Extrapolation is especiallyproblematic for examining the impacts of contracting on service quality andsafety, areas in which studies of individual experiences have had mixed results,and the criteria for measuring quality have often varied widely.
Given the focus of most previous transit contracting research on changesin operating costs, the relative dearth of cross-sectional studies on the natureand extent of contracting, and the fact that most of the research on transit con-tracting was completed a decade or more ago, the committee chose to conducta comprehensive survey of the state of transit service contracting in the UnitedStates today. It is to the results of this survey that the discussion turns in thenext two chapters.
Notes1. Although competitive procurement methods are often required by law, other,
noncompetitive methods are sometimes used to obtain transit services, includ-ing periodic renegotiation with an incumbent contractor, which is essentially asole-source procurement.
2. Notable exceptions include Goldstein and Luger (1990), who surveyed transitagencies to determine the factors affecting contracting decisions other than operating cost savings, and Richmond (2001), who examined the role of politicsin motivating contracting decisions in five U.S. cities.
ReferencesABBREVIATIONS
TRB Transportation Research BoardUMTA Urban Mass Transportation Administration
Black, A. 1991. Privatization of Urban Transit: A Different Perspective. In Trans-portation Research Record 1297, TRB, National Research Council, Washington,D.C., pp. 69–72.
Coopers and Lybrand. 1991. RTD/Foothill Zone. A Review of the Marginal CostAnalysis Approach. Prepared for the Southern California Rapid Transit Dis-trict, July.
Denver Regional Transportation District. 2001. Analysis of Private Contractor BusService Costs.

Contracting for Bus and Demand-Responsive Transit Services58
Ernst and Young. 1991. Evaluation of Foothill Transit Zone: Fiscal Year 1990. Reportto the Los Angeles County Transportation Commission, July.
Ernst and Young. 1992. Phase II, Fiscal Year 1991 Evaluation of Foothill Transit Zone.Report prepared for the Los Angeles County Transportation Commission, June.
Ernst and Young. 1993. Phase III, Fiscal Year 1992 Evaluation of Foothill TransitZone. Report prepared for the Los Angeles County Transportation Commis-sion, Sept.
Goldstein, H. A., and M. I. Luger 1990. The Determinants of the Decision To ContractOut Public Transit Services. In Public Policy and Transit System Management(G. M. Guess, ed.), Greenwood Press, New York.
Hurwitz, E. 1995. Competitive Contracting of Public Transit Services in San Diego.Presented to the Western Regional Science Association, Feb. 22.
Karlaftis, M. G., J. S. Wasson, and E. S. Steadham. 1997. Impacts of Privatization onthe Performance of Urban Transit Systems (Indianapolis). TransportationQuarterly, Vol. 51, No, 3, Summer, pp. 67–79.
KPMG Peat Marwick. 1990. Performance Audit of Privatization of RTD Services. Re-vised Final Report. Regional Transportation District, Denver, Colorado, Dec.
KPMG Peat Marwick. 1991. Denver RTD Privatization Performance Audit Update:July 1990 to June 1991. Final Report, Regional Transportation District, Denver,Colorado, Nov.
McCullough, W. S. III, B. D. Taylor, and M. Wachs. 1998. Transit Service Con-tracting and Cost-Efficiency. In Transportation Research Record 1618, TRB,National Research Council, Washington, D.C., pp. 69–77.
Morgan, H., and R. Kaiser. 1992. Competitive Contracting for Transit Services: AnOverview. Taxi and Livery Management, Vol. 4, No. 4.
Morlok, E. K., and P. T. Harker. 1988. Privatization of Public Transit: Final Report.UMTA-PA-11-0032-88-1, Urban Mass Transportation Administration, Wash-ington, D.C., pp. 95.
Peskin, R. L., Mundle, S. R., and Buhrer, S. D. 1992. Transit Privatization in Den-ver: Experience in the First Year. In Transportation Research Record 1349, TRB,National Research Council, Washington, D.C., pp. 75–84.
Richmond, J. 1992. The Costs of Contracted Service: An Assessment of Assessments.Advisory paper for Los Angeles County Supervisor Michael Antonovich, July.
Richmond, J. 2001. The Private Provision of Public Transport. A. Alfred Taubman Cen-ter, John F. Kennedy School of Government, Harvard University, Cambridge,Mass.
Sclar, E. D. 1997. Paying More, Getting Less: The Denver Experience with Bus Privati-zation, 1990–1995. Prepared for the Amalgamated Transit Union.
Sclar, E. D. 2000. You Don’t Always Get What You Pay For: The Economics of Privati-zation. Cornell University Press, Ithaca, N.Y.
Sclar, E. D., K. H. Schaeffer, and R. Branwein. 1989. The Emperor’s New Clothes: Tran-sit Privatization and Public Policy. Economic Policy Institute, Washington, D.C.
Sclar, E. D., and M. Watkins. 1994. Urban Bus Transit Privatization (in Canada):A Look at the Record. Prepared for the Amalgamated Transit Union, AFL–CIO.

Conceptual Framework and Previous Studies on Contracting 59
Teal, R. F. 1985. Transit Service Contracting: Experiences and Issues. In Trans-portation Research Record 1036, TRB, National Research Council, Washington,D.C., pp. 28–36.
Teal, R. F. 1990. Issues Raised by Competitive Contracting of Bus Transit in theU.S.A. PTI Journal, Vol. 4.
Teal, R. F., G. Giuliano, E. K. Morlok, and J. M. Golob. 1987. Estimating the CostImpacts of Transit Service Contracting. UMTA-CA-06-0220-1, Urban MassTransportation Administration, Washington, D.C.
Selected BibliographyContracting and Transaction Cost Theory
Deakin, S. and Michie, J. 1997. The Theory and Practice of Contracting. In Con-tracts, Cooperation, and Competition: Studies in Economic Management and Law,Oxford University Press, Oxford, United Kingdom, pp. 1–39.
Hart, O. 1995. Firms, Contracts, and Financial Structure. Clarendon Press, Oxford,United Kingdom.
Holmstrom, B., and J. Roberts. 1998. The Boundaries of the Firm Revisited. The Jour-nal of Economic Perspectives, Fall, Vol. 12, No. 4.
Macneil, I. 1974. Contracts: Adjustment of Long-Term Economic Relations UnderClassical, Neoclassical, and Relational Contract Law. Northwestern UniversityLaw Review, Vol. 72. pp. 854–905.
Maness, R. 1996. Incomplete Contracts and the Choice Between Vertical Integrationand Incentives in Franchising. Journal of Economic Behavior and Organization,Vol. 32, pp. 101–115.
Menard, C. 1995. Markets as Institutions Versus Organizations as Markets? Dis-entangling Some Fundamental Issues. Journal of Economics Behavior and Organization, Vol. 28, pp. 161–82.
Milgrom, P., and J. Roberts. 1992. Economics Organization and Management, Prentice-Hall, Englewood Cliffs, N.J.
North, D. 1984. Transaction Costs, Institutions, and Economic History. Journal ofInstitutional and Theoretical Economics, Vol. 140, March, pp. 7–17.
Selanie, B. 1998. The Economics of Contracts: A Primer. The MIT Press, Cambridge,Mass.
Williamson, O. 1979. Transaction-Cost Economics: The Governance of ContractualRelations. Journal of Law and Economics, Vol. 22, pp. 233–271.
Williamson, O. 1985. The Economic Institutions of Capitalism. The Free Press, New York.
Contracting Experiences Generally and in Specific U.S. Locations
Echols, J. C. 1985. Use of Private Companies To Provide Public Transportation Ser-vices in Tidewater, Virginia. In Urban Transit: The Private Challenge to PublicTransportation (C. A. Lave, ed.). Ballinger, Cambridge, Mass.

Contracting for Bus and Demand-Responsive Transit Services60
Lave, R., R. Teal, and G. Cross. 1986. The Use of Contracting by Public Transit Agen-cies in California. CA/DMT/UMTA-9/86/153, SYSTAN, Inc., Los Altos, Calif.
Mansbridge, J. 1988. Service Expansion Plan Evaluation. Report to the Board ofCommissioners of the Regional Transit Authority (New Orleans), Aug.
McCullough, W. S. 1997. Transit Service Contracting and Cost Efficiency. Master’sthesis (unpublished), School of Public Policy and Social Research, Universityof California, Los Angeles.
O’ Leary, J. 1993. Comparing Public and Private Bus Transit Services: A Study of the Los Angeles Foothill Transit Zone. Policy Study 163. Reason Foundation,Los Angeles, Calif., July.
Price Waterhouse. 1989. Metro-Dade Transit Agency: Private Enterprise ParticipationProgram Evaluation—Six Month Report.
Talley, W. K. 1990. A Cost Analysis of the Tidewater Transportation District Commis-sion, Prepared for the Tidewater District Commission.
UMTA. 1990. Transit Contracting Services Study (Transit Privatization), Phase 1:Final Report. UMTA-NY-08-0119-90-1, Niagara Frontier Transportation Authority, Buffalo, N.Y.
Viton, P. A. Evaluating the Feasibility and Desirability of Transit Deregulations: Vol-ume 1. UMTA-OH-11-0007-88-1, Urban Mass Transportation Administration,Washington, D.C.
Webster, B. A. 1988. Dallas Area Rapid Transit Service Privatization: A Summary ofBenefits/Risks for Transit Providers. UMTA-TX-08-0253-88-1, Urban MassTransportation Administration, Washington, D.C.

4
61
Transit Service Contracting in the UnitedStates: Extent and Practice
As discussed in Chapter 1, the conduct and analysis of anationwide survey of transit systems formed a majorpart of this study. This chapter describes the survey and
its coverage, and reviews those results that indicate the extentand practice of transit service contracting in the United States.
Survey Design and Method
FTA collects information on purchased transportation as part ofthe National Transit Database (NTD). Recipients of federal tran-sit grants must report how much transportation they purchasefrom outside entities for each mode by dollar amount and quan-tity of services supplied (such as peak vehicles, vehicle-hours,and vehicle-miles). The NTD shows general trends and overallpatterns in purchased transportation, as noted in Chapter 1. Yetit does not reveal program- or contract-level details, nor does itoffer insight on the reasons for contracting and its results. Thecommittee designed its survey to obtain both quantitative andqualitative information.
FTA furnished a list of 502 public transportation systemsfrom 50 states and the District of Columbia that report to theNTD. These systems provide a mix of transit services. Most offerfixed-route bus or demand-responsive services or both. Many ofthe larger systems provide other services as well, such as rail
4

Contracting for Bus and Demand-Responsive Transit Services62
transit. A small number do not offer bus or demand-responsive services, butspecialize in commuter rail, vanpool, or ferryboat operations.
The survey was mailed in November 2000 to the top executives of each ofthe 502 systems, accompanied by a letter from the committee chair explainingthe purpose of the survey and urging participation; stamped return envelopeswere also provided.1 The chair mailed a follow-on letter to recipients in January2001. Appendix B contains facsimiles of the original cover letter and survey,along with a listing of the recipients and respondents (as of March 15, 2001).
As noted in Chapter 1, the survey consisted of two parts. General man-agers were asked to forward Part 1 to the members of their staffs most familiarwith service contracts. This part asked general questions about the kinds of ser-vices provided by the agency and its overall use of contracting. It also includeddetailed questions about the terms and structure of individual contracts andthe history of contractor changes and bid activity. Because the four-digit FTAdesignator for each grant recipient surveyed was available, it was possible tocross-reference the most recent NTD reports (1998) as needed. Since some ofthe smallest systems (those operating fewer than 10 vehicles) do not report an-nually to the NTD, however, these systems were asked to provide NTD data intheir response, including current fleet size (maximum vehicles in service) andmost recent annual ridership and operating expenditures.
Each agency was asked to report whether it now contracts for any publictransit services. All systems surveyed, whether they answered “yes” or “no” to thisquestion, were requested to return the survey. Those answering “yes” were askedmore detailed questions on up to four specific contracts: their two largest for fixed-route bus service and their two largest for demand-responsive paratransit services.For each contracted service, information was requested about the length of thecontract; basis of payment; treatment of fare revenues; use of performance incen-tives and penalties; and parties responsible for the provision of vehicles, facilities,and equipment. Respondents were also asked to describe each contractor—whether publicly owned, private, or not-for-profit—and to indicate whetherthe services provided in the contract had replaced a directly operated service,created a new service, or succeeded a previously contracted service.
Additional information was sought on experience in obtaining the con-tracted services, particularly for bidding contracts. For each reported contract,respondents were asked to identify the year the current contract was awarded,the number of bidders for the current award, the number of bidders the last timethe contract was awarded, the number of times the contract had been rebid,and the number of times the service contractor had changed.

Transit Service Contracting in the United States: Extent and Practice 63
The general managers were asked to complete the perceptual questions inPart 2 of the survey, which addressed the rationale for contracting and the out-comes of contracting programs. This part also solicited from the general mangersadvice on how to make contracting work better. The results from this part of thesurvey are discussed in more detail in Chapter 5.
Survey Coverage and Representation
Of the 502 transit systems surveyed, more than half—259—returned Part 1(the contract staff survey), while 237 returned Part 2 (the general manager sur-vey). Most of the systems that returned one part of the survey also returned theother: 233 returned both parts; 26 returned Part 1 only; and 4 returned Part 2only. Figure 4-1 shows the response rates (respondents as a percentage of re-cipients) for Parts 1 and 2 by system size.
The survey respondents are comparable in composition to federal grant re-cipients as a whole. The 259 Part 1 respondents—the focus of this chapter—form a large and diverse group. Systems of all sizes responded in close proportionto their overall numbers (see Figure 4-2). About 60 percent are relatively smallsystems, operating fleets of 50 or fewer vehicles (in maximum service); this per-centage is similar to the share of small systems that reported to the 1998 NTD.The large systems (those operating fleets of more than 250 vehicles) had the high-est response rate; hence these systems represent a slightly higher share of the sur-vey respondents than of reporters to the NTD. Eight of the country’s 10 largestbus systems (by fleet size) and 17 of the top 25 returned the survey.
The respondents consist of regional and local authorities that specialize intransit, municipal and county departments of public works, and state agenciesthat receive federal transit aid. The pattern of respondents by agency type is quiteclose to that of all federal grant recipients (see Figure 4-3). The respondents arewell distributed geographically, with their geographic distribution being com-parable to that of all federal grant recipients (see Figure 4-4), although a slightlydisproportionate number are from the Pacific Southwest—the FTA region con-sisting of Arizona, California, Hawaii, and Nevada. Information on the numberof respondents by region and the states that make up each region is provided inAppendix B.
As a group, the 259 Part 1 respondents represent about half of all of federalgrant recipients reporting in the 1998 NTD. Moreover, they account for about55 percent of all bus and demand-responsive vehicles in service and for similarshares of total vehicle-miles and vehicle-hours in revenue service (see Table 4-1).
(text continues on page 68)

FI
GU
RE
4
-1
Resp
onse
rate
s by t
rans
it sy
stem
size
for P
arts
1 a
nd 2
of t
he su
rvey
.

FI
GU
RE
4
-2
Dist
ribut
ion
of P
art 1
surv
ey re
spon
dent
s by t
rans
it sy
stem
size
, com
pare
d w
ith d
istrib
utio
n of
all
fede
ral
gran
t rec
ipie
nts s
urve
yed.

FI
GU
RE
4
-3
Dist
ribut
ion
of P
art 1
surv
ey re
spon
dent
s by a
genc
y typ
e, co
mpa
red
with
dis
tribu
tion
of a
ll fe
dera
lgr
ant r
ecip
ient
s sur
veye
d.
Contracting for Bus and Demand-Responsive Transit Services66
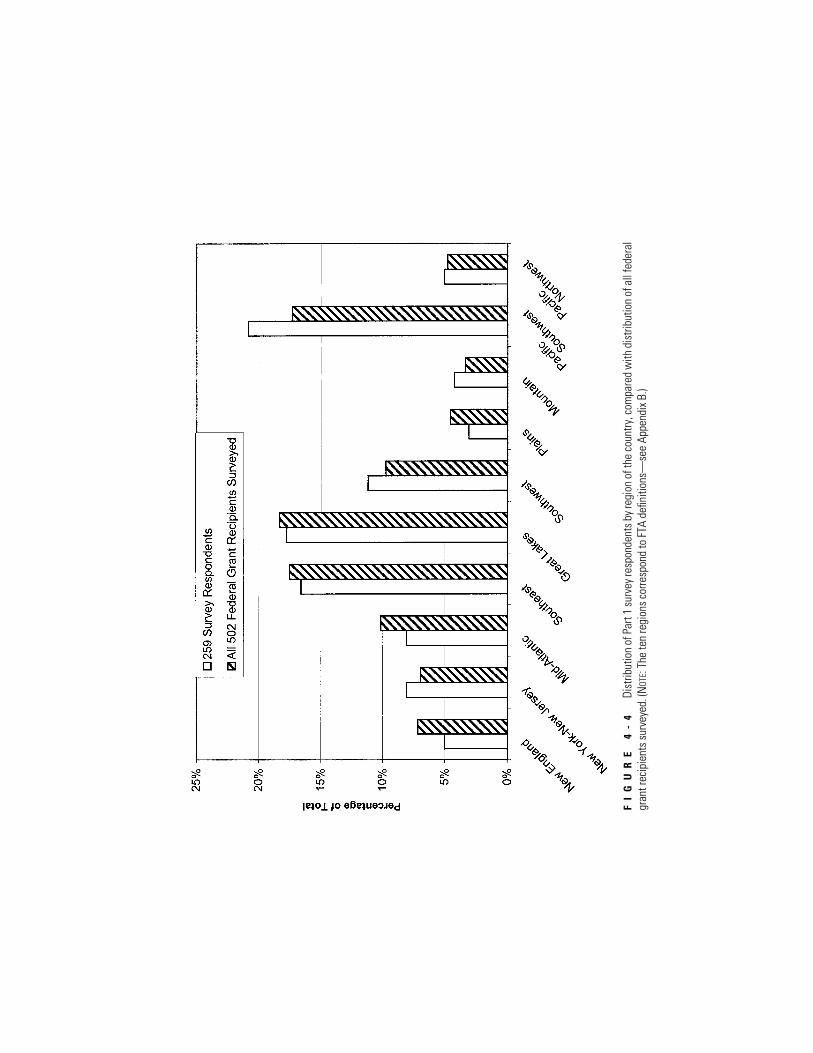
FI
GU
RE
4
-4
Dist
ribut
ion
of P
art 1
surv
ey re
spon
dent
s by r
egio
n of
the
coun
try, c
ompa
red
with
dis
tribu
tion
of a
ll fe
dera
lgr
ant r
ecip
ient
s sur
veye
d. (N
OTE:
The
ten
regi
ons c
orre
spon
d to
FTA
defin
ition
s—se
e Ap
pend
ix B
.)

Contracting for Bus and Demand-Responsive Transit Services68
T A B L E 4 - 1
Part 1 Survey Respondents’ Share of Total Fixed-Route Bus and Demand-Responsive Vehicles, Revenue-Miles, Revenue-Hours, and Operating Expenses Reported in 1998 National Transit Database
Service Respondents’ Percentage of Total
Fixed-Route BusTotal Vehicles (Maximum in Service) 59.4Vehicle Revenue-Miles 59.3Vehicle Revenue-Hours 59.5Total Operating Expenses 62.4
Demand-ResponsiveTotal Vehicles (Maximum in Service) 45.2Vehicle Revenue-Miles 45.7Vehicle Revenue-Hours 44.4Total Operating Expenses 49.0
TotalTotal Vehicles (Maximum in Service) 55.8Vehicle Revenue-Miles 56.7Vehicle Revenue-Hours 56.9Total Operating Expenses 61.1
NOTE: The 1998 National Transit Database was the most recent available at the time of the analysis.SOURCE: 1998 National Transit Database, Federal Transit Administration.
According to the 1998 NTD, the 259 survey respondents as a group contractfor a smaller proportion of their transit services than those systems not re-sponding to the survey (see Table 4-2). This may be attributable to the fact thatthe survey respondents include most of the country’s largest transit systems.While many of these systems do contract for transit services, the total amountof service for which they contract is typically small relative to their overall op-erations. Altogether, the 259 respondents are responsible for half the purchasedtransportation reported in the 1998 NTD.
Overall, the survey respondents are broadly representative of systems re-ceiving federal aid. Their responses are therefore highly informative about theextent of contracting by federal aid recipients today, how that contracting ispracticed, and what the competitive landscape for contracts looks like.
The results of Part 1 of the survey are examined next, often with referenceto cross-tabulations of the responses to more than one question. Tabulations ofresponses to individual Part 1 survey questions are provided Appendix C.

Transit Service Contracting in the United States: Extent and Practice 69
Extent of Transit Contracting
Of the 259 Part 1 respondents, 156, or about 60 percent, reported having con-tracts for transit service, and the remaining 103 reported not contracting at all.About one-third of those that contract—57 of 156—do so for all their services(see Figure 4-5); the other 99 have contracts for only some of their services.
Because information was requested on each agency’s largest contracts only,the survey results do not reveal how much contracting takes place in individ-ual systems relative to their total operations. Hence the amount of service con-tracted by each of the 99 systems that reported “some” (but not all) contractedservices may vary widely—from as little as 1 percent of total service to as much99 percent. To gain a better understanding of the amount of contracting thatoccurs, the survey results were cross-referenced with data on purchased trans-portation from the 1998 NTD, which included information for 89 of the 99 systems reporting “some” contracting in the survey. According to these data,about 30 percent of these 89 systems contract for more than 25 percent (butless than 100 percent) of their revenue vehicle-miles, 45 percent contract for11 to 25 percent, and the remaining 25 percent contract for 10 percent or less.
T A B L E 4 - 2
Part 1 Survey Respondents’ Use of Purchased (Contracted) Services for Fixed-Route Bus and Demand-Responsive Services, 1998 National Transit Database
TotalVehicles in Vehicle Vehicle Total Maximum Revenue- Revenue- Operating
Survey Respondents Service Miles Hours Expenses
Percentage of Bus Service Purchased 6.7 6.7 5.3 4.4Percentage of Demand-Responsive 74.7 70.5 70.6 69.2
Service PurchasedPercentage of All Transit Service 20.4 16.5 14.0 9.4
Purchased
Systems Not Participating in Survey
Percentage of Bus Service Purchased 8.3 7.9 6.5 7.4Percentage of Demand-Responsive 67.2 63.8 63.8 62.2
Service PurchasedPercentage of All Transit Service 26.5 21.3 21.3 14.4
Purchased
SOURCE: 1998 National Transit Database, Federal Transit Administration.

Contracting for Bus and Demand-Responsive Transit Services70
Taken together, the survey results and NTD data suggest that of the systemsthat contract for some service, most do so for more than 10 percent of total ser-vice, but relatively few do so for more than 25 percent (see Figure 4-6).
The survey results and NTD data suggest further differences in the inci-dence of contracting by system size, type of service, agency type, and region.These differences are discussed next.
System Size
About half (75) of the 156 respondents that reported use of contracting are fromsmall systems with fewer than 50 fixed-route bus and demand-responsive ve-hicles in maximum service. About 30 percent (45) are from medium-sized sys-tems with 50 to 249 vehicles. Large systems with 250 or more vehicles accountfor about 20 percent (34) of respondents (see Figure 4-7). (System size couldnot be determined for 2 respondents.)
Small systems make up a large share of those that contract, primarily becausethey account for about 60 percent of all transit systems. Yet small systems reportedcontracting less often than large systems in relation to their overall numbers.
F I G U R E 4 - 5 Percentage of Part 1 survey respondents that contract for all, some, and notransit services (total respondents = 259).

F I G U R E 4 - 6 Share of transit systems that contract all, some, and no services (as estimatedusing Part 1 survey results augmented by NTD data).
F I G U R E 4 - 7 Distribution of Part 1 survey respondents that reported contracting by system size.

Contracting for Bus and Demand-Responsive Transit Services72
More than three-quarters of the responding medium-sized and large systemscontract for at least some service, compared with half of small systems, eventhough the latter represent 60 percent of all transit systems. It appears that largersystems are likely to do at least some contracting because they offer a largeamount of service and have more opportunity to engage in the practice. Estimatesbased on the survey results and NTD data indicate that nearly two-thirds ofmedium-sized and more than half of large systems contract for more than 10 per-cent of their services (see Figure 4-8). By comparison, about 45 percent of smallsystems contract for more than 10 percent of their services.
On the other hand, small systems are much more likely than larger ones tocontract for all their services. Among small systems, nearly 30 percent (43 of153) reported contracting for all services, as compared with not quite 20 per-cent (11 of 58) of medium-sized systems and about 5 percent (2 of 43) of largesystems (see Figure 4-9).
The survey findings, supplemented with information from the NTD, indi-cate that small systems are less likely to engage in contracting than larger ones,but when they do contract they are more likely to do so for all their services.
F I G U R E 4 - 8 Percentage of large, medium-sized, and small transit systems that contractfor all, some, and none of their transit services (as estimated from Part 1 survey results augmented by1998 NTD data).

FI
GU
RE
4
-9
Shar
e of
Par
t 1 su
rvey
resp
onde
nts t
hat c
ontra
ct fo
r all
serv
ices
, by s
yste
m si
ze.

Contracting for Bus and Demand-Responsive Transit Services74
Moreover, a majority of medium-sized and large systems contract for morethan 10 percent of their services.
Service Type
Demand-responsive services are much more likely than bus services to be con-tracted out. Of the 271 survey respondents reporting demand-responsive ser-vices (188 ADA and 83 dial-a-ride), about two-thirds (192) contract for someof these services, and more than half (157) contract for all of them. Likewise,more than 85 percent (71 of 83) of the dial-a-ride systems reported some con-tracted services, with more than two-thirds contracting for all services. By com-parison, only about 40 percent (82 of 203) of the bus systems contract for someservices. Estimates using NTD data suggest that more than 60 percent of sys-tems with demand-responsive services contract out more than 25 percent ofthese services (see Figure 4-10), whereas only 30 percent of systems with busservices contract out more than 25 percent of these services.
F I G U R E 4 - 1 0 Share of transit services contracted, by service type (as estimated fromPart 1 survey results augmented by 1998 NTD data).

Transit Service Contracting in the United States: Extent and Practice 75
A majority of both small systems (53 percent) and larger (both medium-sized and large) systems (63 percent) contract for all of their demand-responsiveservices. Yet small systems are more likely than larger ones (33 percent comparedwith 14 percent) to contract for all their bus services.
Agency Type
Agency type—whether a state or regional transit authority or a county or cityagency—is correlated with both the likelihood and the level of contracting, butin different directions. About two-thirds of the state and regional transit agenciesthat responded to the survey have contracts for service. They are more likely tocontract than city and county agencies, only half of which reported having con-tracts (see Figure 4-11). However, when city and county agencies do contract,they are much more likely than state and regional transit agencies to do so for all
F I G U R E 4 - 1 1 Proportion of Part 1 survey respondents that contract for all and for someor all services, by agency type.

Contracting for Bus and Demand-Responsive Transit Services76
their services. About one-quarter of these types of agencies responding to the sur-vey contract for all their services (accounting for about half of those city andcounty agencies that have contracts). By comparison, fewer than 15 percent ofregional and state transit agencies contract for all their services, despite the factthat two-thirds have at least some contracts.
Region
Figure 4-12 shows the percentage of systems that contract for all their services,by region. The responses suggest that systems in the Pacific Southwest region aremuch more likely to contract for all their services. Indeed, such is the case formore than half the systems that do contract in this region. A possible explana-tion for this finding is that the rules governing California’s financing of publictransit (as discussed in Chapter 2) encourage contracting.
Contract Terms and Provisions
The 156 contracting systems reported information for 277 contracts: 98 for busservice, 170 for demand-responsive (ADA and dial-a-ride) service, and 9 forother service. Although these 277 contracts do not make up the universe of con-tracts for all systems or even for these 156 systems (since respondents wereasked to report only up to 4 contracts), they reveal much about how transit ser-vice contracts are structured and administered, such as their duration, methodsof payment, and use of performance penalties and incentives. The contract data,combined with results from Part 2 of the survey, offer insights into the natureof transit service contracting relationships, particularly the importance of a clearand detailed contract that spells out the duties and responsibilities of the con-tracting parties.
Contractor Types
More than 85 percent of the contracts reported are with private entities. Aboutthree-quarters are with for-profit companies. The percentage is slightly lowerfor demand-responsive services because 18 percent of contracts for these ser-vices are with private nonprofit organizations (typically social service agencies),as opposed to 6 percent of bus contracts.
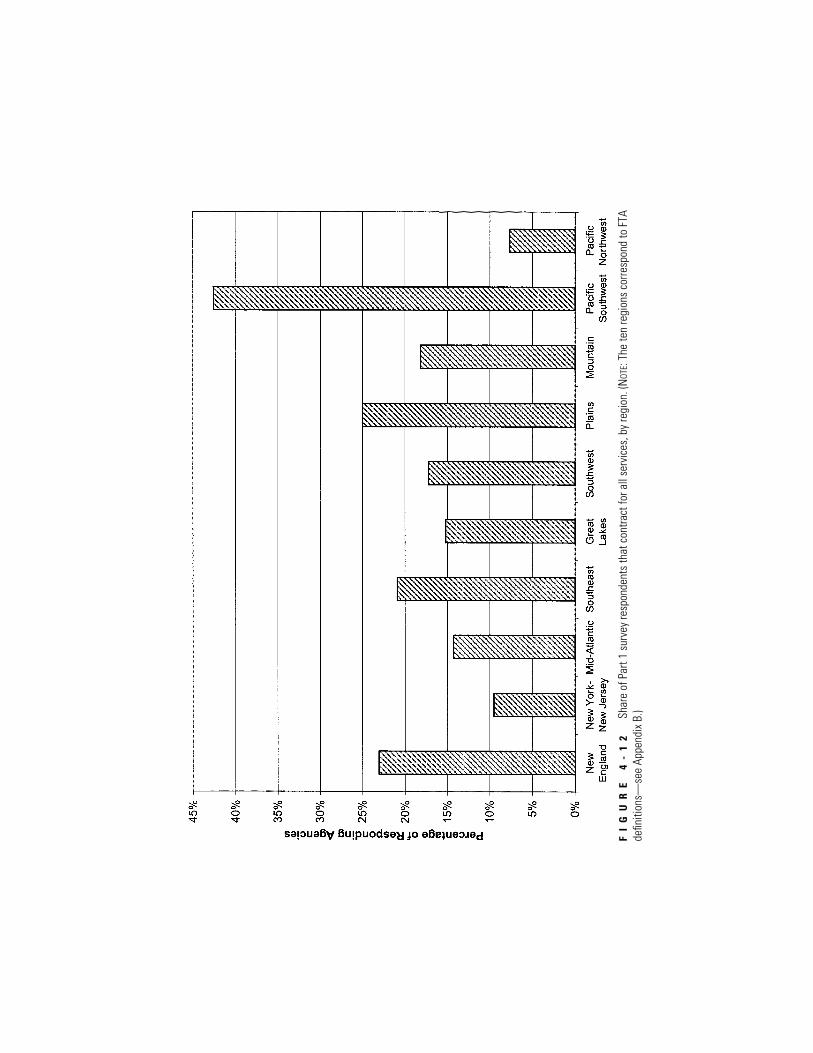
FI
GU
RE
4
-1
2Sh
are
of P
art 1
sur
vey
resp
onde
nts
that
con
tract
for a
ll se
rvic
es, b
y re
gion
. (N
OTE:
The
ten
regi
ons
corre
spon
d to
FTA
defin
ition
s—se
e Ap
pend
ix B
.)

Contracting for Bus and Demand-Responsive Transit Services78
Contract Monetary Amounts
Because surveyed systems were asked to report their largest contracts, it is notpossible to determine from the survey results how the distribution of the re-ported contracts by monetary amount compares with that of all other transitservice contracts. Nonetheless, the average annual amounts of the reportedcontracts vary widely—from very small to large. Respondents reported aboutthe same number of contracts valued at less than $100,000 and at more than$5 million (12 to 14 percent) (see Table 4-3).
The large systems responding (those with more than 250 vehicles in maxi-mum service) account for nearly half the reported contracts exceeding $1 millionin value and more than 80 percent of those exceeding $5 million (see Table 4-4).Thus one can have confidence in the finding that large systems generate mostof the large transit contracts; however, the same systems may also have manysmaller contracts not reported in the survey.
Contract Duration
The most prevalent contract length reported is 3 years, with options for 2 ad-ditional years (expressed as two 1-year options). More than 45 percent of re-ported contracts have 3-year terms (see Table 4-5), and 37 percent contain two1-year options.
Bus contracts tend to be longer than contracts for demand-responsive ser-vice. Only about one in five reported bus contracts are for periods of less than3 years, compared with one in three demand-responsive contracts. As discussedlater, the larger capital investment required for fixed-route bus service may ex-plain this difference in contract duration.
Provision of Vehicles, Facilities, and Other Support
In the majority of reported contracts, the agency furnishes the buses and para-transit vehicles to be used for the service (see Table 4-6). However, this prac-tice does differ by type of service. Contracting agencies are more likely toprovide the large buses used for fixed-route service than the smaller vehiclesused for demand-responsive service. In about three-quarters of reported buscontracts, the agency supplies the vehicles, compared with about half of demand-responsive contracts. Only 10 percent of all reported contracts mix this respon-
(text continues on page 83)
TA
BL
E
4-
3
Num
ber o
f Rep
orte
d Co
ntra
cts,
by
Mon
etar
y A
mou
nt a
nd S
ervi
ce T
ype
Perc
enta
ge o
f Pe
rcen
tage
De
man
d-Al
l Dem
and-
Perc
enta
ge
Cont
ract
Am
ount
Bu
s of
All
Bus
Resp
onsi
ve
Resp
onsi
ve
Othe
r To
tal
of T
otal
(A
nnua
lized
)Co
ntra
cts
Cont
ract
sCo
ntra
cts
Cont
ract
sCo
ntra
cts
Cont
ract
sCo
ntra
cts
Less
than
$10
0,00
08
8.4
2315
.10
3112
.2$1
00,0
00 to
$49
9,00
024
25.3
3825
.00
6224
.4$5
00,0
00 to
$1
mill
ion
1616
.820
13.2
440
15.7
Mor
e th
an $
1 m
illio
n to
$3
mill
ion
2223
.240
26.3
163
24.8
Mor
e th
an $
3 m
illio
n to
$5
mill
ion
77.
415
9.9
022
8.7
Mor
e th
an $
5 m
illio
n18
18.9
1610
.52
3614
.2To
tal r
espo
ndin
g95
100.
015
210
0.0
725
410
0.0

TA
BL
E
4-
4
Num
ber o
f Rep
orte
d Co
ntra
cts,
by
Mon
etar
y A
mou
nt a
nd S
yste
m S
ize M
ediu
m-
Perc
enta
ge
Larg
e Sm
all S
yste
ms
Perc
enta
ge
Size
d Sy
stem
s of
Med
ium
-Sy
stem
s Pe
rcen
tage
Co
ntra
ct A
mou
nt
(50
vehi
cles
of
Sm
all
(51
to 2
50
Size
d (m
ore
than
of
Lar
ge
(Ann
ualiz
ed)
or le
ss)
Syst
ems
vehi
cles
)Sy
stem
s25
0 ve
hicl
es)
Syst
ems
Less
than
$10
0,00
022
20.8
67.
52
3.0
$100
,000
to $
499,
000
4138
.718
22.5
34.
5$5
00,0
00 to
$1
mill
ion
2422
.610
12.5
69.
0M
ore
than
$1
mill
ion
to $
3 m
illio
n18
17.0
3442
.511
16.4
Mor
e th
an $
3 m
illio
n to
$5
mill
ion
10.
96
7.5
1522
.4M
ore
than
$5
mill
ion
00.
06
7.5
3044
.8To
tal r
espo
ndin
g10
610
0.0
8010
0.0
6710
0.0

TA
BL
E
4-
5
Num
ber o
f Rep
orte
d Co
ntra
cts,
by
Dur
atio
n an
d Se
rvic
e Ty
pe
Perc
enta
ge o
f De
man
d-De
man
d-Pe
rcen
tage
of
Resp
onsi
ve
Resp
onsi
ve
Othe
r To
tal
Perc
enta
ge o
f Te
rm (Y
ears
)Bu
s Co
ntra
cts
Bus
Cont
ract
sCo
ntra
cts
Cont
ract
sCo
ntra
cts
Cont
ract
sTo
tal
113
14.6
3622
.52
5119
.92
66.
721
13.1
128
10.9
352
58.4
6339
.41
116
45.3
43
3.4
85.
00
114.
35
1314
.630
18.8
346
18.0
Mor
e th
an 5
22.
22
1.3
04
1.6
Tota
l res
pond
ing
8910
0.0
160
100.
09
256
100.
0
Transit Service Contracting in the United States: Extent and Practice 81

TA
BL
E
4-
6
Num
ber o
f Rep
orte
d Co
ntra
cts,
by
Part
ies
Resp
onsi
ble
for P
rovi
ding
Veh
icle
s
Perc
enta
geDe
man
d-of
Dem
and-
Party
Res
pons
ible
for
Perc
enta
ge o
f Re
spon
sive
Re
spon
sive
Ot
her
Tota
l Pe
rcen
tage
Ve
hicl
e Pr
ovis
ion
Bus
Cont
ract
sBu
s Co
ntra
cts
Cont
ract
sCo
ntra
cts
Cont
ract
sCo
ntra
cts
of T
otal
Tran
sit a
genc
y69
72.6
7248
.35
146
58.2
Cont
ract
or20
21.1
5738
.31
7831
.1Sh
ared
66.
320
13.4
127
10.8
Tota
l res
pond
ing
9510
0.0
149
100.
07
251
100.
0

Transit Service Contracting in the United States: Extent and Practice 83
sibility, although such arrangements are somewhat more common in demand-responsive than in bus contracts.
Likewise, transit agencies usually provide the scheduling hardware and soft-ware. In about 60 percent of reported contracts, however, the contractor providesvehicle storage sites, maintenance facilities, and related equipment. Contractorsare more likely to provide these assets under demand-responsive than bus con-tracts. Demand-responsive contractors usually (about two-thirds of the time) han-dle dispatching, reservations, and routing. However, most transit agencies retainresponsibility for determining passenger service eligibility under ADA.
Public agencies may have a number of possible reasons for choosing to fur-nish transportation vehicles and related facilities, especially for large-bus service.These assets can usually be obtained with federal and state capital grants andloans, and such public acquisitions are seldom subject to state and local sales andproperty taxes. Moreover, an agency can increase the number of potential con-tractors by effectively eliminating the private investment risk of such a large andspecialized capital acquisition. The contract duration, or interval between rebidcycles, can be shorter since there is no need for the contractor to amortize thebuses and related facilities over many years. Moreover, if the contractor does notperform as required, the agency can rebid the contract more quickly and easilyif it owns the buses and facilities used for the service.
Methods of Contractor Payment
The contracts reported have many criteria for payment, and in about 20 percentpayment is based on multiple criteria. The survey did not give respondents in-structions on how to define payment bases; nevertheless, some common pat-terns emerge. Table 4-7 shows that contractor payments are usually based inwhole or in part on revenue-hours, revenue-miles, riders, or some other mea-sure of service supplied. This pattern holds true for both bus and demand-responsive services.
Payment based on output tends to shift the responsibility for controllingcosts from the agency to the contractor. The contractor usually agrees to mea-sure the amount of service it provides by a particular unit of output, such asmonthly vehicle-hours of revenue service; thus payments are most commonlymade on the basis of an agreed-upon fee per unit. The contractor therefore hasan incentive to control costs. In only 25 percent of the reported contracts (thosecontracts that have a cost-plus-fixed-fee basis for payment) does the contrac-tor receive compensation solely on the basis of service costs as opposed to theamount of measurable service provided.

Contracting for Bus and Demand-Responsive Transit Services84
Incentives and Penalties
Only about one-quarter of the reported contracts offer monetary rewards as in-centives for good or superior performance. Yet to discourage poor performance,43 percent include monetary penalties, and 39 percent include related provi-sions for liquidated damages2 (see Table 4-8). Moreover, 63 percent of reportedcontracts have either a penalty clause or a provision for liquidated damages, andan additional 18 percent have both. These findings suggest that deterrents topoor performance are much more prevalent than enticements for good perfor-mance in transit service contracts.
Retention of fares by the contractor is rarely offered as an incentive for in-creasing service amounts and quality; very few reported contracts allow the con-tractor to keep fare revenues as an independent source of income. Nevertheless,more than two-thirds of reported contracts permit the contractor to retain faresas an offset to future payments. This practice can benefit the contractor by im-proving its cash flow. Likewise, the practice can confer benefits on the agencyby reducing expenses incurred in fare revenue collection and counting, al-though periodic auditing may be required to confirm reported fare revenues.
Contracting Methods and Competition
As discussed in Chapters 2 and 3, an oft-cited advantage of contracting is that itcan create a more competitive environment to spur cost savings. Several ques-tions in the survey sought information on the level of competition in transit ser-vice contracting. The 156 contracting systems were asked to report how theircontracted services are usually obtained, the most recent number of bidders foreach of their reported contracts, how the number of bidders changed over timefor each, and the number of contractor changes since initiation of the contracted
T A B L E 4 - 7
Number of Reported Contracts, by Basis of Contractor Payment
Payment Basis Sole Factor in Payment Partial Factor in Payment
Cost plus fixed fee 55 11Fixed fee 9 23Hours supplied 85 45Miles supplied 20 25Passenger boardings 25 4Other 8 9

TA
BL
E
4-
8
Num
ber o
f Rep
orte
d Co
ntra
cts
with
Per
form
ance
Ince
ntiv
es a
nd P
enal
ties,
by
Serv
ice
Type
Perc
enta
geDe
man
d-of
Dem
and-
Perc
enta
gePe
rcen
tage
of
Resp
onsi
ve
Resp
onsi
ve
Othe
r To
tal
of T
otal
Pe
rform
ance
Pro
visi
ons
Bus
Cont
ract
sBu
s Co
ntra
cts
Cont
ract
sCo
ntra
cts
Cont
ract
sCo
ntra
cts
Cont
ract
s
Liqu
idat
ed d
amag
es45
45.9
6135
.91
107
38.6
Pena
lties
4343
.972
42.4
411
943
.0In
cent
ives
2525
.545
26.5
373
26.4
Tota
l98
170
927
7

Contracting for Bus and Demand-Responsive Transit Services86
service. The responses to these and other questions provide a rich picture of con-tracting processes across the country and the degree of competition involved.
Methods of Obtaining Contracts
In Part 2 of the survey, general managers were asked to characterize how fixed-route bus and demand-responsive contracts are typically obtained—whetherthrough competitive bidding, negotiation, or a combination of the two. In retro-spect, these terms should have been defined more clearly in the questionnaire,but the results are informative nonetheless.
About three-quarters of respondents characterized the process as competi-tive in nature—using bidding or a combination of bidding and negotiation.Fewer than 20 percent described their process as negotiated procurement, suchas a sole-source negotiation or periodic renegotiation with a long-time incum-bent (see Table 4-9).
Bid Activity
From the agency’s standpoint, having a large number of qualified bidders is de-sirable because it allows the greatest choice in both quality and price. Thus foreach reported contract, the survey asked for the number of bidders during themost recent bid period. Table 4-10 shows that a majority of the contracts had atleast three bidders during the most recent bid period, yet one-quarter had a sin-gle bidder. The demand-responsive contracts tended to have fewer bids: 44 per-cent had fewer than 3 bids, as compared with 33 percent of bus contracts.
There appears to be a relationship between the size of the transit system andthe number of bidders attracted to a contract. Nearly 40 percent of the contractsreported by small systems attracted only one bidder, and nearly 70 percent at-tracted fewer than three (see Table 4-11). Contracts reported by medium-sizedand large systems, by comparison, attracted three or more bidders most of thetime. Yet because these systems reported larger contracts, this apparent rela-tionship may be a function of contract size.
Changes in Bid Activity
Changes in the number of bidders from one bid cycle to the next are also in-dicative of the state of competition. A decline in the number of bidders over timesuggests a decline in competition.
(text continues on page 90)

TA
BL
E
4-
9
Num
ber o
f Con
trac
ting
Age
ncie
s U
sing
Com
petit
ive
and
Neg
otia
ted
Met
hods
of C
ontr
act P
rocu
rem
ent,
by S
ervi
ce T
ype
Perc
enta
geof
Age
ncie
s Pe
rcen
tage
Co
ntra
ctin
g of
Age
ncie
s De
man
d-De
man
d-Pe
rcen
tage
of
Cont
ract
ing
Resp
onsi
ve
Resp
onsi
ve
All C
ontra
ctin
g M
etho
dBu
s Se
rvic
esBu
s Se
rvic
esSe
rvic
esSe
rvic
esAl
l Ser
vice
sAg
enci
es
Com
petit
ive
bidd
ing
3646
.857
47.5
9347
.5N
egot
iate
d Pr
ocur
emen
t10
13.0
2218
.332
16.2
Com
bina
tion
2735
.132
26.7
5929
.8Ot
her
45.
29
7.5
136.
6To
tal r
espo
ndin
g77
100.
012
010
0.0
198
100.
0
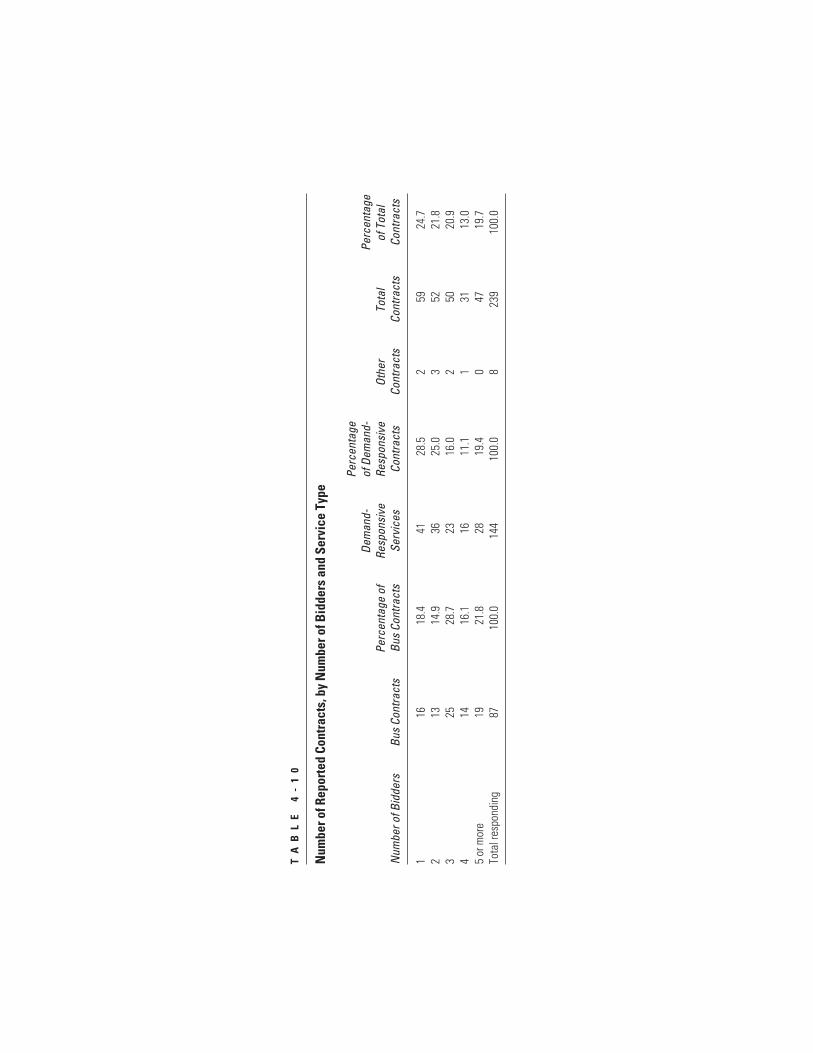
TA
BL
E
4-
10
Num
ber o
f Rep
orte
d Co
ntra
cts,
by
Num
ber o
f Bid
ders
and
Ser
vice
Typ
e
Perc
enta
geDe
man
d-of
Dem
and-
Perc
enta
ge
Perc
enta
ge o
f Re
spon
sive
Re
spon
sive
Ot
her
Tota
l of
Tot
al
Num
ber o
f Bid
ders
Bus
Cont
ract
sBu
s Co
ntra
cts
Serv
ices
Cont
ract
sCo
ntra
cts
Cont
ract
sCo
ntra
cts
116
18.4
4128
.52
5924
.72
1314
.936
25.0
352
21.8
325
28.7
2316
.02
5020
.94
1416
.116
11.1
131
13.0
5 or
mor
e19
21.8
2819
.40
4719
.7To
tal r
espo
ndin
g87
100.
014
410
0.0
823
910
0.0

TA
BL
E
4-
11
Num
ber o
f Rep
orte
d Co
ntra
cts,
by
Num
ber o
f Bid
ders
and
Sys
tem
Siz
e
Perc
enta
ge o
f Pe
rcen
tage
of
Cont
ract
s by
Al
l Con
tract
s by
Pe
rcen
tage
of
Cont
ract
s by
Al
l Con
tract
s by
M
ediu
m-S
ized
Med
ium
-Size
d Co
ntra
cts
by
All C
ontra
cts
by
Num
ber o
f Bid
ders
Smal
l Sys
tem
sSm
all S
yste
ms
Syst
ems
Syst
ems
Larg
e Sy
stem
sLa
rge
Syst
ems
139
38.6
1114
.59
14.5
230
29.7
1925
.03
4.8
314
13.9
2228
.914
22.6
47
6.9
1114
.513
21.0
5 or
mor
e11
10.9
1317
.123
37.1
Tota
l res
pond
ing
101
100.
076
100.
062
100.
0
Transit Service Contracting in the United States: Extent and Practice 89

Contracting for Bus and Demand-Responsive Transit Services90
Change in Bidders from Previous Bid CycleThose systems that currently contract were asked to report the number of bid-ders from the previous bid cycle to the most recent rebid. Of the 189 reportedcontracts that have been rebid (that is, those that have been through more thanone full bid cycle), 150 had more than 1 bidder during the previous bid cycle.The remaining 39 had only 1 bidder during the previous bid cycle and were notincluded in this analysis.
Of the 150 contracts that had at least two bidders in their previous bidcycle, 36 percent experienced a decline in bidders during the most recent rebid,23 percent experienced an increase, and about 41 percent had no change (seeFigure 4-13). The results differ for bus and demand-responsive services: aboutas many bus contracts experienced an increase as a decline in bidders; by com-parison, 40 percent of demand-responsive contracts experienced a decline inbidders, while fewer than 20 percent experienced a gain.
Change in Bid Activity by Contract AgeOne would expect the number of bidders on a contract to vary somewhat witheach successive bid cycle. Whether a pattern emerges and contracts tend to gen-erate more or fewer bids as they go through additional bid cycles might providesome indication of the dynamics of competition over time. Figure 4-14 showsthe percentage of contracts that have experienced various levels of bid activityaccording to the number of times each was rebid. Among those contracts thathave been rebid once or twice, about 60 percent attracted more than two bid-ders during their most recent bid period. There appears to have been only a slightdecline in bidder interest over time. About half of those contracts that had beenrebid three or more times attracted three or more bidders during their most re-cent rebid period.
Change in Contractors
For contracts that have been through many rebids, periodic changes in contrac-tor may be indicative of a competitive environment. Presumably, if incumbentcontractors are subjected to competitive discipline, some turnover should be ex-pected, although the minimum amount of contractor turnover that is indicativeof a competitive situation is not presupposed.
Change in Contractors by Contract AgeIn general, one would expect to see more contractor changes for those con-tracts that have been rebid several times, simply because there have been sev-

FI
GU
RE
4
-1
3Pe
rcen
tage
of c
ontra
cts
repo
rted
by P
art 1
sur
vey
resp
onde
nts
with
incr
easi
ng o
r dec
reas
ing
num
ber o
f bid
sfro
m p
revi
ous t
o m
ost r
ecen
t bid
cycl
e (e
xclu
ding
cont
ract
s tha
t had
onl
y one
bid
in p
revi
ous c
ycle
).

Contracting for Bus and Demand-Responsive Transit Services92
eral opportunities for change. Figure 4-15 presents the number of contractorchanges for 200 reported contracts, grouped according to the number of timesthe contracts have been rebid. As expected, those contracts that have beenrebid only once or twice are most likely to have had a single contractor: 57 per-cent of these contracts have had only one contractor, and therefore have notexperienced a change. By the third and fourth rebid cycles, however, most con-tracts have been through more than one contractor; 40 percent have had oneor two contractor changes, and 26 percent have had at least three contractorchanges. Two-thirds of the contracts that have had five or more rebids have ex-perienced a contractor change.
Change in Contractors by System SizeSmall and medium-sized systems appear somewhat less likely than the largestsystems to change contractors. Among those contracts that have been rebid atleast once, more than 55 percent reported by small and medium-sized systems
F I G U R E 4 - 1 4 Percentage of contracts with one, two, three, and four or more biddersby number of bid cycles (contracts reported in survey Part 1).

F I G U R E 4 - 1 5 Percentage of reported contracts rebid at least once that have had contractor changes. (a) by number of changes; (b) by number of times rebid.
(a)
(b)

Contracting for Bus and Demand-Responsive Transit Services94
have not changed hands, compared with about 40 percent for the largest sys-tems (see Figure 4-16).
History of Contractor Changes and Bid ActivityOne might suspect that those contracts with a history of contractor changeswould elicit more bidder interest and activity because of the higher potentialto challenge the incumbent successfully. Figure 4-17 shows the most recentnumber of bidders for those contracts that have been rebid at least twice (andtherefore have a record of change or no change) by the number of times the con-tract has changed hands during its life.3 The results suggest that contracts with-out a record of changing hands are most likely to have only one bidder—theincumbent. It is important to note, however, that even among those contractsthat do not have a history of contractor changes, most still attract multiple—though so far unsuccessful—bidders when they are rebid.
Summary of Results
The results from the survey, augmented by NTD data, yield several findingsabout the extent of contracting, contract terms and provisions, and competitionin contracting:
Extent of Contracting
■ About half of all transit systems contract for 10 percent or more of theirservices. About 60 percent have at least some contracted service. Yet in theaggregate, only about 15 percent of combined bus and demand-responsiveservices (measured in vehicle revenue-hours) are contracted in the UnitedStates, and this percentage has changed very little in recent years (seeChapter 1).
■ Transit systems are much more likely to contract out demand-responsive thanfixed-route bus services: more than two-thirds of surveyed systems have con-tracts for their demand-responsive services, whereas fewer than 40 percenthave contracts for bus services. More than half the systems with demand-responsive services contract out all of these services.
■ Larger systems are more likely than small ones (operating fewer than 50 vehi-cles) to contract for at least some transit services, although usually for less than25 percent of their total services. Small systems contract less often than largerones, but when they do contract are much more likely to do so for all theirservices. City and county agencies are more likely than state and regional tran-sit agencies to contract for all their transit services.

F I G U R E 4 - 1 6 Percentage of rebid contracts that have experienced contractorchanges: (a) by number of changes; (b) by system size (contracts reported in survey Part 1).

FI
GU
RE
4
-1
7Pe
rcen
tage
of a
ll re
porte
d co
ntra
cts
(am
ong
thos
e th
at h
ave
been
rebi
d at
leas
t tw
ice)
by
num
ber o
f bid
ders
du
ring
the
mos
t rec
ent r
ebid
and
by n
umbe
r of c
ontra
ctor
chan
ges o
ver t
he co
ntra
ct li
fe.

Transit Service Contracting in the United States: Extent and Practice 97
Contract Terms and Provisions
■ Most contracts are for multiyear periods, usually 3 years. Bus contracts tendto be longer than contracts for demand-responsive services.
■ Transit agencies usually provide the vehicles and other major assets for busservice contracts. For demand-responsive contracts, there is a much greaterlikelihood that the contractor will either provide the vehicles or share thisresponsibility with the contracting agency.
■ Most contracts are structured to pay contractors on a predetermined fee perunit of output produced—usually revenue- or vehicle-hours of service. Thecontractor is therefore responsible for controlling costs; only one-quarter ofreported contracts pay contractors on the basis of cost plus a fixed fee.
■ Monetary penalties to discourage poor performance are common in contracts.Fewer contracts contain monetary incentives for good performance.
Contracting Methods and Competition
■ Most transit service contracts are awarded through a competitive process.■ Most contracts attract more than two bidders, although smaller contracts are
more likely to attract only a single bidder. Demand-responsive contracts tendto attract fewer bidders than bus contracts. Small systems are least successfulin attracting multiple bidders; most receive fewer than three bids.
■ Transit systems report that the number of bidders on contracts has been rel-atively stable, but demand-responsive contracts are more likely than bus con-tracts to have experienced a decline in bidders from the previous bid cycle.
■ The contracts of larger systems are more likely than those of small systemsto have changed contractors at least once.
■ As contracts go through successive bid cycles, they continue to attract inter-est among bidders, suggesting continued competition. Moreover, most con-tracts that have been rebid at least three times have experienced a change incontractors. Even those contracts that have had only one contractor havecontinued to attract bidder interest.
Notes1. Electronic versions of the survey were also made available to recipients on request.2. Penalty disputes are typically resolved in court, while disputes over liquidated
damages are more likely to be subject to arbitration.3. The fact that these contracts tend to attract only one bidder may be the reason
for the lack of contractor changes; however, it may also be the consequence. Thedirection of causality cannot be established.
98
5 Transit Contracting Experiences and Advice fromGeneral Managers
The discussion in this chapter focuses largely on the qual-itative and perceptual responses to the transit system sur-vey. Part 2 of the survey asked the general managers or
top executives of transit systems to explain why their agenciescontract for transit services, to relate the outcomes of their con-tracting programs, and to offer advice on how to make con-tracting work better. General managers of agencies that currentlydo not contract were asked to explain why they do not and to in-dicate whether their agencies have contracted in the past. Of the502 transit agencies surveyed, the general managers of 237, or47 percent, completed and returned this part of the survey (seeChapter 4 for a discussion of the overall pattern of response tothe survey).
The committee chose to survey transit system managers fortwo reasons. First, general managers can offer specific informa-tion on the practice and effects of contracting, since many haveexperience with contracting on a day-to-day basis. At the sametime, the choice of contracting is often a policy-level decision in-fluenced by political, legal, and institutional environments, andmore than any other group, general managers are distinguishableparticipants in this decision-making process. Thus these indi-viduals are often responsible for both making and implementingthese decisions.
Ideally, the survey respondents would have included moreindividuals involved in and knowledgeable about transit service
5
Transit Contracting Experiences and Advice from General Managers 99
contracting decisions and their effects, such as transit board members, unionofficials, and private contractors. As a practical matter, however, the develop-ment and administration of such an extensive and multifaceted survey was notpossible. Therefore, to supplement the responses of the general managers, sev-eral follow-on telephone interviews were conducted with transit general man-agers, contractors, union leaders, transit board members, and public officialsfrom five transit systems (see Box 5-1). The information and insights gleanedfrom these interviews proved to be helpful in analyzing the general managers’responses.
The collective results of the survey of general managers should thus be re-garded as reflecting one important perspective on contracting decisions and out-comes—that is, the current perceptions of transit general managers. At the sametime, however, given the variation in circumstances from one transit system toanother, the large number of survey responses provides a mix of viewpoints andappraisals. The responses offer much insight into why some systems contractand others do not, how contracting has engendered both positive and negativereactions, and what steps have been taken to make contracting work better.
Finally, it is important to note that some of the questions in the generalmanager survey did not distinguish between fixed-route and demand-responsiveservices. When the survey results can be disaggregated by these service types,however, they are presented this way. Furthermore, some of the questions askedthe general managers to make judgments about closely related aspects of ser-vice, such as effects of contracting on operating costs and cost-efficiency, oron employee turnover and workforce retention. As a practical matter therecan be little, if any, difference between such response categories; however, asmany variants as possible were offered because of the potential for multipleinterpretations. By and large, the responses did not vary among related responsecategories.
Reasons for Using and Not Using Contracting
The survey respondents included general managers of 144 transit systems thatcurrently contract for demand-responsive or bus services, or both, as well asgeneral managers of 93 systems that do not contract for services at all. Thosein the former group were asked to assess the importance of several possible rea-sons for their agency’s decision to contract, while those in the latter group wereasked to rate possible reasons for their agency’s choosing not to contract.

Contracting for Bus and Demand-Responsive Transit Services100
Reasons for Contracting
General managers of systems that currently contract were asked to judge eachof ten possible reasons for contracting according to its influence on the decisionto contract. They were asked to rate each as either a primary, important, minor,or irrelevant factor in their agency’s decision to contract for fixed-route bus anddemand-responsive services. Three of the reasons relate to service cost (improvecost-efficiency, reduce costs, create a more competitive environment) and fourto aspects of service quantity and quality (start new services, expand existingservices, provide a higher quality of service, and allow for more flexible servicechanges). The remaining three reasons relate to policy direction—transit boardguidance, state mandates or laws, and federal emphasis on contracting.
By and large, the respondents gave similar answers for bus and demand-responsive services. Starting new services, reducing costs, and increasing cost-
B O X 5 - 1
Follow-On Interviews
Nineteen telephone interviews were conducted with transit managers, laborrepresentatives, private contractors, and public officials from Aiken County,South Carolina; Pittsburgh, Pennsylvania (Port Authority of Allegheny County);San Diego, California (Metropolitan Transit Development Board); Arlington(Pace), Illinois; and Clearwater–St. Petersburg (Pinellas County), Florida. Thesefive communities were selected because they vary in size and geography andbecause the transit agencies that serve them differ in size and structure.
Each person was asked questions similar to those in the survey, but designed toelicit more detail. Specifically, each was asked to discuss the following (whenrelevant):
■ The history of contracting at the agency;■ Positive and negative impacts of contracting—cost savings, flexibility, labor
issues, political ramifications, service quality, and quality of the contractor;■ Ways to make contracting work better, including use of performance stan-
dards, incentives and penalties, and relations with the contractor; and■ Willingness to contract again, and reasons why or why not.
Given that the respondents varied widely in their knowledge of contracting andin their perspectives, the board members, public officials, and general managersinterviewed were asked questions about the political aspects of contracting.Likewise, agency contract managers, union officials, and private contractorswere asked about the details of the contracting program and its history.

Transit Contracting Experiences and Advice from General Managers 101
efficiency were the reasons for contracting rated most highly by both the 75general managers responding for their bus services and the 117 responding fortheir demand-responsive services (see Figure 5-1 and Table 5-1).1 Indeed,these three factors were the only ones rated as primary or important reasonsfor contracting by more than half the respondents, for both bus and demand-responsive services.
Many of the general managers also cited the desire to create a more com-petitive environment, expand services, and increase flexibility to change serviceas either primary or important reasons for contracting: each was cited by nearly40 percent of the respondents for both contracted bus and demand-responsiveservices (see Figure 5-1 and Table 5-1). About a fourth of the general managersidentified the desire for higher-quality service as a primary or important reasonfor contracting, although most often as the latter. By comparison, relatively fewgeneral managers (about 7 to 18 percent) rated the influence of federal policiesand state laws as important reasons to contract for either bus or demand-responsive service.
Reasons for Not Contracting
General managers of systems that do not contract at all were asked to rate 10possible reasons for not contracting, including not regarding the practice ascost-effective, perceiving no reason to change current practice, and wishing tomaintain control over operations. They were also asked to rate the lack of qual-ified firms, board direction, the influence of union contracts, insufficient num-ber of bidders, bids that were too high, state labor laws, and the long-standinglabor protection provisions in Section 13c of the Federal Transit Act (for a briefdescription of Section 13c, see Box 2-1 in Chapter 2).
Several of the responses are notable. In particular, 51 of the 87 respondinggeneral managers, or nearly 60 percent, characterized the desire to maintaincontrol over operations as either a primary or important reason for not con-tracting (see Figure 5-2 and Table 5-2). Interestingly in light of the reasons givenby general managers for contracting, more than half of the 87 general managerscited not regarding the practice as cost-effective as a primary or important rea-son. Almost half of the general managers also identified as a primary or impor-tant factor not having a reason to change their current practice. In the follow-oninterviews, some of the general managers cited satisfaction with existing in-house services as a reason for not contracting. In one case, described in Box 5-2,
(text continues on page 108)
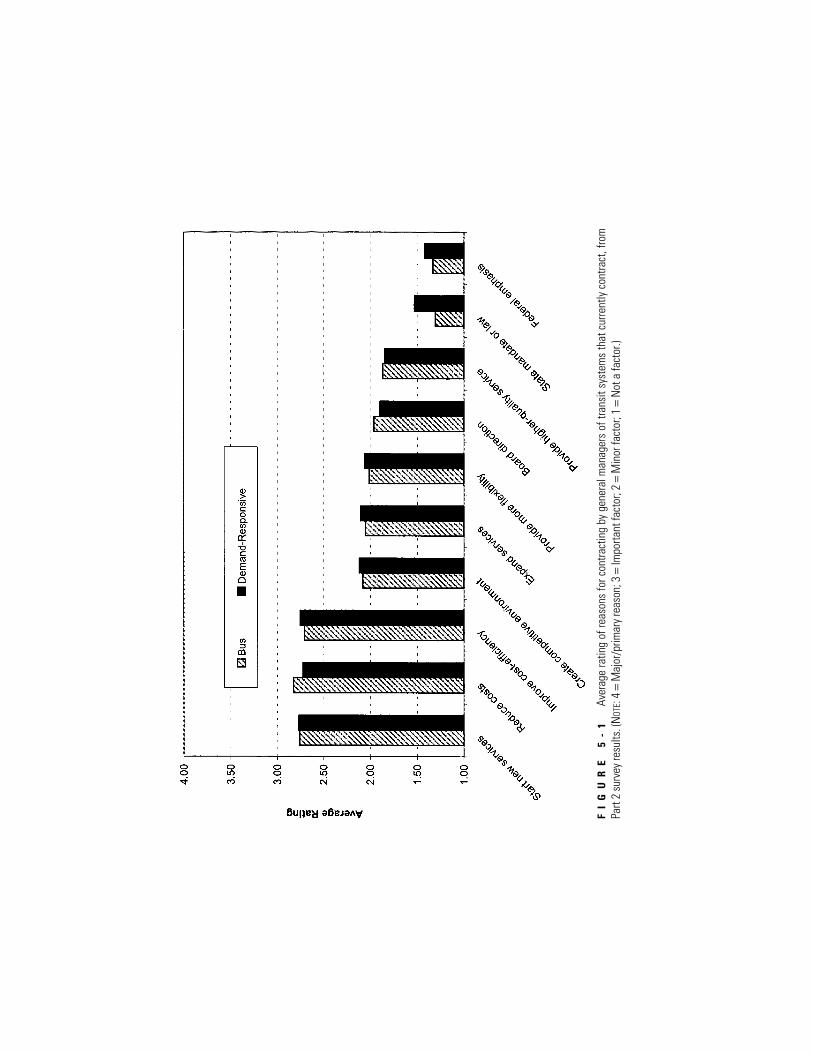
FI
GU
RE
5
-1
Aver
age
ratin
g of
reas
ons
for c
ontra
ctin
g by
gen
eral
man
ager
s of
tran
sit s
yste
ms
that
cur
rent
ly c
ontra
ct, f
rom
Part
2 su
rvey
resu
lts. (
NOT
E: 4
=M
ajor
/prim
ary r
easo
n; 3
=Im
porta
nt fa
ctor
; 2 =
Min
or fa
ctor
; 1 =
Not
a fa
ctor
.)

TA
BL
E
5-
1
Gen
eral
Man
ager
s’ R
atin
g of
Rea
sons
To
Cont
ract
for F
ixed
-Rou
te B
us a
nd D
eman
d-Re
spon
sive
Ser
vice
s
Perc
enta
ge o
f Pe
rcen
tage
of
Perc
enta
ge o
f Pe
rcen
tage
of
Resp
ondi
ng
Resp
ondi
ng
Resp
ondi
ng
Resp
ondi
ng
“Prim
ary
Gene
ral
“Im
porta
nt
Gene
ral
“Min
or
Gene
ral
“Not
a
Gene
ral
Reas
onRe
ason
”M
anag
ers
Reas
on”
Man
ager
sRe
ason
”M
anag
ers
Reas
on”
Man
ager
s
FIXE
D-R
OU
TE B
US
SERV
ICES
(75
Resp
ondi
ng)
Star
t new
serv
ices
3344
.014
18.7
56.
723
30.7
Redu
ce co
sts
3040
.020
26.7
79.
318
24.0
Impr
ove
cost
-effi
cien
cy26
34.7
2128
.08
10.7
2026
.7Cr
eate
com
petit
ive
envi
ronm
ent
1317
.316
21.3
1013
.336
48.0
Expa
nd se
rvic
es12
16.0
1925
.35
6.7
3952
.0Al
low
mor
e fle
xibi
lity
1013
.316
21.3
1418
.735
46.7
Boar
d di
rect
ion
1114
.716
21.3
79.
341
54.7
Prov
ide
high
er-q
ualit
y se
rvic
e10
13.3
1013
.315
20.0
4053
.3St
ate
man
date
or l
aw3
4.0
56.
74
5.3
6384
.0Fe
dera
l em
phas
is2
2.7
34.
013
17.3
5776
.0
(con
tinue
d)

DEM
AN
D-R
ESPO
NSI
VE S
ERVI
CES
(117
Res
pond
ing)
Star
t new
serv
ices
5042
.725
21.4
76.
035
29.9
Redu
ce co
sts
4740
.225
21.4
119.
434
29.1
Impr
ove
cost
-effi
cien
cy49
41.9
2218
.814
12.0
3227
.4Cr
eate
com
petit
ive
envi
ronm
ent
2117
.926
22.2
1613
.754
46.2
Expa
nd se
rvic
es22
18.8
2622
.211
9.4
5849
.6Al
low
mor
e fle
xibi
lity
1311
.134
29.1
1714
.553
45.3
Boar
d di
rect
ion
1412
.021
17.9
2117
.961
52.1
Prov
ide
high
er-q
ualit
y se
rvic
e8
6.8
2622
.223
19.7
6051
.3St
ate
man
date
or l
aw14
12.0
76.
06
5.1
9076
.9Fe
dera
l em
phas
is6
5.1
76.
017
14.5
8774
.4
NOT
E: Re
spon
dent
s inc
lude
d ge
nera
l man
ager
s of t
rans
it sy
stem
s tha
t cur
rent
ly co
ntra
ct.
TA
BL
E
5-
1
(con
tinue
d)
Gen
eral
Man
ager
s’ R
atin
g of
Rea
sons
To
Cont
ract
for F
ixed
-Rou
te B
us a
nd D
eman
d-Re
spon
sive
Ser
vice
s
Perc
enta
ge o
f Pe
rcen
tage
of
Perc
enta
ge o
f Pe
rcen
tage
of
Resp
ondi
ng
Resp
ondi
ng
Resp
ondi
ng
Resp
ondi
ng
“Prim
ary
Gene
ral
“Im
porta
nt
Gene
ral
“Min
or
Gene
ral
“Not
a
Gene
ral
Reas
onRe
ason
”M
anag
ers
Reas
on”
Man
ager
sRe
ason
”M
anag
ers
Reas
on”
Man
ager
s
Contracting for Bus and Demand-Responsive Transit Services104

FI
GU
RE
5
-2
Aver
age
ratin
g of
reas
ons f
or n
ot co
ntra
ctin
g by
gen
eral
man
ager
s of t
rans
it sy
stem
s tha
t cur
rent
ly d
o no
t con
tract
for a
ny se
rvic
es,
from
Par
t 2 su
rvey
resu
lts. (
NOT
E: 4
=M
ajor
/prim
ary r
easo
n; 3
=Im
porta
nt fa
ctor
; 2 =
Min
or fa
ctor
; 1 =
Not
a fa
ctor
.)

TA
BL
E
5-
2
Gen
eral
Man
ager
s’ R
atin
g of
Rea
sons
Not
To
Cont
ract
for T
rans
it Se
rvic
e
Perc
enta
ge o
f Pe
rcen
tage
of
Perc
enta
ge o
f Pe
rcen
tage
of
Resp
ondi
ng
Resp
ondi
ng
Resp
ondi
ng
Resp
ondi
ng
“Prim
ary
Gene
ral
“Im
porta
nt
Gene
ral
“Min
or
Gene
ral
“Not
a
Gene
ral
Reas
onRe
ason
”M
anag
ers
Reas
on”
Man
ager
sRe
ason
”M
anag
ers
Reas
on”
Man
ager
s
Mai
ntai
n co
ntro
l33
37.9
1820
.79
10.3
2731
.0N
ot co
st-e
ffect
ive
2225
.325
28.7
66.
934
39.1
No
reas
on to
chan
ge18
20.7
2326
.49
10.3
3742
.5La
ck o
f qua
lified
firm
s11
12.6
910
.39
10.3
5866
.7Bo
ard
dire
ctio
n10
11.5
1011
.55
5.7
6271
.3Un
ion
cont
ract
78.
09
10.3
44.
667
77.0
Sect
ion
13c p
reve
nts
89.
25
5.7
44.
670
80.5
Too
few
bid
ders
78.
06
6.9
00.
074
85.1
Prop
osed
bid
s too
hig
h6
6.9
33.
41
1.1
7788
.5St
ate
labo
r law
s 0
0.0
22.
31
1.1
8496
.6
NOT
E: Re
spon
dent
s inc
lude
d 87
gen
eral
man
ager
s of t
rans
it sy
stem
s tha
t cur
rent
ly d
o no
t con
tract
for a
ny se
rvic
e.

B O X 5 - 2
A Collaborative Approach to Transit Service Provision
A collaborative approach between agency and union was mentioned by twoagencies as a reason not to contract. One of the agencies, the Pittsburgh area’sPort Authority of Allegheny (PAT), deserves attention because of its uniquehistory of contracting. In the early 1990s, an attempt by the agency to contractfor new suburban services was legally challenged. The union prevailed on somematters in court, causing both parties to submit the issue to arbitration. Thearbitration ruling stated that the agency could operate low-density-area services,but only on new routes. It also stated the union had to operate the service, but ata lower wage rate, and that vehicle maintenance could be contracted out.
In 1996, PAT leased five vehicles for a new airport service. The lower-paiddrivers could work on this route. Although these workers were members of thelocal transit union, other union members objected to their hiring. A two-tierwage structure was developing in the workforce—small transit vehicle (STV)drivers locked in at 65 percent of the top operators’ wages and those operatinglarge vehicles following the wage progression specified in the labor contract.This two-tier system was causing labor difficulties; hence in the next round oflabor contract negotiations, the union and PAT decided to take anotherapproach. They agreed that instead of contracting out, all new drivers wouldstart at 65 percent of the top operators’ wage rate, and the hiring wageprogression was restructured. PAT would be able to retain a number of driversat the 65 percent level according to the number of vehicle-hours operated bySTVs. At the same time, some existing routes would be converted to STV, andall PAT routes would be available to any interested operator.
The union agreed to this arrangement because it would eliminate the two-tiersystem; instead, the lowest pay scale functions as a new step in the wageprogression to the top rate. The STV runs were also known to be popular withsome veteran drivers. Meanwhile, the agency obtained cost savings and theability to add more services. It also lessened pressure on its maintenancefacilities, which were operating at or near capacity.
According to union officials, 300 union employees have been added in the last2 years. As of early 2001, about 8 percent of 1,600 driver positions are at the65 percent wage rate, and nearly all move up to the next step within 1 year.The agency estimates that even in an economic slowdown, projected attritionrates would result in a maximum stay of 18 months at the 65 percent level.Nevertheless, the union would like to establish a time limit on this first stepand revisit the issue of contracting maintenance on STVs.
Transit Contracting Experiences and Advice from General Managers 107

Contracting for Bus and Demand-Responsive Transit Services108
a collaborative approach to service delivery between transit agency managementand the local labor union led to reduced interest in private contracting.
Influence of Laws and Policy
Neither the general managers that currently contract nor those that do notidentified federal and state laws and policies, including Section 13c, as havingan important effect on the decision to contract.
Contracting Experiences
The survey focused mainly on contracting experiences, both positive and nega-tive, as reported by general managers of transit systems that are now contracting.In addition, however, general managers of transit agencies that no longer con-tract were asked to report their experiences with contracting and their reasonsfor stopping. The responses of both of these groups are examined next.
Experiences of General Managers Who Currently Contract
Benefits and ProblemsGeneral managers of agencies that currently contract were asked to rate 15 pos-sible benefits and problems resulting from contracting for transit service—fromcost-efficiency and on-time performance to accidents and employee turnover.They were asked to rate each as a large or minor benefit, a large or minor prob-lem, or neither/depends.
Many of the 136 respondents did not react strongly; they rated most bene-fits and problems as minor or indicated uncertainty or indifference. Nevertheless,some areas emerge clearly as perceived benefits or problems. Figure 5-3 showsthe average rating for each of the 15 benefits or problems (using a scale from 5,representing large benefits, to 1, representing large problems, with 3 represent-ing neither/depends). Savings in operating costs, increased cost-efficiency, andthe ability to expand service were rated by most respondents as benefits of con-tracting. By comparison, workforce retention, employee turnover, and customerservice were cited most often as problems. Safety (vehicle accidents), employeemorale, contract disputes, and ridership received the highest number of neutralresponses.
Table 5-3 shows the general managers’ ratings of each of the 15 benefits orproblems. Several items generated a wide distribution of responses: some
(text continues on page 111)

FI
GU
RE
5
-3
Aver
age
ratin
gs o
f ben
efits
and
pro
blem
s by g
ener
al m
anag
ers o
f tra
nsit
syst
ems t
hat c
urre
ntly
cont
ract
, fro
mPa
rt 2
surv
ey re
sults
. (N
OTE:
5 =
Larg
e be
nefit
s; 4
=So
me
bene
fits;
3 =
Nei
ther
/dep
ends
; 2 =
Som
e pr
oble
ms;
1 =
Larg
e pr
oble
ms.
)

TA
BL
E
5-
3
Gen
eral
Man
ager
s’ R
atin
g of
Pro
blem
s an
d B
enefi
ts fr
om T
rans
it Se
rvic
e Co
ntra
ctin
g
Larg
e Pe
rcen
tage
of
Min
or
Perc
enta
ge o
f N
eith
er/
Perc
enta
ge o
f M
inor
Perc
enta
ge o
f La
rge
Perc
enta
ge o
f Ar
eaPr
oble
mRe
spon
dent
sPr
oble
mRe
spon
dent
sDe
pend
sRe
spon
dent
sBe
nefit
Resp
onde
nts
Bene
fitRe
spon
dent
s
Oper
atin
g co
sts
43.
09
6.8
1410
.558
43.6
4836
.1Co
st-e
ffici
ency
32.
212
8.8
85.
968
50.0
4533
.1Am
ount
of s
ervi
ce5
4.0
107.
940
31.7
3326
.238
30.2
Labo
r–m
anag
emen
t 4
3.4
1412
.050
42.7
2420
.525
21.4
rela
tions
Labo
r pro
duct
ivity
32.
519
15.6
4032
.842
34.4
1814
.8Ri
ders
hip
21.
67
5.6
6048
.446
37.1
97.
3St
aff t
ime
dem
ands
129.
532
25.4
3830
.222
17.5
2217
.5Se
rvic
e qu
ality
107.
541
30.6
2921
.642
31.3
129.
0Em
ploy
ee m
oral
e1
0.8
2722
.568
56.7
1512
.59
7.5
Acci
dent
s7
5.7
1310
.681
65.9
1814
.64
3.3
On-ti
me
perfo
rman
ce13
9.9
3829
.047
35.9
2821
.45
3.8
Cont
ract
dis
pute
s8
6.9
3429
.360
51.7
86.
96
5.2
Cust
omer
serv
ice
1713
.151
39.2
2317
.729
22.3
107.
7Em
ploy
ee tu
rnov
er15
13.4
3127
.750
44.6
1311
.63
2.7
Wor
kfor
ce re
tent
ion
2018
.332
29.4
3733
.911
10.1
98.
3
NOT
E: Re
spon
dent
s inc
lude
d ge
nera
l man
ager
s of t
rans
it sy
stem
s tha
t cur
rent
ly co
ntra
ct.

Transit Contracting Experiences and Advice from General Managers 111
general managers rated these items as benefits and others as problems. An exam-ple is the time demands placed on staff, although more of the respondents ratedthis item as beneficial than as problematic. Service quality also generated aboutas many positive as negative responses, with nearly 40 percent of the generalmanagers reporting either a large or minor benefit and 40 percent either a largeor minor problem.
Altogether, there were twice as many reports of large benefits as of large prob-lems, and nearly 25 percent more reports of minor benefits than of minor prob-lems. Further examination of these results reveals consistency in the benefits andproblems experienced with contracting across types of service, although generalmanagers tended to report slightly more problems for demand-responsive thanfor bus contracts.
Positive and Negative Aspects of ContractingIn addition to asking the contracting general managers to rate the specific effectsshown in Table 5-3, the survey included several open-ended questions on theirperceptions of other effects, both positive and negative, that might have beenoverlooked. Given this opportunity, many of the general managers reportedmultiple effects, sometimes as many five.
As might be expected from the ratings shown in Table 5-3, more than halfof the respondents cited reduced operating costs as a positive outcome of con-tracting. About one-quarter reported that they benefited from reductions in theadministrative responsibilities assumed by the contractor (including hiring,supervising, and insurance), and about 20 percent cited benefits from increasedflexibility in service provision (see Figure 5-4). Both smaller and larger agenciesreported cost savings associated with contracting.
Further analysis of these responses by system size suggests that large andsmall systems do not benefit from contracting in the same way. In particular,the increased flexibility associated with contracting was reported as a positiveeffect more often by larger systems (see Table 5-4), while the smallest systemswere more apt to cite the positive effect of administrative responsibilities beingtaken over by the contractor (as might be expected for agencies with limitedresources).
The negative effects of contracting reported most frequently were limitedcontrol, poor service quality, and problems with customer service (see Table 5-5and Figure 5-5). Again, these responses are consistent with the reasons given bya number of agencies for not contracting. Contractor issues, communication
(text continues on page 116)

FI
GU
RE
5
-4
Posi
tive
effe
cts o
f con
tract
ing
repo
rted
by g
ener
al m
anag
ers o
f tra
nsit
syst
ems t
hat c
urre
ntly
cont
ract
, fro
m P
art 2
surv
ey re
sults
.

TA
BL
E
5-
4
Perc
eive
d Po
sitiv
e Ef
fect
s of
Con
trac
ting,
by
Syst
em S
ize
Perc
enta
ge
Perc
enta
ge
Perc
enta
ge o
f of
All
Smal
l M
ediu
m-
of A
ll M
ediu
m-
All L
arge
Sm
all
Syst
ems
Size
d Si
zed
Syst
ems
Larg
e Sy
stem
s Ef
fect
Syst
ems
Repo
rting
Syst
ems
Repo
rting
Syst
ems
Repo
rting
Redu
ced
oper
atin
g co
st34
54.0
2562
.520
64.5
Redu
ced
adm
inis
tratio
n20
31.7
1127
.54
12.9
Flex
ibili
ty5
7.9
1332
.511
35.5
Expe
rtise
of c
ontra
ctor
1523
.84
10.0
825
.8M
ore
serv
ice
812
.76
15.0
929
.0Av
oida
nce
of ca
pita
l cos
ts7
11.1
37.
54
12.9
Cont
ract
or h
andl
es a
ll7
11.1
512
.52
6.5
Com
petit
ive
envi
ronm
ent
57.
94
10.0
39.
7Re
duce
d hi
ring/
staf
f3
4.8
37.
54
12.9
Publ
ic im
age/
polit
ical
23.
25
12.5
39.
7On
ly w
ay to
star
t ADA
serv
ice
46.
31
2.5
39.
7
NOT
E: Re
spon
dent
s inc
lude
d ge
nera
l man
ager
s of t
rans
it sy
stem
s tha
t cur
rent
ly co
ntra
ct.

Contracting for Bus and Demand-Responsive Transit Services114
TA
BL
E
5-
5
Perc
eive
d N
egat
ive
Effe
cts
of C
ontr
actin
g, b
y Sy
stem
Siz
e
Perc
enta
ge
Perc
enta
ge
Perc
enta
ge o
f of
All
Smal
l M
ediu
m-
of A
ll M
ediu
m-
All L
arge
Sm
all
Syst
ems
Size
d Si
zed
Syst
ems
Larg
e Sy
stem
s Ef
fect
Syst
ems
Repo
rting
Syst
ems
Repo
rting
Syst
ems
Repo
rting
Lim
ited
cont
rol
2548
.118
48.6
1657
.1Se
rvic
e qu
ality
/cus
tom
er se
rvic
e23
44.2
1437
.811
39.3
Cont
ract
or is
sues
815
.47
18.9
725
.0Co
mm
unic
atio
n10
19.2
718
.94
14.3
Turn
over
/low
wag
es8
15.4
513
.57
25.0
Nee
d to
mon
itor
1019
.26
16.2
310
.7Pe
rson
nel i
ssue
s3
5.8
410
.87
25.0
Publ
ic/p
oliti
cal i
ssue
s2
3.8
410
.87
25.0
Dim
inis
hing
retu
rns
47.
76
16.2
27.
1Un
ion
issu
es0
0.0
38.
14
14.3
NOT
E: Re
spon
dent
s inc
lude
d 52
gen
eral
man
ager
s of t
rans
it sy
stem
s tha
t cur
rent
ly co
ntra
ct.

FI
GU
RE
5
-5
Neg
ativ
e ef
fect
s of c
ontra
ctin
g re
porte
d by
gen
eral
man
ager
s of t
rans
it sy
stem
s tha
t cur
rent
ly co
ntra
ct, f
rom
Par
t 2 su
rvey
resu
lts.

Contracting for Bus and Demand-Responsive Transit Services116
problems, employee turnover, and the need to monitor contractor performancewere each mentioned as negatives by at least 15 percent of the general managers.
Further examination of reported negative effects by system size indicates thatgeneral managers of larger systems are somewhat more likely than their counter-parts in small agencies to identify worker turnover, low wages, and personnel is-sues as negative aspects of contracting. By comparison, general managers of smallagencies are more likely to view the need to monitor contractor performance asa negative aspect of contracting (as might be expected for agencies with limitedadministrative resources).
Monitoring and Mitigation of Adverse EffectsGeneral managers of agencies that contract were asked, “Does your agency havea specific unit to monitor the performance of contracted services?” and “Do youmonitor overhead costs for contracted services?” Of the 144 respondents, 63 per-cent indicated that they do have a monitoring unit, employing an average of fourworkers. The most commonly monitored aspects are contract administration,national data reporting, and vehicle inspection and maintenance; each wasreported by 35 percent of respondents.
The general managers who currently contract and who reported negativeeffects of contracting were asked to describe the actions they have taken tomitigate those effects. Only about one-third reported taking such actions. The40 general managers who did respond to this question reported that the typ-ical action taken is to change the contract, usually by increasing its specificityand sometimes by adding penalty provisions (see Table 5-6). About one-quarterof the respondents reported taking action to improve communication withcontractors.
T A B L E 5 - 6
Actions Taken To Mitigate Negative Effects of Contracting
Mitigating Action No. of Respondents Percentage of Total Respondents
Improved Contract 22 55.0Communication 10 25.0Personnel/Training 7 17.5Additional Monitoring 7 17.5Enforcement 2 5.0Agency Actions 2 5.0
NOTE: Respondents included 40 general managers of transit systems that currently contract.

Transit Contracting Experiences and Advice from General Managers 117
Reports from General Managers Who No Longer Contract
About one-third, or 30, of the 93 general managers from agencies that do notcurrently contract reported that they have done so in the past. Knowing moreabout the positive and negative aspects of contracting perceived by the generalmanagers of these agencies would have been helpful in complementing the re-ports by general managers of contracting agencies. Although the survey did notask these 30 general managers such detailed questions about the effects of con-tracting, they were asked to explain why they stopped using the practice. The30 respondents cited the desire for local control, improved service quality, con-tractor issues, and in-house cost savings as important reasons for no longer con-tracting (see Table 5-7). Although these respondents constitute a small group,the negative effects they cited are similar to some of the problems identified byagencies that currently contract.
Overall Assessments of Contracting
After reporting specific positive and negative aspects of contracting, the gen-eral managers who are now contracting were asked to offer their assessment ofwhether the results of contracting have met their expectations. In addition,general managers, including those that do not currently contract, were askedto answer the question, “If you had to do it all over again, and the choice weresolely yours, would you contract for services now?”
T A B L E 5 - 7
Reasons for Stopping Contracting, as Reported by General Managers of SystemsThat No Longer Contract for Transit Service
Percentage ofReason Respondents Total Respondents
Desire for local control 7 23.3Desire to improve service quality 7 23.3In-house cost savings 6 20.0Contractor issues 6 20.0Contractor opted out 6 20.0Escalating costs 4 13.3Few qualified contractors 3 10.0Internal changes 2 6.7Other 3 10.0
NOTE: Respondents included 30 general managers of transit systems that no longer contract.

Contracting for Bus and Demand-Responsive Transit Services118
Extent to Which Expectations Have Been Met
The general managers of agencies that currently contract were asked, “How havethe results of contracting met your expectations?” Respondents could choosefrom three options: “did not meet expectations,” “partially met expectations,”and “fully met expectations.” As a follow-on, those who reported anything lessthan “fully met expectations” were asked to explain why this was the case.
More than 55 percent of the general managers of contracting agencies re-ported that contracting has fully met their expectations, while nearly 40 per-cent reported that contracting has only partially met their expectations (seeFigure 5-6). Only six general managers reported that contracting has not mettheir expectations. However, since this question was posed only to generalmanagers of contracting agencies, this result is not necessarily surprising, asagencies that continue to contract are presumably doing so because they are atleast partially satisfied with the results.
The general managers gave a number of reasons why contracting results havemet their initial expectations only partially. The most commonly cited reasonswere contractor issues and poor service quality, each reported by nearly half ofthe respondents with partially met expectations (see Table 5-8).
Not surprisingly, most of the general managers that reported having theirexpectations fully met were also the most likely to report large benefits from con-tracting. Likewise, those with partially met or unmet expectations were the mostlikely to report problems. As shown in Figure 5-7, the biggest gaps in ratings be-tween general managers with fully met expectations and those with partially metexpectations occurred in service quality, customer service, and time demands onstaff. More than half of the general managers with partially met expectations iden-tified service quality as problematic (see Table 5-9). Many also cited lack of con-trol over contracted services as a problem area. Likewise, the problem cited mostoften by those general managers reporting fully met expectations was limitedcontrol over services.
The general managers with fully met expectations were most likely to men-tion the ability to provide more service as a positive effect of contracting (seeTable 5-10). Both general managers with fully met and with partially met orunmet expectations ranked cost savings as a benefit of contracting. Thus itwould appear that concerns about service quality are a more significant sourceof disappointment with contracting than dissatisfaction with cost savings, atleast among those agencies that currently contract.
(text continues on page 121)

F I G U R E 5 - 6 Extent to which contracting has met expectations, as reported by generalmanagers from systems that now contract, in response to survey Part 2.
T A B L E 5 - 8
Reasons Contracting Outcomes Fell Below Expectations
Percentage ofReason Respondents Total Respondents
Contractor Issues 23 46.9Service quality/customer service 23 46.9Benefits not fully realized 13 26.5Not enough control 6 12.2Personnel issues 4 8.2Too few bidders 3 6.1
NOTE: Respondents included 49 general managers of transit systems that currently contract.

FI
GU
RE
5
-7
Ratin
g of
ben
efits
and
pro
blem
s by g
ener
al m
anag
ers t
hat c
urre
ntly
cont
ract
and
hav
e fu
lly a
nd p
artia
lly m
et e
xpec
tatio
ns fr
omco
ntra
ctin
g, fr
om P
art 2
surv
ey re
sults
. (N
OTE:
5 =
Larg
e be
nefit
s; 4
=So
me
bene
fits;
3 =
Nei
ther
/dep
ends
; 2 =
Som
e pr
oble
ms;
1 =
Larg
e pr
oble
ms.)

Transit Contracting Experiences and Advice from General Managers 121
In retrospect, it would have been helpful to have queried those generalmanagers of systems that have stopped contracting about the extent to whichtheir expectations were met. Comparison of their responses with those of thecurrently contracting general managers might have been illuminating.
Responses on Whether General Managers Would Contract Now,Given the Choice
Responses to the final question of the survey—“If you had to do it all over again,and the choice were solely yours, would you contract for transit servicesnow?”—suggest that by and large, general managers are satisfied with their cur-rent methods of service delivery. More than 70 percent of the general managersof agencies that do not currently contract reported that they would not contractnow (see Figure 5-8). Meanwhile, nearly 80 percent of the general managers of
T A B L E 5 - 9
Negative Effects of Contracting as Reported by General Managers with Fully Met or with Partially Met or Unmet Expectations from Contracting
PercentageRespondents of Total Respondents Percentage of
with Fully Respondents with Partially Total RespondentsMet with Fully Met Met or Unmet with Partially Met or
Effect Expectations Expectations Expectations Unmet Expectations
Limited control 30 50.8 27 50.9Service quality/
customer service quality 16 27.1 30 56.6
Contractor issues 7 11.9 14 26.4Communication 13 22.0 7 13.2Turnover/low wages 7 11.9 13 24.5Need to monitor 7 11.9 10 18.9Personnel issues 7 11.9 7 13.2Public/political issues 5 8.5 8 15.1Diminishing returns 4 6.8 6 11.3Union issues 6 10.2 1 1.9Total responding 59 53
NOTE: Respondents included 112 general managers of systems that currently contract.

Contracting for Bus and Demand-Responsive Transit Services122
T A B L E 5 - 1 0
Positive Effects of Contracting as Reported by General Managers with Fully Met or with Partially Met or Unmet Expectations from Contracting
PercentageRespondents of Total Respondents Percentage of
with Fully Respondents with Partially Total RespondentsMet with Fully Met Met or Unmet with Partially Met or
Effect Expectations Expectations Expectations Unmet Expectations
Reduced operating costs 42 54.5 34 65.4
Reducedadministration 20 26.0 15 28.8
Flexibility 18 23.4 11 21.2Expertise of
contractor 14 18.2 12 23.1More service 19 24.7 4 7.7Avoidance of
capital costs 8 10.4 6 11.5Contractor handles
all 11 14.3 3 5.8Competitive
environment 6 7.8 4 7.7Reduced hiring/
staff 3 3.9 6 11.5Public image/
political 6 7.8 4 7.7Only way to start
ADA service 5 6.5 3 5.8Total responding 77 100.0 52 100.0
NOTE: Respondents included 129 general managers of systems that currently contract.
agencies that currently contract reported that they would do so now in light oftheir experiences.
These responses may reflect a degree of inertia on the part of general man-agers or a state of equilibrium in which those systems with circumstances mostsuited to contracting are currently engaged in the practice, while those with lessfavorable circumstances are providing their services directly. At the same time,however, the results reveal a certain dynamic in the decision to contract. Theysuggest that general managers of about one in seven agencies are not pleasedwith the results of contracting and would stop if able to do so, and that con-

FI
GU
RE
5
-8
Perc
enta
ge o
f gen
eral
man
ager
s re
spon
ding
to th
e Pa
rt 2
surv
ey q
uest
ion,
“If
you
had
to d
o it
all o
ver a
gain
, and
the
choi
ce w
ere
sole
ly yo
urs,
wou
ld yo
u co
ntra
ct fo
r ser
vice
s now
?”

Contracting for Bus and Demand-Responsive Transit Services124
versely, about one in five general managers of agencies that do not currentlycontract would choose to do so if given the opportunity.
Advice from General Managers Who Contract
The general managers of transit agencies that are currently contracting wereasked to offer advice to agencies that are considering contracting for the first time.Although the answers to this open-ended question were wide-ranging, it waspossible to code them into nearly 20 relevant categories, as shown in Table 5-11.In general, the advice relates to (1) the importance of taking care in decidingwhether to contract, (2) the best ways to obtain contractor services, (3) means ofproperly structuring the contract, and (4) the need for attentive monitoring and
T A B L E 5 - 1 1
Advice Offered by Contracting General Managers to General Managers Considering Contracting for the First Time
Percentage of No. of General Total General
Managers Offering Managers Advice Advice Offering Advice
Outline specific duties/responsibilities 54 46.2Specify performance requirements 47 40.2Monitor contractor performance 38 32.5Scrutinize contractors beforehand 24 20.5Talk to other agencies 23 19.7Teamwork/communication with contractor 20 17.1Competitive procedure based on more than cost 19 16.2Combine rewards and penalties 18 15.4Have a clear mechanism for making changes 14 12.0Identify elements to contract re agency goals 14 12.0Specify wage rates/cost escalation 13 11.1Penalty clauses/liquidated damages 12 10.3Begin with internal cost analysis 12 10.3Provide vehicles/facility/maintenance/eligibility 10 8.5Be flexible 10 8.5Broad involvement in proposal process 10 8.5Contractor provides vehicle/fuel/routing 5 4.3Other 18 15.4Total responding 117 100.0

Transit Contracting Experiences and Advice from General Managers 125
oversight of the contract work. In the follow-on interviews, the general managersoffered similar insights.
Decision To Contract
The general managers urged agencies that are considering contracting for thefirst time to undertake an objective and dispassionate examination of contract-ing’s advantages and disadvantages. They advised that management first iden-tify the transit services that are best suited to contracting in light of the agency’slong-term goals and the probable outcomes of contracting those services. Theyurged a rational planning process that involves considering not only the bud-getary impacts of contracting, but also the effects on service quality, workforcemotivation and morale, and flexibility to respond to new and changing servicedemands. Several general managers noted the importance of consulting withother transit agencies that have significant contracting experience to obtain abetter sense of likely effects in these areas.
Contracting Approach
Once the decision to contract has been made, the general managers urged agen-cies to consult other, experienced agencies about ways to identify, avoid, andmitigate problems with contractors. By talking with others beforehand, an agencycan obtain information about the reputation of firms bidding on contracts. Im-plicit in this recommendation is the recognition that the contracting industry isdiverse, and that individual contractors can differ widely in their qualificationsand capabilities. The advice offered in the follow-on interviews was comparable.Several of the managers indicated that stability in the contractor’s managementteam should be an especially important consideration, since changes in assignedpersonnel can affect whether the overall contracting experience is positive ornegative.
Most general managers reported that they treated bid price as just one ofmany factors weighed during the selection process. They advised basing con-tractor selection on a competitive procedure using a broader set of factors thanprice alone (where allowed by law). Several of the general managers respond-ing to the survey and participating in the follow-on interviews reported using atwo-phase approach for selecting a contractor. The first phase entails evaluationof bidder qualifications and capabilities, such as by asking contractors for tech-nical and business information on startup plans; assumptions about wage rates;
Contracting for Bus and Demand-Responsive Transit Services126
plans for hiring, training, and retaining workers; and the qualifications of theirmanagement team. Only during the second phase are bid prices evaluated,preferably with the help of an internal cost analysis to identify realistic bids.
Contract Structure
Nearly half the general managers urged specificity in defining contractor dutiesand responsibilities in the contract documents. They reported that defining asmany expectations as possible at the outset and stipulating them in the agree-ment is essential for avoiding disputes. They also noted that the contract shouldestablish a clear mechanism for making changes to the contract.
More than 40 percent of the general managers advised the inclusion of well-defined performance standards in the contract. Many urged rewards when stan-dards of performance are exceeded, but combined with penalties for poorperformance. Some recommended the inclusion of specific contract provisionsto reduce the potential for performance problems, such as the stipulation of min-imum wage rates to attract and retain quality drivers. One of the general man-agers reported that his agency does not specify wage rates, but stipulates the useof current areawide rates in bid proposals and justification for lower assumedwage levels.
Overseeing and Working with the Contractor
Monitoring of contract performance ranked third among all the areas of adviceoffered by the general managers. They noted the importance of clearly commu-nicating the agency’s intention to monitor the work and to hold the contractorresponsible for meeting agreed-upon standards. Attentive monitoring of perfor-mance was also identified as important in nearly all the follow-on interviews withgeneral managers.
In addition, recognizing that circumstances and needs can change, the gen-eral managers reported that beyond establishing a formal mechanism for mak-ing changes in contract agreements, it is important to maintain clear channelsof communication with the contractor. Here again, the follow-on interviewssuggested the importance of cultivating the relationship with the contractor byboth communicating expectations and holding the contractor to those expecta-tions in a fair and consistent manner. One general manager interviewed foundthat informal weekly meetings with contractor staff helped identify and addressincipient problems and build a stronger team relationship. Examples of efforts
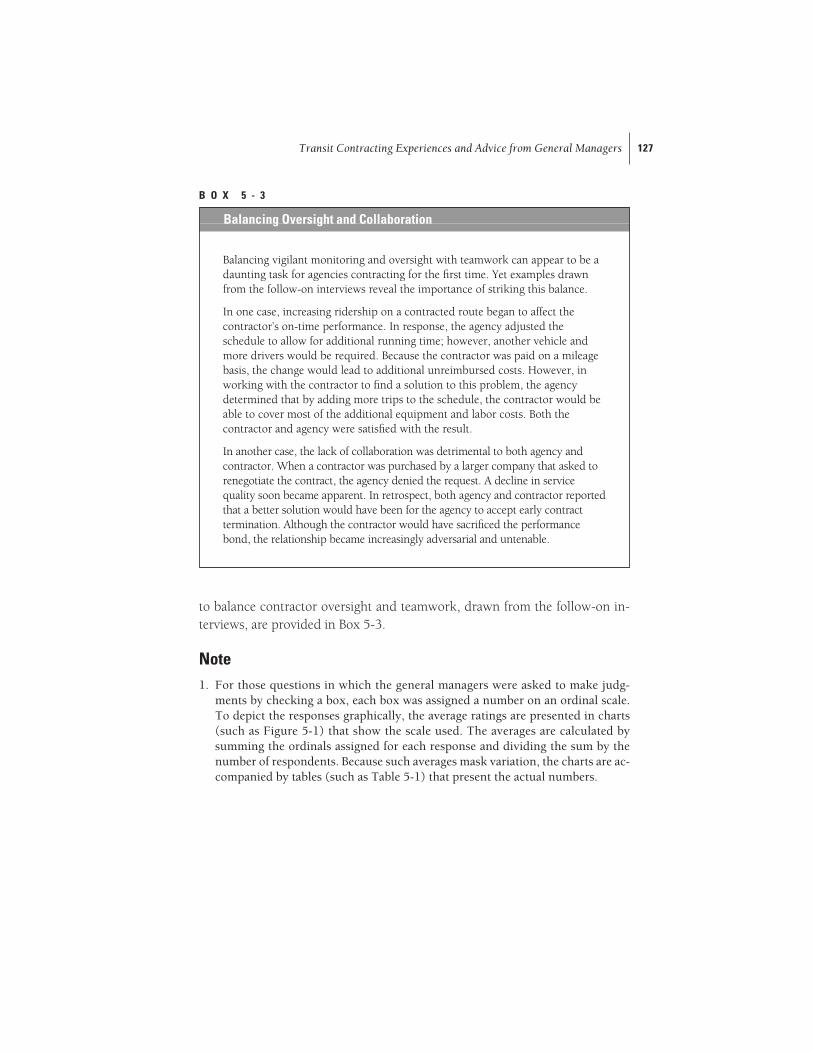
Transit Contracting Experiences and Advice from General Managers 127
to balance contractor oversight and teamwork, drawn from the follow-on in-terviews, are provided in Box 5-3.
Note1. For those questions in which the general managers were asked to make judg-
ments by checking a box, each box was assigned a number on an ordinal scale.To depict the responses graphically, the average ratings are presented in charts(such as Figure 5-1) that show the scale used. The averages are calculated bysumming the ordinals assigned for each response and dividing the sum by thenumber of respondents. Because such averages mask variation, the charts are ac-companied by tables (such as Table 5-1) that present the actual numbers.
B O X 5 - 3
Balancing Oversight and Collaboration
Balancing vigilant monitoring and oversight with teamwork can appear to be adaunting task for agencies contracting for the first time. Yet examples drawnfrom the follow-on interviews reveal the importance of striking this balance.
In one case, increasing ridership on a contracted route began to affect thecontractor’s on-time performance. In response, the agency adjusted theschedule to allow for additional running time; however, another vehicle andmore drivers would be required. Because the contractor was paid on a mileagebasis, the change would lead to additional unreimbursed costs. However, inworking with the contractor to find a solution to this problem, the agencydetermined that by adding more trips to the schedule, the contractor would beable to cover most of the additional equipment and labor costs. Both thecontractor and agency were satisfied with the result.
In another case, the lack of collaboration was detrimental to both agency andcontractor. When a contractor was purchased by a larger company that asked torenegotiate the contract, the agency denied the request. A decline in servicequality soon became apparent. In retrospect, both agency and contractor reportedthat a better solution would have been for the agency to accept early contracttermination. Although the contractor would have sacrificed the performancebond, the relationship became increasingly adversarial and untenable.

128
6 Summary and Assessment
Transit systems in the United States serve large and variedmarkets. They provide critical transportation services to theelderly and people with disabilities; carry millions of com-
muters each day; and are the main, and often only, means of mo-bility for the urban poor and others with limited access to privateautomobiles. In many urban areas, transit is seen as having an im-portant role in curbing traffic congestion and air pollution. Tran-sit systems are expected to meet these diverse user needs whilecontrolling fare levels and expenditures. In addition, they are sub-ject to a mix of economic, institutional, and political influencesthat affect the kinds of services they can offer and the means bywhich they can provide these services.
Given their varied circumstances, public transit systems em-ploy many different approaches to deliver their services. Manycontract with other organizations—often private companies—toprovide at least some services. Indeed, the public and private sec-tors have long collaborated in the provision of transit services inthe United States. For much of the 20th century, private compa-nies provided most transit services under the regulatory oversightof state and local governments. During the past four decades, themodel for transit service has changed as state and local govern-ments have assumed almost exclusive responsibility for transitplanning and funding. Many state and local governments now usetheir own facilities, equipment, and workers to deliver neededtransit services. Although the private sector’s role has diminished
6

Summary and Assessment 129
in comparison with its role during the first half of the 20th century, private en-tities still provide many transit services, usually under contract with publictransit systems.
The aim of this study was to gain a better understanding of the contractingapproach to public transit provision in its many forms. During the past 20 years,numerous studies have examined the effects of contracting on service cost andquality, usually by scrutinizing the experience of individual systems. While theresults from these studies indicate that cost savings are a main reason for con-tracting, they also point to a multitude of other reasons for the practice—fromthe desire for more flexibility in adding and withdrawing services to the specialexpertise needed for the provision of particular kinds of service, such as trans-portation for people with disabilities. Because so much contracting occurs underso many differing circumstances, it is impractical—if not impossible—to drawgeneral conclusions about the practice on the basis of a relatively small numberof system-specific studies.
To be sure, given time and resource constraints, a study-by-study evaluationwas not a practical option for this project. In any event, the committee recog-nized from the outset that a comprehensive review of past studies on contract-ing would in all probability have generated more questions than answers. Duringthe past decade, much of the debate over contracting has centered on the some-what subjective matter of what proportion of transit agency overhead expensesshould be allocated to contracted services. There is honest disagreement onwhich cost allocation model or accounting conventions are most suitable for par-ticular circumstances; thus, the models and conventions used have often variedsubstantially from study to study. Likewise, previous studies of contracting’seffects on transit safety, on-time performance, customer satisfaction, and otheraspects of service quality have varied widely in terms of study methods, as-sumptions, and data quality.
In the committee’s view, sorting out these differences among past studiesand trying to use those studies to draw conclusions on the effects of contractingtoday would have proven futile given the time and resources available. Hence,the committee elected to conduct its own nationwide survey of transit servicecontracting practices and results. More than 500 public systems that receive fed-eral transit aid were asked to report on their own experiences with contracting.Each public transit system has its own reasons for deciding whether to contract,and the systems’ general managers are in a good position to offer judgments onthe results of those decisions. Therefore, the surveyed general managers werenot given detailed instructions on how to define cost savings or measure service

Contracting for Bus and Demand-Responsive Transit Services130
quality. It was assumed that they have a sufficient understanding of their owncircumstances to identify and offer reasonable assessments of results.
At the same time, the committee recognized that these respondents are likelyto reach judgments based on their own vantage points as transit managers ratherthan as policy makers, and that they may be inclined to defend current practiceand judge alternatives differently before and after a decision has been made.Thus, it is impossible to be certain whether the general managers participatingin the survey accurately appraised the reasons their agencies contract (or do not)and the outcomes of contracting. Instead of simply acknowledging these un-certainties, it would have been desirable to control for them; however, time andresource limitations precluded a more elaborate survey and statistical analysis.Therefore, the survey results are presented here for what they are—the experi-ences and perceptions of contracting reported by general managers of hundredsof public transit systems across the United States.
Key Survey Results
The survey results are helpful in understanding the extent and methods of tran-sit service contracting in the United States, as well as the reasons some transit sys-tems contract and others do not. Although the survey findings do not paint acomplete picture of contracting practice and experience, they reveal much aboutthe amount of contracting that occurs, motivations for and deterrents to con-tracting, and levels of competition for contracted services. Collectively, the sur-vey results show that contracting is monolithic in neither practice nor outcomes,and that contracting experiences and methods are both varied and complex.
What Has Been Learned About Contracting Practices?
The survey results, augmented by National Transit Database (NTD) data col-lected by the Federal Transit Administration (FTA), provide important infor-mation on the extent of contracting among federal aid recipients, how contractsare structured, and the state of competition for contracted services.
Many transit systems contract for some services, but mainly for smallamounts and typically for demand-responsive rather than fixed-route busservices.
■ About 20 percent of all transit systems receiving federal aid contract for all theirtransit services, 40 percent contract for some, and the remaining 40 percent
Summary and Assessment 131
do not contract at all. Yet even with most systems (60 percent) contractingfor at least some service, the total amount of contracting is relatively small,accounting for about 15 percent of all bus and demand-responsive servicesprovided.
■ More than two-thirds of transit systems have contracts for demand-responsiveservices, while fewer than 40 percent contract for bus services. More thanhalf of all demand-responsive services are contracted, compared with only6 to 7 percent of bus services.
■ Large systems are more likely than small ones to contract for some transitservices, although few contract for more than 25 percent of their services. Inrelation to their absolute numbers, small systems contract less than largesystems; however, small systems are much more likely than larger ones to con-tract for all their services. Because of their small size, the former systems—often operated by municipal and county governments—contract for either allor none of their services. Large state and regional transit systems, with manymore service offerings, have greater opportunity to contract for a portion oftheir services.
Transit systems that have experience with contracting have found ways toexercise control over their contracted services and have sought ways topromote competition.
■ Most contracts are for multiyear periods, usually for 3 years with two 1-yearoptions. The duration is sufficiently long to avoid repeated costs associatedwith rebidding, but sufficiently short to discourage contractor complacency.
■ Systems usually provide the vehicles and other major assets for bus servicecontracts, and they often provide them for demand-responsive services aswell. By owning these key assets, transit systems can readily take back andrebid a service if the contractor fails to meet responsibilities and expectations.
■ Most contracts are structured to pay contractors on the basis of a predeter-mined fee per unit of output produced—usually hours of revenue service. Thecontractor is therefore responsible for controlling costs; only one-quarter ofsystems pay contractors on a cost-plus-fixed-fee basis.
■ Monetary penalties to discourage poor performance are common in con-tracts; fewer contracts contain monetary rewards for good performance.
Most contracted services are competitively bid and attract multiple bidders.
■ Most transit service contracts are awarded through competitive processes.■ Most contracts attract multiple bidders; the survey results indicate 2.8 on
average. Small systems have the most difficult time attracting multiple bidders;

Contracting for Bus and Demand-Responsive Transit Services132
such systems reported 2.5 bidders per contract on average, compared with2.9 for medium-sized systems and 3.6 for large systems.
■ The number of bidders on contracts has been stable in recent years; however,demand-responsive contracts are more likely than bus contracts to experiencea decline in bidders during rebidding.
■ The contracts of larger systems change hands more often than those of smallersystems. Many contracts continue to change hands even after they have beenrebid multiple times. Even those contracts that have had only one contractortypically continue to attract bidder interest when they are rebid.
What Has Been Learned About Contracting Experiences?
The results of the survey of general managers are highly informative about whysome transit systems contract some or all of their services, while others do notcontract at all. The results reveal many common experiences with contracting,including both positive and negative effects. They also suggest ways to makecontracting work better.
General managers of most transit systems are generally satisfied withtheir current approach to service delivery, although most have used morethan one method of delivery.
■ Nearly 80 percent of general managers of transit systems that currentlycontract reported that they would contract again given the choice. In con-trast, nearly three-quarters of general managers of transit systems that donot contract reported that they are satisfied with their current method ofservice delivery.
■ About one in seven general managers from transit systems that now contractand about one in four from systems that do not contract would change theircurrent method of service delivery if given the opportunity. About one-thirdof transit systems that do not currently contract have contracted in the past.These results suggest that the level and nature of contracting are dynamic andthat the mix of advantages and disadvantages favoring contracting or in-house methods of service provision can change for a transit system over time.
The main reasons transit systems contract for service, according to transitmanagers, are to reduce costs and increase flexibility to introduce new ser-vices. A main reason some do not contract is the desire to maintain controlover services and operations.
Summary and Assessment 133
■ Half the general managers of transit systems that currently contract reportedthat reducing costs, increasing cost-efficiency, and introducing new servicesare the most important reasons for contracting. About one-third rated as im-portant the desire to create a more competitive and flexible environment.
■ Nearly 60 percent of the general managers of transit systems that do notcontract for services reported that maintaining control over their operationsis a main reason for not contracting. About half also reported that they donot believe cost savings, if any, are sufficient to prompt them to contract.
■ Neither group of general managers—those that contract now and those thatdo not—cited the influence of policies or laws as especially important in thedecision about contracting.
General managers of most transit systems that currently contract are sat-isfied with the cost savings achieved. However, many cite problems withthe quality of the contractor workforce, employee turnover, and customerservice as negative side effects of contracting.
■ More than half the general managers from systems that are currently con-tracting identified reduced operating costs as a positive effect of the prac-tice. General managers from both small and larger systems reported thisbenefit. Those from small systems also reported benefits from reductions instaffing and administrative burdens assumed by the contractor.
■ General managers from agencies that currently contract, as well as those thathave contracted in the past, cited the loss of operational control, poor ser-vice quality, and problems with customer service as negative aspects of con-tracting. Small systems are more likely than large ones to view contractmonitoring responsibilities as problematic.
Most general managers of transit systems that currently contract believetheir contracting programs are fully or partially meeting expectations.
■ More than 55 percent of the general managers from contracting systems re-ported that their expectations from contracting have been fully met, and38 percent reported that their expectations have been partially met.
■ Nearly all general managers of systems that are now contracting reported costsavings. However, shortcomings in contractor service quality and associatedtime demands on agency staff to ensure quality are the main reasons somebelieve contracting has not fully met their expectations. More than half of thegeneral managers with partially met expectations identified service quality asan important problem. Service quality was also identified as a problem bymany general managers of systems that no longer contract.

Contracting for Bus and Demand-Responsive Transit Services134
Whether To Contract and How To Make It Work
By and large, the general managers of transit systems are satisfied with the costsavings from contracting, but less satisfied with service quality. Whether throughtrial and error or through preparation and foresight, the general managers ofthose systems that contract today have learned how to make their contractingprograms work better to achieve cost savings and acceptable service quality. Inparticular, they offered the following advice to other general managers who maybe considering contracting.
Anticipate the benefits and costs of contracting, and set realistic expec-tations.
■ Take an open-minded and realistic view of contracting’s advantages and dis-advantages. Conduct a full analysis of the likely consequences—not only byexamining budgetary effects, but also by weighing potential effects on ser-vice quality, workforce motivation and morale, and flexibility to respond tonew and changing service demands.
■ Consider various approaches to structuring contracts, including the optionof providing vehicles, facilities, and other costly assets. The contract shouldbe structured to prompt sufficient competition and allow the agency to takethe service back should the contractor fail to meet expectations.
■ Conduct a review of the costs and effects of providing services directly, anduse this information to evaluate all contracting options.
Establish a competitive procurement process that invites high-quality pro-posals and screens out unrealistic proposals and unqualified contractors.
■ Scrutinize contractors beforehand, through both formal and informal means.In particular, seek out other transit systems to discuss their contracting expe-riences in general with individual contractors.
■ Review proposals carefully. Begin with a process that reveals the capabilitiesof prospective contractors—for instance, by asking contractors for technicaland business information on startup plans; assumptions about wage rates;plans for hiring, training, and retaining workers; and the qualifications oftheir management team.
■ Make internal estimates of service costs, and use this information as a base-line in assessing the credibility of contractor proposals, including those thatare priced too high and those that are priced too low.
Clearly spell out all contractor responsibilities, closely monitor perfor-mance, and communicate with the contractor.

Summary and Assessment 135
■ Outline all of the duties and roles of all parties to the contract. Establish aclear mechanism for making changes in contract agreements, and define allexpectations with respect to service quality.
■ Include penalty clauses and rewards in contracts to motivate good per-formance.
■ Routinely monitor contractor performance, and provide the contractor withcandid and frequent feedback.
■ Maintain an open and collaborative relationship with the contractor.
Insights and Ideas for Further Evaluation
In preparing this report, the committee has been careful to present only find-ings that are directly substantiated by the information gathered during thecourse of the study, particularly from the survey findings. These findings havebeen presented in Chapters 4 and 5 and summarized above.
However, the richness of the committee’s insights extends beyond thesefindings. Each of its 12 members is knowledgeable about contracting experi-ences across the country; thus each joined the committee with well-foundedviews on transit contracting. During a period of 10 months, the committee metfive times and communicated frequently through telephone conference callsand e-mail. Emerging from this extensive interaction was a consensus thatreached beyond the empirical results obtained during the study. These insightsare offered in the remainder of this chapter. First is a discussion of some of theadditional information the committee would like to have had during the courseof the study—information that was not recognized as being important untilafter deliberation of the survey results. This is followed by the committee’s ownideas—or hypotheses for further evaluation—on how transit contracting is oc-curring and evolving in the United States.
Additional Information Needed
As is the case with all research efforts, the committee’s work raised questionsthat could not be addressed adequately during the course of its deliberations.Several issues arose repeatedly and warrant further attention.
First, the transit general managers who responded to the survey were notasked to offer assessments of the cost and performance of their internal, directlyprovided services. In designing the survey, it was necessary to balance the de-sire for more information with the need for a survey that would not be overly
Contracting for Bus and Demand-Responsive Transit Services136
burdensome. Nevertheless, information on each agency’s satisfaction with in-ternal operations would undoubtedly have been helpful in providing an ap-propriate context for examining the general managers’ reports about benefitsand problems associated with contracting.
Second, it would have been desirable to have more information on the ex-tent to which the political and policy environments affected the decision to con-tract. Again, survey recipients were intentionally asked for a limited amount ofinformation. Although the survey did address the effect of policies and laws oncontracting, the level of detail in the responses was insufficient to support a gen-eral conclusion about the influence of the political and policy environments oncontracting decisions. The survey was distributed to general managers, whohave a particular vantage point and are but one group of individuals involvedin the contracting decision. The experiences of individual committee memberssuggest that the political and policy environments, especially at the local level,can be important influences on the decision whether to contract. More infor-mation derived from a wider range of participants in transit policy making isneeded to appraise political influences on the decision to contract.
Third, the committee was unable to determine with any specificity themagnitude of the cost savings from contracting and whether they change overtime, nor were respondents asked to verify their perceptions of cost savings.As discussed above, the committee relied on the general managers to use theirbest judgment, and did not advise them on what constitutes cost savings orhow to calculate those savings. The committee believes that follow-on studiesaimed at quantifying the effects of contracting on transit operating and ad-ministrative costs, service reliability, safety performance, and other factors af-fecting the level and quality of service (such as labor productivity and relations)are warranted and will benefit from the information obtained from the surveyconducted for the present study.
Finally, the committee did not examine the structure of the contracting in-dustry to assess how trends toward industry consolidation may affect compe-tition in the years ahead. The survey results provide a snapshot of conditionstoday and in the recent past. The committee does not know, nor can it predict,how the overall state of competition in the industry will change over time.
Ideas for Follow-On Study
Contracting is a dynamic undertaking: some transit systems are contracting,others are not, and some are about to undertake or discontinue the practice.
Summary and Assessment 137
Individual circumstances can change over time, affecting the comparative ad-vantages of contracting and direct service provision, or creating an opportu-nity for some other method of service delivery. The data gathered by thecommittee suggest that contracting, at least as perceived by the general man-agers surveyed, often entails a trade-off between cost containment and servicequality. That some services are taken back in house may be the result of costdifferentials diminishing over time. In other cases, the original desire to achievecost savings or increase the amount of service through contracting may be re-placed by a greater emphasis on improving service quality. As transit systemsexert more control over service quality by imposing stringent quality require-ments in contracts, it is reasonable to assume that contractor costs will increaseover time. At the same time, labor unions may agree to changes in collective bar-gaining agreements that make direct service provision more cost-competitive,blunting differences between in-house and contractor costs.
A final and related insight concerns the nature of transit contracting. Asdiscussed in Chapter 3, there is evidence that certain aspects of transit servicecontracting are difficult to articulate in a written agreement. As an example,transit systems can come to value particular qualities of individual contractorsthat cannot readily be specified in a request for proposals or a contract docu-ment; a transit manager may, for instance, be reluctant to switch from a con-tractor that provides demand-responsive services with few complaints fromcustomers. The continuation of such relationships may be advantageous to rid-ers as well as to the agency and contractor involved. The extent to which suchservice contracting relationships exist today in the transit industry and can befostered and maintained to the benefit of riders deserves further considerationin follow-on studies.

138
AAA P P E N D I X
Transit Contracting and Privatization Initiatives inWestern Europe
While transit contracting has long existed but in-creased only slightly in the United States during thepast decade, it has grown much more rapidly in
Western Europe, where it was rare as recently as 15 years ago.Several European countries, including France and Great Britain,introduced privatization measures during the 1980s; during thepast decade, many other European countries have followed suit,though in different ways. European Union (EU) requirements toopen quasigovernmental activities to competition by public andprivate suppliers from all member countries have promptedsome of these changes, as have concerns about rising transit ex-penditures during the 1980s and 1990s.
Many of Europe’s transit modes, as well as intercity passen-ger rail, have been affected. This appendix provides a brief over-view of circumstances in several Western European countries,focusing on bus services.1 Table A-1 summarizes public- andprivate-sector roles in transit provision in the United States,Canada, and five EU countries.
It should be noted that many studies have examined the ef-fects of bus privatization, deregulation, and competitive contract-ing on transit fares, ridership, and service quality in Great Britainand elsewhere in Western Europe. A review of the internationalexperience with transit privatization and contracting is beyondthe scope and resources of the present study. This appendix is
(text continues on page 143)

TA
BL
E
A-
1
Publ
ic- a
nd P
riva
te-S
ecto
r Rol
es in
Pro
vidi
ng P
ublic
Tra
nsit
Serv
ice
in th
e U
nite
d St
ates
, Can
ada,
and
Sel
ecte
d Co
untr
ies
ofW
este
rn E
urop
e
Coun
tryN
atio
nal R
ole
Stat
e an
d Re
gion
al R
ole
Loca
l Rol
ePr
ivat
e-Se
ctor
Rol
e
The
fede
ral g
over
nmen
t pro
-vi
des s
tate
and
loca
l gov
-er
nmen
ts w
ith a
id fo
r the
prov
isio
n of
tran
sit i
nfra
-st
ruct
ure
and
equi
pmen
t,co
ntrib
utin
g ab
out h
alf o
ftra
nsit
capi
tal f
unds
. Asm
all s
hare
of o
pera
ting
reve
nues
is p
rovi
ded
byth
e fe
dera
l gov
ernm
ent
(the
shar
e is
larg
est f
orsm
all t
rans
it sy
stem
s).
Man
y sta
tes p
rovi
de re
venu
efo
r tra
nsit
capi
tal a
nd o
p-er
atio
ns. A
few
hav
e st
ate
trans
it ag
enci
es w
ith o
p-er
atin
g au
thor
ity. M
ost
have
est
ablis
hed
regi
onal
trans
it di
stric
ts fo
r eac
hm
etro
polit
an a
rea.
Sta
te-
appr
oved
regi
onal
taxe
s(s
uch
as sa
les t
axes
) are
som
etim
es u
sed
to g
ener
-at
e th
e re
venu
e fo
r maj
orca
pita
l im
prov
emen
ts o
rop
erat
ing
subs
idie
s.
Coun
ty a
nd ci
ty g
over
nmen
tsof
ten
prov
ide
oper
atin
gsu
bsid
ies f
or re
gion
altra
nsit
agen
cies
. The
rev-
enue
is d
eriv
ed fr
om lo
cal
prop
erty
taxe
s, sa
les
taxe
s, a
nd o
ther
loca
lso
urce
s. T
rans
it is
som
e-tim
es o
rgan
ized
at th
eco
unty
or c
ity le
vel,
rath
erth
an th
e re
gion
al le
vel.
Priv
ate
trans
it co
ntra
ctin
g is
com
mon
in so
me
stat
esan
d m
ost p
reva
lent
in C
al-
iforn
ia. P
rivat
e bu
sine
sses
com
pete
to p
rovi
de sp
e-ci
fic tr
ansi
t ser
vice
s (or
man
agem
ent f
unct
ions
)th
at a
re p
aid
for a
nd p
re-
scrib
ed b
y sta
te a
nd lo
cal
gove
rnm
ents
or b
y pub
lictra
nsit
auth
oriti
es. T
hepr
actic
e is
mos
t com
mon
for s
peci
alize
d tra
nsit
ser-
vice
s suc
h as
par
atra
nsit
and
supp
ort s
ervi
ces s
uch
as m
aint
enan
ce. A
smal
lnu
mbe
r of l
arge
r sys
tem
sco
ntra
ct o
n a
mor
e w
ide-
spre
ad b
asis
for fi
xed-
rate
serv
ice.
Uni
ted
Stat
es
(con
tinue
d)

TA
BL
E
A-
1
(con
tinue
d)
Publ
ic- a
nd P
riva
te-S
ecto
r Rol
es in
Pro
vidi
ng P
ublic
Tra
nsit
Serv
ice
in th
e U
nite
d St
ates
, Can
ada,
and
Sel
ecte
d Co
untr
ies
ofW
este
rn E
urop
e
Coun
tryN
atio
nal R
ole
Stat
e an
d Re
gion
al R
ole
Loca
l Rol
ePr
ivat
e-Se
ctor
Rol
e
The
natio
nal g
over
nmen
t has
no ro
le in
tran
sit f
undi
ng,
orga
niza
tion,
or p
lann
ing,
exce
pt fo
r som
e re
sear
chan
d de
velo
pmen
t pro
-gr
ams.
The
natio
nal g
over
nmen
t pro
-vi
des s
tate
s (Lä
nder
) with
bloc
k fun
ds th
at ca
n be
used
to su
bsid
ize co
m-
mut
er ra
il se
rvic
es o
rot
herw
ise
empl
oyed
by
loca
l gov
ernm
ents
to fu
ndm
ass t
rans
it. T
he fe
dera
lgo
vern
men
t als
o co
n-tri
bute
s aid
to sp
ecifi
c
The
Cana
dian
pro
vinc
es h
ave
tradi
tiona
lly p
rovi
ded
sig-
nific
ant (
abou
t hal
f) ca
pita
lan
d op
erat
ing
subs
idie
sfo
r urb
an tr
ansi
t, al
thou
ghth
is re
spon
sibi
lity h
as in
-cr
easi
ngly
bee
n sh
ifted
tom
etro
polit
an a
nd m
unic
i-pa
l gov
ernm
ents
.
Stat
es su
bsid
ize co
mm
uter
rail
and
prov
ide
loca
l gov
-er
nmen
t with
fund
s for
trans
it. S
tate
s cov
er a
bout
half
the
cost
of p
rovi
ding
and
mai
ntai
ning
railw
ayin
frast
ruct
ure.
Sta
tes s
etm
inim
um tr
ansi
t ser
vice
leve
l req
uire
men
ts to
be
met
by l
ocal
gov
ernm
ents
.
Regi
onal
met
ropo
litan
gov
-er
nmen
ts a
nd th
eir c
on-
stitu
ent m
unic
ipal
ities
prov
ide
mos
t tra
nsit
ser-
vice
s with
fund
ing
supp
ort
from
the
prov
ince
. Rev
-en
ues a
re a
lso
deriv
edfro
m p
rope
rty ta
xes l
evie
din
spec
ial “
trans
it as
sess
-m
ent”
dis
trict
s. S
ome
indi
vidu
al ci
ties a
nd m
u-ni
cipa
litie
s als
o pr
ovid
etra
nsit
serv
ices
, for
in-
stan
ce th
roug
h pu
blic
util
-ity
com
mis
sion
s.
Man
y loc
al g
over
nmen
ts a
l-lo
cate
stat
e an
d fe
dera
ltra
nsit
fund
s to
regi
onal
coop
erat
ives
of t
rans
it op
erat
ors k
now
n as
“ver
kehr
sver
bund
s”(V
VBs)
. The
VVB
s coo
rdi-
nate
the
prov
isio
n of
tran
-si
t ser
vice
s ove
r the
ent
irere
gion
and
real
loca
te
The
priv
ate
sect
or h
as a
limite
d ro
le in
the
prov
i-si
on o
f tra
nsit.
Priv
ate
cont
ract
ors s
uppl
y som
ese
rvic
es p
resc
ribed
by t
hepu
blic
-sec
tor t
rans
it ag
enci
es.
The
priv
ate
sect
or is
incr
eas-
ingl
y bei
ng ca
lled
upon
toco
mpe
te fo
r con
tract
wor
k. T
he S
wed
ish
mod
elof
priv
ate
cont
ract
ing
or“t
ende
ring”
on
a ro
ute-
by-
rout
e ba
sis i
s bec
omin
gm
ore
com
mon
.
Cana
da
Ger
man
y

capi
tal p
roje
cts,
with
stat
ean
d lo
cal g
over
nmen
tsh
arin
g in
the
cost
usi
ngre
venu
es d
eriv
ed fr
omm
otor
fuel
taxe
s.
The
natio
nal g
over
nmen
t fi-
nanc
es tr
ansi
t dire
ctly
inth
e ca
pita
l of P
aris
and
surro
undi
ng su
burb
s. N
a-tio
nal s
ubsi
dies
are
min
i-m
al in
the
prov
ince
s,ho
wev
er, w
ith th
e ex
cep-
tion
of fu
ndin
g fo
r lar
gera
il tra
nsit
addi
tions
or
impr
ovem
ents
.
The
natio
nal g
over
nmen
t’sco
ntrib
utio
n is
lim
ited
mai
nly t
o th
e fu
ndin
g of
maj
or ra
il in
frast
ruct
ure
proj
ects
.
Tran
sit i
s org
anize
d at
the
re-
gion
al le
vel b
y the
prov
ince
or b
y gro
ups o
fm
unic
ipal
ities
.
Coun
ty g
over
nmen
ts h
ave
prim
ary
resp
onsi
bilit
y fo
rtra
nsit
oper
atin
g an
d ca
pi-
tal s
ubsi
dies
and
for t
hepl
anni
ng o
f ser
vice
s. S
ub-
sidi
es a
re a
lloca
ted
tolo
cal g
over
nmen
t for
the
proc
urem
ent o
f tra
nsit
serv
ices
.
fund
s am
ong
indi
vidu
alop
erat
ors.
Loca
l gov
ernm
ents
hav
e th
em
ain
resp
onsi
bilit
y for
subs
idizi
ng b
us a
nd ra
ilse
rvic
e (c
apita
l and
ope
ra-
tions
) usi
ng re
venu
es fr
omem
ploy
er p
ayro
ll ta
xes a
p-pr
oved
by t
he n
atio
nal
gove
rnm
ent.
Taxe
s may
be
as h
igh
as 4
0 pe
rcen
t of
an e
mpl
oyer
’s p
ayro
ll.
Loca
l gov
ernm
ents
are
re-
spon
sibl
e fo
r pro
curin
gth
e se
rvic
es o
f priv
ate
cont
ract
ors.
The
y co
n-tri
bute
abo
ut h
alf o
f the
oper
atin
g su
bsid
y re
-qu
ired
(exc
ept i
n th
eSt
ockh
olm
are
a, w
here
the
coun
ty c
ontri
bute
s al
lof
the
subs
idy
and
has
sole
resp
onsi
bilit
y fo
rpl
anni
ng a
nd p
rocu
ring
trans
it se
rvic
es).
A sm
all n
umbe
r of l
arge
pri-
vate
bus
com
pani
es o
per-
ate
serv
ice
franc
hise
s in
mun
icip
aliti
es. T
he co
m-
pani
es co
mpe
te to
pro
vide
serv
ice
over
ent
ire n
et-
wor
ks (a
s opp
osed
toro
utes
) and
they
are
sub-
sidi
zed
by lo
cal g
over
n-m
ents
. The
se co
mpa
nies
usua
lly o
wn
thei
r ow
neq
uipm
ent a
nd h
ave
long
-te
rm co
ntra
cts.
Priv
ate
com
pani
es b
id fo
rse
rvic
e on
spec
ific r
oute
s,ac
cord
ing
to fa
re, s
ervi
ce,
and
sche
dule
par
amet
ers
pres
crib
ed b
y the
loca
l au
thor
ity. R
ail a
nd b
us
oper
atio
ns a
re co
ntra
cted
out.
The
publ
ic se
ctor
pre
-sc
ribes
the
rout
e an
d fa
resc
hedu
les t
o be
adh
ered
to a
nd o
ften
owns
the
equi
pmen
t and
oth
er n
ec-
essa
ry in
frast
ruct
ure.
Fran
ce
Swed
en
(con
tinue
d)
Transit Contracting and Privatization Initiatives in Western Europe 141

TA
BL
E
A-
1
(con
tinue
d)
Publ
ic- a
nd P
riva
te-S
ecto
r Rol
es in
Pro
vidi
ng P
ublic
Tra
nsit
Serv
ice
in th
e U
nite
d St
ates
, Can
ada,
and
Sel
ecte
d Co
untr
ies
ofW
este
rn E
urop
e
Coun
tryN
atio
nal R
ole
Stat
e an
d Re
gion
al R
ole
Loca
l Rol
ePr
ivat
e-Se
ctor
Rol
e
The
natio
nal g
over
nmen
t has
prim
ary r
espo
nsib
ility
for
fund
ing
rail
and
bus t
ran-
sit i
n gr
eate
r Lon
don.
Ital
so su
bsid
izes c
omm
uter
rail
outs
ide
Lond
on b
y pro
-vi
ding
fund
s to
loca
l pa
ssen
ger t
rans
port
auth
oriti
es. I
n ot
her a
reas
,lo
cal a
utho
ritie
s sup
port
som
e tra
nsit
serv
ices
with
gran
t aid
from
the
natio
nal
gove
rnm
ent.
The
natio
nal g
over
nmen
t pro
-vi
des m
ost t
rans
it su
bsi-
dies
, con
tribu
ting
to b
oth
oper
atio
ns a
nd ca
pita
l. It
also
sets
fare
and
serv
ice
polic
ies.
Loca
l gov
ernm
ents
(e.g
.,co
untie
s) su
bsid
ize a
smal
lnu
mbe
r of b
us ro
utes
des
-ig
nate
d by
pas
seng
ertra
nspo
rt au
thor
ities
as
“soc
ially
nec
essa
ry.”
Loca
lau
thor
ities
als
o fu
nd co
n-ce
ssio
nary
fare
s for
stu-
dent
s, th
e di
sabl
ed, a
ndth
e el
derly
.
Loca
l gov
ernm
ents
hav
e m
in-
imal
fund
ing
resp
onsi
bilit
ybu
t are
resp
onsi
ble
for
tend
erin
g pr
ivat
e-se
ctor
serv
ices
and
ens
urin
g pe
r-fo
rman
ce.
Bus s
ervi
ces o
utsi
de Lo
ndon
are
larg
ely p
rivat
e, u
n-re
gula
ted,
and
uns
ubsi
-di
zed
exce
pt fo
r pub
licfu
nds p
rovi
ded
to p
rivat
eop
erat
ors f
or “s
ocia
llyne
cess
ary”
serv
ices
. Pri-
vate
bus
com
pani
es p
ro-
vide
ligh
tly su
bsid
ized
cont
ract
serv
ices
ingr
eate
r Lon
don.
Priv
ate
com
pani
es a
re in
-cr
easi
ngly
bei
ng ca
lled
upon
to co
mpe
te fo
r con
-tra
ct se
rvic
es.
Gre
at B
rita
in
Net
herl
ands
SOUR
CE: T
RB 2
001.

Transit Contracting and Privatization Initiatives in Western Europe 143
offered as background, and no attempt is made to review the results of otherstudies.
Great Britain
By far the most dramatic movement toward transit privatization has taken placein Great Britain. In 1985, legislation passed by the British Parliament deregu-lated motor bus services throughout the country, with the exception of thegreater London metropolitan area. Local transportation authorities were dis-banded, and public transit operations were privatized and many of their assetssold. Although the government retained safety rules and licensing authorities,it divested and deregulated the industry commercially. The newly for-profitoperators were allowed to enter and exit markets as they wished, establish theirown timetables and networks, set their own fares, and choose their own equip-ment. Local authorities were tasked with maintaining sufficient bus stands andshelters; obtaining and subsidizing contracted services on a small number of“socially necessary” but unprofitable routes; and reimbursing bus companiesfor the discounted fares offered students, the elderly, and people with disabili-ties. Otherwise, private operators had to cover their own capital and operatingcosts without public assistance and at their own risk. The national governmentprovided a small subsidy in the form of fuel rebates.
When deregulation was passed, the original plan was to gradually instillmore competition in the bus operations of greater London, and eventually pri-vatize and deregulate that system in the same manner as elsewhere. LondonTransport, the public transport authority, was charged with contracting out, ortendering, bus services with as little public assistance as possible. A subsidiaryunit (the Tendered Bus Division) was created and charged with obtaining thepurchased bus services, while London Transport retained responsibility forroute planning and setting of fares. The once-public bus fleets were convertedto a subsidiary, known as London Buses Limited (LBL), and were required tocompete with private companies for the opportunity to serve specific routes ina progressive process aimed at increasing the amount of tendering. Routes wereawarded to the operator that could run the best service at the lowest subsidyprice, and several of the initial routes went to private companies rather than tothe newly created LBL.
The LBL initially faced several problems resulting from higher overhead thatmade it difficult to compete with the leaner private operators. To address thisproblem, and as a step toward the still-planned deregulation of buses in greater

Contracting for Bus and Demand-Responsive Transit Services144
London, the LBL created 13 locally based subsidiary companies. They conductedtheir own wage negotiations with the unions, took actions to reduce overhead,and competed against each other as well as against the private companies for buscontracts. The subsidiaries became increasingly successful in competing forroutes, which are typically rebid at 5-year intervals. The LBL subsidiaries werefully privatized in 1994 as the companies were sold to other bus operators, man-agement, and employees.
Partly because of the success with tendering, the national government hasabandoned plans to extend the deregulation of bus services to London. De-regulation continues elsewhere, although the national government has takensome regulatory steps to improve bus service quality, and local passenger trans-portation authorities have been restored in most urban areas to improve over-all transport planning.
Germany
The federal and state governments of Germany have been seeking to instill morecompetition in the provision of public transit. Rather than subsidizing transitservices directly, they have increasingly been offering municipalities and otherlocal jurisdictions block grants to provide transit and other public services. Tomake the most of these funds, local governments have been experimenting withcontracted services, as well as the privatization of some bus companies.
In most cases, the local government franchises designate routes for specificperiods of time, usually lasting no more than 8 years. This is done on a route-by-route basis, meaning that the services of several operators make up the over-all network for an urban area. During the franchise period, the operator isprotected from competition on the route (and on parallel routes), but is obli-gated to provide service at specified frequencies and within prescribed fare andquality levels. After the term has expired, the operator can apply for renewalalong with other competing operators. Where projected service costs exceedprojected fare revenues, local authorities seek competitive bids and award thefranchise to operators requiring the least public subsidy.
Transit operators in many of the large urban areas of Germany are able tocover their operating costs through fare box revenues, especially when thegovernment reimbursement for the discounted fares offered to students andthe disabled is included. In many localities, however, bus operations are cross-subsidized with the revenues generated by their parent or partner electric andgas utilities. This situation has become problematic, viewed as protective by

Transit Contracting and Privatization Initiatives in Western Europe 145
the EU. Although services that are directly operated by government are not sub-ject to EU requirements for market competition, many of the transit operatorsand utilities in Germany are private, albeit regulated, entities. Changes are stillbeing negotiated among EU members.
Scandinavia
Next to Great Britain, Sweden has proceeded further than any other Europeancountry in privatizing once-public transit services. Prior to 1989, local transitauthorities in each of Sweden’s 23 counties (and the Municipality of Stockholm)provided exclusive operating licenses to individual transit operators. Thesecompanies were usually owned by the county and local jurisdictions. The sys-tem of licensing was abolished by the national government in 1989, and coun-ties were encouraged to open their transit markets to competition. Most countyand local governments, required to pay for all transit capital and operations outof their own budgets, elected to seek competitive bids from other operators ona route-by-route basis. Low price (that is, lowest required public payment) isusually the deciding factor in awarding contracts to bidders, who are typicallygiven exclusive authority to provide the service for a period of 3 to 5 years. Theoperator is provided a fixed sum by the government, which receives the pas-senger revenues. Contract incentive schemes to encourage operators to attractmore patrons, including a percentage of collected revenues, are becoming morecommon. Many of the Swedish bus operators are now subsidiaries of largeBritish and French transport companies.
Denmark has also increased its use of contracting for bus services, althoughon a more incremental basis than in Sweden. Outside of the Capital Region ofCopenhagen, regional transport authorities issue licenses to individual opera-tors for service in specific areas. Routes, schedules, fares, and other conditionsof service are established by the authority. The duration of most licenses is 5 to8 years. Legislation passed in 1989 requires that tendering be used increasinglywithin Copenhagen for bus services. Copenhagen Transport, the regional trans-portation authority, is obliged to seek competitive tenders for two-thirds of thebus services in the region. The tenders are sought on a route-by-route basis.Copenhagen Transport, which has its own bus division, is not allowed to placebids. Its function has become increasingly oriented toward planning and policymaking, overseeing of the placement of tendered services, design and integrationof the network, and establishment of fares. The authority is also responsible formarketing and ensuring conformity in service quality. National legislation re-

Contracting for Bus and Demand-Responsive Transit Services146
quires that all bus services in Copenhagen be provided by private companies asof July 2002.
France, Belgium, and the Netherlands
Transit services in the Capital Region of Paris are provided almost exclusivelyby the government, funded at the national level. Decentralization laws passedin France during the early 1980s, however, leave it to local authorities to pro-vide public transportation. Local authorities can consist of a single municipal-ity or several acting together. Each authority establishes an “urban transportperimeter,” or PTU, in which it can levy a tax on employers for transportationfunding. PTUs—which total more than 150—may provide the transit servicedirectly. However, national legislation passed in 1993 requires that any PTUthat chooses to delegate its transit service to another entity must publish a callfor bids from competing operators. These tenders are usually offered for theentire network rather than on a route-by-route basis, as is common elsewherein the EU. As a result of this rule, public transit operators in France consist ofa mix of public, private, and semiprivate companies. Even in those PTUs thathave opted for direct provision of service, management of the operations isusually delegated to a private company.
In neighboring Belgium, responsibility for urban transit lies with regionalgovernments. Each region has its own approach to providing the service, someusing contracting more than others. For instance, very little contracting goes onin the Brussels Capital Region, in which transit services are provided by the pub-licly owned regional Interdistrict Transport Company. In most other regions,however, a portion of public transit service is contracted out, usually on the basisof payments per vehicle-kilometer of service and subject to the meeting of spec-ified service standards. Approximately 40 percent of bus services in Flanders iscontracted to private firms from Belgium, which are often family-run enterprises.
Further north in the Netherlands, the institutional organization of publictransit is highly centralized within the national Ministry of Transport. The min-istry allocates funds as well as operating subsidies to the country’s transit infra-structure. The Netherlands has eight municipal transit companies and severalregional ones for smaller urban areas; each operates within its designatedboundaries without competition. The Dutch government has experimentedwith tendering during the past decade, but on a very limited basis for interurbanand demand-responsive operations.

Transit Contracting and Privatization Initiatives in Western Europe 147
Note1. Much of the information presented here about transit contracting in the Euro-
pean Union was obtained from UITP 1997.
ReferencesABBREVIATIONS
TRB Transportation Research BoardUITP Union Internationale des Transports Publics
TRB. 2001. Special Report 257: Making Transit Work: Insight from Western Europe,Canada, and the United States. National Research Council, Washington, D.C.
UITP. 1997. Major European Players in Public Transport: New Developments in theEuropean Union. Brussels, Belgium.

148
BBA P P E N D I X
Transit Contracting SurveyParts 1 and 2 with List of Recipients and Respondents
The survey instruments sent to transit systems (Part 1) andtheir general managers (Part 2) nationwide for this studyare reproduced in reduced size on the following pages.
Table B-1 lists all systems that received the surveys and indicateswhich parts were completed and returned.
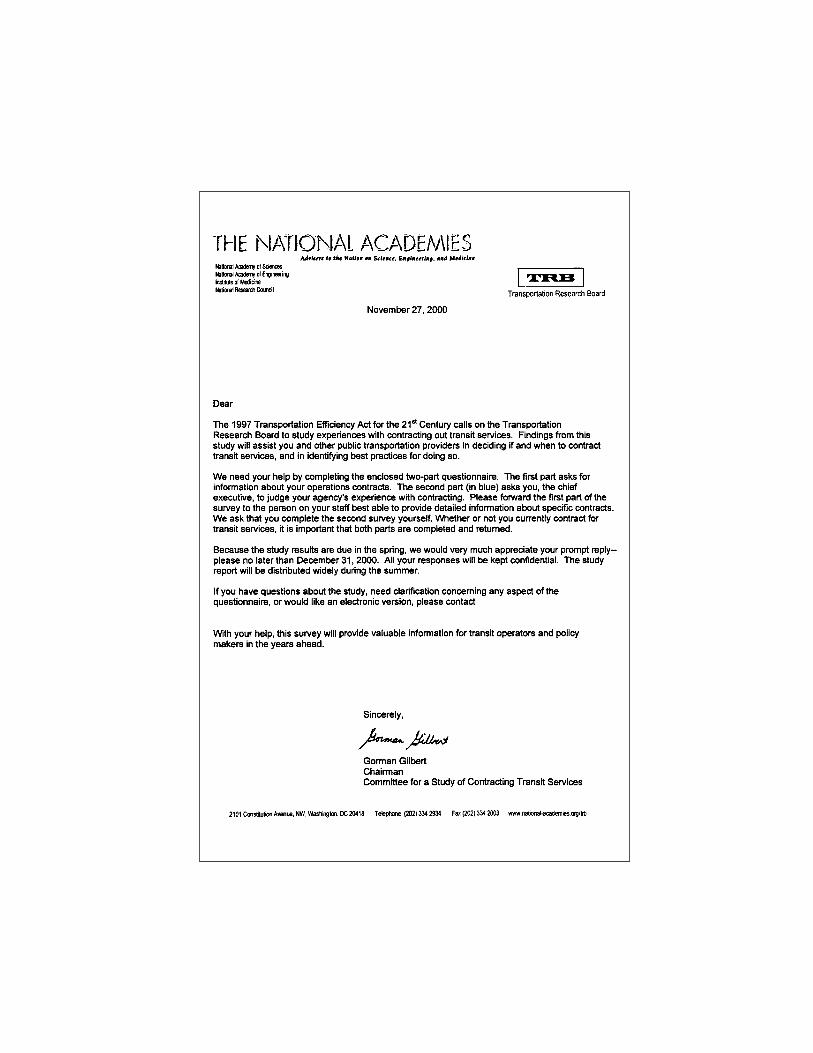


Transit Contracting Survey Parts 1 and 2 with List of Recipients and Respondents 151


Contracting for Bus and Demand-Responsive Transit Services154


Transit Contracting Survey Parts 1 and 2 with List of Recipients and Respondents 157


Contracting for Bus and Demand-Responsive Transit Services160


Transit Contracting Survey Parts 1 and 2 with List of Recipients and Respondents 163


T A B L E B - 1
Recipients and Respondents to Parts 1 and 2 of Survey
FTADesignator Federal Grant Recipient City State Part 1 Part 2
0001 King County Department of Seattle WA X XTransportation–MetroTransit Div.
0002 Spokane Transit Authority Spokane WA X X0003 Pierce Transit Tacoma WA X X0005 Everett Transit Everett WA X X0006 Yakima Transit Yakima WA0007 Lane Transit District Eugene OR X X0008 Tri-County Metropolitan Portland OR X X
Transportation Dist. of Oregon
0011 Boise Urban Stages Boise ID0012 Municipality of Anchorage- Anchorage AK
Public Transportation Department
0016 Community Urban Bus Service Longview WA0018 Ben Franklin Transit Richland WA0019 Intercity Transit Olympia WA0020 Kitsap Transit Bremerton WA X X0021 Whatcom Transportation Bellingham WA
Authority0022 City of Pocatello, Pocatello Pocatello ID
Regional Transit 0023 City of Seattle–Monorail Transit Seattle WA0024 Clark County Public Vancouver WA X X
Transportation Benefit Area Authority
0025 Salem Area Mass Transit Salem OR X XDistrict
0028 Pierce County Ferry Operations Tacoma WA X X0029 Snohomish County Everett WA X X
Transportation Benefit Area Corporation
0033 Senior Services of Snohomish Mukilteo WA XCounty
0034 Rogue Valley Transit District Medford OR0035 Washington State Ferries Seattle WA X X0040 Central Puget Sound Regional Seattle WA
Transit Authority
(continued )

Contracting for Bus and Demand-Responsive Transit Services166
1001 Rhode Island Public Transit Providence RIAuthority
1002 Manchester Transit Authority Manchester NH1003 Massachusetts Bay Boston MA X X
Transportation Authority 1004 Brockton Area Transit Authority Brockton MA1005 Lowell Regional Transit Lowell MA
Authority1006 Southeastern Regional Transit New Bedford MA
Authority1007 Berkshire Regional Transit Pittsfield MA
Authority1008 Pioneer Valley Transit Springfield MA
Authority1013 Merrimack Valley Regional Haverhill MA
Transit Authority 1014 Worcester Regional Transit Worcester MA
Authority1016 Greater Portland Transit District Portland ME1017 Greater Hartford Transit District Hartford CT1040 Southeast Area Transit Norwich CT1042 Valley Transit District Derby CT X1048 Connecticut Transit-Hartford Hartford CT X X
Division1049 The Greater New Haven Hamden CT X X
Transit District 1050 Greater Bridgeport Transit Bridgeport CT X X
Authority1051 Housatonic Area Regional Danbury CT X
Transit1053 Cape Ann Transportation Gloucester MA
Authority1057 Norwalk Transit District Norwalk CT1060 Town of New Milford New New Milford CT X X
Milford Senior Center 1061 Montachusett Regional Fitchburg MA X X
Transit Authority 1063 Middletown Transit District Middletown CT X X
T A B L E B - 1 (continued)
Recipients and Respondents to Parts 1 and 2 of Survey
FTADesignator Federal Grant Recipient City State Part 1 Part 2

1064 Greater Attleboro–Taunton Attleboro MARegional Transit Authority
1066 Chittenden County Burlington VTTransportation Authority
1086 Cooperative Alliance for Portsmouth NHSeacoast Transportation
1087 Nashua Transit System Nashua NH1088 Casco Bay Island Transit Portland ME X X
District1096 City of Bangor Bangor ME1098 Western Maine Transportation Mexico ME
Services, Inc. 1099 York County Community Action Sanford ME X X
Corp.1102 Connecticut Department of Newington CT X X
Transportation1103 City of Stamford Dial-A-Ride Stamford CT1104 Greater Waterbury Transit Waterbury CT
District1105 Cape Cod Regional Transit Dennis MA X X
Authority1107 Milford Transit District Milford CT2002 Capital District Transportation Albany NY X X
Authority2003 Broome County Department of Vestal NY
Public Transportation 2004 Niagara Frontier Transportation Buffalo NY X X
Authority2005 Chemung County Transit Elmira NY
System2006 City of Long Beach Long Beach NY X X2007 Metropolitan Suburban Bus Garden City NY X X
Authority dba MTA Long Island Bus
2008 New York City Transit Brooklyn NY X X2009 City of Poughkeepsie Poughkeepsie NY X X2010 Dutchess County Division of Poughkeepsie NY X X
Mass Transportation 2015 City of Rome VIP Transit Rome NY X X2018 Central New York Regional Syracuse NY
Transit Authority
FTADesignator Federal Grant Recipient City State Part 1 Part 2
(continued )
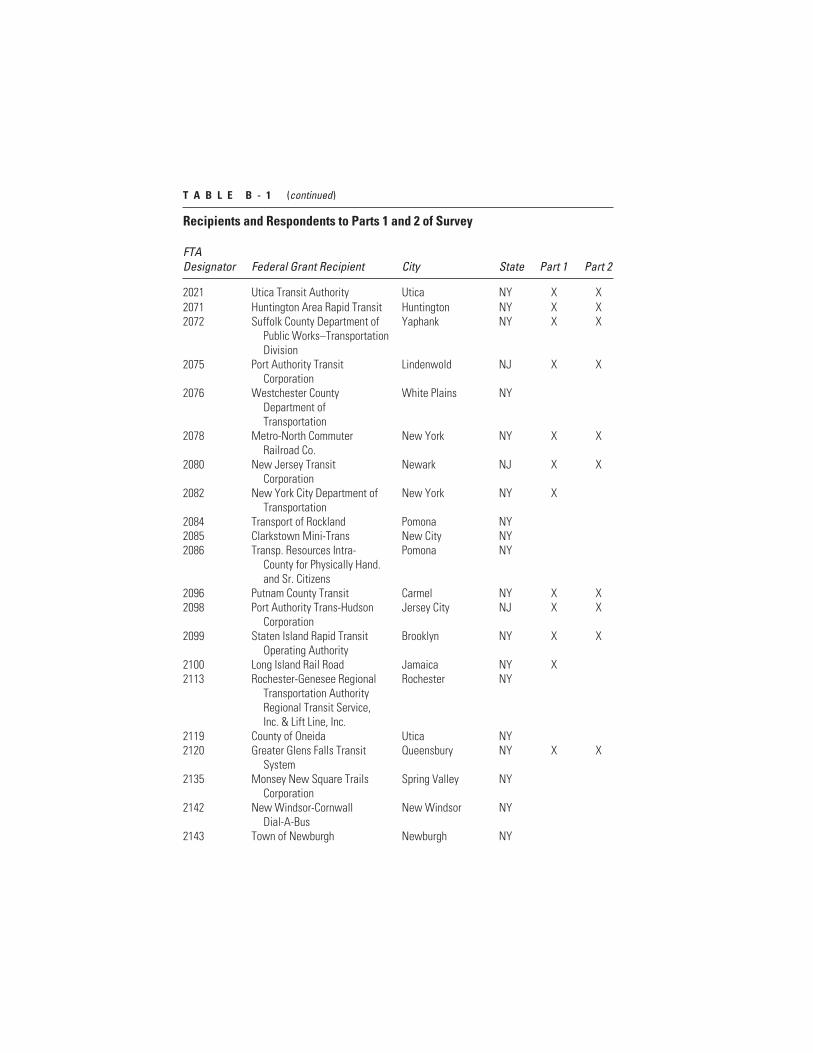
2021 Utica Transit Authority Utica NY X X2071 Huntington Area Rapid Transit Huntington NY X X2072 Suffolk County Department of Yaphank NY X X
Public Works–Transportation Division
2075 Port Authority Transit Lindenwold NJ X XCorporation
2076 Westchester County White Plains NYDepartment of Transportation
2078 Metro-North Commuter New York NY X XRailroad Co.
2080 New Jersey Transit Newark NJ X XCorporation
2082 New York City Department of New York NY XTransportation
2084 Transport of Rockland Pomona NY2085 Clarkstown Mini-Trans New City NY2086 Transp. Resources Intra- Pomona NY
County for Physically Hand. and Sr. Citizens
2096 Putnam County Transit Carmel NY X X2098 Port Authority Trans-Hudson Jersey City NJ X X
Corporation2099 Staten Island Rapid Transit Brooklyn NY X X
Operating Authority 2100 Long Island Rail Road Jamaica NY X2113 Rochester-Genesee Regional Rochester NY
Transportation AuthorityRegional Transit Service, Inc. & Lift Line, Inc.
2119 County of Oneida Utica NY2120 Greater Glens Falls Transit Queensbury NY X X
System2135 Monsey New Square Trails Spring Valley NY
Corporation2142 New Windsor-Cornwall New Windsor NY
Dial-A-Bus2143 Town of Newburgh Newburgh NY
T A B L E B - 1 (continued)
Recipients and Respondents to Parts 1 and 2 of Survey
FTADesignator Federal Grant Recipient City State Part 1 Part 2

Transit Contracting Survey Parts 1 and 2 with List of Recipients and Respondents 169
2145 Tompkins Consolidated Area Ithaca NYTransit
2155 Cumberland County Office on Bridgeton NJ X XAging
2157 Orange County ADA Goshen NYParatransit Serve c/o Orange County Dept. of Planning
3001 Kanawha Valley Regional Charleston WVTransportation Authority
3002 The Tri-State Transit Authority Huntington WV3003 Mid-Ohio Valley Transit Parkersburg WV X X
Authority3004 Peninsula Transportation Hampton VA X
District Commission 3006 Greater Richmond Transit Richmond VA X X
Company3007 Greater Roanoke Transit Roanoke VA
Company3008 Greater Lynchburg Transit Lynchburg VA
Company3009 Petersburg Area Transit Petersburg VA3010 Lehigh and Northampton Allentown PA X X
Transportation Authority 3011 Altoona Metro Transit Altoona PA3012 Cambria County Transit Johnstown PA X X
Authority3013 Erie Metropolitan Transit Erie PA X X
Authority3014 Cumberland-Dauphin- Harrisburg PA
Harrisburg Transit Authority 3015 Luzerne County Transportation Kingston PA
Authority3018 Red Rose Transit Authority Lancaster PA X X3019 Southeastern Pennsylvania Philadelphia PA
Transportation Authority 3022 Port Authority of Allegheny Pittsburgh PA X X
County3023 Beaver County Transit Rochester PA
Authority3024 Berks Area Reading Reading PA
Transportation Authority 3025 County of Lackawanna Transit Scranton PA X X
System
FTADesignator Federal Grant Recipient City State Part 1 Part 2
(continued )

3026 Williamsport Bureau of Williamsport PA X XTransportation
3027 York County Transportation York PAAuthority
3030 Washington Metropolitan Washington DC X XArea Transit Authority
3034 Mass Transit Administration, Baltimore MDMaryland Dept. of Transportation
3035 Ohio Valley Regional Wheeling WVTransportation Authority
3036 Charlottesville Transit Service Charlottesville VA3040 Annapolis Department of Annapolis MD X X
Parking & Transportation 3041 Allegany County Transit Cumberland MD X X3042 Washington County Hagerstown MD
Transportation Department 3044 Westmoreland County Transit Greensburg PA X X
Authority3048 Howard Area Transit Service Ellicott City MD
(HATS) c/o Corridor Transportation
3051 Ride-On Montgomery County Rockville MD X XGovernment
3053 Bristol Virginia Transit Bristol VA3054 Centre Area Transportation State College PA
Authority3055 Shenango Valley Shuttle Hermitage PA
Service3057 Pennsylvania Department of Harrisburg PA
Transportation3058 City of Fairfax CUE Bus Fairfax VA X X3061 Mid Mon Valley Transit Charleroi PA
Authority3066 Weirton Transit Corporation Weirton WV3068 Fairfax Connector Bus System Fairfax VA3069 City of Danville Mass Transit Danville VA X X
System3070 Potomac and Rappahannock Woodbridge VA X X
Transportation Commission
T A B L E B - 1 (continued)
Recipients and Respondents to Parts 1 and 2 of Survey
FTADesignator Federal Grant Recipient City State Part 1 Part 2

3071 City of Alexandria, Alexandria Alexandria VATransit Company
3072 Frederick County Transit Frederick MD X X3073 Virginia Railway Express Woodbridge VA3074 Harford County Transportation Bel Air MD X X
Services3075 Delaware Transit Corporation Dover DE X3076 James City County Transit Williamsburg VA3077 Borough of Pottstown Pottstown PA
Pottstown Urban Transit 3078 Southwestern Pennsylvania Pittsburgh PA X X
Commission3081 Loudoun County Commuter Leesburg VA
Bus Service 4001 Chattanooga Area Regional Chattanooga TN X
Transportation Authority 4002 Knoxville Transportation Knoxville TN X X
Authority4003 Memphis Area Transit Memphis TN X X
Authority4004 Metropolitan Transit Authority Nashville TN X X4005 Asheville Transit Authority Jacksonville FL4006 Wilmington Transit Authority Jacksonville FL4007 Capital Area Transit Raleigh NC4008 Charlotte Public Transit Charlotte NC X X
Department4009 Fayetteville Area System of Fayetteville NC
Transit4010 Gastonia Transit Gastonia NC X X4011 High Point Transit High Point NC X X4012 Winston-Salem Transit Winston-Salem NC
Authority–Trans-Aid of Forsyth County
4014 Mississippi Coast Gulfport MS X XTransportation Authority
4015 City of Jackson Transit System Jackson MS X X4016 Ashland Bus System Ashland KY4017 Transit Authority Lexington- Lexington KY
Fayette Urban County Government
4018 Transit Authority of River City Louisville KY X X4019 Transit Authority of Northern Fort Wright KY X X
Kentucky
FTADesignator Federal Grant Recipient City State Part 1 Part 2
(continued )

Contracting for Bus and Demand-Responsive Transit Services172
4020 Owensboro Transit System Owensboro KY4021 Albany Transit System Albany GA4022 Metropolitan Atlanta Rapid Atlanta GA
Transit Authority 4023 Augusta Richmond Co. Augusta GA
Transit Dept 4024 Department of Transportation– Columbus GA X X
METRA4025 Chatham Area Transit Savannah GA
Authority4026 Manatee County Area Transit Bradenton FL X X4027 Pinellas Suncoast Transit Clearwater FL X X
Authority4028 Lee County Transit Ft. Myers FL4029 Broward County Mass Transit Pompano Beach FL
Division4030 Gainesville Regional Transit Gainesville FL
System4031 Lakeland Area Mass Transit Lakeland FL
District Citrus Connection 4032 County of Volusia dba South Daytona FL
VOTRAN4034 Miami-Dade Transit Agency Miami FL X X4035 Central Florida Regional Orlando FL X X
Transportation Authority (LYNX)
4036 City of Tallahassee–TALTRAN Tallahassee FL4037 Palm Tran, Inc. West Palm Beach FL X X4038 Escambia County Area Transit Pensacola FL4040 Jacksonville Transportation Jacksonville FL X X
Authority4041 Hillsborough Area Regional Tampa FL X X
Transit Authority 4042 Birmingham-Jefferson County Birmingham AL X X
Transit Authority 4043 Metro Transit Mobile AL X X4044 Montgomery Demand and Montgomery AL
Response Transit System
T A B L E B - 1 (continued)
Recipients and Respondents to Parts 1 and 2 of Survey
FTADesignator Federal Grant Recipient City State Part 1 Part 2

4045 Tuscaloosa County Parking Tuscaloosa ALand Transit Authority
4046 Sarasota County Sarasota FLTransportation Authority
4047 Athens Transit System Athens GA X4049 DART Gadsden Gadsden AL X X4051 Chapel Hill Transit Chapel Hill NC4053 Greenville Transit Authority Greenville SC X X4054 Johnson City Transit System Johnson City TN4055 Bristol Tennessee Transit Bristol TN
System4056 Pee Dee Regional Florence SC
Transportation Authority 4057 Jackson Transit Authority Jackson TN X4058 City of Rome Transit Rome GA
Department4060 Hattiesburg Area Transit Hattiesburg MS4063 Space Coast Area Transit Cocoa FL X X4064 East Alabama Regional Anniston AL X X
Planning and Development Commission
4068 Northwest Alabama Council Muscle Shoals AL X Xof Local Governments
4069 South Carolina Electric & Gas Columbia SCCompany–Columbia
4071 City of Huntsville, Alabama Huntsville ALDepartment of Parking and Public Trans.
4074 Pasco County Public New Port Richey FL X XTransportation (PCPT)
4077 Tri-County Commuter Rail Pompano Beach FL XAuthority
4078 Cobb Community Transit Marietta GA4080 City of Kingsport Kingsport TN X X4081 Anderson Transit Authority Anderson SC4082 Douglas County Rideshare Douglasville GA4083 Aiken County Public Transit Aiken SC X X
System4084 Okaloosa County Coordinated Fort Walton Beach FL
Transportation, Inc. 4085 Bay County Council on Aging– Panama City FL X X
Bay Coordinated Transportation
FTADesignator Federal Grant Recipient City State Part 1 Part 2
(continued )

4087 Durham Area Transit Authority Durham NC X X4088 Spartanburg County Spartanburg SC
Transportation Services 4089 Phenix City Express Opelika AL4090 Piedmont Wagon Hickory NC X X4092 Clarksville Transit System Clarksville TN X4093 Greensboro Transit Authority Greensboro NC4095 Greenville Area Transit Greenville NC X4096 Rocky Mount Transit Rocky Mount NC X X4097 Council on Aging of Port St. Lucie FL
St. Lucie, Inc. 4099 Autauga County Commission Prattville AL X X4100 Santee Wateree Regional Sumter SC X X
Transportation Authority 4101 Spartanburg Transit System Spartanburg SC4102 Coastal Rapid Public Transit Conway SC
Authority4103 Wiregrass Transit Authority Dothan AL4104 Indian River County Council Vero Beach FL
on Aging 4108 Research Triangle Regional Research Triangle NC X X
Public Transportation Authority
4110 Charleston Area Regional Charleston SCTransportation
4113 Council on Aging of Martin Stuart FLCounty, Inc.
4118 City of Columbia Parking Columbia SC X XDivision
4119 City of Miami Beach Miami Miami Beach FL X XBeach Transportation Mgmt.
4120 SunTran Ocala FL X X5001 City of Appleton–Valley Transit Appleton WI X X5002 Green Bay Transit Green Bay WI5003 Kenosha Transit Kenosha WI5004 LaCrosse Municipal Transit LaCrosse WI X X
Utility5005 Madison Metro Transit Madison WI5006 Belle Urban System-Racine Racine WI X
T A B L E B - 1 (continued)
Recipients and Respondents to Parts 1 and 2 of Survey
FTADesignator Federal Grant Recipient City State Part 1 Part 2

Transit Contracting Survey Parts 1 and 2 with List of Recipients and Respondents 175
5008 Milwaukee County Transit Milwaukee WI X XSystem
5009 Oshkosh Transit System Oshkosh WI5010 Metro Regional Transit Akron OH X X
Authority5011 Stark Area Regional Transit Canton OH
Authority5012 Southwest Ohio Regional Cincinnati OH X X
Transit Authority 5015 The Greater Cleveland Regional Cleveland OH X X
Transit Authority 5016 Central Ohio Transit Authority Columbus OH X X5017 Miami Valley Regional Transit Dayton OH X X
Authority5019 City of Middletown– Middletown OH X X
Middletown Transit System 5020 Springfield City Area Transit Springfield OH5021 Portage Area Regional Kent OH
Transportation Authority 5022 Toledo Area Regional Toledo OH X X
Transit Authority 5024 Western Reserve Transit Youngstown OH
Authority5025 Duluth Transit Authority Duluth MN5026 City of Moorhead-Transit Moorhead MN X X5027 Metro Transit Minneapolis MN X X5028 St. Cloud Metropolitan St. Cloud MN
Transit Commission 5029 Bay Metropolitan Bay City MI
Transportation Authority 5030 Battle Creek Transit Battle Creek MI X X5031 Suburban Mobility Authority Detroit MI X
for Regional Transportation 5032 Mass Transportation Authority Flint MI5033 Grand Rapids Area Transit Grand Rapids MI
Authority5034 City of Jackson Transportation Jackson MI X X
Authority5035 Kalamazoo Metro Transit Kalamazoo MI
System5036 Capital Area Transportation Lansing MI X X
Authority5037 Muskegon Area Transit System Muskegon MI X X
FTADesignator Federal Grant Recipient City State Part 1 Part 2
(continued )

5038 Niles Dial-A-Ride Niles MI5039 Saginaw Transit Authority Saginaw MI X X
Transit Services 5040 Ann Arbor Transportation Ann Arbor MI X X
Authority5041 City of Anderson Anderson IN
Transportation System 5042 East Chicago Transit East Chicago IN5043 Metropolitan Evansville Evansville IN X X
Transit System 5044 Fort Wayne Public Fort Wayne IN
Transportation Corporation 5045 Gary Public Transportation Gary IN
Corporation5047 Bloomington-Normal Public Bloomington IL X X
Transit System 5050 Indianapolis Public Indianapolis IN X X
Transportation Corporation 5051 Greater Lafayette Public Lafayette IN X X
Transportation Corporation 5052 South Bend Public South Bend IN X X
Transportation Corporation 5053 Terre Haute Transit Utility Terre Haute IN X X5054 Muncie Indiana Transit System Muncie IN5055 City of Loves Park Transit Loves Park IL
System5056 Greater Peoria Mass Peoria IL X X
Transit District 5057 Rock Island County Rock Island IL X X
Metropolitan Mass Transit District
5058 Rockford Mass Transit District Rockford IL5059 Springfield Mass Transit Springfield IL X X
District5060 Champaign-Urbana Mass Urbana IL
Transit District 5061 Decatur Public Transit System Decatur IL X X5065 Pekin Municipal Bus Service Pekin IL X X5066 Chicago Transit Authority Chicago IL
T A B L E B - 1 (continued)
Recipients and Respondents to Parts 1 and 2 of Survey
FTADesignator Federal Grant Recipient City State Part 1 Part 2

5088 Sheboygan Transit System Sheboygan WI X X5090 Richland County Transit Mansfield OH5091 Wausau Area Transit System Wausau WI5092 City of Rochester, Minnesota Rochester MN5093 Allen County Regional Lima OH
Transit Authority 5094 Waukesha County Transit Waukesha WI X X
System5095 Lorain County Transit Lorain OH5096 Waukesha Transit Commission Waukesha WI X X5097 Campus Bus Service Kent OH X X5099 Eau Claire Transit System Eau Claire WI5102 Hammond Transit System Hammond IN X X5103 North Township of Lake Hammond IN X X
County Dial-A-Ride 5104 Northern Indiana Commuter Chesterton IN
Transportation District 5107 Henderson Area Rapid Transit Henderson KY5108 Janesville Transit System Janesville WI X5109 City of Beloit Transit System Beloit WI5110 Bloomington Public Bloomington IN X X
Transportation Corporation 5112 Milwaukee County Paratransit Milwaukee WI
System5113 Pace, Suburban Bus Division Arlington Heights IL X X5117 LAKETRAN Grand River OH X X5118 Northeast Illinois Regional Chicago IL X
Commuter Railroad Corporation
5119 City of Detroit Department of Detroit MITransportation
5132 Twin Cities Area Benton Harbor MITransportation Authority
5133 Chippewa Falls General Public Chippewa Falls WI X XShared-Ride Taxi System
5135 City of Kankakee TaxiVan Kankakee ILProgram
5138 City of Newark Transit Newark OHOperations
5141 Detroit Transportation Detroit MICorporation
5142 Steel Valley Regional Transit Steubenville OHAuthority
FTADesignator Federal Grant Recipient City State Part 1 Part 2
(continued )
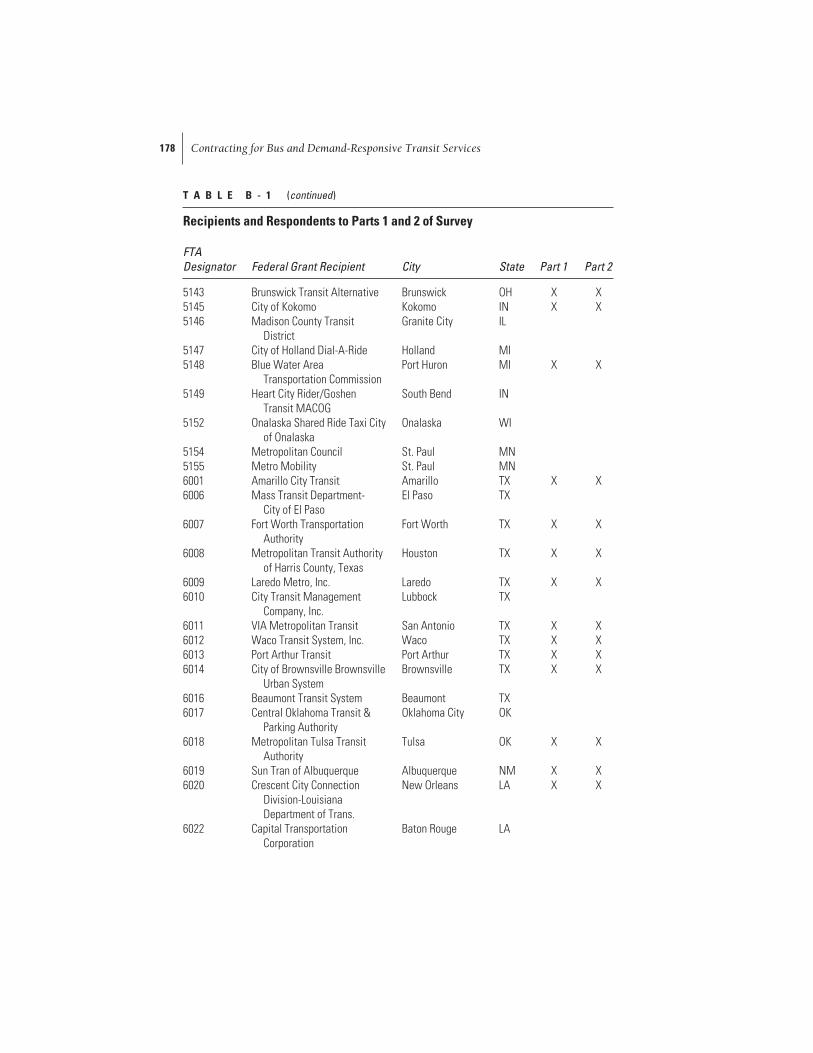
Contracting for Bus and Demand-Responsive Transit Services178
5143 Brunswick Transit Alternative Brunswick OH X X5145 City of Kokomo Kokomo IN X X5146 Madison County Transit Granite City IL
District5147 City of Holland Dial-A-Ride Holland MI5148 Blue Water Area Port Huron MI X X
Transportation Commission 5149 Heart City Rider/Goshen South Bend IN
Transit MACOG 5152 Onalaska Shared Ride Taxi City Onalaska WI
of Onalaska 5154 Metropolitan Council St. Paul MN5155 Metro Mobility St. Paul MN6001 Amarillo City Transit Amarillo TX X X6006 Mass Transit Department- El Paso TX
City of El Paso 6007 Fort Worth Transportation Fort Worth TX X X
Authority6008 Metropolitan Transit Authority Houston TX X X
of Harris County, Texas 6009 Laredo Metro, Inc. Laredo TX X X6010 City Transit Management Lubbock TX
Company, Inc. 6011 VIA Metropolitan Transit San Antonio TX X X6012 Waco Transit System, Inc. Waco TX X X6013 Port Arthur Transit Port Arthur TX X X6014 City of Brownsville Brownsville Brownsville TX X X
Urban System 6016 Beaumont Transit System Beaumont TX6017 Central Oklahoma Transit & Oklahoma City OK
Parking Authority 6018 Metropolitan Tulsa Transit Tulsa OK X X
Authority6019 Sun Tran of Albuquerque Albuquerque NM X X6020 Crescent City Connection New Orleans LA X X
Division-LouisianaDepartment of Trans.
6022 Capital Transportation Baton Rouge LACorporation
T A B L E B - 1 (continued)
Recipients and Respondents to Parts 1 and 2 of Survey
FTADesignator Federal Grant Recipient City State Part 1 Part 2

6023 Lake Charles Transit System Lake Charles LA6024 Shreveport Area Transit Shreveport LA
System6025 City of Alexandria Alexandria LA X X6026 City of Monroe Transit System Monroe LA X X6032 Regional Transit Authority of New Orleans LA
Orleans and Jefferson 6033 Central Arkansas Transit North Little Rock AR
Authority6034 Pine Bluff Transit Pine Bluff AR6035 Wichita Falls Transit System Wichita Falls TX X X6037 City of San Angelo San Angelo TX6038 City of Lafayette Transit (COLT) Lafayette LA6040 Abilene Transit System Abilene TX6041 Handitran Special Transit Arlington TX X X
Division, City of Arlington 6048 Capital Metropolitan Austin TX
Transportation Authority 6049 Las Cruces Area Transit- Las Cruces NM
RoadRUNNER6051 Corpus Christi Regional Corpus Christi TX X X
Transportation Authority 6053 Texoma Council of Sherman TX
Governments6056 Dallas Area Rapid Transit Dallas TX X X
Authority6058 St. Bernard Parish Government Chalmette LA X X
(SBURT)6059 Brazos Transit District (formally Bryan TX
known as BVCAA dba Brazos Transit)
6068 Transportation Services Grand Prairie TX X XDepartment City of Grand Prairie
6070 City of Mesquite Parks & Mesquite TX X XRecreation
6074 Lewisville Dial-A-Ride Lewisville TX6075 City of Temple Temple TX X X6076 City of Denton Public Denton TX X X
Transportation Department 6077 Transit Services Division Santa Fe NM X X
Santa Fe Public Works Department
FTADesignator Federal Grant Recipient City State Part 1 Part 2
(continued )

6078 City of Plano Plano TX X X6080 Terrebonne Parish Houma LA X X
Consolidated Government 6081 City of Longview Kilgore TX X X6082 The Gulf Coast Center Galveston TX X X6086 Fort Smith Public Transit Fort Smith AR X6088 Jefferson Parish Department Gretna LA
of Transit Administration 6089 City of Tyler Tyler TX X X6090 Lower Rio Grande Valley McAllen TX
Development Council 7001 StarTran Lincoln NE X X7002 Transit Authority of Omaha Omaha NE7003 City Utilities of Springfield Springfield MO X X7005 Kansas City Area Kansas City MO
Transportation Authority 7006 Bi-State Development Agency St. Louis MO7007 Bettendorf Transit System Bettendorf IA X X7008 Five Seasons Transportation Cedar Rapids IA7009 Davenport Public Transit Davenport IA7010 Des Moines Metropolitan Des Moines IA
Transit Authority 7011 City of Dubuque-KeyLine Dubuque IA7012 Sioux City Transit System Sioux City IA X X7013 Metropolitan Transit Authority Waterloo IA
of Black Hawk County 7014 Topeka Metropolitan Transit Topeka KS
Authority7015 Wichita Transit Wichita KS7016 Columbia Area Transit System Columbia MO7018 Iowa City Transit Iowa City IA X X7020 City of East Dubuque Dubuque IL7030 Coralville Transit Coralville IA7032 St. Joseph Transit St. Joseph MO X X7035 Johnson County Kansas aka Olathe KS X X
Johnson County Transit 7037 City of Liberty Liberty MO X X7038 City of Olathe Olathe KS
T A B L E B - 1 (continued)
Recipients and Respondents to Parts 1 and 2 of Survey
FTADesignator Federal Grant Recipient City State Part 1 Part 2

Transit Contracting Survey Parts 1 and 2 with List of Recipients and Respondents 181
7040 City of Joplin Metro Area Joplin MOParatransit System
8001 Utah Transit Authority Salt Lake City UTP. O. Box 30810
8002 Sioux Falls Transit Sioux Falls SD8003 Fargo Metropolitan Area Fargo ND X
Transit8004 Billings Metropolitan Transit Billings MT X X8005 Colorado Springs Transit Colorado Springs CO
System8006 Regional Transportation Denver CO X X
District8007 Pueblo Transit Pueblo CO X X8008 Grand Forks City Bus Grand Forks ND X X8009 Missoula Urban Transportation Missoula MT X X
District8010 City of Greeley–The Bus Greeley CO X X8011 Transfort Fort Collins CO X8013 City of Casper Casper WY8014 Rapid Transit System Rapid City SD X X8016 Mesa County Grand Junction CO X X8019 Bis-Man Transit Board Bismarck ND X X8020 The City of Cheyenne Transit Cheyenne WY X X
Program8021 City of Logan dba, The Logan Logan UT
Transit District 9001 Regional Transportation Reno NV X X
Commission of Washoe County
9002 City and County of Honolulu Honolulu HI X XDept. of Transportation Services
9003 San Francisco Bay Area Rapid Oakland CA X XTransit District
9004 Golden Empire Transit District Bakersfield CA X X9006 Santa Cruz Metropolitan Santa Cruz CA X X
Transit District 9007 Modesto Area Express Modesto CA9008 Santa Monica’s Big Blue Bus Santa Monica CA9009 San Mateo County Transit San Carlos CA
District9010 City of Torrance Transit System Torrance CA
FTADesignator Federal Grant Recipient City State Part 1 Part 2
(continued )

9012 San Joaquin Regional Transit Stockton CADistrict
9013 Santa Clara Valley Trans. San Jose CAAuthority
9014 Alameda–Contra Costa Oakland CA X XTransit District
9015 San Francisco Municipal San Francisco CARailway
9016 Golden Gate Bridge, Highway San Francisco CA X Xand Transportation District
9017 City of Santa Rosa Santa Rosa CA9019 Sacramento Regional Transit Sacramento CA X X
District9020 Santa Barbara Metropolitan Santa Barbara CA X
Transit District 9022 Norwalk Transit System Norwalk CA X9023 Long Beach Public Long Beach CA X
Transportation Company 9024 City of La Mirada Transit La Mirada CA9027 Fresno Area Express Fresno CA X X9028 City of Vallejo: Vallejo Transit Vallejo CA
Vallejo–San Francisco Ferry 9029 OMNITRANS San Bernadino CA X X9030 North San Diego County Oceanside CA X
Transit Development Board 9031 Riverside Transit Agency Riverside CA9032 City of Phoenix Public Transit Phoenix AZ X X
Department9033 City of Tucson Tucson AZ X X9034 City of Glendale–Transit Glendale AZ X X9035 South Coast Area Transit Oxnard CA X X9036 Orange County Transportation Orange CA
Authority9039 Culver City Municipal Bus Lines Culver City CA X9041 Montebello Bus Lines Montebello CA X X9042 City of Gardena Transportation Gardena CA
Department9043 City of Commerce Municipal Commerce CA
Buslines
T A B L E B - 1 (continued)
Recipients and Respondents to Parts 1 and 2 of Survey
FTADesignator Federal Grant Recipient City State Part 1 Part 2

9044 Arcadia Transit Arcadia CA X X9050 Simi Valley Transit Simi Valley CA9052 City of Corona Dial-A-Ride Corona CA9061 Yuba-Sutter Transit Authority Marysville CA X X9062 Monterey-Salinas Transit Monterey CA9078 Central Contra Costa Transit Concord CA
Authority9079 SunLine Transit Agency Thousand Palms CA X X9086 City of Riverside Special Riverside CA X X
Transportation9087 Santa Maria Area Transit Santa Maria CA X X9088 Napa County Transportation Napa CA X X
Planning Agency–VINE 9089 Sonoma County Transit Santa Rosa CA9090 Yolo County Transportation Woodland CA X X
District9091 City of Visalia–Visalia City Visalia CA
Coach9092 City of Fairfield, Fairfield– Fairfield CA X X
Suisun Transit 9093 Redding Area Bus Authority Redding CA
(RABA)9095 San Diego Association of San Diego CA X X
Governments9119 Laguna Beach Municipal Laguna Beach CA X
Transit Lines 9121 Antelope Valley Transit Lancaster CA
Authority9127 Chico Area Transit System Chico CA9129 City of Mesa Mesa AZ X X9131 City of Scottsdale–Scottsdale Scottsdale AZ X X
Connection9132 Maricopa County Special Phoenix AZ X X
Transportation Services 9134 Peninsula Corridor Joint San Carlos CA
Powers Board 9135 Sun Cities Area Transit Sun City AZ X X
System, Inc. 9136 Regional Public Transportation Phoenix AZ
Authority9137 Surprise Dial-A-Ride Transit Surprise AZ X X
System9140 Peoria Transit Peoria AZ
FTADesignator Federal Grant Recipient City State Part 1 Part 2
(continued )

Contracting for Bus and Demand-Responsive Transit Services184
9144 Livermore–Amador Valley Livermore CA X XTransit Authority
9146 Foothill Transit Zone West Covina CA9147 City of Los Angeles Department Los Angeles CA
of Transportation 9148 Victor Valley Transit Authority Hesperia CA X X9149 City of Lompoc–Lompoc Transit Lompoc CA X X9150 City of Alameda Ferry Services, Alameda CA X
c/o City of Alameda 9151 Southern California Regional Los Angeles CA X X
Rail Authority 9154 Los Angeles County Los Angeles CA X X
Metropolitan Transportation Authority
9155 City of Vacaville Vacaville CA X X9156 City of San Luis Obispo San Luis Obispo CA9159 Western Contra Costa Pinole CA X X
Transit Authority 9161 City of Union City Transit Union City CA X
Division9162 Eastern Contra Costa Transit Antioch CA
Authority (ECCTA) 9163 Camarillo Area Transit, Camarillo CA X X
c/o City of Camarillo 9164 Ventura Intercity Service Ventura CA X X
Transit Authority 9165 Thousand Oaks Transit, Thousand Oaks CA
c/o City of Thousand Oaks 9167 Davis Community Transit Davis CA X9168 Roseville Transit Roseville CA X X9171 Santa Clarita Transit Santa Clarita CA X X9172 City of Tempe Transportation Tempe AZ
Division9173 Merced County Transit Merced CA X X9175 City of Lodi Lodi CA X X9177 Town of Guadalupe Guadalupe AZ X X9180 Coconino County Community Flagstaff AZ X
Services Transportation Services
T A B L E B - 1 (continued)
Recipients and Respondents to Parts 1 and 2 of Survey
FTADesignator Federal Grant Recipient City State Part 1 Part 2

9182 Altamont Commuter Express Stockton CA X XSan Joaquin Regional Rail Commission
9185 San Diego Metropolitan San Diego CA X XTransit Development Board
NOTE: X indicates returned survey part.
RESPONSE TOTALS
Part 1 Parts 1 and 2 Part 2
Respondents 259 237Respondents to Parts 1 and 2 233Respondents to Part 1 only 26Respondents to Part 2 only 4
RESPONSES BY REGIONRegion Respondents Part 1 Part 2
1 New England (CT, MA, ME, NH, RI, VT) 36 13 112 New York–New Jersey 35 21 193 Mid-Atlantic (DC, DE, MD, PA, VA, WV) 51 21 214 Southeast (AL, FL, GA, KY, MS, NC, SC, TN) 88 43 395 Great Lakes (IL, IN, OH, MI, MN, WI) 92 46 426 Southwest (AR, LA, NM, OK, TX) 49 29 287 Plains (IA, KS, MO, NE) 23 8 88 Mountain (CO, MT, ND, SD, UT, WY) 17 11 119 Pacific Southwest (AZ, CA, HI, NV) 87 54 46
10 Pacific Northwest (AK, ID, OR, WA) 24 13 12Total 502 259 237
FTADesignator Federal Grant Recipient City State Part 1 Part 2

186
CCA P P E N D I X
Tabulations of Responses toSurvey Part 1
T A B L E C - 1
Does your agency contract for any public transit services?
Any Contracting Systems Percent
Yes 156 60.2%No 103 39.8%Total Responding 259 100.0%
T A B L E C - 2
For what type of organization do you work? (Survey response pattern by system typecompared with pattern for all systems receiving the survey.)
Non- Total Non-Organization Contracting contracting Responding responding Type Systems Percent Systems Percent Systems Percent Systems Percent
Regional Transit Agency 69 44.2% 37 35.9% 106 40.9% 95 39.1%
City Agency 53 34.0% 48 46.6% 101 39.0% 103 42.4%County Agency 16 10.3% 10 9.7% 26 10.0% 37 15.2%State Transit
Agency 2 1.3% 2 1.9% 4 1.5% 3 1.2%Other 16 10.3% 6 5.8% 22 8.5% 5 2.1%Total Responding 156 100.0% 103 100.0% 259 100.0% 243 100.0%

T A B L E C - 3
Please tell us about the transit services that your agency provides.
Directly Responding Percent Type of Service Operated Contracted Systems Contracted
Bus 151 82 203 40.4%DR (ADA) 87 121 188 64.4%DR (Dial-a-Ride) 27 71 83 85.5%Commuter Rail 5 7 11 63.6%Heavy Rail 10 0 10 0.0%Light Rail 10 1 10 10.0%Vanpool 12 13 24 54.2%Ferryboat 3 8 11 72.7%Other 3 7 9 77.8%
NOTE: DR = demand-responsive service.
T A B L E C - 4
What type of services do you contract?
Type of Service Total Contracts Percent
DR 170 61.4%Fixed-Route Bus 98 35.4%Ferry 4 1.4%Commuter Rail 3 1.1%Vanpool 2 0.7%Total Responding 277 100.0%
T A B L E C - 5
Number of Contracts Reported by Responding Systems
No. of Contracts Reported Responding Systems Percent
1 62 40.3%2 68 44.2%3 17 11.0%4 7 4.5%Total Responding 154 100.0%

T A B L E C - 6
Service Contractor’s Organization Type
Contractor Total Organization Type Bus Percent DR Percent Other Contracts Percent
Private for-profit 79 81.4% 114 68.3% 5 198 72.5%Private non-profit 6 6.2% 30 18.0% 2 38 13.9%Public 11 11.3% 21 12.6% 2 34 12.5%Other 1 1.0% 2 1.2% 0 3 1.1%Total Responding 97 100.0% 167 100.0% 9 273 100.0%
T A B L E C - 7
Describe the type of service(s) provided under the current contract.
Types of Services Bus DR Other Percent
Local Bus 79 80.6%Express Bus 38 38.8%Community Circulator 22 22.4%Downtown/Parking Shuttle 6 6.1%
Fixed Route Total 98DR (ADA) 135 79.4%DR (Dial-a-Ride) 69 40.6%
DR Total 170Commuter Rail 3Vanpool 2Ferry 4
T A B L E C - 8
These services can best be described as . . .
TotalService Geography Bus Percent DR Percent Other Contracts Percent
Urban 69 71.1% 59 65.6% 5 133 68.6%Suburban 49 50.5% 34 37.8% 3 86 44.3%Rural 10 10.3% 18 20.0% 2 30 15.5%Total Responding 97 90 7 194

Tabulations of Responses to Survey Part 1 189
T A B L E C - 9
Year Current Contract Was Awarded
Year of Current Total Contract Award Bus Percent DR Percent Other Contracts Percent
1989–1990 1 1.0% 1 0.6% 0 2 0.7%1991–1995 8 8.2% 12 7.3% 0 20 7.4%1996–1997 22 22.4% 31 18.9% 0 53 19.6%1998–1999 32 32.7% 67 40.9% 5 104 38.4%2000–2001 35 35.7% 53 32.3% 4 92 33.9%Total Responding 98 100.0% 164 100.0% 9 271 100.0%
T A B L E C - 1 0
Year Previous Contract Was Awarded
Year of Previous Total Contract Award Bus Percent DR Percent Other Contracts Percent
1990 and prior 5 6.6% 5 3.6% 0 9 4.2%1991–1995 46 60.5% 71 51.4% 3 119 55.9%1996–2000 25 32.9% 62 44.9% 5 85 39.9%Total Responding 76 100.0% 138 100.0% 8 213 100.0%
T A B L E C - 1 1
Number of Times Service Has Been Rebid
TotalNo. of Rebids Bus Percent DR Percent Other Contracts Percent
Still in First Cycle(No Rebids) 15 17.4% 20 13.4% 2 37 15.3%
1 or 2 26 30.2% 48 32.2% 3 77 31.8%3 or 4 28 32.6% 53 35.6% 2 83 34.3%5–10 17 19.8% 20 13.4% 0 37 15.3%Over 10 0 0.0% 8 5.4% 0 8 3.3%Total Responding 86 100.0% 149 100.0% 7 242 100.0%

T A B L E C - 1 2
Number of Times the Contractor for Service Has changed
No. of Contractor Total Changes Bus Percent DR Percent Other Contracts Percent
0 45 46.9% 82 53.9% 5 132 51.6%1 22 22.9% 26 17.1% 1 49 19.1%2 13 13.5% 19 12.5% 2 34 13.3%3 13 13.5% 15 9.9% 0 28 10.9%4 or more 3 3.1% 10 6.6% 0 13 5.1%Total Responding 96 100.0% 152 100.0% 8 256 100.0%
T A B L E C - 1 3
Number of Contractor Changes for Contracts That Have Been Rebid at LeastOnce, by Service Type
No. of Contractor Total Changes Bus Percent DR Percent Other Contracts Percent
0 26 36.1% 53 45.7% 3 82 42.3%1 17 23.6% 19 16.4% 1 37 19.1%2 13 18.1% 19 16.4% 2 34 17.5%3 13 18.1% 15 12.9% 0 28 14.4%4 or more 3 4.2% 10 8.6% 0 13 6.7%Total Responding 72 100.0% 116 100.0% 6 194 100.0%
T A B L E C - 1 4
Services Provided Under Current Award
TotalBus Percent DR Percent Other Contracts Percent
Replacements for in-house service 21 23.3% 30 19.5% 1 52 20.6%
Replacements for previous contract services 53 58.9% 75 48.7% 3 131 51.8%
New 26 28.9% 31 20.1% 3 60 23.7%Supplemental 0 0.0% 13 8.4% 0 13 5.1%Ongoing 1 1.1% 14 9.1% 2 17 6.7%Total Responding 90 154 9 253
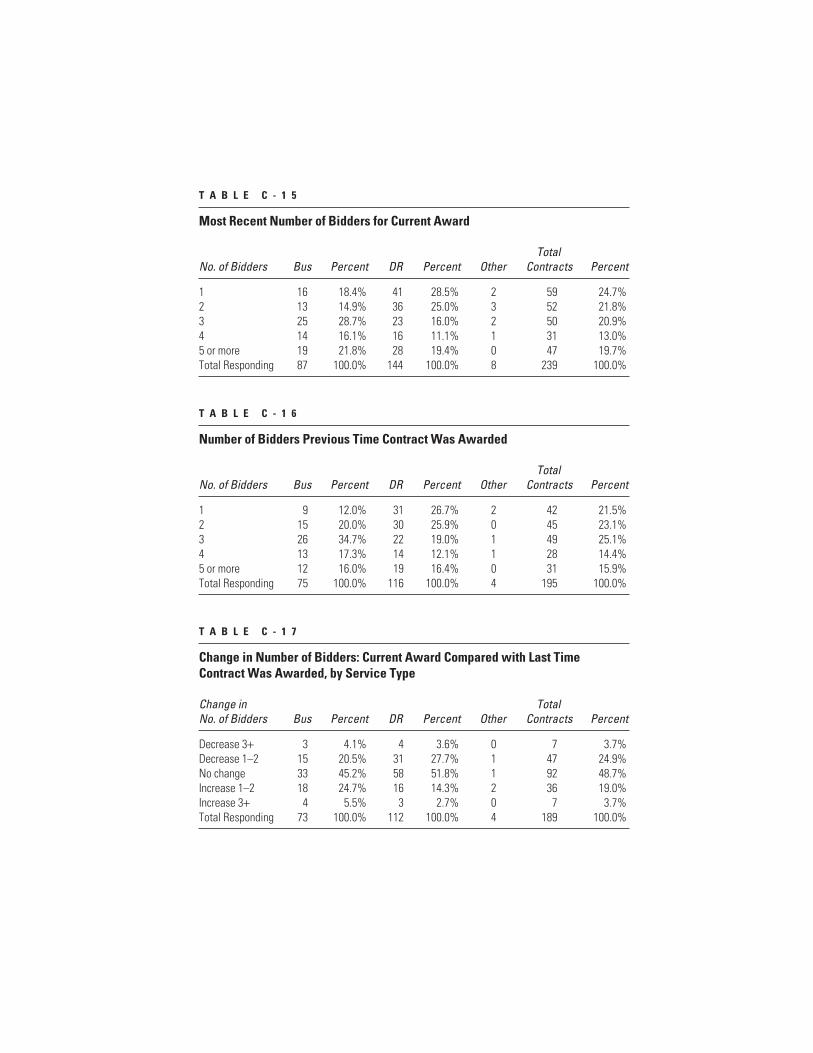
T A B L E C - 1 5
Most Recent Number of Bidders for Current Award
TotalNo. of Bidders Bus Percent DR Percent Other Contracts Percent
1 16 18.4% 41 28.5% 2 59 24.7%2 13 14.9% 36 25.0% 3 52 21.8%3 25 28.7% 23 16.0% 2 50 20.9%4 14 16.1% 16 11.1% 1 31 13.0%5 or more 19 21.8% 28 19.4% 0 47 19.7%Total Responding 87 100.0% 144 100.0% 8 239 100.0%
T A B L E C - 1 6
Number of Bidders Previous Time Contract Was Awarded
TotalNo. of Bidders Bus Percent DR Percent Other Contracts Percent
1 9 12.0% 31 26.7% 2 42 21.5%2 15 20.0% 30 25.9% 0 45 23.1%3 26 34.7% 22 19.0% 1 49 25.1%4 13 17.3% 14 12.1% 1 28 14.4%5 or more 12 16.0% 19 16.4% 0 31 15.9%Total Responding 75 100.0% 116 100.0% 4 195 100.0%
T A B L E C - 1 7
Change in Number of Bidders: Current Award Compared with Last Time Contract Was Awarded, by Service Type
Change in Total No. of Bidders Bus Percent DR Percent Other Contracts Percent
Decrease 3+ 3 4.1% 4 3.6% 0 7 3.7%Decrease 1–2 15 20.5% 31 27.7% 1 47 24.9%No change 33 45.2% 58 51.8% 1 92 48.7%Increase 1–2 18 24.7% 16 14.3% 2 36 19.0%Increase 3+ 4 5.5% 3 2.7% 0 7 3.7%Total Responding 73 100.0% 112 100.0% 4 189 100.0%

Contracting for Bus and Demand-Responsive Transit Services192
T A B L E C - 1 9
Average Annual Contract Dollar Amount
Contract Amount Total (Millions) Bus Percent DR Percent Other Contracts Percent
$0.1 and under 8 8.4% 23 15.1% 0 31 12.2%$0.1–$0.5 24 25.3% 38 25.0% 0 62 24.4%$0.5–$1.0 16 16.8% 20 13.2% 4 40 15.7%$1.0–$3.0 22 23.2% 40 26.3% 1 63 24.8%$3.0–$5.0 7 7.4% 15 9.9% 0 22 8.7%Over $5.0 18 18.9% 16 10.5% 2 36 14.2%Total Responding 95 100.0% 152 100.0% 7 254 100.0%
T A B L E C - 1 8
Change in Number of Bidders: Current Award Compared with Last Time Contract Was Awarded, by Service Type (Excluding Contracts That Had OnlyOne Bid in Previous Cycle)
Change in Total No. of Bidders Bus Percent DR Percent Other Contracts Percent
Decrease 3+ 3 4.6% 4 4.8% 0 7 4.7%Decrease 1–2 15 23.1% 31 37.3% 1 47 31.3%No change 27 41.5% 34 41.0% 0 61 40.7%Increase 1–2 18 27.7% 11 13.3% 1 30 20.0%Increase 3+ 2 3.1% 3 3.6% 0 5 3.3%Total Responding 65 100.0% 83 100.0% 2 150 100.0%
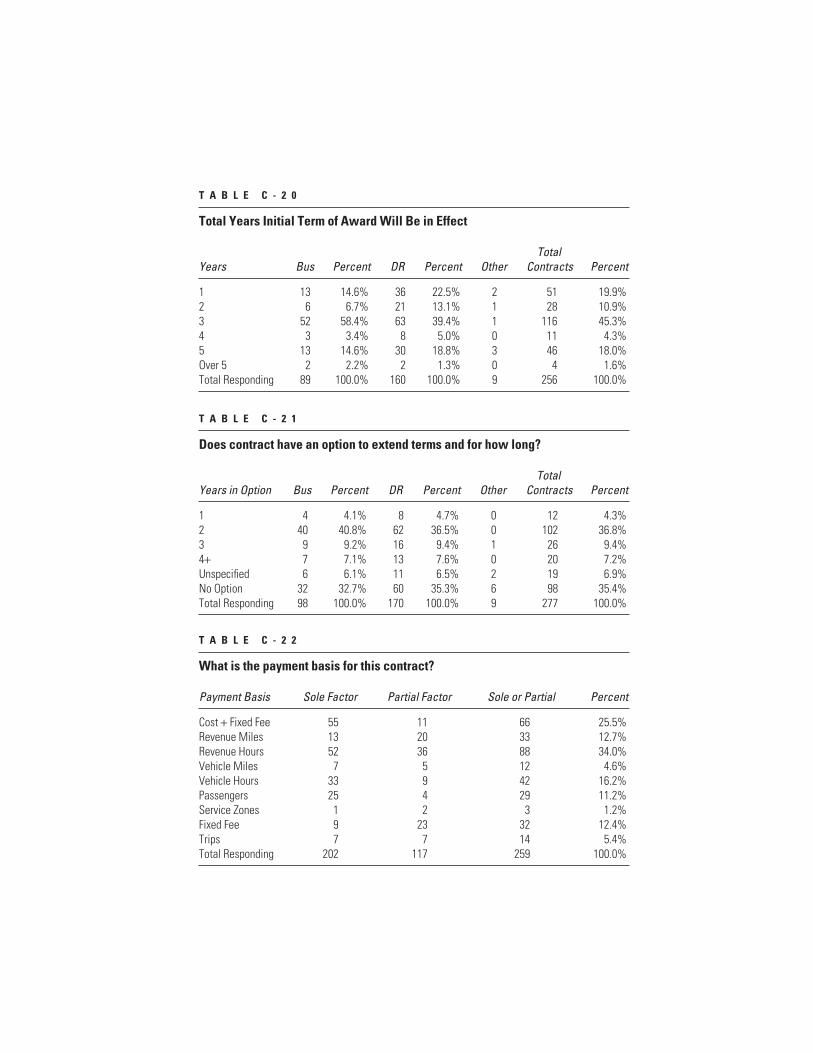
T A B L E C - 2 1
Does contract have an option to extend terms and for how long?
TotalYears in Option Bus Percent DR Percent Other Contracts Percent
1 4 4.1% 8 4.7% 0 12 4.3%2 40 40.8% 62 36.5% 0 102 36.8%3 9 9.2% 16 9.4% 1 26 9.4%4+ 7 7.1% 13 7.6% 0 20 7.2%Unspecified 6 6.1% 11 6.5% 2 19 6.9%No Option 32 32.7% 60 35.3% 6 98 35.4%Total Responding 98 100.0% 170 100.0% 9 277 100.0%
T A B L E C - 2 2
What is the payment basis for this contract?
Payment Basis Sole Factor Partial Factor Sole or Partial Percent
Cost + Fixed Fee 55 11 66 25.5%Revenue Miles 13 20 33 12.7%Revenue Hours 52 36 88 34.0%Vehicle Miles 7 5 12 4.6%Vehicle Hours 33 9 42 16.2%Passengers 25 4 29 11.2%Service Zones 1 2 3 1.2%Fixed Fee 9 23 32 12.4%Trips 7 7 14 5.4%Total Responding 202 117 259 100.0%
T A B L E C - 2 0
Total Years Initial Term of Award Will Be in Effect
TotalYears Bus Percent DR Percent Other Contracts Percent
1 13 14.6% 36 22.5% 2 51 19.9%2 6 6.7% 21 13.1% 1 28 10.9%3 52 58.4% 63 39.4% 1 116 45.3%4 3 3.4% 8 5.0% 0 11 4.3%5 13 14.6% 30 18.8% 3 46 18.0%Over 5 2 2.2% 2 1.3% 0 4 1.6%Total Responding 89 100.0% 160 100.0% 9 256 100.0%

T A B L E C - 2 3
Payment Basis by Service Type
Payment BasisBus DR
Summarized Sole Partial Sole/Part Percent Sole Partial Sole/Part Percent
Cost + Fixed Fee 27 1 28 29.2% 24 10 34 21.8%Fixed 8 10 18 18.8% 1 12 13 8.3%Hours 34 16 50 52.1% 50 28 78 50.0%Miles 8 10 18 18.8% 12 14 26 16.7%Passengers 0 0 0 0.0% 25 3 28 17.9%Other 1 0 1 1.0% 7 9 16 10.3%Total Responding 78 37 96 100.0% 119 76 156 100.0%
T A B L E C - 2 4
How does your agency treat fare revenues under this contract?
TotalTreatment of Fares Bus Percent DR Percent Others Contracts Percent
Direct offset 60 64.5% 121 77.6% 4 185 72.3%Kept by agency 25 26.9% 17 10.9% 2 44 17.2%Kept by contractor 5 5.4% 12 7.7% 0 17 6.6%Other 3 3.2% 6 3.8% 1 10 3.9%Total Responding 93 100.0% 156 100.0% 7 256 100.0%
T A B L E C - 2 5
What contractor performance provisions does this contract have?
TotalProvision Bus Percent DR Percent Others Contracts Percent
Liquidated damages 45 45.9% 61 35.9% 1 107 38.6%Incentives 25 25.5% 45 26.5% 3 73 26.4%Penalties 43 43.9% 72 42.4% 4 119 43.0%Total Responding 98 170 9 277

Tabulations of Responses to Survey Part 1 195
T A B L E C - 2 6
How many revenue vehicles are provided under this contract and who provides them?
Source of Total Vehicles Bus Percent DR Percent Others Contracts Percent
By agency 69 72.6% 72 48.3% 5 146 58.2%By contractor 20 21.1% 57 38.3% 1 78 31.1%Mixed 6 6.3% 20 13.4% 1 27 10.8%Total Responding 95 100.0% 149 100.0% 7 251 100.0%
T A B L E C - 2 7
What equipment or facilities does the contractor provide for this contract?
Equipment/Facilities Total Provided by Contractor Bus Percent DR Percent Others Contracts Percent
Bus storage facilities 53 71.6% 107 78.7% 1 161 75.2%Maintenance facilities 49 66.2% 100 73.5% 1 150 70.1%Maintenance equipment 49 66.2% 94 69.1% 2 145 67.8%Nonrevenue vehicles 41 55.4% 78 57.4% 0 119 55.6%Schedule hard/software 28 37.8% 62 45.6% 2 92 43.0%Other 7 9.5% 12 8.8% 2 21 9.8%Total Responding 74 136 4 214
T A B L E C - 2 8
What services does the contractor provide for this contract?
Services Provided by Contractor DR Contracts Percent
Dispatch 140 92.1%Reservations 110 72.4%Call taking 107 70.4%Routing 105 69.1%Eligibility 31 20.4%Other 30 19.7%Total Responding 152

196
DDA P P E N D I X
Tabulations of Responses toSurvey Part 2
T A B L E D - 1
Question 1: Please tell us about the types of services that you provide. What services are directly operated, and which ones do you contract?
Type of Service Directly Operated Responding Systems
Bus 151 200DR (ADA) 91 187DR (dial-a-ride) 62 115Commuter rail 1 7Heavy rail 10 10Light rail 12 12Vanpool 18 30Ferryboat 6 10Other 10 18Total responding 237
NOTE: DR = demand-responsive service.
T A B L E D - 2
Number of Systems Reporting Contracted Service by Type of Service
Type of Service Responding Systems
Bus 77DR 123Ferry 1Commuter rail 1Total responding systems with contracted service 144
NOTE: Some systems contract for more than one service.

T A B L E D - 3
Question 2: Does your agency have a specific unit to monitor the performance ofcontracted services? If “Yes,” then how many employees does this unit employ?
Special Monitoring Unit Number Percent Average No. of Employees
Yes 91 63% 4.2No 53 37% 0Total responding 144 100%
T A B L E D - 4
Question 3: Do you monitor overhead costs for contracted services? If so, pleasecheck off the areas that you monitor.
Areas Monitored for Overhead Cost Responding Systems
Contract administration 52National Transit Database reporting 51Vehicle inspection 50Maintenance 49Driver instruction 36Cash counting 35Operations management 31Internal audit 28Dispatch 26Liability 25Street supervision 23Accounts payable 19Workers compensation 18Depreciation 11Human resources 11Other 11Total responding 144
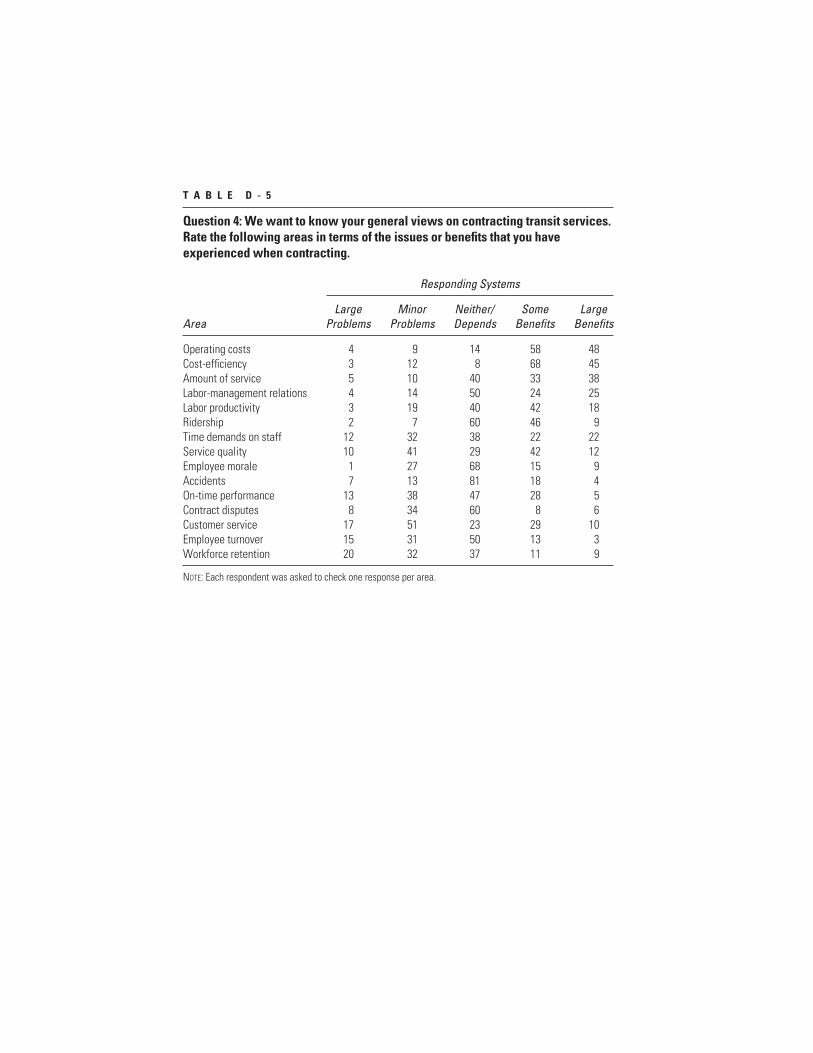
T A B L E D - 5
Question 4: We want to know your general views on contracting transit services.Rate the following areas in terms of the issues or benefits that you have experienced when contracting.
Responding Systems
Large Minor Neither/ Some Large Area Problems Problems Depends Benefits Benefits
Operating costs 4 9 14 58 48Cost-efficiency 3 12 8 68 45Amount of service 5 10 40 33 38Labor-management relations 4 14 50 24 25Labor productivity 3 19 40 42 18Ridership 2 7 60 46 9Time demands on staff 12 32 38 22 22Service quality 10 41 29 42 12Employee morale 1 27 68 15 9Accidents 7 13 81 18 4On-time performance 13 38 47 28 5Contract disputes 8 34 60 8 6Customer service 17 51 23 29 10Employee turnover 15 31 50 13 3Workforce retention 20 32 37 11 9
NOTE: Each respondent was asked to check one response per area.

Tabulations of Responses to Survey Part 2 199
T A B L E D - 6
Question 5: Please describe the positive effects of contracting in more detail below.
Positive Effects Responding Systems
Reduced operating cost 79Reduced administration 35Flexibility 29Expertise of contractor 28More service 23Contractor handles all 14Avoid capital costs 14Competitive environment 12Reduces hiring/staff 10Public image/political 10Only way to start ADA 8Total responding 144
NOTE: Written answers were coded into categories by the committee.
T A B L E D - 7
Question 6, Part 1: Please describe the negative effects of contracting in moredetail below.
Negative Effects Responding Systems
Limited control 59Quality/customer service 48Contractor issues 22Communication 21Turnover/low wages 20Need to monitor 19Personnel issues 14Public/political issues 13Diminishing returns 12Union issues 7Total responding 117
NOTE: Written answers were coded into categories by the committee.

T A B L E D - 8
Question 6, Part 2: Please describe any actions you took to mitigate these negative effects.
Action Responding Systems
Improved contract 22Communication 10Personnel/training 7Additional monitoring 7Enforcement 2Agency actions 2Total responding 40
NOTE: Written answers were coded into categories by the committee.
T A B L E D - 9
Question 7, Part 2: In your opinion, how have the results of transit service contracting met your expectations?
How Did Contracting Meet Expectations? Responding Systems
Fully met 79Partially met 54Did not meet 6Total responding 139
T A B L E D - 1 0
Question 7, Part 2: If contracting did not meet or only partially met your expectations, please explain in more detail.
Why Contracting Fell Below Expectations Responding Systems
Contractor issues 23Service quality/customer service 23Benefits not fully realized 13Not enough control 6Too few bidders 3Personnel issues 4Total responding 49
NOTE: Written answers were coded into categories by the committee.

T A B L E D - 1 1
Question 8: What advice would you give to an agency considering contractingfor the first time?
Advice Responding Systems
Outline specific duties/responsibilities 54Specify performance requirements 47Monitor contract performance 38Scrutinize contractors beforehand 24Talk to other agencies 23Teamwork/communication with contractor 20Competitive procedure, not low cost 19Combine rewards and penalties 18Clear mechanism to make changes 14Identify elements to contract re agency goals 14Specify wage rates/cost escalation 13Penalty clauses/liquidated damages 12Begin with internal cost analysis 12Provide vehicles/facility/maintenance/eligibility 10Be flexible 10Broad involvement in RFP process 10Contractor provides vehicle/fuel/routing 5Other 18Total responding 117
NOTE: Written answers were coded into categories by the committee.
T A B L E D - 1 2
Questions 9 and 14: What year did your agency first begin contracting for fixed-route bus or demand-responsive services?
Year Began Contracting Bus DR Other Percent
1980 and prior 18 21 0 21%1981–1985 18 19 0 20%1986–1990 13 22 0 19%1991–1995 13 39 1 29%1996–2000 11 10 0 11%Total responding 73 111 1 100%

Contracting for Bus and Demand-Responsive Transit Services202
T A B L E D - 1 3
Questions 10 and 15: To the best of your knowledge, what factors did you considerwhen deciding to contract for fixed-route bus or demand-response services?
Major Important Minor Not a Factors Considered Reason Factor Factor Factor
FIXED-ROUTE BUSStart new services 33 14 5 23Reduce costs 30 20 7 18Improve cost-efficiency 26 21 8 20Competitive environment 13 16 10 36Expand services 12 19 5 39More flexibility 10 16 14 35Board direction 11 16 7 41Higher-quality service 10 10 15 40State mandate or law 3 5 4 63Federal emphasis 2 3 13 57
DEMAND-RESPONSIVEStart new services 50 25 7 35Reduce costs 47 25 11 34Improve cost-efficiency 49 22 14 32Competitive environment 21 26 16 54Expand services 22 26 11 58More flexibility 13 34 17 53Board direction 14 21 21 61Higher-quality service 8 26 23 60State mandate or law 14 7 6 90Federal emphasis 6 7 17 87
T A B L E D - 1 4
Questions 11 and 16: How do you obtain these bus or demand-responsive services?
How Services Obtained Bus DR Other Percent
Competitive bidding 36 57 1 47%Negotiated procurement 10 22 0 16%Combination 27 32 0 30%Other 4 9 0 7%Total responding 77 120 1 100%

T A B L E D - 1 5
Questions 12 and 17: How has the number of bidders changed over time?
Change in Number of Bidders Bus DR Total Contracts
Increased 11 11 22Stayed about the same 53 78 131Declined 9 22 32Total responding 73 111 185
T A B L E D - 1 6
Questions 13 and 18: If you do not competitively bid these services, why not?
Why Not Competitively Bid? Bus DR Total Contracts
Satisfied with current 5 7 12Few qualified firms 3 5 8Board policy direction 1 3 4Other 3 3 6Total responding 12 18 30
T A B L E D - 1 7
Question 19: Why do you not contract for transit services?
Reason for Not Contracting Major Reason Important Factor Minor Factor No Factor
Maintain control 33 18 9 27Not cost-effective 22 25 6 34No reason to change 18 23 9 37Lack of qualified firms 11 9 9 58Board direction 10 10 5 62Union contract 7 9 4 67Section 13c prevents 8 5 4 70Too few bidders 7 6 0 74Proposed bids too high 6 3 1 77State laws limit ability 0 2 1 84
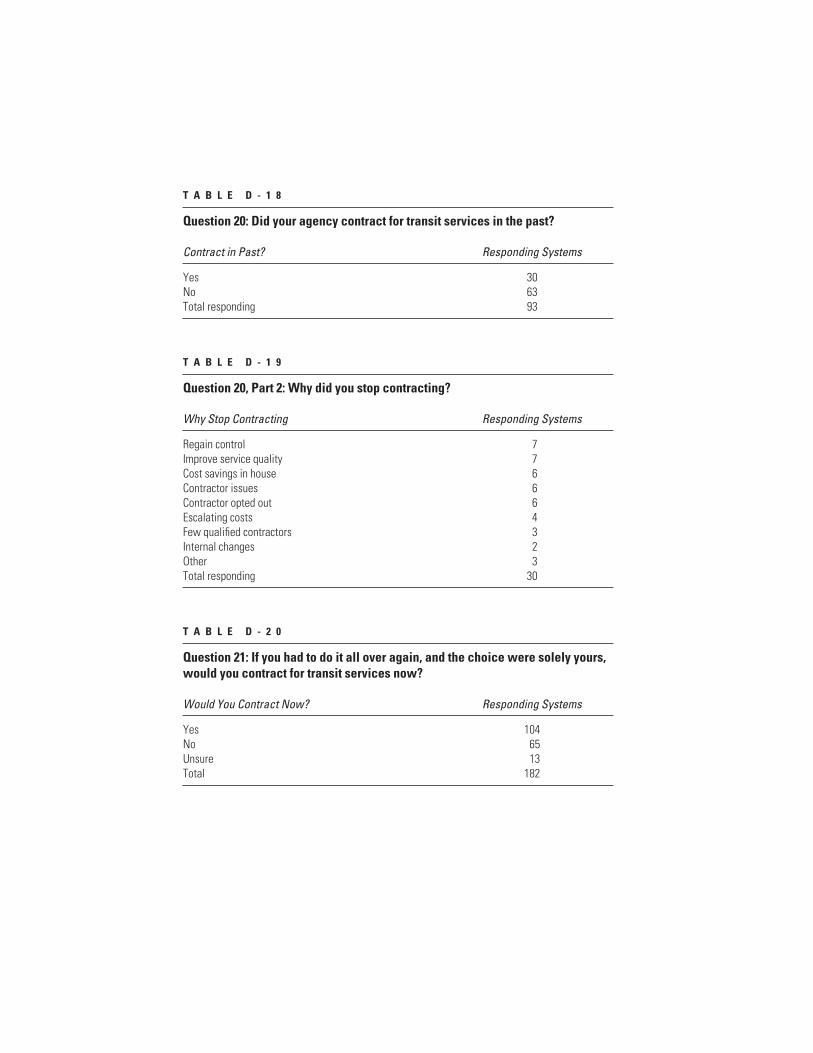
T A B L E D - 1 8
Question 20: Did your agency contract for transit services in the past?
Contract in Past? Responding Systems
Yes 30No 63Total responding 93
T A B L E D - 1 9
Question 20, Part 2: Why did you stop contracting?
Why Stop Contracting Responding Systems
Regain control 7Improve service quality 7Cost savings in house 6Contractor issues 6Contractor opted out 6Escalating costs 4Few qualified contractors 3Internal changes 2Other 3Total responding 30
T A B L E D - 2 0
Question 21: If you had to do it all over again, and the choice were solely yours,would you contract for transit services now?
Would You Contract Now? Responding Systems
Yes 104No 65Unsure 13Total 182

Tabulations of Responses to Survey Part 2 205
T A B L E D - 2 1
Responses to Question 21 by Whether Systems Currently Contract or Do Not Contract
Would You Contract Now? Currently Contract Do Not Contract
Yes 89 15No 16 49Unsure 9 4Total responding 114 68
T A B L E D - 2 2
Question 21, Part 2: Why would you contract now (for those who answered yesto Part 1 of Question 21)?
Why Contract Now? Responding Systems
Cost/cost-effectiveness 32Positive experience 15Flexibility 13Minimizes administration 9Timely/logical for ADA 7Process works 7Higher level of service 4Political/public benefits 4Other 9Total 64
T A B L E D - 2 3
Question 21, Part 2 (for those who answered no to Part 1 of Question 21): Whywould you not contract now?
Why Not Contract? Responding Systems
Direct control 12System in place works 13Service quality 8Collaboration with union 2Too many problems 6Few qualified contractors 7Not cost-effective 8Total 40


207
Study Committee Biographical Information
Gorman Gilbert, Chair, is Head of the School of Civil and En-vironmental Engineering at Oklahoma State University, wherehe is also Director of the Oklahoma Transportation Center. Hewas previously Director of the Institute for Transportation Re-search and Education at North Carolina State University and onthe faculty of the City and Regional Planning Department at theUniversity of North Carolina. From 1989 to 1990 he was Presi-dent of Taxi Systems, Inc., and from 1986 to 1989 he was Chair-man of the New York City Taxi and Limousine Commission. Heis a member of the Transportation Research Board’s (TRB) Ex-ecutive Committee. He earned his Ph.D. in civil engineeringfrom Northwestern University.
J. Barry Barker is Executive Director of the Transit Authority ofRiver City in Louisville, Kentucky. He was previously GeneralManager at Metro in Akron, Ohio, and Assistant General Man-ager for Marketing and Management for the Greater ClevelandRegional Transit Authority. He is a member of the Projects Over-sight and Selection Committee for the Transit Cooperative Re-search Program (TCRP) and has served on several other TCRPpanels. He earned his bachelor’s degree in engineering fromCase Western Reserve University and master’s degree in publicadministration from Cleveland State University.
Santo A. Grande is Executive Director of Delmarva CommunityServices, a position he has held since 1975. He is responsible foradministering the local service delivery system in Dorchester

Contracting for Bus and Demand-Responsive Transit Services208
County, Maryland, including the provision of public transportation services.He is past President of the Transportation Association of Maryland and Mary-land Delegate to the Community Transportation Association of America, anda member of the Maryland Association of Community Services. He earned hismaster’s degree in human resource management from Wilmington College.
Clarence W. Marsella, Jr., is General Manager of the Denver Regional Trans-portation District (RTD). RTD serves more than 2 million people and operatesa light rail system, 900 fixed-route buses, and 200 paratransit vehicles. RTDalso has contracts with private operators for the services of more than 600fixed-route and paratransit vehicles. Previously, Mr. Marsella was a co-ownerof Gulf Coast Paratransit Services in Ft. Myers, Florida; Executive Director ofthe Florida Transit Operators Association; and Chief of Contracted Services forthe Metro Dade Transit Agency. He earned his bachelor’s and master’s degreesin public administration from the University of Connecticut.
James J. McLary is President of Southeast Transit Management, Inc., inAlexandria, Virginia. He was previously President of Transportation Man-agement Services, which provides paratransit systems and turnkey manage-ment for public transit agencies. Before that, he was Executive Vice Presidentof National Transit Services, Inc. He has also been a transit consultant andserved for 8 years as Transit Administrator for the City of Madison, Wiscon-sin. He is on the Board of Directors of the Taxicab, Limousine, and Para-transit Association. He earned his bachelor’s degree in civil engineering fromPurdue University.
Charles L. Pettus, Sr., is International Vice President and General ExecutiveBoard Member of the Amalgamated Transit Union. From 1980 to 1999 he wasPresident of the union’s Baltimore local, where he was chief negotiator for col-lective agreements. He joined the Baltimore Transit Company (which precededthe Maryland Mass Transit Administration) as a bus operator in 1969. Since1990 he has chaired the City of Baltimore’s Wage Commission. He was a mem-ber of TCRP’s Panel on International Transit Studies. He earned his bachelor’sdegree in business administration from the University of Baltimore.
Patrisha Piras is a transportation consultant specializing in public transit plan-ning and evaluation and an elected member of the Board of Directors of AC Tran-sit in Oakland, California. She was previously Director of Paratransit Planning

Study Committee Biographical Information 209
for Laidlaw Transit Services, Inc., and was a senior analyst with the MetropolitanTransportation Commission of the San Francisco Bay Area. She has served onseveral TRB committees, including the Committees on Social and Economic Fac-tors in Transportation, Public Involvement in Transportation, and AccessibleTransportation and Mobility. She earned her J.D. from Hastings College of theLaw, University of California.
Elliott D. Sclar is Professor of Urban Planning and Public Affairs and Directorof the Graduate Program in Urban Planning at Columbia University. He is alsoa research associate at the Economic Policy Institute; a member of the Board ofDirectors of the Institute for Transportation Development Policy; and Chair-man of the Board of Directors of Trillium Asset Management, an investmentadvisory firm. He has studied and written extensively on privatization in pub-lic transportation, hospitals, and other fields and has advised several laborunions on privatization issues. He earned his Ph.D. in economics from TuftsUniversity.
Roger Tauss is National Coordinator for Government and Political Affairs forthe Transport Workers Union of America, a position he has held since 1997.Previously he was the union’s international representative and president of the5,600-member Local 234 in Philadelphia. He was Vice President of the Penn-sylvania State Federation of Labor and Philadelphia Central Labor Councilfrom 1984 to 1989. From 1975 to 1983 he was a bus driver for the SoutheastPennsylvania Transit Authority. He has taught political science at Bryn MawrUniversity and Northwestern University. He earned his bachelor’s degree ineconomics from the University of Pennsylvania.
Brian D. Taylor is Associate Professor of Urban Planning and Associate Di-rector of the Institute of Transportation Studies at the University of California,Los Angeles (UCLA). His research centers on both transportation finance andtravel demographics. His work on transportation finance has involved exam-ining the politics of finance, including the influence of finance on the devel-opment of metropolitan freeway systems and the effect of public transit subsidyprograms on both system performance and social equity. His finance researchhas also examined the effects of contracting for transit service on cost andperformance. His research on travel demographics has emphasized access-deprived populations, including women, racial-ethnic minorities, the disabled,and the poor. He earned his Ph.D. in urban planning from UCLA.

Contracting for Bus and Demand-Responsive Transit Services210
Roger F. Teal is President of TWJ Consulting, a software consulting firm inWilmette, Illinois. He previously taught in the Department of Civil Engineer-ing at the University of California, Irvine. He has authored and coauthored nu-merous articles and reports on transportation policy and public transportation,including the effects of privatization on transit service quality and efficiency.He was a member of TRB’s Paratransit Committee and served on the StrategicTransportation Research Study for Transit. He earned his Ph.D. in political sci-ence from Tufts University.
Nigel H. M. Wilson is Professor of Civil and Environmental Engineering at theMassachusetts Institute of Technology (MIT), where he specializes in publictransportation service planning, transit operations management and control,and advanced technology applications to transport systems. He led the de-partment’s Transportation Group from 1993 to 1996, and currently heads theEngineering Systems Group. He has written extensively on public transporta-tion technology and planning and is former Chairman of the TRB Committeeon Transit Management and Performance. He earned his Ph.D. in Transporta-tion Systems from MIT.