special events and tourism behaviour - vuir - victoria
TRANSCRIPT

SPECIAL EVENTS AND TOURISM BEHAVIOUR: A CONCEPTUALISATION AND AN EMPIRICAL ANALYSIS
FROM A VALUES PERSPECTIVE
by
Leo Kenneth Jago B.E., B.Ec., M.Bus.
This thesis is presented in fulfilment of the requirements of the degree of
Doctor of Philosophy.
Department of Hospitality, Tourism and Marketing Faculty of Business
Victoria University
1997

ii
DECLARATION This thesis contains no material which has been accepted for the award of any other
degree or diploma in any university or other institution. To the best of my knowledge,
this thesis contains no material previously published or written by another person,
except where due reference is made in the text.
______________________
Leo Kenneth Jago

iii
ABSTRACT Despite the fact that special events have become key components of the tourism
development strategy for many regions, the amount of research that has been
conducted within the field of special events does not reflect its importance. It is
unlikely that the substantial growth rate that the field of special events has
experienced in recent years is sustainable and an understanding of consumer patronage
in relation to special events will be crucial for the development and promotion of
events in the future. This study seeks to help address these shortcomings.
In seeking to understand the field of special events, a model that involved the
perspectives of six major parties was proposed. The fundamental aim of this study was
to explore one of these perspectives, namely, that of consumers. This perspective was
then used as the basis for a proposed consumer decision making model in relation to
visitor attractions, including special events, that underpinned the second part of the
thesis.
The first part of this study sought to conceptualise systematically, special events from
a consumer perspective and to conduct a comparative methodological assessment of
three approaches to market segmentation in terms of their ability to explain consumer
behaviour in relation to special events. The three approaches used were personal
values, psychographics and demographics.
A comprehensive and systematic literature review was conducted to identify the
attributes that could be used to categorise an event as ‘special’. Based upon this
review, a schema of event categories was proposed as well as a listing of the core and
qualifying attributes that could be used to describe each of the special event
categories. A set of definitions for each of the main special event categories was then
developed. In order to operationalise the term ‘special event’, primary research was
then conducted to identify the attributes that consumers believed were important in
describing a special event. Several distinct measuring techniques, including elicitation,
attribute rating and conjoint analysis, were used in the questionnaire for this part of
the study, in an effort to derive a comprehensive view of the consumer understanding

iv
of special events and to facilitate the convergent validation of the various techniques.
It was found that there were four principal attributes that consumers used to describe a
special event, these being: the number of attendees, the international attention due to
the event, the improvement to the image and pride of the host region as a result of
hosting the event, and the exciting experience associated with the event. The study
also found a high degree of convergence between the techniques used.
The second part of this study sought to understand and predict consumer behaviour in
relation to visitor attractions in general, and special events in particular. This further
developed the consumer perspective that was the key underlying theme of the thesis.
In the second part of this study, 500 randomly selected Melbourne residents were
asked to indicate their visit behaviour in relation to a range of visitor attractions
including special events. Three dimensions of visit behaviour were measured in order
to overcome limitations noted in earlier studies. The visit dimensions used were actual
visitation, visit interest and visit intention. This enabled analysis of respondents’ visit
behaviour on three dimensions to be assessed at both the generic level and at the
individual attraction level. Being an origin-based study, unlike most of the studies that
have been conducted in this field which have been destination-based, enabled
consumers and non-consumers alike to be considered. Although the consumer
decision making model, referred to earlier, which was used in this part of the study,
included a range of variables thought to impact upon the consumer decision process,
the focus of this thesis was on the comparative abilities of personal values,
psychographics and demographics to explain consumer behaviour. Personal values
were measured in the questionnaire via the List of Values (LOV) and psychographics
were measured using a battery of AIO statements (Activity, Interest and Opinion).
Assessing the explanatory power of three techniques on three dimensions of visitation
to a wide range of visitor attractions enabled a systematic evaluation to be conducted
that was more methodologically rigorous than many of the other studies that have
been reported in this field.
Analysis of the data found that special events were regarded by consumers as a
separate category of visitor attractions and that the segmentation approaches assessed
in this study were better able to explain behaviour in relation to special events than
v
they were able to explain behaviour in relation to permanent attractions. Although
psychographics demonstrated explanatory power well ahead of both the LOV and
demographics, the explanatory power was not high for any of the approaches.
Based on the research that has been reported on the importance of personal values to
consumers, it would be expected that values should have substantial explanatory
power. The fact that the LOV was not able to provide substantial explanatory power in
relation to special events in this study was suggested to be related to the measurement
of values as opposed to a more fundamental problem with values themselves. Results
of this study questioned the comprehensiveness of the LOV.
The finding that none of the variables used in this study was able to account for a large
percentage of consumer behaviour suggested strongly that there were other important
independent variables not measured in this study. The influences of travel party and
travel occasion on behaviour were seen as two such variables.

vi
ACKNOWLEDGMENTS I would like to acknowledge the enormous encouragement and guidance offered by
my supervisor, Professor Robin Shaw. His ability to conceptualise a problem and his
methodological rigour were much appreciated throughout the process.
I am also indebted to my family, Wendy, David and Laura, without whose support and
incredible tolerance, completion of the thesis would not have been possible. Until one
attempts a project of this magnitude, it is difficult to comprehend the sacrifices that
family members are forced to make.
My sincere appreciation is extended to Cathy Gutierrez for all her assistance in
compiling the final document. I had no idea that merging the individual chapter files
into the final document would be such an onerous task.
Finally, I am indebted to the Faculty of Business at Victoria University for the
Doctoral Scholarship which enabled me to complete this thesis and to my colleagues
in the Department of Hospitality, Tourism and Marketing for covering my duties
whilst I was on leave.

vii
TABLE OF CONTENTS
SPECIAL EVENTS AND TOURISM BEHAVIOUR: A CONCEPTUALISATION AND AN EMPIRICAL ANALYSIS
FROM A VALUES PERSPECTIVE Page
DECLARATION ___________________________________________________________________ ii
ABSTRACT ______________________________________________________________________ iii
ACKNOWLEDGMENTS ___________________________________________________________ vi
TABLE OF CONTENTS ___________________________________________________________ vii
LIST OF TABLES ________________________________________________________________ xi
LIST OF FIGURES ______________________________________________________________ xiv
CHAPTER 1 ______________________________________________________________________ 1
INTRODUCTION__________________________________________________________________ 1
1.1 Background__________________________________________________________________ 1
1.2 Research Aim and Scope _______________________________________________________ 3
1.3 Importance of the Subject ______________________________________________________ 5
1.4 Limitations and Assumptions ___________________________________________________ 5
1.5 A General Model of Special Events ______________________________________________ 6
1.6 Special Event Consumer Behaviour Model ________________________________________ 9
1.7 Structure of the Thesis________________________________________________________ 12
PART I__________________________________________________________________________ 16
A Conceptualisation of Special Events_________________________________________________ 16
CHAPTER 2 _____________________________________________________________________ 17
BACKGROUND, DEFINITION AND A TYPOLOGY OF SPECIAL EVENTS________________ 17
2.1 Introduction ________________________________________________________________ 17
2.2 History and Growth of Special Events ___________________________________________ 17
2.3 Importance of Special Events __________________________________________________ 20
2.4 Need for a Definition _________________________________________________________ 24
2.5 Leisure Versus Tourism ______________________________________________________ 26
2.6 Attraction Versus Activity_____________________________________________________ 29
2.7 Literature Review____________________________________________________________ 30
2.8 Typology ___________________________________________________________________ 36
2.9 Attribute Summary __________________________________________________________ 47
2.10 Definitional Framework _____________________________________________________ 49
2.11 Core and Qualifying Attributes _______________________________________________ 50
2.12 Definitions_________________________________________________________________ 55
CHAPTER 3 _____________________________________________________________________ 57

viii
CONSUMER PERSPECTIVE ON SPECIAL EVENT DEFINITION AND TYPOLOGY________ 57
3.1 Introduction ________________________________________________________________ 57
3.2 Attribute Identification _______________________________________________________ 58
3.3 Questionnaire Design_________________________________________________________ 59
3.4 Survey Sample ______________________________________________________________ 66
3.5 Pilot Testing ________________________________________________________________ 67
3.6 Survey Administration _______________________________________________________ 68
3.7 Survey Response_____________________________________________________________ 69
3.8 Analysis Of Results __________________________________________________________ 69 3.8.1 Direct Rating of Events_____________________________________________________ 69 3.8.2 Elicitation _______________________________________________________________ 75 3.8.3 Direct Attribute Rating _____________________________________________________ 77 3.8.4 Rating of Attributes at Specific Events _________________________________________ 82 3.8.5 Conjoint Analysis _________________________________________________________ 83 3.8.6 Correlations of Event Rating with Visit Interest and with Visit Intention ______________ 84 3.8.7 Relationship Between Event Rating and Visit History _____________________________ 85
3.9 DISCUSSION _______________________________________________________________ 86 3.9.1 Comparing the Measures____________________________________________________ 86 3.9.2 Multi-Attribute Attitude Model_______________________________________________ 88 3.9.3 Representativeness of the Conjoint Dimensions__________________________________ 89 3.9.4 Different Constructs _______________________________________________________ 90 3.9.5 Key Special Event Attributes ________________________________________________ 91 3.9.6 Categorisation of Special Events______________________________________________ 92
3.10 COMPARISON OF CONSUMER PERSPECTIVE OF SPECIAL EVENTS WITH THE CORE AND QUALIFYING ATTRIBUTES IDENTIFIED IN THE LITERATURE _________________________________________________________________ 93
3.11 LIMITATIONS ____________________________________________________________ 93
3.12 CONCLUSION_____________________________________________________________ 94
PART II _________________________________________________________________________ 95
The Ability of Individual Differences to Explain Special Event Behaviour ____________________ 95
CHAPTER 4 _____________________________________________________________________ 97
SPECIAL EVENT RELATED CONSUMER BEHAVIOUR _______________________________ 97
4.1 Introduction ________________________________________________________________ 97
4.2 Consumer Behaviour _________________________________________________________ 98
4.3 Market Segmentation ________________________________________________________ 98
4.4 Motivation_________________________________________________________________ 101
4.5 Personal Values ____________________________________________________________ 106
4.6 Lifestyle and Psychographic Segmentation ______________________________________ 115
4.7 Segmenting the Special Event Consumer Market_________________________________ 118 4.7.1 Destination-Based Studies _________________________________________________ 120 4.7.2 Origin-Based Studies _____________________________________________________ 124 4.7.3 Australian Studies ________________________________________________________ 126
4.8 Summary__________________________________________________________________ 127
CHAPTER 5 ____________________________________________________________________ 129

ix
RESEARCH HYPOTHESES _______________________________________________________ 129
5.1 Introduction _______________________________________________________________ 129
5.2 Distinctiveness of Special Events ______________________________________________ 130
5.3 Stability of the LOV_________________________________________________________ 130
5.4 Measurement of Values ______________________________________________________ 130
5.5 Value Domains _____________________________________________________________ 131
5.6 Internal versus External Locus of Control ______________________________________ 133
5.7 Relationship Between Values and Demographics _________________________________ 134
5.8 Generic Versus Specific Behaviour ____________________________________________ 135
5.9 The Different Dimensions of Visitation _________________________________________ 137
5.10 Explaining Behaviour in Relation to Special Events______________________________ 140
5.11 One-time Versus Repeat Visitors to Special Events ______________________________ 142
5.12 Comparison of High Special Event Visit Intention and Low Special Event Visit Intention _____________________________________________________________________ 144
5.13 Clusters __________________________________________________________________ 145
5.14 Summary of Research Hypotheses ___________________________________________ 145
CHAPTER 6 ____________________________________________________________________ 153
METHODOLOGY________________________________________________________________ 153
6.1 Introduction _______________________________________________________________ 153
6.2 Research Methodology ______________________________________________________ 154
6.3 Questionnaire Development __________________________________________________ 154 6.3.1 Attractions: Permanent and Special Events_____________________________________ 154 6.3.2 Values _________________________________________________________________ 157 6.3.3 AIOs __________________________________________________________________ 158 6.3.4 Demographics ___________________________________________________________ 161
6.4 Pilot Testing the Questionnaire _______________________________________________ 161
6.5 Questionnaire Administration ________________________________________________ 162
CHAPTER 7 ____________________________________________________________________ 163
RESULTS AND DISCUSSION _____________________________________________________ 163
7.1 Introduction _______________________________________________________________ 163
7.2 Survey Response____________________________________________________________ 170
7.3 Actual Visitation____________________________________________________________ 172
7.4 Visit Interest _______________________________________________________________ 173
7.5 Visit Intention______________________________________________________________ 177
7.6 Values ____________________________________________________________________ 180 7.6.1 Exploratory Factor Analysis (EFA) __________________________________________ 181 7.6.2 Value Domains __________________________________________________________ 183 7.6.3 The Relationship Between Value Domains and Behaviour ________________________ 188 7.6.4 Relationship Between Event Visit Intention and Value Domains____________________ 189 7.6.5 Ranking of Values________________________________________________________ 190 7.6.6 Frequency Distribution of Top-ranked Value Choice_____________________________ 192 7.6.7 Value Domains based upon Top-ranked Value__________________________________ 193 7.6.8 Demographic Differences Across Value Profiles ________________________________ 195

x
7.6.9 Demographic Differences in Value Choices as Determined by the Top Ranked Value ______________________________________________________________________ 195 7.6.10 Comparison of Value Rating with Value Ranking ______________________________ 198 7.6.11 Relationship Between LOV Items and the Three Dimensions of Visitation___________ 200
7.7 AIOs _____________________________________________________________________ 204 7.7.1 Relationship Between AIOs and the Three Dimensions of Visitation ________________ 206 7.7.2 Demographic Differences Across AIO Profiles _________________________________ 210
7.8 Demographics______________________________________________________________ 211 7.8.1 Relationships of Demographic Variables to LOV _______________________________ 213
7.9 Global Visitation Variable____________________________________________________ 214
7.10 Correlation Between the LOVs and the AIOs ___________________________________ 216
7.11 Past Visitation as a Predictor of Visit Interest and Visit Intention __________________ 217
7.12 Prediction of Actual Special Event Visitation ___________________________________ 219
7.13 Prediction of Event Visit Intention____________________________________________ 220
7.14 Comparing High Event Visit Intention Respondents with Low Event Visit Intention Respondents __________________________________________________________ 223
7.15 Discriminant Analysis to Classify Visit Intention ________________________________ 228
7.16 Comparison Between First Time and Repeat Visitors ____________________________ 229
7.17 Cluster Analysis ___________________________________________________________ 233 7.17.1 Clustering of Value Segments (As Determined by LOV Factor Scores) _____________ 234 7.17.2 Clustering of Value Segments (As Determined by the Top-Ranked Value)___________ 239 7.17.3 Clustering of Psychographic Segments (As Determined by AIO Factor Scores) _______ 243 7.17.4 Clustering of Event Visit Intention (As Determined by Event Visit Intention Factor Scores) _______________________________________________________________ 248
7.18 Summary of Research Hypotheses Results _____________________________________ 252
CHAPTER 8 ____________________________________________________________________ 253
CONCLUSION __________________________________________________________________ 253
8.1 Key Findings_______________________________________________________________ 253 8.1.1 A Conceptualisation of Special Events ________________________________________ 253 8.1.2 The Ability of Individual Differences to Explain Special Event Behaviour____________ 255
8.2 Summary__________________________________________________________________ 266
8.3 Future Research ____________________________________________________________ 267
BIBLIOGRAPHY ________________________________________________________________ 270
APPENDICES___________________________________________________________________ 287 A. SPECIAL EVENT ATTRIBUTE QUESTIONNAIRE
B. SPECIAL EVENT MAIL BACK QUESTIONNAIRE
C. ACTIVITY, INTEREST AND OPINION (AIO) MASTER LIST
D. INTERVIEWER ADMINISTERED QUESTIONNAIRE
E. RELATIONSHIPS BETWEEN THE LOV AND THE THREE DIMENSIONS OF VISITATION
F. RELATIONSHIPS BETWEEN AIOs AND THE THREE DIMENSIONS OF VISITATION
G. RELATIONSHIPS BETWEEN THE LOV AND AIOs

xi
LIST OF TABLES Page Table 2.1 Descriptors used in the Titles of Refereed Articles in FMET_______________________ 30
Table 2.2 Special Event Attributes Identified in the Literature _____________________________ 48
Table 2.3 Special Event Core and Qualifying Attributes __________________________________ 54
Table 3.1 Special Event Attributes____________________________________________________ 60
Table 3.2 Listing of Events used in the Questionnaire ____________________________________ 61
Table 3.2 Listing of Events used in the Questionnaire (continued) __________________________ 63
Table 3.3 Conjoint Dimensions and Levels_____________________________________________ 65
Table 3.4 Ratings of Event Specialness________________________________________________ 70
Table 3.5 Factor Analysis of Event Specialness _________________________________________ 74
Table 3.6 Keywords Identified in the Elicitation Section __________________________________ 76
Table 3.7 Rank order of Conjoint Dimensions based on Force-fitting Keywords
Identified in the Elicitation Section ___________________________________________________ 77
Table 3.8 Direct Attribute Ratings____________________________________________________ 79
Table 3.9 Factor Analysis of Attribute Ratings__________________________________________ 80
Table 3.10 Comparison of the Rank Order of Attributes of the Three Events__________________ 82
Table 3.11 Spearman Rank-Order Coefficients__________________________________________ 82
Table 3.12 Conjoint Analysis ________________________________________________________ 83
Table 3.13 Comparison of the Rankings Derived from the Different Measurement Techniques___ 87
Table 3.14 Comparison of the Rankings Derived from the Different Measurement Techniques (Conjoint Dimensions) _____________________________________________________________ 87
Table 3.15 Spearman Rank-Order Coefficients of the Three Measures_______________________ 87
Table 3.16 Event Specialness Correlations _____________________________________________ 88
Table 3.17 Ranking of the Conjoint Dimension Ratings __________________________________ 89
Table 3.18 Comparison of Conjoint Dimensions and Key Attribute Factors __________________ 90
Table 4.1 The Rokeach Value Survey ________________________________________________ 109
Table 4.2 The List of Values _______________________________________________________ 110
Table 6.1 List of Special Events Included in the Questionnaire ___________________________ 155
Table 6.2 Permanent Attractions Included in the Questionnaire___________________________ 155
Table 6.3 Values included in the Questionnaire________________________________________ 158
Table 7.1 Demographic Characteristics of Usable Questionnaire Respondents _______________ 171
Table 7.2 Frequency of Actual Visitation _____________________________________________ 172
Table 7.3 Exploratory Factor Analysis of Visit Interest for all Visitor Attractions _____________ 175
Table 7.4 Exploratory Factor Analysis of Visit Interest for Special Events __________________ 176
Table 7.5 Exploratory Factor Analysis of Visit Intention for all Visitor Attractions ___________ 178
Table 7.6 Exploratory Factor Analysis of Visit Intention for Special Events _________________ 179
Table 7.7 Mean Ratings for the extended list of Personal Values __________________________ 180
Table 7.8 Exploratory Factor Analysis of the Extended List of Values______________________ 182

xii
Table 7.9 Exploratory Factor Analysis of the Original List of Values ______________________ 183
Table 7.10 Madrigal and Kahle (1994) Value Domains__________________________________ 184
Table 7.11 Homer and Kahle (1988) Value Domains____________________________________ 184
Table 7.12 Kamakura and Novak (1992) Motivational Domains __________________________ 185
Table 7.13 Keng and Yang (1993) Value Domains______________________________________ 186
Table 7.14 Thrane (1997) Value Domains ____________________________________________ 187
Table 7.15 Comparison of Value Factors across Studies _________________________________ 187
Table 7.16 Correlations between Value Domains and Visit Behaviour at Visitor Attractions ____ 189
Table 7.17 Weighted Ranking of Values ______________________________________________ 191
Table 7.18 Respondent Choice of Top-ranked Value ____________________________________ 192
Table 7.19 Respondent Choice of Value Domain based on Top-ranked Value________________ 194
Table 7.20 ANOVA Results - Demographic Variables and LOV Factor Scores _______________ 195
Table 7.21 Chi-square Analyses - Demographic Variables and Top-ranked Value____________ 196
Table 7.22 Comparison of Hierarchical Positions of Value Rating versus Value Ranking ______ 198
Table 7.23 Relationships between the Three Dimensions of Visitation and the LOV for all
Visitor Attractions ________________________________________________________________ 201
Table 7.24 Incidence of Statistically Significant Relationships between LOV and Three
Dimensions of Visitation. __________________________________________________________ 203
Table 7.25 Exploratory Factor Analysis of AIOs _______________________________________ 204
Table 7.26 Relationships between the Three Dimensions of Visitation and the AIOs for all
Visitor Attractions ________________________________________________________________ 207
Table 7.27 Incidence of Statistically Significant Relationships between the AIOs and the
Three Dimensions of Visitation _____________________________________________________ 208
Table 7.28 ANOVA Results - Demographic Variables and AIO Factor Scores _______________ 210
Table 7.29 Relationships between the Three Dimensions of Visitation and Demographics
for all Visitor Attractions __________________________________________________________ 212
Table 7.30 ANOVA Results - Demographic Variables and items in the LOV _________________ 213
Table 7.31 Descriptives for Global Visitation Variables__________________________________ 215
Table 7.32 Relationship between Global Visitation Variables and Segmentation Approaches ___ 215
Table 7.33 Multiple Regressions Using Various Independent Variables to Explain Event
Visit Intention ___________________________________________________________________ 221
Table 7.34 Comparison of the Results of Multiple Regressions Conducted Using Various Independent Variables in Two Studies________________________________________________ 223
Table 7.35 Demographic Characteristics of High and Low Visit Intention Respondents________ 225
Table 7.36 T-test Results between Respondents having High Event Visit Intention and those
having Low Event Visit Intention____________________________________________________ 226
Table 7.37 Chi-square Analysis - Event Visit Intention and Past Visitation __________________ 230
Table 7.38 Chi-square Analysis - First Time and Repeat Visitors __________________________ 230
Table 7.39 Chi-square Analysis - Demographic Variables and Repeat Visitation _____________ 231

xiii
Table 7.40 The Number of Members in the Various Cluster Solutions for Value Segments (as determined by LOV factor scores) ___________________________________________________ 234
Table 7.41 Cluster Centres for the Four Cluster Solution ________________________________ 235
Table 7.42 MANOVA of Event Visit Intention Factors by Value Clusters ___________________ 236
Table 7.43 Chi-square Analysis - Demographic Variables and Value Clusters _______________ 238
Table 7.44 MANOVA of Psychographic Factors by Value Clusters ________________________ 239
Table 7.45 MANOVA of Event Visit Intention Factors by Value Clusters (top-ranked) ________ 240
Table 7.46 MANOVA of Psychographic Factors and LOV Factors by Value Clusters
(top-ranked)_____________________________________________________________________ 241
Table 7.47 The Number of Members in the Various Cluster Solutions for Value Segments (as determined by AIO factor scores) ____________________________________________________ 243
Table 7.48 MANOVA of Event Visit Intention Factors by Psychographic Clusters ____________ 244
Table 7.49 Comparison of the Outcomes of Clustering Based on Values with Clustering
Based on Psychographics __________________________________________________________ 246
Table 7.50 Chi-square Analysis - Demographic Variables and Psychographic Clusters ________ 247
Table 7.51 MANOVA of Value Factors by Psychographic Clusters ________________________ 248
Table 7.52 The Number of Members in the Various Cluster Solutions for Value Segments
(as determined by event visit intention factor scores) ____________________________________ 249
Table 7.53 MANOVA of Value Factors by Event Visit Intention Clusters ___________________ 249
Table 7.54 Chi-square Analysis - Demographic Variables and Event Visit Intention Clusters ___ 251

xiv
LIST OF FIGURES Page Figure 1.1 Getz Model of Special Events. ___________________________________________ 6 Figure 1.2 Model of Special Events.________________________________________________ 7 Figure 1.3 Engel, Blackwell and Miniard Consumer Decision-process Model._____________ 10 Figure 1.4 Consumer Decision Process Model.______________________________________ 13 Figure 2.1 Event Framework.____________________________________________________ 49 Figure 4.1 Segmentation Variables for Events. _____________________________________ 119 Figure 5.1 Contemporary View of Attitude. ________________________________________ 137 Figure 5.2 Model of Behaviour. _________________________________________________ 138 Figure 7.1 Relationships between LOV, AIOs and Demographics, and the set of named attractions. __________________________________________________________________ 164

1
CHAPTER 1
INTRODUCTION
1.1 Background There are few developed countries for which tourism is not an important sector of
the economy. For many developing countries, the growth potential of tourism
provides a particularly attractive opportunity, especially in economies where
traditional industries are in a state of decline.
Modern international tourism commenced at the end of the Second World War
(Crouch 1992) and growth in tourism since this time has been rapid. Mass tourism
has been the engine behind much of this growth. This is likely attributable to the
‘production mentality’ that underpins many developed societies, whereby
operating costs are reduced as output increases. As a consequence, it has often
been assumed that large tourist numbers would naturally lead to increased
profitability of the industry. However, there is now concern in some quarters, that
the benefits of mass tourism have been overstated and the costs understated, if not
ignored altogether. In 1992, the Pacific Asia Travel Association produced a report
that critically evaluated the mass tourism phenomenon (PATA 1992). This report
contended that mass tourism was not a sustainable form of tourism as it had major
negative impacts on both the natural and social environments. The report also
contended that mass tourism in many parts of the world did not produce the promised
economic benefits and in fact led to what the report termed “profitless volume” (p.
9).
During the 1990s, there has been a growing number of people advocating a move
away from mass tourism to forms of tourism that will be sustainable and will deliver
greater economic benefits. Often these alternative forms of tourism have been
categorised as ‘special interest tourism’, the important characteristics of which have
been claimed to be low volume and high value (Hall 1995). There are many forms of
special interest tourism including ecotourism, heritage tourism, cultural tourism,
adventure tourism, rural tourism, industrial tourism and special event tourism. The

2
final form in this list, which is the topic of this thesis, has experienced substantial
growth in recent years and special events “are now widely recognised as one of
the fastest growing types of tourism attractions” (Crompton and McKay 1997, p.
429).
An important factor in the growth of the field of special events has been the role
played by the media, especially in relation to large special events such as the
Olympic Games or the Formula One Grand Prix. As a result of this media focus
on the larger special events, many people fail to recognise that these events make
up only a very small proportion of the special events that are on offer.
The variety of special events on offer is substantial and there are many reasons
why host regions wish to stage them. Some of the more common reasons are to
inject money into the region, to enhance the awareness of a region, to build
community spirit, and to improve facilities for the region. As with tourism itself,
however, it is important to recognise that there are costs associated with special
events and detailed planning is required to ensure that the relationship between
benefits and costs is optimised.
In recognising the importance to the tourism industry of special events, most of
Australia’s state and territory government tourism organisations have established
special event divisions to enhance the number and size of special events being
offered in the relevant region. Since the demand for special events has greatly
exceeded the supply in most places, the need for research in this field has been
given low priority, which has resulted in a dearth of research being conducted.
With the rapid growth in the number of special events that has occurred in more
recent times, however, there is an increasing likelihood that the market for special
events is approaching saturation (Janiskee 1994). In order for special events to
survive in a saturating market, it becomes more important for special events to be
tailored specifically to meet the needs of the consumer. This requires a detailed
understanding of consumer behaviour in relation to special events, which is an
area of research that has received little attention (Gorney and Busser 1996).

3
Of the research that has been done in this field, much has been descriptive in nature
and lacking in rigour (Mount and Leroux 1994), and it has often been quite
misleading (Burns, Hatch and Mules 1986). Despite the importance of special events
and the dearth of research in this field, leisure scientists have been slow to address
the problem (Cousineau 1991; Butler and Smale 1991). According to Roche (1994),
little of the research that has been done has focussed on causation and explanation;
instead it has tended to concentrate on the effects, thereby doing little for the
understanding of special events. Given the focus now accorded to special events, it is
quite urgent that research into the field of special events be advanced (Mohr,
Backman, Gahan and Backman 1993).
As a result of its rapid growth, the field of special events is highly unstructured
and little has been done to reduce the semantic ambiguity of the field. With
respect to the need to develop an understanding of consumer needs in relation to
special events, most of the few studies that have been conducted to examine
segmentation and consumer motives have been destination-based as contrasted
with origin-based. The major drawback of destination-based studies is that they
consider only the needs of patrons and ignore the needs of the wider consumer
market (Ryan 1995).
1.2 Research Aim and Scope The aim of this thesis was to contribute to overcoming these shortfalls using a
consumer orientation in order to achieve three key objectives:
1. To develop a systematic conceptualisation of special events,
2. To develop an explanatory model of consumer choice in relation to special
events, and
3. To compare and evaluate the performance of three segmentation
techniques in explaining consumer behaviour in relation to special
events.
Although a number of researchers has discussed various definitions of special
events, little has been done to draw together the results of these analyses in order
to build a conceptual framework for the field. No research has been found that

4
attempts to conceptualise special events from a consumer perspective and to
develop a definitional typology which is essential for comparing studies.
An origin-based study was adopted rather than the more commonly used
destination study, in order that the behaviour of the entire market could be
considered, not just current consumers. Since respondents to the study were
selected at random, it is possible to generalise the findings to the total population
relevant to this study.
Many research studies appear to utilise a single data gathering technique and to
subject the data to single methods of analysis. This may raise questions about the
stability of the findings to changes in techniques and there is often insufficient
rigorous comparison of techniques in research studies. Since methodological
rigour was seen as an important element of this study, convergent validation was
employed in this thesis wherever possible so that comparative assessments of
techniques could be conducted. Personal values was chosen as the prime criteria
in the segmentation part of the research, with psychographics and demographics
being selected for comparative purposes. Personal values has been proposed in a
variety of settings, as a valuable technique to segment markets and understand
consumer behaviour (see, for example, Beatty, Kahle, Homer and Mirsa 1985;
Madrigal and Kahle 1994; Pitts and Woodside 1984). Values, which are said to
underpin attitudes, are claimed to guide behaviour in a general sense and have
been used effectively for this purpose by various researchers. This study assessed
the use of values as a means of segmenting the market in relation to special events
and for explaining special event related behaviour.
Since an origin study was adopted, it was possible to include a range of attractions
so that generic tourism behaviour could be explored, rather than simply behaviour
in relation to a specific special event.
Past visitation has been the measure of consumer behaviour in most studies
conducted in this field to date. Such a measure is adequate for developing some
aspects of descriptive and explanatory models of behaviour but less so for the

5
development and testing of predictive models. Proposing a model that was able to
predict behaviour was seen as an important outcome of this research and in order
to facilitate the testing of this outcome, visit interest and visit intention were
measured for each attraction as well as visit history.
1.3 Importance of the Subject Special events have become a key element in the tourism development strategies
of many regions, with an increasing number of cities now adopting special event
related designations such as ‘festival city’ (Getz and Smith 1994). In Australia,
special events are listed as important strategic areas in most state and territory
tourism plans and each of the state and territory government tourism organisations
believes that it has a competitive advantage in the field of special events (Jago and
Shaw 1995).
Of the small amount of research that has been conducted in the field of special
events to date, much has been from a supply perspective where events and their
impacts are the foci of study. A market perspective of special events is crucial if
particular special events are to survive in an increasingly competitive market
where the cost of staging such events has risen substantially. Developing
explanations for consumer behaviour in relation to special events will assist
organisers of special events to create or modify events that meet the needs of
consumers and to promote them in the most effective means. This information
would also assist state and regional tourism organisations in developing their
marketing strategies in order to maximise the benefits of special event tourism.
1.4 Limitations and Assumptions The key limitation of the primary research component of this study is that it was
restricted to Melbourne residents and, therefore, it is not possible to generalise the
findings beyond this region. However, the conceptualisation of special events that
was conducted, was based on an extensive literature review and is international in
scope.

6
1.5 A General Model of Special Events There is a variety of types of theoretical models, each of which serves a different
purpose. According to Getz (1986), theoretical models can be described as
‘descriptive’ where the model simply defines the system's main elements,
‘explanatory’ where the model looks at the relationships between components
without necessarily specifying causality, and ‘predictive’ where the relationship of
causality is explored to permit forecasting.
Although a number of models has been developed to describe or define tourism (see,
for example, Leiper 1995; Mill and Morrison 1992; Witt and Moutinho 1995), only
two references to any kind of special event tourism models have been found: one by
Sparrow (1989) and the other by Getz (1997). In his introduction, Sparrow (1989, p.
250) stated that his purpose was "to provide a discussion on a suggested model for
defining what constitutes a tourism hallmark event", which does not seem consistent
with the actual title of his model, being, 'Planning for Tourism Hallmark Events
Model'. The reality of the Sparrow model is that it would be better classed as a
diagrammatic description of the steps involved in the planning of hallmark events
than as a theoretical planning model. It certainly has no application beyond the
practical planning process.
The Getz (1997) model was based on the key perspectives and inter-relationships
associated with special events and the diagrammatic representation of this model is
presented as Figure 1.1. Getz indicated clearly his belief that one must consider
special events from a number of perspectives in order to fully grasp the meaning of
special events. In his model of perspectives, which would be classed as a descriptive
model, Getz listed six perspectives of special events: organiser, sponsor, customer,
community, environment and economy. After reading the descriptions that Getz
provided for each of the six perspectives, the merit of the final two perspectives was
not clear. Unlike the other perspectives, these two did not relate to people and
although they impacted upon, and were impacted by special events, it is not clear that
they should have been classed as perspectives.
Figure 1.1 Getz Model of Special Events.

7
Source: Figure 3.1 in Getz (1997).
The concept of examining special events from various perspectives prompts one to
recognise the complexity of the field and the need to consider the interests of
different groups. Therefore, a model based on perspectives has been presented here
to represent special events. This model, which was derived from that provided by
Getz, includes the additional perspectives of suppliers and government, and deletes
reference to environmental and economic perspectives. A diagrammatic
representation of this model is presented in Figure 1.2. In a schematic sense, the
model shows the relationship between the various parties involved in the operation of
a special event using labelled arrows to identify the main flows that occur between
the different parties. There is clearly a high degree of inter-relationship between the
groups involved.
Figure 1.2 Model of Special Events.
Sponsors
ORGANISER’S GOALS
-service - profit -cause related -doing business -development
THE EVENT
and related products
CUSTOMER/ GUEST
BENEFITS -leisure -education -service
SPONSOR AND PARTNER
GOALS -same as organisers
plus marketing, sales
ECONOMY
-development through tourism and place
marketing
COMMUNITY
-social and cultural meanings & impacts
ENVIRONMENT -sustainability of events -green operations -conservation
target marketing support
demand support
host-guest
relations
community
relations
production
support
Resources
Awareness & Sales

8
In considering this model, it is important to recognise that expectations and terms of
success vary for each of the perspectives. It would therefore be possible for a
particular special event to be regarded as a success by some of the participant groups,
and as a failure by others. In order to assess the event's success from the different
perspectives, therefore, it is necessary to understand the objectives and criteria of the
various groups. The timeframe should also be considered in assessing special events
as some perspectives would consider the event in relation to short term goals whilst
others would consider a longer term perspective.
The model presented in Figure 1.2 provides a useful overview of the various groups
involved in the conduct of a special event and how these groups relate to each other
in a general sense. However, to fully understand the operation of a special event, one
needs to explore in a detailed sense, the relationships between each of the parties
identified in this model. The complexity is such that each of these relationships
would become a study in its own right. This thesis explores in detail one perspective
identified in the model, namely, that of the consumer. Given that the consumer
Special Events Patrons
Special Event
Organiser
Government
Suppliers
Community
Awareness & Sales
Labour & Payment
Support
Popularity
Support Patrons
Awareness & Economic Benefits
Economic Benefits & Popularity
Patrons
Need Satisfaction
Payment
Resources
Revenue
Goods &
Services Co-ordination
Marketing Efforts

9
orientation is fundamental to modern marketing, it is essential that this perspective be
thoroughly understood if special events are to reach their potential. This is not meant
to undermine the importance of the other perspectives, but it does provide a reason
for considering the consumer perspective first.
1.6 Special Event Consumer Behaviour Model Although, in recent years, a number of researchers has developed and explored
tourism choice behaviour models (see, for example: Woodside and Lysonski 1989;
Um and Crompton 1990; Crompton 1992; Crompton and Ankomah 1993; Ryan
1994), very little event-specific research on motivation and behaviour has been
conducted (Uysal, Gahan and Martin 1993).
Despite the fact that the terms used to describe different stages of the consumer
purchase decision process vary, there is wide recognition that the key elements of
the process are:
• Problem recognition
• Information search
• Alternative evaluation
• Purchase decision
• Postpurchase behaviour
(See, for example, Assael 1992; Berkowitz, Kerin and Rudelius 1989; Engel,
Blackwell and Miniard 1995; Mowen 1993; Schiffman, Bednall, Watson and
Kanuk 1997).
Berkowitz, Kerin and Rudelius (1989) presented a diagrammatic representation of
the influences on the consumer purchase decision process that included the
marketing mix influences, psychological influences, sociocultural influences, and
situational influences. This model is useful to identify the range of factors that
influences the decision making process. However, it fails to explore the
relationships between the different influences themselves and does not
specifically address the role of consumer experience in the process.

10
Schiffman, Bednall, Watson and Kanuk (1997) proposed a more sophisticated
model of consumer decision making which was divided into three discrete, but
interrelated sections. Although this approach facilitates the reader’s ability to
understand the components of the model, it implied that the process was more
sequential than reality would suggest. The double headed arrows between the
different sections suggested a two-way flow between sections but even the titles
of the groups themselves, namely, input, process, and output, reinforced the idea
of a process flow. Ignored in this model were any influence of the buying
situation itself, which can be quite substantial, and any reference to the
relationship between memory and experience in interpreting the firm’s marketing
efforts.
A more widely cited model of the consumer decision process was developed by
Engel, Blackwell and Miniard (1995) and the diagrammatic representation of this
model is presented in Figure 1.3. This model is more complex than the one
provided by Schiffman, Bednall, Watson and Kanuk (1997) in that it broke down
into component parts, the decision process and provided more details regarding
the interrelationships between the various influences on the process. It included
the buying situation, which is potentially an important influence, and it made
quite extensive reference to the prominence of memory in the process. Although
the buying situation was specifically listed under environmental influences, it
should be considered important enough to warrant a distinct category. It was also
unfortunate that this model did not identify a direct relationship between
consumer experience, product, and memory. Such experience is an important
element of memory. Another shortfall with the Engel, Blackwell and Miniard
model was that it did not identify consumer interest and intention as stages in the
purchase decision process. This is somewhat surprising given the importance that
is accorded to intention in particular, in the Theory of Planned Behaviour and the
Theory of Reasoned Action, both of which are discussed at length by Engel,
Blackwell and Miniard (1995).
Figure 1.3 Engel, Blackwell and Miniard Consumer Decision-process Model.
Need Recognition

11
Source: Figure 4.7 in Engel, Blackwell and Miniard (1995).
In developing a consumer decision process model that could be used to underpin
this study, the models proposed by Schiffman, Bednall, Watson and Kanuk (1997)
and Engel, Blackwell and Miniard (1995) were used extensively. The distinction
between special events and other types of tourist attractions was an important
component of this model as were the roles of interest and intention as precursors
to actual behaviour. The proposed model distinguishes between generic behaviour
and behaviour that is related to specific attractions and seeks to place more
emphasis on the relationship between product experience and memory than
occurred in the aforementioned models. The environmental and individual
influences that are included in the proposed model are similar to those that have
been included in other models. However, in the proposed model, these influences
are shown to impact upon a variety of stages of the consumer decision process,
not just at the search and purchase stages as occurs in many of the other models.
The influence of marketing efforts has also been broken down into generic and
specific influences in the proposed model and the impact that environmental
influences may have on individual influences is identified. A diagrammatic
representation of the model proposed in this study is presented in Figure 1.4.
Exposure
Attention
Comprehension
Acceptance
Retention
Stimuli -Marketer Dominated -Other
External Search
Memory
Internal Search
Search
Pre-Purchase Alternative Evaluation
Environmental Influences -Culture -Social Class -Personal Influences -Family -Situation
Individual Differences -Consumer Resources -Motivation and involvement -Knowledge -Attitudes -Personality, Values and Lifestyle
Purchase
Consumption
Post-Purchase Alternative Evaluation
Dissatisfaction Satisfaction
Divestment

12
Although the proposed model does not differ in any substantial way from many of
the other consumer decision models, it is anchored in the visitor attraction field
and more specifically related to special events. Representing this model in the
form presented in Figure 1.4 prompts one to consider some important factors that
influence actual visitation, namely, interest versus intention, at the site specific
and global levels.
In order to simplify the presentation of this model, all non-attraction options were
screened out in the third stage of the model. That is, the choice options of doing
nothing, working, or choosing non-attraction related behaviour were grouped
together and classed as ‘other’ in the third stage of the model and consumers
choosing such options exit this particular model.
In developing a model, it is important that the relationships upon which the model is
based can be tested empirically. As part of this thesis, therefore, endeavours have
been made to establish instruments that can be used to test some of the key
relationships between variables. In particular, the importance of individual consumer
differences in relation to personal values, lifestyles and demographics, were assessed
in terms of their importance in explaining behaviour at the generic and attraction
specific levels for a range of named attractions, with behaviour being measured in
terms of actual visitation, visit interest and visit intention.
1.7 Structure of the Thesis The model that was proposed in the previous section and presented in Figure 1.4,
was used as the basis upon which this thesis has been structured. The various
chapters in this thesis relate to different components of the proposed model.
The thesis is divided into two parts, the first containing two chapters and the
second containing five chapters. Part One is entitled A Conceptualisation of
Special Events, and Part Two is entitled The Ability of Individual Differences to
Explain Special Event Behaviour.


14
Part One of the thesis relates to the section of the model listed as ‘Special Event
Cognition’. The background to the field of special events is described in Chapter
Two which helps to set the context for the thesis as a whole. This chapter looks at
the history of special events, discusses the reasons for their rise in importance, and
examines some of their impacts. The chapter then reports on a comprehensive and
systematic search of the literature that was conducted in an effort to operationalise
the term ‘special event’. A definitional typology, based upon this search, is then
proposed.
The categorisation framework for special events that was proposed in Chapter
Two was used as the basis for some primary research that was conducted to
explore the consumer perspective of special events and is reported in Chapter
Three. This research identified the key attributes of special events and proposed a
classification of attributes into core and qualifying for the categories of special
events identified in the previous chapter.
The primary research that was conducted for this study comprised two stages that
each involved administering a questionnaire. Even though these two
questionnaires were administered to the same group of people, they were quite
distinct components and are discussed in separate parts of the thesis. This has
meant that it has been necessary to discuss the methodology in two separate
sections. Some of the methodology has been discussed in Chapter Three in order
to provide background to the consumer study relating to the meaning of special
events, and the remainder of the methodology has been discussed in Chapter Six
in the second part of the thesis.
Part Two of the thesis examines the importance of consumer differences in
understanding and predicting behaviour in relation to attractions in general, and
special events in particular. Behaviour is considered at both the generic and
attraction specific levels, and includes visit interest and visit intention as well as
the more traditional measure of actual visitation. In the model presented in Figure

15
1.4, this part of the thesis relates to the section between ‘Attraction Type’ and
‘Specific Visitation’.
The context for the research associated with understanding consumer behaviour in
relation to special events is presented in Chapter Four. After outlining the
importance of segmentation and understanding consumer behaviour in relation to
special events, this chapter discusses the techniques that can be used to segment
the market and provides a critique of some of the other studies that have been
conducted in this area. Research hypotheses that flow from the literature review,
or are prompted by it, are presented in Chapter Five.
Chapter Six provides the remainder of the information relating to research
methodology and outlines the development and pilot testing of the questionnaire
used in the second part of the primary research.
The results are analysed and discussed in Chapter Seven and the final section
provides a summary of the results of the hypothesis tests.
Chapter Eight reviews the overall results and discusses the implications of the
findings. A final section then provides some suggestions for further research.

16
PART I
A Conceptualisation of Special Events In this thesis, it was always intended that a market perspective would be adopted
for the study of special events, but it was initially envisaged that this would entail
moving directly into the study of consumer behaviour in relation to special events.
Upon embarking on the research, it was soon discovered that there was a gap in
the literature in relation to the conceptualisation of special events. Since it was
considered that this gap had hindered the development of the field, it was decided
that some attempt should be made to address this gap prior to moving on to
considering behaviour in relation to special events. Not only does Part One of the
thesis report on the work that was done to conceptualise special events, it also
provides background information on special events necessary for the research
conducted in Part Two. In the Consumer Decision Process Model that was
presented in the previous chapter, this part of the thesis relates to the early section
listed as ‘Special Event Cognition’.
This conceptualisation was done in two distinct parts. The first component, which
is discussed in Chapter Two, involved a systematic review of the literature to
identify the attributes that researchers had proposed as being important in
describing special events. This literature review led to the presentation of a list of
core and qualifying attributes that could be used to describe the various types of
special events and the analysis culminated in a range of definitions for the
different categories of special events.
Chapter Three then moves to the next stage of actually seeking direct information
from consumers as to the attributes that they consider important in describing a
special event. This research employed a questionnaire that used a number of
separate techniques to measure these attributes which also permitted convergent
validation of the various approaches. A comparison was then made of the findings
derived from the analyses conducted in Chapters Two and Three.
17
CHAPTER 2
BACKGROUND, DEFINITION AND A TYPOLOGY OF SPECIAL EVENTS
2.1 Introduction This chapter commences with an examination of the history and growth of special
events. A review is then conducted of the reasons proposed for special events
becoming fundamental components of tourism development strategies in recent
times.
Although special events have become an important element of the tourism product in
many regions, there is still no widely accepted definitional framework for the term
‘special event’. This chapter seeks to address this problem by proposing a conceptual
and definitional framework based upon an extensive review of the published
literature on special events. The literature review identified the key attributes that
researchers have used to describe special events. These attributes are then prioritised
into core and qualifying, so that a definitional framework can be presented based on
the hierarchy of attributes identified by researchers. A schema is presented to
illustrate the relationship between the various categories of special events.
2.2 History and Growth of Special Events Special event tourism has gained in prominence and shown substantial growth in
recent years (Light 1996). A tangible means of demonstrating the substantial growth
in special events is to note the increase in size of the annual special event calenders
that are produced by many tourism organisations. Although observation and
anecdotal evidence would suggest that the number of special events has increased
substantially in recent years, little empirical work has been found to substantiate
these suggestions (Getz 1991a; Getz and Wicks 1994; Janiskee 1994). In the United
States of America, research conducted by Janiskee indicates that "recurring
community festivals increased in number at an average annual rate of approximately
4.6% between 1930 and 1991" (Janiskee 1994, p. 13). Getz and Frisby (1988) found
in a study of festivals in Ontario, that the majority of festivals had been in existence

18
less than two decades, thus indicating the importance of recent history in the growth
of festivals. The extensive media coverage that special events such as the Olympic
Games receive, would likely have contributed to the increased interest in staging
special events as a means of raising the profile of the host region.
Tourists attending special events are often termed big spenders (Getz 1997), or high
yield tourists (Prosser 1993). According to Getz (1994a), event tourists have a higher
than average daily expenditure, although the expenditure profile varies with the type
of event. The events which are the most attractive in an economic sense are “those
which attract older and more affluent visitors, such as the World Masters Games”
(Mules and Faulkner 1996, p. 112). Event tourists have the potential to be classed as
high ‘quality tourists’ (Getz 1994c) as they not only increase the yield of the
industry, but they are concerned also about the social and environmental impacts of
their travels. Not only can special events minimise environmental and social impacts,
they can contribute to sustainable development (Uysal and Gitelson 1994). Hughes
(1993a), however, suggests that it is still not clear that special event tourists are in
fact more beneficial than other categories of tourists. One should be careful,
therefore, in ascribing too much importance to the aforementioned assertions of Getz,
Prosser, and Uysal and Gitelson as not all special events or special event patrons can
be categorised as beneficial.
Accompanying this increase in the number of special events being held, has been an
increase in the number of special event producing agencies (Getz 1997), as well as
the establishment of a number of specialist companies whose function is to organise
or support the operation of special events. Recognising the growing consumer
interest in special events of all types, many communities, sporting bodies and special
interest groups, have organised special events as a means of bringing people together
in a social setting, as well as raising awareness and funds. Roche (1994) suggests that
regions are influenced to host special events by the fact that other regions have
already done so. This may be seen as an example of the demonstration effect.
The field of special events has become recognised as a specific sector of the tourism
industry and organisations have formed to promote the needs and interests of sector

19
participants and to help professionalise the sector. Two examples of such sector
bodies are the International Festival and Events Association (IFEA) and the
International Special Event Society (ISES). IFEA, formerly the International Festival
Association (IFA), was founded in 1956 and by 1996 had approximately 2200
members (Getz 1997). ISES was founded in 1987.
Although the publicity given to special events has increased recently, special events
are not a new phenomenon; the first Olympic Games were held in 776 BC and
countless religious events and festivals have been held throughout the ages. In the
past, special events were held to celebrate an occurrence whereas now they are often
held to achieve other specific goals (Youell 1995). What is new, however, is the fact
that there are now cities which seek to specialise in the creation and hosting of a wide
range of special events because of the economic importance of these events (Lynch
and Veal 1996).
No history of the use of the term ‘special event’ has been found, but it is suggested
by Hawkins and Goldblatt (1995) that the term was first used by the Disneyland
organisation to “identify happenings in the park different from the norm” (p. 42). The
term ‘event tourism’, which formalised the link between events and tourism, was
coined in the 1980s (Getz 1997). “Event tourism has been defined as the systematic
planning, development and marketing of festivals and special events as tourist
attractions, catalysts, and image builders” (Getz and Wicks 1993a, p. 2). Although
this definition identifies planning, development and marketing as separate functions,
it should be recognised that planning and development are really components of
marketing.
In Australia, the increasing interest in special events arguably derives from
Australia's winning of the America's Cup in 1983. Although Australia had been
associated with major events prior to this time (such as with the 1956 Olympic
Games in Melbourne and the 1982 Commonwealth Games in Brisbane), the winning
of the America's Cup and the subsequent build-up to the defence of the cup in
Fremantle in 1986, really focused attention on the field of special events.
20
"All available indicators strongly suggest that the number, diversity, and popularity
of festivals and special events have grown spectacularly over the past several
decades" (Getz 1991a, p. 67), and the important role that special events play in
establishing destination appeal is now well recognised (Getz 1989).
The success of special events in capturing market appeal has been attributed to the
fact that they match important changes in the demand for leisure activities, namely,
they are “short-term, easily accessible, with a flexible time commitment, and offer
options for all ages” (Robinson and Noel 1991, p. 79). Some of the reasons for the
dramatic increase in the popularity of special events could stem back to some
demographic and psychographic changes that have occurred in certain sectors of the
community, such as:
-Increasing levels of average disposable income,
-A move to more frequent short term holiday breaks,
-Increasing interest in experiential travel,
-Increasing interest in authenticity,
-Increasing interest in culture.
2.3 Importance of Special Events In general, attractions are needed to entice visitors to an area, making attractions a
fundamental element of tourism (Cooper et al 1993; Dickman 1994; Gunn 1994;
Inskeep 1991; Lew 1987; McIntosh and Goeldner 1990; Mill and Morrison 1992;
Page 1995). Some regions have been fortunate that they have been well endowed
with natural attractions, such as climate (Queensland), scenery (the Great Ocean
Road, Sydney Harbour and Ayers Rock) or flora and fauna (the Barrier Reef and
Phillip Island). Whilst these so called ‘natural attractions’ are site specific, built
attractions can be developed in most areas. Regions that have been less fortunate
with respect to natural attractions have had to entice visitors with built attractions
such as theme parks (Ballarat), historic sites (Port Arthur) or convention facilities
(Melbourne).
Another type of attraction that has been used to supplement natural and existing man-
made attractions, is the special event (Burns, Hatch and Mules 1986). A major

21
benefit of special event tourism is that for many special events, little additional
infrastructure is required and they can be held in most regions. In principle, they can
be scheduled at times and in places to reduce the impacts of seasonality or to reduce
crowding and damage in more sensitive areas (Getz 1991a). “This is the age of
special events” (Janiskee 1996b, p. 100), with special events satisfying consumers
needs for “structured leisure experiences that are high in entertainment value” (p.
100). Robinson and Noel (1991), however, make the point that special events are in
fact an alternative to the highly structured leisure programs of the past.
“Although the majority of events have probably arisen for non-tourist reasons …
there is clearly a trend to exploit them for tourism and to create new events
deliberately as tourist attractions” (Getz 1989, p. 125). Special events can be an
important motivator for travel behaviour, both day trip and overnight. Pleasure travel
as a result of attendance at special events accounts for about three per cent of the total
pleasure travel in the US but it is one of the fastest growing segments of the tourism
industry (Backman et al. 1995). In a study conducted by Wicks and Fesenmaier
(1995) that involved a survey of 2100 randomly selected households, it was found
that 57 per cent of all pleasure trips in the previous year had included a special event.
Of these, 55 per cent indicated that attendance at a special event resulted in an
overnight stay, which demonstrated the importance that the field of special events
was to the tourism industry.
An emerging trend in the tourism and leisure fields is that a growing number of
people are tending to seek more participative experiences, and hence the increasing
use of the term ‘experiential tourism’. These people are no longer satisfied with
simply looking at a tourist attraction and wish to be in some way involved with the
experience. Consumer satisfaction with a tourist attraction is enhanced with visitor
participation (Pearce 1991). Special events, particularly festivals, are important from
this perspective as they often provide the attendee with the opportunity for a
participative experience. Participation can take many varied forms including the
tasting of local produce and the involvement in games and activities aligned to the
theme of the event. There are some notable exceptions to this generalisation, such as
22
the Olympic Games, which is highly successful in terms of patronage, but does not
really offer a great deal in the way of a participative experience.
It could be said, however, that it has only been in the 1990s that the field of special
events has become regarded as a serious area of study. There is a number of key
indicators to support the claim that special events have evolved into a field worthy of
academic interest:
• Books: A number of books on special events, both academic and general,
has been written since 1990 (see, for example, Goldblatt 1990, Getz 1991a
and 1997, and Hall 1992). Many books have also been written during this
period that include chapters dedicated to special events (see, for example,
Theobold 1994, Ryan 1997, and Murphy 1997);
• Journals: An academic quarterly journal entitled Festival Management
and Event Tourism commenced in 1993. Articles submitted to this journal
are subjected to a double blind refereeing process. Many other leading
journals, especially in the tourism and leisure fields, have published
academic papers on special events (see, for example, Annals of Tourism
Research, the Journal of Travel Research, and the Journal of Applied
Recreation Research);
• Conferences: Many of the national and international tourism and leisure
conferences now have sessions dedicated to the presentation of academic
research in the field of special events and there are international
conferences dedicated to special events;
• Postgraduate study: More universities around the world are offering
postgraduate programs in special event management (see, for example,
Victoria University in Melbourne, Australia, and George Washington
University, USA).
Special events are the new ‘Image Builders’ and “are starting to dominate natural or
physical features in the identification of cities” (Burns, Hatch and Mules 1986, p. 5).
They can have very large impacts on a host region and the types of impacts are
varied, which means that a given special event can be staged for a large number of

23
reasons. The reasons for staging special events are found throughout the literature
and can be summarised as:
• increased visitation to a region (Getz 1989 and 1991a; Hall 1992; Kang
and Perdue 1994; Light 1996; Ritchie 1984; Tourism South Australia
1990),
• positive economic impact (Burns, Hatch and Mules 1986; Faulkner 1993;
Getz 1991b; Goeldner and Long 1987; Hall 1990 and 1992; Kang and
Perdue 1994; Light 1996; McCann and Thompson 1992; Mules and
Faulkner 1996; Murphy and Carmichael 1991; Ritchie 1984; Ritchie
1996; Witt 1988),
• increased employment (Hall 1992; Ritchie 1984),
• improvement of a destination’s image or awareness (Backman, Backman,
Uysal and Mohr Sunshine 1995; Burns, Hatch and Mules 1986; Hall
1990, 1992 and 1996; Kaspar 1987; Ritchie 1984; Ritchie and Smith
1991; Roche 1994; Travis and Croize 1987; Wells 1994; Witt 1988),
• enhanced tourism development (Chacko and Schaffer 1993; Faulkner
1993; Getz 1989; Hall 1987; Pyo, Cook and Howell 1988; Ritchie and
Yangzhou 1987; Spilling 1996),
• ability to act as a catalyst for development (Evans 1995; Getz 1991a and
1997; Hall 1990 and 1992; Hodges and Hall 1996; Hughes 1993b; Kaspar
1987; Law 1993; Light 1996; Mihalik 1994; Roche 1994; Spilling 1996),
• reduction of seasonal fluctuations or extension of the tourism season (Getz
1989, 1991a and 1997; Goeldner and Long 1987; Kaspar 1987; Ritchie
and Beliveau 1974),
• animation of static attractions (Getz 1991a),
• enhanced community pride (Getz 1989; Hall 1992; Light 1996; Ritchie
1984; Roche 1994; Williams, Hainsworth and Dossa 1995).
• advancement of political objectives (Getz 1994b; Hall 1992)
Governments have become interested in special events largely because of their ability
to attract visitors, and hence visitor spending, as well as their ability to raise the
awareness of the host region for future tourism (Mules and Faulkner 1996). In
Australia, for example, the importance of special events for Australia’s tourism

24
industry was recognised in the National Tourism Strategy (Commonwealth
Department of Tourism 1992), and most state tourism strategies produced since 1992
acknowledge special events as an important tourism development option (see, for
example, Tourism Victoria 1993 and 1997). As a consequence of these strategies,
special event divisions have been established in most of Australia’s State and
Territory Tourism Organisations (Jago and Shaw 1994).
In a study that involved interviewing representatives of the special event division in
each of the state and territory tourism organisations, all representatives indicated that
their particular region had a competitive advantage in the field of special events (Jago
and Shaw 1994). This view has no doubt contributed to the proliferation of special
events in Australia, a growth that reflects trends that have occurred in the US and
Canada.
2.4 Need for a Definition Despite the outcomes of special events being well recognised, if not necessarily
precisely measured, and the fact that there has been discussion regarding the
definition of special events in general, and hallmark events in particular (Burns,
Hatch and Mules 1986; Getz 1989 and 1991a; Hall 1991 and 1992; Jago and Shaw
1994), there is still no inclusive and widely accepted definition for special events.
“Defining event is a straightforward matter; determining what makes one special is
problematic” (Getz 1991a, p. 43). Much of the literature focuses on the various
characteristics of special events (Stokes 1996) and some of the reasons that they are
staged. The literature does not, however, detail what special events are, in such a
manner that would enable one to determine the range of events that would be classed
as special, versus those that would not. Shultis, Johnston and Twynam (1994) stated
that “it is a measure of the adolescence of research on these tourist events that
terminology utilised by researchers ... has not yet become standardised” (p. 167), and
they implied that the “lack of a unified terminology” (p. 168) should be resolved with
more research.
The requirement for a widely accepted definition of a special event is not just an
academic exercise, as a definition helps ensure that subsequent studies include
25
common elements, which is fundamental for both the reliability and validity of these
studies. In order to analyse thoroughly special events, a clear definition and a
typological framework are needed as a starting point. Without these, one’s ability to
“exploit [special events] for tourism and to create new events deliberately as tourist
attractions” (Getz 1989, p. 125) will be greatly impeded. Clear definitions are
essential if there is to be any chance of comparing special event statistics collected by
different government organisations, let alone make comparisons between research
studies. In the general field of tourism, the World Tourism Organisation has
expended substantial effort attempting to rationalise definitions relating to
international tourism as it is recognised that “the standardisation of definitions is
important for research purposes and necessary for measuring tourism as an economic
activity” (French, Craig-Smith and Collier 1995, p. 4). There are many examples in
other fields of study to illustrate the long term confusion that results from unclear
definitions or hazy distinctions. Consider, for example, the confusion that has existed
over the distinctions between: products / goods / services; travel / tourism; tourism /
hospitality; and marketing / promotion / advertising. Definitions and typological
frameworks for special events are also important in the planning and other aspects of
the management of such events (Hall 1992), which include the development of
marketing programs for these events.
In the special event field, the definitional problem is exacerbated by the common use
of a number of related terms such as event, special event, hallmark event, major
event, mega-event, festival, and fair, which tends to blur further whatever
boundaries do exist between the different categories.
The practical need for this definitional exercise arose from a discussion with a
General Manager of a State Tourism Organisation, where the terms ‘event’, ‘special
event’, and ‘major event’ were used both interchangeably and also to denote
differences between event types. When asked about the interchangeable use of these
terms, the General Manager stated that the definitions were more than a little hazy
and caused confusion within his organisation. The confusion regarding definitions
had led this particular State Tourism Organisation to make more use of the term
‘event’ rather than ‘special event’, and to then use a size descriptor, such as ‘major’

26
or ‘hallmark’, to denote larger events. Therefore, from a practical perspective there is
a clear need to provide a universal definition, or at least a definitional framework, for
the term ‘special event’.
Although the need for a commonly accepted definition is clear, the likelihood that
such an outcome can be achieved is subject to some doubt, according to various
researchers. Defining the term ‘special event’ is a difficult task because of the very
diverse range of event types that could potentially be included (Hawkins and
Goldblatt 1995). The range of event types and the variety of terms used to describe
them have complicated the search for a single definition in that the relationship
between the various categories of events is unclear. Are they really different
categories or just different names for the same phenomenon? A project team
established by Tourism Canada in 1986 to define festivals and events, concluded
“that festivals and events, by their very organisation and nature, are difficult to
define” (Tourism Canada 1989, p. 2). The term special event can embrace a wide
variety of elements including “contests, concerts, exhibitions, dancing, theatre,
sports, children’s events, parades, beauty contests, flea markets, raffles or lotteries,
races, and tours” (Sonmez, Backman and Allen 1993, p. 111-112). Getz (1991a)
argued that “a universal definition is probably not practical” (p. 125) and suggested
that the definition of special events varies with the perspective of the individual.
According to Getz, the problem of defining special events was so difficult that he
provided a glossary for reference purposes. In the years since 1991, Getz obviously
hardened his view regarding a special event definition as he made the comment in his
second book that “it will never be possible to come up with a universal, standardised
definition, nor a classification of which types of events are exceptional or special”
(Getz 1997, p. 4). An additional complication was proposed by Hall (1992), who
suggested that events are not frozen in time and that both the meaning and
significance of events could change with changes in society.
2.5 Leisure Versus Tourism An issue that needs to be resolved at the outset of this analysis is whether special
events should be regarded as part of the leisure field in general, or restricted to the
tourism sector. Roche (1994) described special events as “multi-dimensional and

27
multi-purpose phenomena with diverse impacts, [but] it is nonetheless conventional
to see them particularly in relation to tourism” (p. 3). This view was supported by a
perusal of academic journals in various disciplines which indicated that the majority
of research and publication on special events that has occurred in recent years, has
come from researchers associated with the tourism industry. Much of the attention
that has been accorded special events has also been tourism based, as regions come to
recognise the power of special events to attract visitors from outside the region. This
no doubt explains the fact that the special event divisions that have been established
by many cities generally fall within the tourism departments. It is suggested that the
focus on the tourism aspects of special events is a result of the economic injection
that tourists attending a special event have and the chance to profile the community
to people outside the region.
One should be careful with this focus as it ignores the importance of the local
community’s role in special events, as special events usually depend heavily on the
patronage of the local market for their success (Getz 1997). Indeed, Crompton and
McKay (1997) suggested that for most special events, patrons are “overwhelmingly
local” (p. 437). The percentage of special event patrons that could be classed as
visitors to the area varies greatly from event to event. Tourism Canada conducted a
survey of patrons at 21 major festivals and found that between five per cent and 15
per cent were foreign to the area (Getz 1991a). For some smaller community events,
patronage from people residing outside the region would be close to zero. One must,
therefore, be careful not to overlook the importance of local residents given that they
generally make up the majority of patrons at special events (Crompton and McKay
1997). Some Australian examples to demonstrate the importance of local patronage,
even for large scale special events are: 65 per cent local residents at the 1993
Melbourne Van Gogh Exhibition (The Centre for Hospitality and Tourism Research
1994), 56 per cent locals at the 1991 Tooheys Australian Motorcycle Grand Prix at
Eastern Creek (Dignam 1991), 83 per cent locals at the 1990 Ford Australian Open
Tennis (NIEIR 1990), and 70 per cent locals at the 1992 Formula One Grand Prix
(Price Waterhouse 1993).
28
Getz and Cheyne (1997) suggested that patronage at special events was
predominantly a leisure experience. Therefore, a special event should be regarded
primarily as providing a leisure activity that has the potential to attract tourists. In
other words, it should be regarded as something that is usually done as part of one’s
normal leisure time which can also be done as part of a tourism experience. Tourism
in general can be considered as a subset of the more general leisure market (Smith
and Godbey 1991; Leiper 1995), although the business tourism segment does not fit
readily into a definition of leisure.
According to Gunn (1994), there is a growing sense of cooperation between the
recreation and tourism fields despite the fact that they have substantially different
origins. Special events provide an excellent bridge between these two sectors as they
provide attractions for residents and tourists alike (Getz and Frisby 1990). In
discussing the meaning of the term ‘leisure’, Lynch and Veal (1996) referred to the
Olympic Games as being an important leisure activity from the classical Greek era.
They also suggested that the ‘carnival’ was an important leisure activity in Medieval
Europe involving a range of street theatre and other events. Both of these examples
demonstrate the strong leisure based origins of special events.
Deciding whether to classify special events as a tourism or a leisure experience
depends largely on the definition of tourism that is adopted. More traditional
definitions of tourism, such as that proposed by the World Tourism Organisation,
state that “tourism comprises the activities of persons travelling to and staying in
places outside their usual environment for not more than one consecutive year for
leisure, business and other purposes. The term usual environment is intended to
exclude trips within the area of usual residence…” (McIntosh, Goeldner and Ritchie
1995, p. 11). On this basis, therefore, special event attendance would be classed
largely as a leisure experience since the vast majority of patrons for most special
events come from the local area, as has already been discussed. However, other
definitions of tourism have taken a significantly more inclusive perspective and have
included many ‘day trip’ activities as part of tourism. For example, The Australian
Government Committee of Inquiry into Tourism conducted in 1987 included “all
overnight and certain day trips” (Hall 1995, p. 7). Although some of the day trips

29
included in this definition required a return trip travel distance of at least 50
kilometres, trips to most attractions were exempt from the distance requirement.
Adoption of this definition would result in special event attendance being classed as
part of tourism.
Increasingly, tourism literature and research includes day trip activities under the
definition of tourism as the economic activities associated with day trips are so
closely aligned with those of overnight trips (see, for example, Tourism Victoria
1996). Pragmatism has likely played a part in this trend as it is difficult to distinguish
between the two groups in terms of activities and impacts, with the requirement for
overnight accommodation being the only obvious difference.
Therefore, special event attendance is regarded as part of tourism in this study.
2.6 Attraction Versus Activity A second issue that requires early resolution is whether a special event should be
classed as an attraction, an activity, or a combination of both. Swarbrooke (1995)
explained the relationship between attractions and activities such that “attractions are
a resource that provides the raw material on which the activity depends” (p. 7). As an
attraction, a special event acts as a lure to bring tourists to the host region but it is
more often the activity side of a special event that acts as a drawcard for local
patrons. Whilst recognising the importance of the activity component of special
events, they should still be regarded as fundamentally attractions and will be treated
as such in this study.
Attractions are essential to the tourism industry as they provide the stimulation for
many people to travel. Without attractions, tourism would not exist. Swarbrooke
(1995) discussed some of the definitions that have been put forward for attractions,
highlighting the fact that there had not been any universally accepted definition of a
visitor attraction. Swarbrooke then proposed a typology of attractions comprising
four types: the natural environment, man-made structures not designed to specifically
attract visitors, man-made structures specifically designed to attract visitors, and
special events. This typology of visitor attractions is similar to that presented by Getz

30
(1991a) who proposed three types: ambient, permanent and events. The main
distinguishing feature of events in relation to the other types of attractions is the fact
that events by their very nature are temporary, which is an essential element of their
appeal (Getz 1997).
2.7 Literature Review As noted earlier, the quarterly journal entitled Festival Management & Event
Tourism; An International Journal (FMET), commenced publication in 1993.
Despite the focus of this journal being on special events, there has been no detailed
discussion regarding the definition of a special event in the articles published thus
far, although a number of the articles has discussed some of the definitional problems
(see, for example, Janiskee 1994 and Walle 1996). In the editorial in the first issue of
this journal (Getz and Wicks 1993a), ‘event management’ and ‘special event
management’ were used interchangeably, but can the terms ‘event’ and ‘special
event’ really be treated as synonyms? Does not the addition of the word ‘special’ add
a dimension to the concept of an event?
Given that FMET is a key forum for research being conducted into the special event
field, an analysis was made of the titles of the refereed articles in this journal for all
issues between Volume 1, Number 1 and Volume 3, Number 4. The purpose of this
analysis was to examine the frequency of occurrence of the various descriptors used
for special event categories in the titles of the refereed articles. The results are
presented in Table 2.1.
Table 2.1 Descriptors used in the Titles of Refereed Articles in FMET
Descriptor Frequency Festival 20 Special Event 11 Event 8 Mega-event 2 Major Event 2 Sport Event 2 Short-term Event 1

31
As the name of FMET suggests, there are two main categories of descriptors,
festivals and events. Table 2.1 shows that 42 per cent of the titles containing a ‘non-
festival event-related term’ used the term ‘special event’.
The Oxford English Dictionary (1933) defined an event as “an occurrence of some
importance” (Vol. III, p. 338), and defined special as “additional to the usual or
ordinary” (Vol. X, p. 542). Getz (1991a) observed that dictionary definitions are
somewhat confusing given that the concept of special is basically included within the
definition of event itself. Using these dictionary definitions, however, suggests that a
special event is a highly important occurrence with the emphasis being placed on
highly important. At its most basic level, one could simply define a special event as
something that is different from one’s everyday experience (Hawkins and Goldblatt
1995). Clearly, however, the event would have to be something that one is interested
in for it to be regarded as special.
A project team assembled by Tourism Canada in 1986 to define festivals and events,
comprised practitioners, bureaucrats and academics versed in the field of festivals
and events. The project team identified and listed the following primary
characteristics of a festival or special event:
“- it is open to the public
- its main purpose is the celebration or display of some theme
- it takes place once a year or less frequently
- it has pre-determined opening and closing dates
- to the extent that it uses buildings, these are not permanent structures that
are owned by the festival or special event
- it is not normally run to make a profit, although a surplus of revenue earned
over expenses is often sought in order to support a charity or to develop a
reserve fund
- all its activities take place in the same city, town or tourist region” (National
Task Force on Tourism Data 1986, p. 7).
The Project team also specifically excluded the following types of events from its
definition:

32
“- trade shows and commercial exhibitions
- all fairs with permanent buildings
- permanent attractions such as summer theatres
- regular sports events
- day to day entertainment and cultural activities” (National Task Force on Tourism
Data 1986, p. 7).
The Project Team proposed the following definition of festivals and events:
“A celebration or display of some theme to which the public is invited for a
limited time only, annually or less frequently” (p. 2).
Although Tourism Canada (1989) specifically stated that this definition “covers most
categories of festivals and events” (p. 2) including hallmark events, international
festivals, events and exhibitions, annual community festivals, celebrations of national
events, and major sports events, Getz (1991a) believed that this definition was biased
towards community based festivals at the expense of other types of special events.
Goldblatt (1990) acknowledged that there had been a variety of definitions proposed
for the term ‘special event’ due largely to the fact that there was such an array of
special event types and practitioners. Special events were described by Goldblatt
(1990) as being always planned, always arousing expectations and usually being
motivated by a celebration, which are characteristics that contrast with what
Goldblatt termed as ‘daily events’. He subsequently proposed the following
definition: “A special event recognises a unique moment in time with ceremony and
ritual to satisfy specific needs” (p. 2).
An early definition was provided by Geier (1986) who stated that:
“a special event [is] defined as any activity:
a. outside of an organisation’s normal program
b. presented for and/or with a group of people
c. that has a specific time frame” (p. 1).

33
This definition was subsequently developed by Getz (1991a) who has conducted the
most comprehensive analysis of the term ‘special event’ to date. His is the most
commonly cited definition in the tourism literature, and he concluded that the
meaning of the term special event differed depending on one’s perspective. The two
main perspectives identified by Getz were those of organisers and of customers:
"A special event is a onetime or infrequently occurring event outside the
normal program or activities of the sponsoring or organising body. To the
customer, a special event is an opportunity for a leisure, social, or cultural
experience outside the normal range of choices or beyond everyday
experience" (Getz 1991a, p. 44).
This definition provides an overview of special events but it is limited in its ability to
facilitate the operationalisation of the term, and is silent regarding the relationship
between special event and the other terms that are used; do these terms describe
different categories of special events or are they simply synonyms for the term
special event?
Getz (1991a) suggested that the term special event and its synonyms needed to be
considered contextually and that a typology of special events was required to
overcome the market confusion that existed in relation to special events. According
to a study by Tourism Canada, special events “usually refer to prestige activities such
as World Fairs or the Olympic Games” (Getz and Wicks 1993b, p. 170). A list of
factors that enhance the ‘specialness’ of an event was provided in Getz (1997), and
contained in this list were factors such as uniqueness, quality, festive spirit,
authenticity, tradition, theming and symbolism.
In the Tourism Canada (1990) plan for developing the festivals and events sector, the
terms ‘festival’ and ‘event’ were regarded as synonyms, defined as “celebrations or
displays of some theme to which the public is invited for a limited time only,
annually or less frequently” (p. 1). This report, whose focus was on international
tourism, suggested that the aforementioned definition was remiss in not including an
international dimension. The report then provided the following definition for a
festival or event:

34
“A major celebration or display of some theme, open to the public for a
limited time only, which may recur annually or less frequently and which
generates interest outside the community where it takes place. The event or
festival must be capable of attracting international travellers or have the
potential to do so” (p. 2).
Although this definition referred to ‘festival or event’, the substance of the definition
is more relevant to a ‘major festival or major event’ which, indeed, was the
terminology used in subsequent discussion in the report. Clearly not all festivals and
events will have the ability to attract international attention which appeared to be an
inconsistency in the report.
Festivals Versus Special Events
There is confusion regarding the relationship between festivals and special events.
Using the dictionary definitions referred to earlier, it is clear that festivals could be
classed as events but it is open to discussion as to whether they should be classed as
special events. “While all festivals are special events, not all special events are
festivals” (Getz and Wicks 1993a, p. 2). Hall (1992) and Law (1993) also
acknowledged that festivals were a component of special events, as did Getz (1991a),
although the title of his text is Festivals, Special Events and Tourism. If festivals are
indeed a subset of special events, it would appear superfluous to list them as a
separate entity in the title of this text. Tourism South Australia (1990) distinguished
between festivals and special events based on the role of the public at such events,
with festivals maximising the public involvement in the experience and special
events involving the public as spectators to the experience. Contrasting with this,
Tourism Canada (undated) suggested that the terms festival and special event could,
essentially, be regarded as synonyms with the key difference between them being
that festivals are held annually and special events tend to be once-off events. This
distinction between festivals and special events based on frequency of occurrence
was used by Getz and Frisby (1990) in the survey upon which their report was based.
The relationship between festivals and mega-events was explored to some extent by
Walle (1996), who suggested that mega-events often included festivals as a

35
component and, indeed, some festivals have become so popular that they have
emerged as mega-events in their own right.
Festivals
A festival can be defined as ‘a public themed celebration’ but the term was
“originally intended to refer to religious feast-day rites and celebrations” (Tourism
Canada undated, p. 3). The use of the term festival has expanded somewhat and ties
with the religious aspects have all but disappeared. However, most festivals still
embrace a celebratory aspect even if it is not related to any religious event or
occasion. Festivals have also moved from being somewhat spontaneous celebrations
that emanated from the community, to events that are more often organised by
professionals at times suitable for the tourist market (Gauthier 1987).
The term ‘festival’ is derived from the Latin term ‘festum’ which had two meanings,
namely, ‘public joy or revelry’ and ‘abstinence from work in honour of the gods’
(Falassi 1987). Festivals involve an inversion of the daily routine whereby during the
festival, “people do something they normally do not; they abstain from something
they normally do; they carry to the extreme behaviours that are usually regulated by
measure; they invert patterns of daily social life” (Falassi 1987, p. 3). It is this
inversion that gives festivals their meaning (Abrahams 1987).
Studies have shown that there are a number of important constituents of festive
events that can be classed as rites (Abrahams 1987). These rites, which include
valorisation, passage, reversal, conspicuous display, conspicuous consumption,
exchange, competition and devalorisation, can be observed in festivals of today.
Anticipation is an important ingredient in daily life for most cultures, and festivals
are a means of enhancing anticipation by introducing into the yearly calendar, a
range of events that the local population can look forward to as a break from their
regular routine. Many festivals were based in agricultural communities and were,
therefore, traditionally organised during “flat times of the year” (Abrahams 1987, p.
178) when nothing essential to the production cycle was required. Abrahams (1987)
likened a festival to a firecracker in that they were both exciting and hence attracted

36
attention, and both lasted only for a short period. This, perhaps, explains the fact that
fireworks are often an integral part of many festivals.
Abrahams (1987) also explored, to an extent, the relationship between festivals and
fairs. Fairs were traditionally devised to display the produce of a district, often in a
competitive manner. The produce is central to the fair and is preserved. At festivals
on the other hand, things, including produce, are often destroyed, further reinforcing
the earlier analogy with a firecracker. A major connection between festivals and fairs,
however, is the fact that both involve a sense of nostalgia whereby participants are
constantly reminded of how things were done or produced in the past. According to
Abrahams (1987), there has been a merging of the two terms fair and festival in
modern times with the terms having essentially become synonyms. The key
difference between the two is the focus; elements that are core to the festival are
peripheral to the fair, and vice versa.
The key distinguishing characteristic of festivals is that they are public celebrations
conducted by the community for the community. A festival is a public display of a
community’s fundamental values, and it is this authenticity that makes so many
festivals attractive to visitors outside the community (Delamere and Hinch 1994).
Although festivals are largely for the local community, the fact that many festivals
also attract outsiders to the community as observers tends to reinforce the internal
sense of community (Lavenda 1991). Besides enhancing a community’s sense of
pride, a festival can also greatly enhance a community’s sense of place.
2.8 Typology A common manner of identifying the attributes of special events has been via
categorisation schemata or typologies. A typology is a means of describing an event
in a manner that enables others to clearly understand what is being discussed. The
typology provides a framework that can be used to assist in the understanding of the
various categories of special events. In the literature, a number of key dimensions has
been identified as a basis for developing a special event typology and these
dimensions will be discussed in this section.

37
Scale
Scale is an important dimension used to categorise special events and, indeed, Mules
and Faulkner (1996) emphasise that size is the most important characteristic to
distinguish between different types of events. Special events can range in size from
community gatherings in a local park, to international events. Although size is a
continuum, in practice the size element appears to have been regarded as a simple
dichotomy, namely, hallmark or mega-events in one category, and all other events in
the other category.
The literature clearly identifies that much of the research carried out to date in the
field of special events has tended to focus on the larger special events, more
commonly called hallmark or mega-events (Ritchie 1984; Hall 1992; Burns, Hatch
and Mules 1986; Ritchie and Smith 1991; Roslow, Nicholls and Laskey 1992; Witt
1988; Soutar and McLeod 1993; Roche 1994; Walle 1996). Getz, however, has
tended to concentrate more specifically on the smaller scale community events. Bos
(1994) is the only researcher found to date who has used a more comprehensive scale
to categorise special events. According to Bos, the Netherlands Board of Tourism
used five categories to describe event types: local events, small regional events,
regional events with an above-regional importance, national events with only
domestic importance, and big events with a truly international level of attraction.
Even here the categories related more to ‘regional significance’ or ‘prominence’ than
size per se.
The seminal text by Burns, Hatch and Mules (1986) included a section entitled
“Definition of a Special Event” (p. 6). However, the definition proposed in this
section was really for a major special event or hallmark event:
“...a one-off occurrence or, by extension an infrequent occurrence, with a few
key characteristics. These include:
1. The major demand generated by the Special Event is, for the most part,
not the demand for the event itself but demand for a range of related
services - typically accommodation, food, transport and entertainment.
2. This demand is condensed into a relatively short period of time, from a
single day to a few weeks and, as services cannot be produced ahead of

38
time and stored, this leads to the typical ‘peaking’ problems experienced
in the main service industries mentioned.
3. ‘Peaking’ influences both the level and the distribution of benefits
received.
4. The net impact of redirecting local funds towards Special Events is
relatively small; the major benefits arise from the attraction of new funds
from outside the region by way of the export of goods and services,
especially services” (p. 6).
An interesting component of this definition was the aspect relating to demand for
ancillary services and it was proposed that an event could not be classed as special if
there was not such demand, irrespective of the size of the event in terms of
attendance.
Although the implication of much of the literature is that a major event is a larger
scale special event, there is still some confusion regarding the term major event.
Torkildsen (1992), for example, suggested that a major event could be a special event
but then stated that “all major events are perceived as being something special” (p.
374). As has been seen in some of the definitions cited earlier, major events seem to
have included hallmark and mega-events.
Even though the term mega-event seems almost self explanatory, it is important to try
to identify the threshold for use of this term. Ritchie and Smith (1991) supported the
concept of a threshold with their comment that major events became Hallmark events
when they “reach such a size or attain such a stature that their impacts become quite
substantial, even overwhelming” (p. 3). Rooney (1988), suggested that there was a
number of important attributes associated with mega sporting events such as:
tradition, historical significance, mystique, being complemented by other events, and
being tied to specific places. An important outcome of a mega-event was the
attraction of a large number of visitors from outside the region and, indeed, the larger
the size of the event, the greater the drawing power of the event in terms of distance.
Marris (1987) suggested that mega-events could be defined using three scales: by
volume, some money measure such as revenue or capital cost, and psychology.

39
Marris illustrated these scales using volume of at least one million visits, cost of more
than 500 million Canadian dollars, and psychology as a ‘must see’ event. According
to Travis and Croize (1987), events could be defined based on the number of
participants that they were able to attract, with French studies suggesting that big
events had between 100,000 and 200,000 participants and mega-events involved in
excess of 500,000 participants.
Hodges and Hall (1996) acknowledged that there was a number of definitions that
could be used for a mega-event. The important common characteristic of these
definitions was the “sheer size of the event” (p. 153), but as well as this
characteristic, Hodges and Hall suggested a mega-event led to the provision of new
infrastructure that was large in relation to the region’s existing infrastructure.
Spilling (1996), in recognising the inadequacy of the literature in precisely defining a
mega-event, essentially chose to combine the definitions provided of a
hallmark/mega-event by Ritchie and Yangzhou (1987), with that of a special event
by Burns, Hatch and Mules (1986). This resulted in a definition of a mega-event as
“an event that generally attracts a large number of people, for instance more than
100,000, involves significant investments and creates a large demand for a range of
associated services” (p. 131). Spilling expressed surprise that the role of the mass
media had not been included in any of the definitions discussed in the literature, and
stated that since the mass media were so fundamental to the interest surrounding
these events, “the role of the mass media should be added to the definition of mega-
event as an essential precondition” (p. 131). The media aspect was developed by
Ritchie (1996), who suggested that the important distinguishing characteristic of
events was their duration and implied that long duration was an important aspect of
mega-events as well as their large scale and ability to attract both tourists and media
attention.
In contrast to these interpretations, Getz (1991a) considered that it was the ability of a
special event to attract a substantial number of overnight visitors to the region that
determined whether it should be classified as a mega-event. Walle (1996) suggested
that it was difficult to define mega-events because they needed to be considered in
40
relation to the area in which they were held and proposed that mega-events could be
considered as large in relative terms, not simply in absolute terms.
The widely accepted definition of hallmark events was provided by Ritchie (1984),
who stated that hallmark events were “major one-time or recurring events of limited
duration, developed primarily to enhance the awareness, appeal and profitability of a
tourism destination in the short and/or long term” (p. 2). A problem with this
definition is that the term ‘major’ is too general, and therefore subject to substantial
variation in interpretation. Ritchie (1984, p. 2) referred to a hallmark event as “a
major event which has the ability to focus national and international attention on the
destination...”. His failure to include this element in his definition of a hallmark event
was an unfortunate omission as it would have given further meaning to the term
‘major’.
Ritchie (1990) stated that “it is desirable to move toward a merging of the concepts
of hallmark events and mega-events” (p. 259) which suggests that hallmark and
mega-events are different, but not substantially different. Ritchie made no comment
as to why such a merger was desirable. The definition that combined hallmark and
mega-events was provided by Ritchie and Yangzhou (1987). This definition was
almost exactly the same as the Ritchie (1984) definition of hallmark event except that
it had the following sentence added: “Such events rely for their success on
uniqueness, status, or timely significance to create interest and attract attention”
(Ritchie and Yangzhou 1987, p. 20). In contrast to this, Kang and Perdue (1994),
stated that mega-events and hallmark events occupied different positions on the scale
continuum with a mega-event being essentially a very large hallmark event. Kang
and Perdue suggested that “mega-events also included international events that are
not necessarily developed primarily for tourism purposes but can serve to promote a
destination” (p. 206). In support of a simpler definition of a mega-event, Socher and
Tschurtschenthaler (1987) required a mega-event to satisfy two criteria, namely,
“large numbers of participants or visitors and worldwide publicity” (p. 103). This
latter point reinforced the Spilling (1996) argument regarding the importance of the
media in relation to special events.

41
The terms ‘hallmark event’ and ‘special event’ were regarded as synonyms by
Shultis, Johnston and Twynam (1994), but as separate terms to both ‘mega-event’
and ‘festival’ which “have different or additional characteristics than hallmark or
special events” (p. 167). This contrasted with other literature that linked mega-events
with hallmark events and special events with festivals.
Hall (1992) basically accepted the Ritchie (1984) definition of hallmark events, but
took issue with the concept that hallmark events must by necessity be large scale
events. He suggested that hallmark referred to “the importance of the economic,
marketing, socio-cultural, and spatial context within which hallmark events take
place” (Hall 1992, p. 4). This contrasted with Hall’s earlier views, according to
Mules and Faulkner (1996), who suggested that Hall excluded from the definition of
hallmark events, large regional and national events because they were not unique.
Getz (1991a) tended to support Hall’s proposition that ‘hallmark’ was a relative term
and suggested using the term ‘hallmark event’ when a destination was largely known
for the event. Mount and Leroux (1994) concurred with Getz that a hallmark event
tended to be one for which a destination became largely known whereas mega-event
referred more to large scale ‘one-off’ events such as an Olympic Games. Janiskee
(1994) also suggested that a community festival could be considered a hallmark
event if it was very large for that particular community, thereby reinforcing Hall’s
argument. Hall’s use of the relative size of the event would seem appropriate
provided that the event was seen as large by those outside the community.
Within the category of hallmark events, Ritchie (1984, p. 2) presented the following
classification:
1. World fairs/expositions
2. Unique carnivals and festivals
3. Major sports events
4. Significant cultural and religious events
5. Historical milestones
6. Classical commercial and agricultural events
7. Major political personage events.

42
Ritchie provided a number of examples of events that he would include in each of the
seven classifications listed. Most of the classifications were self explanatory and
seemed to fit comfortably with Ritchie's definition of hallmark events, however, the
second and sixth in the list would need some additional interpretation as these two
classifications, without examples, do not necessarily denote a scale effect.
Hall (1992, p. 22) provided a classification of hallmark tourist events that was similar
to the Ritchie classification:
1. Religious and sacred events
2. Cultural events
- Carnivals and festivals
- Historical milestones
3. Commercial events
4. Sports events
5. Political events.
Hall also provided examples to illustrate each of his classifications but once again the
classifications without the examples do not necessarily conjure up a picture of a
hallmark or mega-event. For example, there can be festivals that have substantial
visitor drawing power and there are others that are put on purely for local
consumption and would not, therefore, be classified as a hallmark event under this
system.
Nicholls, Laskey and Roslow (1992) took a somewhat different view on the
definition of a Hallmark event, defining it as “a special event, of limited duration, of
significant scale, attended by large crowds whose attention is focused on a distinct
theme” (p. 215). The use of the term ‘limited duration’ is confusing in that this is
generally accepted as a fundamental attribute of special events. Nicholls et al (1992)
suggested that their definition was somewhat different to the more commonly
accepted Ritchie (1984) definition as it included locals as well as visitors to the
region. Despite this comment, however, it is not clear that Ritchie (1984) excluded
locals from his definition of Hallmark Event.

43
McCann and Thompson (1992) used Hallmark Event and Special Event
interchangeably, and in fact alternated use of the terms in the introduction to their
article. Schofield (1995, p. 7) observed that “scale was the hallmark of the nineteenth
century festival”, indicating that size was the key ingredient behind the term
hallmark. Dryden (1987) emphasised the one-off nature of Hallmark events as their
distinguishing characteristic stating that they could be either large scale such as the
Olympic Games, or community based festivals. Zwolak (1987) used the Ritchie
(1984) definition of Hallmark events but suggested that a large marketing budget and
a large capital input were two other distinguishing features. According to Zwolak,
Hallmark events could be one-off or recurring.
In contrast to the views already expressed, Sparrow (1989) suggested that it was
impossible to provide a considered definition of a Hallmark Event because there
were so many attributes of, and differences between, the various events. There is no
doubt that the term includes a wide variety of attributes but to suggest that this
precludes the development of a general definition seems to be avoiding the issue.
Sparrow (1989) did in fact present a model of Hallmark Events as an alternative to a
definition.
In summary, a hallmark event would seem to be one with which an area becomes
associated, which suggests an event that is staged on a regular basis. Therefore, it
would seem that the difference between a hallmark event and a mega-event is that the
hallmark event occurs on an infrequent but regular basis whilst the mega-event is
once-off. An Olympic Games would, therefore, be considered a mega-event as even
though it occurs every four years, it is held in a different city each time. One could
argue that some cities have become known for their staging of an Olympic Games,
but the awareness created from hosting such an event declines rapidly with time
(Bratton and Getz 1992).
Drawing Power

44
In the Getz (1991a) typology, events were listed in a hierarchy in descending order of
their ability to attract visitors. The drawing power related to distance over which an
event was able to draw patrons. The hierarchy consisted of:
1. Mega-event
2. Regional event
3. Local event
4. Touring event.
In this hierarchy, regional events drew patrons largely from within the region whilst
mega-events drew patrons from outside the region, perhaps nationally or even
internationally. Touring events were somewhat of an anomaly in that they moved to
the market rather than drawing the market to them in a geographical sense.
Hall (1992) also considered a similar typology for hallmark events with respect to
their target market, classifying the market into international, national, regional and
local. Bos (1994) adopted a similar approach in the Netherlands, as already
mentioned.
Production or Program
Getz (1991a) described a typology for classifying special events that related to the
actual form of the event itself and suggested that this typology would be of most use
to event organisers and in schedules. This typology "includes a number of
dichotomies:
1. Professional versus amateur performances
2. Competitive versus non-competitive formats
3. Indoor versus outdoor settings
4. Degree of involvement by participants or spectators
5. Free versus paid admission" (Getz, 1991a, p. 51).
Theme

45
Classifying special events by theme has been carried out by a number of researchers
(see, for example, Getz 1991a; Getz and Frisby 1988; Hall 1992; Meyer 1970;
Wilson and Udall 1982). Bos, Van Der Kamp and Zom (1987) suggested, however,
that whilst special events may have themes, this was not an essential requirement.
The theme provides consumers with an idea about what they should expect to find or
experience at the event.
Given that festivals have been defined as ‘public themed celebrations’, this does not
mean that only festivals can be classified by theme. There are literally hundreds of
themes that can be used to classify special events in general, with some of the more
common ones being food and wine, art and music, culture, agriculture, ethnicity,
sport, entertainment, religion, and indigenous people.
Using theme to classify special events is beneficial as far as the market is concerned
as it helps identify what the actual event involves. However, "the names of events do
not always reflect the diversity of activity and experience provided by the event"
(Getz 1991a, p. 50). Often the theme has to be derived from the title of the event and
as Getz has pointed out, event titles can be misleading. Separate descriptors should
be used to clearly identify the theme of an event.
Generic Grouping
The following descriptors have been used to categorise special events:
1. Fair
2. Festival
3. Agricultural show
4. Sport
However, there is confusion regarding the specific definition of each category and
there may well be overlaps between groupings. “It is apparent, however, that many
terms describing festivals and events in the English language are used only
regionally, while others have multiple meanings....It can be confusing!” (Getz,
1991a, p. 50). It is important, particularly from a market perspective, that clear,

46
consistent and well publicised definitions be used for each of these groupings to
overcome much of the confusion that exists.
Miscellaneous Factors
Other factors or dimensions that have been used to classify special events are:
1. Frequency of Staging.
The Canadian Government Office of Tourism stated that "the primary
difference between the two is that festivals are usually held annually,
while special events are often one-time only observances" (Hall 1992,
p. 3).
2. Role of the Audience.
Tourism South Australia (1990) used the role of the public to
distinguish between festivals and special events, with festivals
maximising the involvement of the public in the experience and
special events involving the public largely as spectators of the
experience.
3. Duration of the Event.
This can range from one day, as for many local festivals, up to a
number of months as tends to occur for world expositions.
4. Authenticity.
The special event can be something that is a traditional event
controlled and performed by local people, or it can be something that
is created to meet a tourist market.
5. Manner in which the Right to Stage the Event was Made.
The right to stage the event could have been won via an active and
competitive bidding process or via rotation of sites (Mueller and
Fenton 1989).

47
This review of the literature has demonstrated that there is currently no obvious
conceptual framework to clearly define a special event. Although a number of
typologies has been suggested, there is still substantial overlap and confusion
between them.
2.9 Attribute Summary In order to alleviate some of this confusion and develop a typological framework
of special events, a comprehensive and systematic search of the literature was
conducted to list the key attributes that researchers have identified as being
important in defining a special event, or its associated terms. A summary of the
results of this search is presented in Table 2.2.
The coding system used in Table 2.2 enables the reader to identify the type of
special event being referred to by each of the researchers, with the code being
explained below the table. However, it is important that this coding system not be
taken too literally, as it was found that many of the researchers used different
terms as synonyms. To complicate matters further, there was no apparent
consistency amongst researchers as to which terms were regarded as synonyms.
Some examples of the synonyms that were used are listed below:
• Major Event = Special Event (Torkildsen 1992)
• Festival = Special Event (Tourism Canada 1989)
• Major Special Event = Hallmark Event (Burns, Hatch and Mules 1986)
• Hallmark Event = Mega-Event (Mihalik 1994)
• Hallmark Event = Special Event (Shultus, Johnston and Twynam 1994;
Mules and Faulkner 1996)
• Mega-Event = Large Hallmark Event (Kang and Perdue 1994).
In the many articles where synonyms were used interchangeably, it was decided
that the term which most closely related to the title of the relevant article would be
adopted in this study, or where this was not clear, the first mentioned term was
used.

48
Table 2.2 Special Event Attributes Identified in the Literature
ATTRIBUTES Get
z (1
991a
and
199
7)R
itchi
e (1
984)
; Ritc
hie
and
Yan
gzho
u (1
987)
Hal
l (19
91 a
nd 1
992)
Tour
ism
Can
ada
(198
9, 1
990
and
unda
ted)
Gol
dbla
tt (1
990)
Gei
er (1
986)
Mul
es a
nd F
aulk
ner (
1996
)
Roo
ney
(198
8)
Mar
ris (1
987)
Spi
lling
(199
6)
Ritc
hie
(199
6)B
urns
, Hat
ch a
nd M
ules
(198
6)
Zwol
ak (1
987)
Tork
ildse
n (1
992)
You
ell (
1995
)
Law
(199
3)B
os, V
an D
er K
amp
and
Zom
(198
7)S
hulti
s, J
ohns
ton
and
Twyn
am (1
994)
Mih
alik
(199
4)Li
ght (
1996
)
Dim
anch
e (1
997)
Wal
le (1
996)
Attracting tourists or tourism development S H H F S M M M M H H S E H M S MBeing of limited duration S H H F S M S H H J E S E H S MBeing one-off or infrequent S H H F M S H H E S E H M S MRaising region’s image / profile / awareness S H H S M S H H J E S H M S MAttracting media attention M H M S M M M J S M MHaving a large economic impact M H T S M M S H M MAttracting large crowds M M M M H J S M MHaving a theme F F S E S E S MInvolving prestige & status M H H M M H S HLeaving behind legacies / urban renewal M H M M M S M MIncorporating festivals or other events F H T M J S M MOffering a social experience S H H M S E H SBeing out of the ordinary S S S J S H SBeing unique H H H M H H SInvolving a large cost M M M M H H MBeing of National or internat scale or attn. H M T H E MInvolving a celebration F F S E S MBeing of large scale M M S M M MBeing planned / organised S J E E SOffering a leisure opportunity S J E E HInvolving demand for related services S M H HInvolving tradition / symbolic /history H M M SBeing open to the public F F EAttracting funds to region M H HBeing relatively large H H MBeing a non profit operation F S EProviding colour / spectacle F SInvolving public money H HBeing tied to a specific place H MOffering a quality experience S SHaving a strong reputation M MArousing expectations SHaving all activities in one region FHaving festive ambience / revelry & frivolity FOffering an authentic experience SHaving a large marketing budget HInvolvng non-ownership of buildings FHaving pre-determined dates FOffering a sense of mystique MBeing significant MInvolving hallowed ground MHaving a purpose E Key Used in Table 2.2 Special Event S Event E Festival F Major Festival T Mega-event M Hallmark Event H Major event J

49
2.10 Definitional Framework Although there is no consensus in the literature about the relationships between
the various categories of events, the following nomological structure is suggested
based on this literature review:
1. ‘Event’ covers two categories:
- Routine or common events,
- Special events.
2. ‘Special event’ is the generic term used in a tourism sense and includes
the following categories:
- Minor special events
- Festivals,
- Major special events (or major events).
3. ‘Major event’ contains two categories:
- Hallmark events,
- Mega-events.
These relationships can be represented diagrammatically in Figure 2.1. Figure 2.1 Event Framework.
ORDINARY
MINOR FESTIVAL
HALLMARK MEGA
MAJOR
SPECIAL
EVENTS
This schema is offered as a general representation of the relationship between the
various categories of events. Clearly, there will be events that do not fit exactly

50
the structure as, for example, it is possible to have a festival that could be classed
as a major event and some major events may incorporate a festival. However, this
representation is offered as a generalised structure that shows reasonable
consistency with the literature.
2.11 Core and Qualifying Attributes Clearly, there are no absolute boundaries between the different categories that
have been proposed in this framework. Just as Getz (1991a) suggested that the
definition of a special event depended upon one’s perspective, so too is it
suggested here that the demarcation between categories also tends to reflect one’s
perspective. For example, an event that is held on an annual basis may be
regarded as special in its first year because it is so different, but then be regarded
as routine in subsequent years as the ‘newness’ wears off.
Based purely on a frequency analysis of the results presented in Table 2.2, the
most important special event attributes are:
1. Attracting tourists or tourism development,
2. Being of limited duration,
3. Being a one-off or infrequent occurrence,
4. Raising the awareness, image or profile of a region,
5. Attracting media attention,
6. Having a large economic impact,
7. Being out of the ordinary or unique.
The last item on this list is a combination of two attributes that seem closely
allied. Of course, this list should be viewed as indicative only, because it is
derived from a judgment sample of publications and compiled on a simple ‘count
of mentions’ basis. However, the literature search that underpinned Table 2.2 was
both extensive and systematic. Many articles, which are not mentioned in the
table, were found that discussed definitions of special events, but the discussion in
these articles referred back to other articles that were already mentioned. It would
be preferable to try to induce, logically, generalisations about special events

51
which could then be applied, hierarchically, to new events to assess their
characterisation as ‘special’ events.
The identification of core attributes is an important step in establishing a
definitional framework, where a core attribute of a special event is defined as an
attribute that must be present if a phenomenon is to be classed as a special event.
Before deciding whether the seven attributes listed above are what could be
termed ‘core attributes’, it is worth making some other observations regarding the
categories of special events that were referred to more frequently in Table 2.2
within each of these seven attributes. The first four attributes in this list included
the full range of event categories whereas attributes five and six referred more
frequently to hallmark and mega-events. It is interesting to note that although two
attributes were combined as the seventh attribute in the above list, the categories
of special events associated with the two separate attributes were quite different;
‘out of the ordinary’ was more frequently associated with special events, whilst
‘unique’ was more frequently associated with hallmark events.
Based on the data presented in Table 2.2, there were only two attributes that were
associated more frequently with events, special events and festivals than they
were with hallmark and mega-events. These two attributes were ‘having a theme’
and ‘involving a celebration’. There was, however, quite a number of attributes
more frequently associated with hallmark and mega-events:
• Attracting large crowds,
• Involving prestige and status,
• Attracting funds to the region,
• Leaving behind legacies or urban renewal,
• Involving demand for related services,
• Being of a national or international scale,
• Incorporating festivals or other events,
• Involving tradition or symbolism,
• Involving a large cost,
• Being of a large scale.

52
The attribute ‘offering a social experience’ was associated with the full range of
event categories.
Based on this analysis, therefore, the core attributes of special events are
suggested to be:
1. Attracting tourists or tourism development,
2. Being of a limited duration,
3. Being a one-off or infrequent occurrence,
4. Raising the awareness, image or profile of a region,
5. Offering a social experience,
6. Being out of the ordinary.
Once a phenomenon has been accepted as a special event based on having
demonstrated the presence of ‘core’ attributes, it can be further categorised by
testing for the presence of ‘qualifying’ attributes. Based on the literature review
conducted, the following qualifying attributes are proposed for the different
categories:
For Festivals and Minor Special events.
1. Having a theme
2. Involving a celebration
For Major events (Hallmark and Mega).
1. Attracting media attention,
2. Attracting large crowds,
3. Involving prestige and status,
4. Attracting funds to the region,
5. Leaving behind legacies or urban renewal,
6. Involving demand for related services,
7. Being of a national or international scale,
8. Incorporating festivals or other events,
9. Involving tradition or symbolism,
10. Involving a large cost,

53
11. Being of a large scale.
The core (CORE) and qualifying (QUAL) attributes are summarised in Table 2.3.

54
Table 2.3 Special Event Core and Qualifying Attributes
ATTRIBUTE SPECIAL EVENT
FESTIVAL MAJOR EVENT
HALLMARK EVENT
MEGA- EVENT
Attracting tourists or tourism development.
CORE
Being of a limited duration. CORE Being a one-off or infrequent occurrence.
CORE
Raising a region’s awareness, image or profile.
CORE
Offering a social experience. CORE Being out of the ordinary. CORE Involving a public celebration.
QUAL
Having a theme. QUAL Attracting media attention. QUAL Attracting large crowds. QUAL Involving prestige and status. QUAL Attracting funds to the region. QUAL Leaving behind legacies or urban renewal.
QUAL
Involving demand for related services.
QUAL
Being of a national or international scale.
QUAL
Incorporating festivals or other events.
QUAL
Involving tradition or symbolism.
QUAL
Involving a large cost. QUAL Being of a large scale. QUAL Being an infrequent occurrence.
QUAL
Being tied to a specific place. QUAL Being large in a relative sense only.
QUAL
Resulting in destination & event becoming synonymous.
QUAL
Being a one-off occurrence. QUAL Being international in scale. QUAL

55
2.12 Definitions An extensive literature review has confirmed that it is unlikely that a single, all
embracing definition of special events can be developed, as such phenomena include
a vast range of types. However, a framework, or model, has been presented that
demonstrates the relationships between the various categories of events, and based
upon this framework, a series of definitions for the various categories of events can
be proposed.
The following hierarchical list of definitions follows the schema proposed in
Figure 2.1 and will be adopted throughout this thesis.
SPECIAL EVENT
A onetime or infrequently occurring event of limited duration that provides the
consumer with a leisure and social opportunity beyond everyday experience. Such
events, which attract, or have the potential to attract tourists, are often held to
raise the profile, image or awareness of a region.
MAJOR EVENT
A large scale special event that is high in status or prestige and attracts a large
crowd and wide media attention. Such events often have a tradition and
incorporate festivals and other types of events. They are expensive to stage, attract
funds to the region, lead to demand for associated services and leave behind
legacies.
HALLMARK EVENT
An infrequently occurring major event that is tied to a specific place whereby the
destination and the event become synonymous. Although such events are
generally on a national or international scale they can be events that dominate a
particular region.
MEGA-EVENT

56
A one-time major event that is generally of an international scale.
FESTIVAL
A special event which is a public themed celebration.
Although core and qualifying attributes of the various categories of events have been
identified, given the range of such attributes, it has not been possible to go to the next
stage and operationalise these definitions. Such operationalisation would require the
specification of inter-category thresholds for attributes such as visitor numbers, costs
and economic impacts, which is difficult given the range of settings and the size of
host populations. There is still the controversy that is not resolved in the literature
regarding whether a hallmark event must be large in an absolute sense or in a relative
sense. Marris (1987) and Travis and Croize (1987) are the only researchers found in
the literature who have made any attempt to quantify these thresholds. It is not
considered that such thresholds can be applied universally.
Having presented a definitional framework based upon secondary research (that is, a
review of the literature), it is now important to develop a more direct appreciation of
the attributes that consumers regard as important in their understanding of special
events. Although the literature has speculated about consumer perceptions, more
primary research is necessary to quantify the weightings which various target
markets attach to event attributes. This would help identify the types of events that
should be produced and the manner in which they should be promoted in order to be
satisfy consumers.

57
CHAPTER 3
CONSUMER PERSPECTIVE ON SPECIAL EVENT DEFINITION AND TYPOLOGY
3.1 Introduction The previous chapter proposed a framework that could be used to define the term
‘special event’ and to understand the relationship between ‘special event’ and
some of its synonyms. In seeking to operationalise the definition of the term
‘special event’, it is essential that consumers are surveyed to gain an appreciation
of the attributes that they believe are important in defining the term. Given that
the consumer perspective is the focus of this thesis, exploration of the consumer
understanding of special events is fundamental. The framework proposed in the
previous chapter was based purely on an extensive review of existing literature
and did not draw upon any direct consumer input.
This chapter contains the background to the development, purification and
application of a questionnaire designed to obtain from consumers, the attributes
that they regard as most important in defining a special event. The questionnaire
employed four measures, namely, direct event rating, elicitation, direct attribute
rating and conjoint analysis, in order to identify these important special event
attributes. The attributes that were identified in the literature reviewed in the
previous chapter were included in a preliminary questionnaire that was
administered to a small convenience sample of students. The results of this
preliminary study were used as the basis for identifying the direct attributes and
conjoint dimensions that were subsequently employed in the main questionnaire
used in this part of the study.
The data obtained using this questionnaire are then analysed and discussed,
resulting in a consumer definition of special events. The consumer perspective is
then contrasted with the findings from the literature review conducted in the
previous chapter.

58
3.2 Attribute Identification Churchill’s (1979) paradigm for developing better measures was followed in the
development of a questionnaire for assessing special event attributes. However,
since the purpose of Churchill’s model generally was to develop measures for
specific constructs, the first stage of the model was changed here as a key
objective of this study was to define or to operationalise a term rather than simply
develop a measure. In other words, it would have been begging the question to
specify the domain of the construct in the precise means proposed by Churchill.
The extensive literature review discussed in the previous chapter was the basis for
compiling a list of attributes that could be used to define or describe special
events. Two independent researchers subsequently reviewed the list to remove
items that were seen as redundant and add others considered appropriate. This
resulted in a list containing 71 attributes. The attributes were converted into
statements using seven-point Likert scales asking respondents about the extent to
which they agreed that the statements characterised a special event. A copy of this
draft questionnaire is included in Appendix A.
A convenience sample of 62 Australian students and academics completed the
draft questionnaire comprising the 71 items. Respondents were also given the
opportunity to add attributes, as necessary. Ten respondents took the opportunity
to provide additional attributes but upon examination of these additional
attributes, it was considered that they had already been included in the base
questionnaire in one form or another.
The results of the 62 questionnaires were entered into SPSS (Norusis 1994) for
analysis. Exploratory Factor Analysis (EFA) was conducted in an attempt to
extract a small number of key underlying factors. Both orthogonal and oblique
rotations were conducted and it was found that varimax rotation extracted factors
with higher overall item loadings. Since the initial EFA extracted 21 factors which
explained 82 per cent of the total variance, a further reduction of attributes was
considered desirable and achieved via a number of techniques:

59
• Items with loadings below 0.4 were deemed to be weak and were
removed from subsequent analysis (Echtner and Ritchie 1993).
• Cronbach’s alpha was computed for the items comprising each factor,
and items were removed to increase the overall alpha (Churchill 1979).
• Items that could in anyway be construed as being redundant were
eliminated (Hair, Anderson, Tatham and Black 1995).
The subsequent EFA extracted 12 factors that explained over 75 per cent of the
total variance.
The final list of 39 attributes, which is presented in Table 3.1, comprised two or
three items from each of the factors plus some items from the discard list that had
received high mean values in the pretest.
3.3 Questionnaire Design In order to develop an in-depth appreciation of the attributes that consumers
considered to be fundamental to their understanding of special events, it was
decided to use more than a single measuring technique. Four distinct measuring
techniques were incorporated into the questionnaire which would not only provide
a base for a more in-depth understanding, but would also enable the convergent
validity of the techniques to be assessed. Churchill (1979) argues that this is
crucial in determining the relative merit of differing measuring techniques.
A number of studies has been conducted to assess the validity of various
techniques used to measure the importance of product characteristics in final
consumer choice (see, for example, Lego and Shaw 1992). According to Lego and
Shaw (1992), the correlations between the results achieved by the various
techniques are low or moderate. This poses problems for researchers in
identifying the most appropriate questioning technique that should be used in a
particular study.

60
Table 3.1 Special Event Attributes Variable Name Questionnaire Statement ACTIVITY: includes a wide range of activities. CATALYST: is a catalyst for economic development. COLOUR: is a colourful experience. CONVIV: has an air of conviviality. CROWDS: involves crowds enjoying themselves. CULTDISP: involves cultural displays. DURATION: lasts more than one day each time it is held. EMOTION: provides an emotional experience. EXCITING: provides an exciting experience. EXHIBIT: involves exhibitions and displays. EXHIL: provides an exhilarating experience. FAIR: could be a fair. FAMILY: provides entertainment for all of the family. FAIRFEST: incorporates a fair or festival. FESTIVAL: could be a festival. FREQUENT: occurs one time or infrequently. GOVFUND: receives substantial government funding. HALLOWED: involves an association with hallowed ground. HOSTIMAG: contributes greatly to community image and pride. IMAGE: helps build the image of the host region. INTERNAT: attracts international attention. INTMEDIA: is of international scale with wide media coverage.INTPART: involves international participants. LARGE: is of a large scale. MEDIA: attracts wide media coverage. MEET: provides an opportunity to meet new people. MULTICUL: provides a multicultural experience. MYSTIQUE: involves a high sense of mystique. ONETIME: is not held more than once per year. PATRONS: attracts a large patronage. PRIDE: stimulates community pride. RECREAT: includes many recreational activities. RELSIZE: is relatively large for the area, even if not large
absolutely. SHORTPER: is held for a short period. SIMILINT: provides the opportunity to mix with people
having similar interests. SOCIAL: offers a great social experience. SOCIALIS: involves opportunities to socialise with one’s
friends. THEME: has an overall theme. VISITORS: attracts many visitors from outside the region. In endeavouring to gain an appreciation of the consumer understanding of the
term ‘special event’, it was considered highly desirable to use several techniques

61
that would allow consumers to provide as much information on the topic as they
were willing, as well as facilitating the opportunity to conduct convergent validity
analysis. The four measures were event rating, elicitation, attribute rating and
conjoint analysis.
Direct Event Rating
In this section of the questionnaire, respondents were asked to rate the
‘specialness’ of a series of events using seven-point Likert scales. Given that the
questionnaire was to be administered to a random sample of Melbourne residents,
as will be discussed in a later section, it was decided that the events listed on the
questionnaire should be well recognised by this market and accessible to it.
Therefore, the events selected were primarily, but not exclusively, Victorian
based. The items for inclusion in this section of the questionnaire came from four
categories:
1. Events that Tourism Victoria classifies as hallmark events,
2. Well known events from within Victoria,
3. Well known events from outside Victoria,
4. ‘Non-special events’, that is, non-event tourist attractions which were
included to test consumer response styles.
The complete listing of events is presented in Table 3.2. The order in which the
various events appeared on the final questionnaire was randomised. Elicitation
The second section of the questionnaire contained a single open-ended question
that asked respondents to describe in their own words the most important
characteristics that would lead them to regard an event as a special event. This
question was placed early in the questionnaire in order to ‘elicit’ from respondents
unprompted special event characteristics, prior to being prompted by the attributes
listed in subsequent sections (Jaccard, Brinberg and Ackerman 1986).
Table 3.2 Listing of Events used in the Questionnaire EVENTS Category 1 (Tourism Victoria’s Hallmark Events)

62
Melbourne International Comedy Festival Melbourne International Festival of the Arts Melbourne Food and Wine Festival Melbourne International Flower and Garden Show Australian Formula One Grand Prix Australian Motorcycle Grand Prix Ford Australian Open Tennis Australian Football League Grand Final Bells Beach Surf Classic Spring Racing Carnival
Category 2 (Range of Victorian Events)
Melbourne Moomba Festival Australian International Air Show Royal Agricultural Society of Victoria Show (Melbourne Show) Stawell Gift Bendigo Easter Fair Melbourne Music Festival Australian Open Golf Papal Visit to Melbourne Lygon Street Festival Port Fairy Folk Festival Boxing Day Cricket Test Match at the MCG Hanging Rock Picnic Race Meeting Rutherglen Winery Walkabout Ballarat’s Begonia Festival Uncle Toby’s Iron Man Classic Mildura International Balloon Fiesta Australian International Badminton Championships Maldon Folk Festival Myer Music Bowl Carols by Candlelight Sail Melbourne International Nissan Regatta World Police and Fire Games International Rotary Convention Red Cross Murray Marathon
Category 3 (Events from Outside Victoria)
Sydney 2000 Olympics America’s Cup Commonwealth Games Brisbane Expo (1988) Sydney’s Gay and Lesbian Mardi Gras

63
Table 3.2 Listing of Events used in the Questionnaire (continued) EVENTS Category 4 (Non-events)
Collingwood versus Carlton Australian Rules Football Match Sovereign Hill theme park Puffing Billy Phillip Island Penguin Parade
Direct Attribute Rating
This section of the questionnaire contained the 39 special event attributes
discussed earlier. Each attribute was expressed in statement form, the order of the
statements was randomised, and the respondents were asked to indicate, using
seven-point Likert scales, the extent to which they agreed that each of the
statements characterised a special event. No specific or named special event was
mentioned. Respondents were expected to rate a notional, or ‘typical’ special
event in terms of its likelihood of exhibiting each attribute. Conjoint Analysis
Recognising that a large number of attributes was identified in an earlier section of
this study as being relevant to a definition of special events, it was decided to employ
conjoint analysis in an effort to determine the relative importance of the key
attributes in defining special events from a consumer perspective.
Conjoint analysis, a technique that has become widely utilised, enables stimuli to be
evaluated in terms of their attributes. This technique recognises that the presence and
relative strength of attributes affects the way in which objects are considered and
assists in determining the relative importance of the various attributes. It is a
decompositional technique that enables the researcher to determine the value of each
attribute based upon the respondent’s overall evaluation of bundles of attributes.
Consumers are believed to choose alternatives with the highest overall utility which
is equivalent to the sum of the utilities of the component parts (Claxton 1987).
Identifying the features to be used in a conjoint analysis study is the most critical step
in the process (Claxton 1987). The features used in this conjoint analysis were

64
derived from the EFA discussed earlier, which was further reduced by prioritising the
factors based on the key attributes identified by the leading researchers in this field,
namely Getz, Hall, and Ritchie (see, for example, Getz 1997, Hall 1992, and Ritchie
1984). This resulted in nine dimensions that were named with the assistance of three
independent judges. Each dimension used in this conjoint study had two levels which
utilised both positive and negative tones. The complete list of conjoint dimensions
and levels is in Table 3.3.
Most conjoint analyses use between five and eight features (Bretton-Clark 1987) and
it is suggested that above this level, full-profile and trade-off methods of conjoint
analysis start to become unwieldy (Hair et al 1995). However, it was not possible to
reduce the number of features used in this analysis below nine without risking the
loss of important determinants. Although it is not usual to have more than eight
dimensions in a conjoint analysis, it was not considered that the inclusion of an extra
dimension would pose serious problems for the analysis, especially when one
considers that many corporate studies include up to 30 attributes (Hair et al 1995).
The full profile method, which is the most commonly employed conjoint analysis
method (Carmichael 1996), was used in this study.
Despite Hair et al (1995) having suggested that the attributes “must be distinct
and represent a single concept” (p. 568), three of the attributes chosen for this
study embraced more than a single concept. This occurred because it was found in
the factor analysis of the pilot test results that the links between these concepts
were so strong that the various pairs of concepts tended to merge. In order to
support further this position, both the single concepts as well as the combined
ones, were listed in the attribute section of the questionnaire.
The Conjoint Designer Program (Bretton-Clark 1987) was used to produce a
fractional factorial design for the nine dimensions included in this study. The
resulting design required 12 full-profile cards to test the main effects of the
variables, to which two additional profiles were added as holdout tests in order to
validate later the results of the conjoint analysis.

65
Table 3.3 Conjoint Dimensions and Levels COMMUNITY IMAGE AND PRIDE
-contributes greatly to community image and pride. -contributes little to community image and pride.
SOCIAL EXPERIENCE
-offers a great social experience. -offers little in the way of social experience.
INTERNATIONAL SCALE AND MEDIA ATTENTION
-is of an international scale with wide media coverage. -is not of an international scale nor receives wide media coverage.
SHORT DURATION
-is held for a short period. -is held for an extended period.
FAIR OR FESTIVAL
-incorporates a fair or festival. -does not incorporate a fair or festival.
GOVERNMENT FUNDING
-receives substantial government funding. -receives little government funding.
ONE TIME OR INFREQUENT
-occurs one time or infrequently. -occurs frequently.
MYSTIQUE
-involves a high sense of mystique. -involves little or no sense of mystique.
EXCITING EXPERIENCE
-provides a very exciting experience. -provides little in the way of an exciting experience.
The order in which the dimensions appeared in the full-profile cards was
randomised but thereafter stayed the same in each of the profiles. Although Hair
et al (1995) argued that adopting a consistent order throughout the conjoint study
could affect the manner in which respondents evaluate the profiles, there is also
an argument for maintaining the same order to facilitate the learning process for
respondents such that they are able to complete the task more easily.

66
Some believe that ranking is more reliable than rating profiles (Hair et al 1995),
but the ranking procedure requires more guidance for the respondent which is less
feasible in a self-complete questionnaire. Hence, there was little option in this
study but to ask respondents to rate each of the profiles on how closely the profile
represented a special event, using a scale of 1 to 10.
Rating of Conjoint Dimensions at Specific Events
In order to complete the convergent validation process, one more stage was
required. It is necessary to understand the importance of each of the dimensions
used in the generic conjoint study for each of the specific, named events that was
listed in the questionnaire. However, this would require the respondent to rate 378
items (nine dimensions for 42 events), which was considered far too onerous a
task. As a compromise, respondents were asked to rate each of the dimensions
used in the conjoint study for a selection of three known events, thereby adding
only 27 additional items to the questionnaire.
In drastically reducing the number of events that would be included in this
section, it was of great importance that the events that were chosen were
sufficiently diverse in type to cover as broad a range of events as possible. It was
also important that the events be fairly well known to the likely target respondents
so that most respondents would have an informed opinion regarding these events.
After considerable discussion with an expert panel of judges, the following three
events were selected: the Sydney 2000 Olympic Games, the Stawell Gift, and the
Melbourne Moomba Festival. It was considered that these events provided
coverage of the different sizes and types of events.
3.4 Survey Sample As has been stated earlier, this conceptualisation study was run in conjunction
with a broader study that examined consumer behaviour in relation to a range of
tourist attractions including special events. This latter study, which will be
described in detail in a subsequent chapter of this thesis, required 40 minute face-

67
to-face interviews of a random sample of Melbourne residents. For convenience,
it was decided to use the same sample for both surveys.
Since the focus of this study was Melbourne residents, it was decided to define
Melbourne using the boundaries specified in the Melbourne Statistical Division of
the 1991 Australian Bureau of Statistics Census (Australian Bureau of Statistics
1993). Using these boundaries to define the population from which a random
sample would be drawn, facilitates the potential of later generalisation of the
findings of this study to all Melbourne residents.
It was decided that a random sample of 500 Melbourne residents would be
selected to participate in this project. According to Zikmund (1991), the results
obtained from a sample of this size in relation to Melbourne’s population of just
over three million residents are between four and five per cent (plus and minus)
reliable at the 95 per cent confidence level.
The following procedure was adopted in order to randomly select 500 residents
from the study population. One hundred domestic addresses were randomly
selected from the April 1996 revision of the Telstra White Pages telephone
directory to be used as start points. The search was constrained to within the
boundaries of the Melbourne Statistical Division of the 1991 Australian Bureau of
Statistics Census. Beginning at each start point, five respondents from different
residences were interviewed. It was recognised that using the telephone directory
to obtain start points excluded those residences that did not have a telephone or
had an unlisted telephone number. However, this was not considered to be a major
problem as not being listed in the telephone directory precluded one from being
selected as a start point but not from being in the interview sample.
3.5 Pilot Testing The questionnaire was pilot tested with a group of 20 postgraduate students. A
few minor changes were made to the way some of the questions were phrased in
the questionnaire as a result of the pilot testing. Nothing more substantial was
seen as necessary. A copy of the final questionnaire is presented in Appendix B.

68
3.6 Survey Administration Since the main component of this research project required the conduct of 500
face-to-face in home interviews, it was decided that a team of trained and
experienced interviewers would be necessary. For this reason, a professional
marketing research company was contracted to administer the questionnaire.
Both questionnaires, the face-to-face questionnaire and the mailback
questionnaire, were developed and pilot tested by this researcher and then
delivered to the marketing research organisation along with comprehensive
interviewer instruction sheets. This researcher also attended the interviewer
briefing sessions to provide additional information as necessary, to facilitate the
project.
In the conduct of the project, 12 trained interviewers were used. The
questionnaires were administered between 16 November and 5 December 1996 to
respondents aged 18 and above and in order to maximise the number of suitable
candidates for the questionnaires being home, interviews were conducted during
the week between the hours of 4pm and 9pm, and on weekends between the hours
of 10am and 6pm. Of the 500 questionnaires administered, 294 were administered
over a weekend. Ten per cent of each interviewer’s work was validated with the
respondents and all completed interview records were examined by an editor.
At each start point, interviewers were to proceed from house-to-house in a
clockwise direction until five respondents who were at least 18 years of age
agreed to participate in the survey. Callbacks were arranged where there was not a
suitable person at home or where the person at home was busy. It was important
that there was a fairly even gender mix of respondents to the survey, and since the
marketing research organisation indicated that, based on its past experience, more
females answer the door than males, it was decided that whenever there was a
chance to specify gender, male was specified. In this way a fairly even gender mix
was achieved.

69
At the completion of each face-to-face interview, the interviewer left behind a
definitional questionnaire and asked the respondent to complete the questionnaire
and return it in the reply paid envelope that was attached to the questionnaire.
Respondents were advised that returning the completed questionnaire would
enable them to be entered in a draw for a $500 prize.
3.7 Survey Response Of the 500 definitional questionnaires that were distributed to the random sample
of Melbourne residents, 274 questionnaires were returned representing a response
rate of 55 per cent.
The data from the questionnaires were entered into SPSS (Norusis 1994) and the
descriptives procedure was run to facilitate the screening of the data, in particular
to identify missing values. It was found that there were 46 cases that had data for
at least one variable missing and of these, 19 cases had missing data for a single
variable only.
Since the sample size for this study was quite large, it was decided to delete
completely all cases that had any missing data so that there would not be
questions at a later stage about the inclusion of incomplete returns. Deletion of the
defective cases left 228 questionnaires that had been fully completed.
3.8 Analysis Of Results The data obtained from the questionnaire involving the consumer understanding
of special events are analysed and discussed in this chapter. Results of the face-to-
face interviews will be discussed in Chapter Seven in Part Two of the thesis.
3.8.1 Direct Rating of Events A list containing the mean values of the direct rating of events in terms of their
‘specialness’ is presented in Table 3.4. This list has high face validity in that the
events with the highest mean ratings were the larger sporting events. The
‘Olympic Games’ had the highest mean rating followed closely by the

70
‘Commonwealth Games’. These two events were rated well ahead of all other
events, with the mean dropping 14 per cent in moving from ‘Commonwealth
Games’ to the event with the next highest mean on the list. The falls in mean
values between all other events on the list were generally less than two per cent,
although sometimes they reached four per cent. It was also interesting to note that
the standard deviations of the ratings for the two Games events were substantially
less than for all other events listed, indicating that support for the ‘specialness’ of
these two events was both high and consistent. This supports the Macdonald
(1994 p. 321) view that “the most influential type of special sporting event are
those such as the Commonwealth and Olympic games.” These two events have
some characteristics that are quite different to most of the other listed events in
that they are both international, occur only every four years, are staged in different
locations each time, and attract substantial media coverage. The vast majority of
the other events listed in this study occur on an annual basis and in the same
location each year.
At first glance, it was somewhat surprising that the ‘Myer Music Bowl Carols by
Candlelight’ was rated so highly by respondents, coming in at seventh place in
terms of its mean value on a list of 42 events. However, the fact that this event is
held on Christmas Eve each year, which in itself is special, and the fact that it has
become an important tradition in Melbourne, probably goes a long way towards
explaining its specialness in the minds of the respondents.
Table 3.4 Ratings of Event Specialness Event
‘Specialness’
Rating Mean
Standard Deviation
1. Olympic Games. 6.7 0.9 2. Commonwealth Games. 6.5 1.2 3. Ford Australian Open Tennis. 5.6 1.8 4. Australian Football League Grand Final. 5.5 2.0 5. Brisbane Expo. 5.5 1.8 6. Australian Formula One Grand Prix. 5.5 2.0 7. Myer Music Bowl Carols by Candlelight. 5.3 1.7

71
Event
‘Specialness’
Rating Mean
Standard Deviation
8. Melbourne Moomba Festival. 5.3 1.6 9. America’s Cup. 5.3 1.9 10. Spring Racing Carnival. 5.2 1.8 11. Australian Motorcycle Grand Prix. 5.2 2.0 12. Melbourne International Festival of the Arts. 5.2 1.7 13. Melbourne International Comedy Festival. 5.0 1.6 14. Royal Agricultural Society of Victoria Show. 4.9 1.9 15. Australian Open Golf. 4.9 1.9 16. Australian International Air Show. 4.9 1.7 17. Melbourne Music Festival. 4.8 1.6 18. World Police and Fire Games. 4.8 1.9 19. Boxing Day Cricket Test Match at MCG. 4.7 1.9 20. Phillip Island Penguin Parade. 4.6 2.1 21. Melbourne International Flower and Garden Show. 4.6 1.7 22. Papal Visit to Melbourne. 4.5 2.2 23. Melbourne Food and Wine Festival. 4.4 1.7 24. Bells Beach Surf Classic. 4.2 1.8 25. Lygon Street Festival. 4.2 1.7 26. Stawell Gift. 4.2 1.7 27. Red Cross Murray Marathon. 4.0 1.8 28. Sovereign Hill Theme Park. 4.0 1.9 29. Uncle Toby’s Iron Man Classic. 3.9 1.8 30. Puffing Billy. 3.9 1.9 31. Sail Melbourne International Nissan Regatta. 3.7 1.7 32. Ballarat’s Begonia Festival. 3.7 1.6 33. Hanging Rock Picnic Race Meeting. 3.6 1.6 34. Port Fairy Folk Festival. 3.6 1.6 35. Bendigo Easter Fair. 3.6 1.6 36. Australian International Badminton Championship.
3.5 1.7
37. International Rotary Convention. 3.4 1.9 38. Mildura International Balloon Fiesta. 3.3 1.7 39. Maldon Folk Festival. 3.2 1.6 40. Collingwood versus Carlton Football Match. 3.2 2.2 41. Rutherglen Winery Walkabout. 3.2 1.6 42. Sydney’s Gay and Lesbian Mardi Gras. 3.0 2.2
The events which had the highest standard deviations on the ratings were: ‘Papal
Visit to Melbourne’, ‘Sydney’s Gay and Lesbian Mardi Gras’, ‘Collingwood
versus Carlton Football Match’ and ‘Phillip Island Penguin Parade’. This
indicates that there was greater variation amongst the respondents as to the
Table 3.4 Ratings of Event Specialness (continued)

72
specialness of these events, which is not surprising when one examines these
individual events more closely. The first two events are ones for which support
would likely be strongly polarised, and the last two are not usually regarded as
special events and were included in the study only to assess respondent use of the
rating scale. That is, if respondents rated non-special events highly, it might
indicate some degree of carelessness in their responding, and hence cast doubt on
the validity of the data. The higher standard deviations obtained for these two
‘non-special events’ suggests that there may have been some respondent
confusion regarding their level of specialness.
Of the four ‘non-special events’ that were included in the list of events in order to
assess the manner in which respondents used the Likert scale, three were
permanent tourist attractions and the fourth was a regular football match.
Although these non-special events did not have the lowest mean values of the
events listed, none was ranked in the highest section of the 42 item list in terms of
mean values: ‘Phillip Island Penguin Parade’ (ranked 20), ‘Sovereign Hill’
(ranked 28), ‘Puffing Billy’ (ranked 30) and ‘Collingwood versus Carlton
Football Match’ (ranked 40). One could argue that aspects of the Penguin Parade
are, indeed, not dissimilar to a special event, which would explain its higher
ranking than would have been expected. The Penguin Parade is focussed on a
natural phenomenon that occurs at dusk each evening at which time penguins
return en masse from the ocean to their nesting area. Spectators are grouped in a
grandstand to watch this occurrence and there is an air of anticipation that perhaps
provides the basis for an experience that is not dissimilar to a special event. With
respect to Sovereign Hill and Puffing Billy, it is possible that some respondents
were assessing the ‘specialness to them’ of a visit to these attractions rather than
the ‘specialness’ of the event per se. That is, these respondents could have been
rating the value of the experience rather than the event itself. The standard
deviations for each of these four items were high, indicating disparate views
across the respondents.
Exploratory Factor Analysis (EFA)

73
An EFA of the ratings of the events was conducted using a varimax rotation. This
EFA extracted 12 factors with eigenvalues greater than one, which explained
nearly 70 per cent of the total variance. These factors, which demonstrated both
high face validity and high reliability (with all Cronbach alphas above 0.7), are
presented in Table 3.5.
In the list of event mean ratings that was reported earlier, the most highly rated
events were the large sporting events headed by the ‘Olympics’ and the
‘Commonwealth Games’. In the EFA, it was interesting to note that some factors
were extracted that aligned closely with these large sporting events. There was a
factor that comprised just the ‘Olympics’ and the ‘Commonwealth Games’,
another that embraced large sports events in general, and another that included
large motor sports events. It should also be mentioned that the three ‘non-special
event’ attractions that were included in the questionnaire as a form of reliability
check, were grouped together in a single factor, confirming the acceptability of
the respondents’ usage of the rating scales.

74
Table 3.5 Factor Analysis of Event Specialness Factor Eigen- Variance Coef. Loading value Explained Reliab. Statement Items (Percentage) Regional Events 10.7 25.5 0.88 Ballarat's Begonia Festival 0.78 Maldon Folk Festival 0.74 Mildura International Balloon Fiesta 0.70 Port Fairy Folk Festival 0.64 Australian International Badminton Championships 0.59 Rutherglen Winery Walkabout 0.58 Hanging Rock Picnic Race Meeting 0.51 Sail Melbourne International Nissan Regatta 0.49 Royal Agricultural Society of Victoria Show 0.47 Festivals 3.8 9.0 0.83 Melbourne International Comedy Festival 0.74 Melbourne Music Festival 0.71 Melbourne Food and Wine Festival 0.70 Lygon Street Festival 0.60 Melbourne International Festival of the Arts 0.55 Melbourne Internat. Flower & Garden Show 0.53 Sport 2.8 6.7 0.78 Ford Australian Tennis Open 0.76 Australian Football League Grand Final 0.72 Boxing Day Cricket Test Match at the MCG 0.69 Australian Open Golf 0.66 Collingwood versus Carlton Football Match 0.56 Non-event attractions 1.9 4.5 0.81 Sovereign Hill 0.86 Phillip Island Penguin Parade 0.86 Puffing Billy 0.68 Technology 1.7 4.0 0.75 Australian Formula One Grand Prix 0.79 Australian Motorcycle Grand Prix 0.74 Australian International Air Show 0.61 Service Oriented 1.5 3.6 0.70 Red Cross Murray Marathon 0.69 World Police and Fire Games 0.61 International Rotary Convention 0.51 Mega-sport 1.3 3.1 0.72 Sydney 2000 Olympics 0.83 Commonwealth Games 0.77 City festivals 1.3 3.1 0.53 Melbourne Moomba Festival 0.74 Bendigo Easter Fair 0.54

75
Factor Eigen- Variance Coef. Loading value Explained Reliab. Statement Items (Percentage) Human Endurance 1.2 2.8 0.69 Sydney's Gay and Lesbian Mardi Gras 0.77 Bells Beach Surf Classic 0.55 Uncle Toby's Iron Man Classic 0.45 Intermittent International 1.1 2.7 0.57 Brisbane Expo (1988) 0.77 Papal Visit to Melbourne 0.50 America's Cup 0.45 Carols 1.1 2.5 N/A Myer Music Bowl Carols by Candlelight 0.64 Other Racing 1.0 2.5 0.47 Stawell Gift 0.57 Spring Racing Carnival 0.49 Total Variance Explained 69.9
3.8.2 Elicitation Verbatim responses from the elicitation section of the questionnaire were entered
into Microsoft Word and the ‘find’ function of Word was used to help count the
number of occurrences of key words. A list containing the key words and their
frequency of occurrence is presented in Table 3.6.
As indicated in Table 3.7, it was possible to recode the keywords found in the
elicitation section such that they collapsed into the categories that were used in
the conjoint analysis. Although there were 85 terms that did not readily fit into the
conjoint categories, the other 91 per cent of elicitation keywords did fit. The
majority of the keywords that did not easily fit into the conjoint categories related
to ‘interest’. Table 3.7 presents the rank order of conjoint dimensions based on the
force-fitting of keywords in the elicitation section.
Table 3.5 Factor Analysis of Event Specialness (continued)

76
Table 3.6 Keywords Identified in the Elicitation Section
Keyword
Frequency of
occurrence 1. People 104 2. Interest… 85 3. International 84 4. Community 51 5. World 50 6. Family… 37 7. Attract… 36 8. Overseas 29 9. Large 32 10. Visitors 27 11. Culture… 26 12. Signific… 26 13. Important… 25 14. Annual… 24 15. Excite… 23 16. Enjoy… 22 17. Media 23 18. National 18 19. Pride 15 20. Attention 14 21. Interstate 13 22. Festival 12 23. Television 12 24. Fund… 11 25. Unique 11 26. Sport 10 27. Variety 10 28. Historic… 10 29. Fun 10 30. Tourist(s) 10 31. Crowd(s) 10 32. Popular… 9 33. Occasion… 8 34. Period 8 35. Scale 7 36. Big 7 37. Tourism 7 38. Social 6 39. Plan… 6 40. Major 6 41. Experience 6

77
Keyword
Frequency of
occurrence 42. Skill… 6 43. Atmosphere 6 44. Government 6 45. Image 5 46. Short per… 5 47. Publicity 5 48. High Profile 4 49. Famous 4 50. Access 4 51. Out of Ord 4 52. Frequent… 4 53. Infrequent… 3 54. Colour… 3 55. Unusual 2
Table 3.7 Rank order of Conjoint Dimensions based on Force-fitting Keywords Identified in the Elicitation Section Conjoint Dimension Frequency of
occurrence Rank order
International scale and media attention 353 1 Community image and pride 318 2 Exciting experience 77 3 One time or infrequently 48 4 Social experience 43 5 Involves a fair or festival 32 6 Involves government funding 17 7 Short duration 5 8 Mystique 0 9 Unable to fit 85
Care should be taken in the interpretation of this result due to the somewhat
subjective manner in which the responses were fitted into the conjoint
dimensions.
3.8.3 Direct Attribute Rating The mean values of the direct attribute ratings are listed in descending order in
Table 3.8. Perusal of the list of attribute ratings shows that a reasonable spread of
mean values was achieved, indicating that respondents were using the scale to
Table 3.6 Keywords Identified in the Elicitation Section (continued)

78
differentiate between the relevance of attributes, although only one attribute had a
mean below the midpoint of the seven-point rating scale.
The attributes that were ranked most highly according to their mean values fell
into three main categories: the number of patrons at events, the host region’s
increase in image and pride, and the excitement associated with attending a
special event. The most highly ranked attribute, ‘many visitors’, also had the
lowest standard deviation indicating more uniform support for this attribute.
Although it may have been expected that the five functional attributes, ‘not held
more than once per year’, ‘large scale’, ‘held for a short period’, ‘occurs once or
infrequently’, and ‘lasts more than one day’, would be grouped together, this was
not the case; these five attributes were spread from rank 13 to rank 34 on the 39
item listing. In particular, there is quite a deal of similarity between ‘not more
than once per year’ and ‘occurs once or infrequently’, and yet these two items
were ranked 13 and 26 respectively.
The attribute rating section of this questionnaire was also administered to a group
of Canadian tourism students as part of another study and it was found that quite a
number of students wrote on the questionnaire that they did not understand the
meaning of the words ‘hallowed’ and ‘mystique’. Although there were no
comments made regarding the meaning of these words on the questionnaire used
in this study, it is possible that some confusion did exist but that respondents were
less prepared than students to admit their uncertainty. This may have contributed
to the fact that these two attributes were ranked in the final two positions on the
attribute list. The standard deviations for these two attributes were quite high,
further supporting the possibility of confusion regarding meanings. Some care is
needed, therefore, in the interpretation of these two attributes.
Another attribute that ranked well down the list was ‘receives substantial
government funding’, which was ranked third last on the 39 item list. Since it is
not always clear as to whether government funding is involved in various special
events, care is needed in the interpretation of the fact that this attribute was ranked

79
so far down the list. Was this because the respondents did not regard the attribute
as important in the description of a special event, or was it because they did not
appreciate that it was a factor in many events?
Table 3.8 Direct Attribute Ratings Questionnaire Statement
Rating Mean
Standard Deviation
1. Attracts many visitors to the region. 6.1 1.2 2. Attracts international attention. 5.9 1.4 3. Contributes greatly to community image and pride. 5.9 1.4 4. Involves crowds enjoying themselves. 5.9 1.4 5. Provides an exciting experience. 5.9 1.3 6. Stimulates community pride. 5.8 1.4 7. Helps build the image of the host region. 5.7 1.4 8. Attracts a large patronage. 5.7 1.4 9. Provides entertainment for all the family. 5.5 1.7 10. Is a colourful experience. 5.5 1.4 11. Is of international scale with wide media coverage. 5.5 1.7 12. Involves international participants. 5.4 1.5 13. Is not held more than once per year. 5.4 1.8 14. Provides chance to mix with people having similar interests. 5.4 1.5 15. Attracts wide media coverage. 5.4 1.6 16. Offers a great social experience. 5.4 1.6 17. Provides an exhilarating experience. 5.4 1.4 18. Is of a large scale. 5.2 1.5 19. Provides an chance to meet new people. 5.1 1.7 20. Has an overall theme. 5.1 1.5 21. Provides a multicultural experience. 5.1 1.6 22. Is held for a short period. 5.0 1.6 23. Involves exhibitions and displays. 5.0 1.4 24. Is a catalyst for economic development. 5.0 1.5 25. Includes a wide range of activities. 5.0 1.6 26. Occurs one time or infrequently. 5.0 1.9 27. Provides an emotional experience. 5.0 1.6 28. Could be a festival. 5.0 1.6 29. Has an air of conviviality. 4.9 1.4 30. Involves opportunities to socialise with one’s friends. 4.8 1.6 31. Is large in a relative sense for the area. 4.8 1.5 32. Involves cultural displays. 4.7 1.6 33. Incorporates a fair or festival. 4.6 1.5 34. Lasts more than one day when held. 4.5 1.9 35. Includes many recreational activities. 4.5 1.5 36. Could be a fair. 4.4 1.5 37. Receives substantial government funding. 4.2 1.8 38. Involves a high sense of mystique. 4.0 1.6 39. Involves an association with hallowed ground. 3.8 1.7

80
It was interesting that ‘provides an exciting experience’ was the fifth most highly
ranked attribute based on its mean value, whereas it was ranked so much lower
down the listing in the elicitation section. This is possibly due to the way in which
people use language in that reference to an exciting experience is probably not
commonly used in general conversation whereas if one is specifically asked to
rate the importance of such an attribute, people may recognise it as having a
higher level of importance.
Exploratory Factor Analysis (EFA)
An EFA was conducted on the direct attribute rating scores in the questionnaire to
determine the key underlying dimensions of special events. The EFA, which used
a varimax rotation, extracted eight factors with eigenvalues greater than one, and
these factors explained nearly 65 per cent of the total variance. A list of these
factors is presented in Table 3.9.
As with the previous EFA, the face validity of the eight factors extracted here was
high and the item loadings within each factor were quite strong. Reliabilities,
based on Cronbach’s alpha, were also generally high.
Table 3.9 Factor Analysis of Attribute Ratings Factor Eigen- Variance Coef. Loading value Explained Reliab. Statement Items (Percentage) Includes a wide range of activities. 11.7 29.7 0.90 Includes a wide range of activities. 0.84 Includes many recreational activities. 0.76 Provides entertainment for all of the family. 0.67 Provides a multicultural experience 0.68 Incorporates a fair or festival. 0.67 Involves cultural displays. 0.61 Involves exhibitions and displays. 0.60 Lasts more than one day each time it is held. 0.59 Involves opportunities to socialise with one’s friends. 0.57 Provides an opportunity to meet new people. 0.55 Could be a fair. 0.50 Factor Eigen- Variance Coef. Loading value Explained Reliab. Statement Items (Percentage)
Table 3.9 Factor Analysis of Attribute Ratings (continued)

81
Raises image and pride in region. 4.0 10.1 0.84 Contributes greatly to community image and pride. 0.70 Stimulates community pride. 0.68 Helps build the image of the host region. 0.68 Has an overall theme. 0.55 Provides the opportunity to mix with people having similar interests. 0.54 Is relatively large for the area, even if not large in absolute terms. 0.54 Attracts many visitors from outside the region. 0.52 International scale. 2.4 6.2 0.84 Attracts international attention. 0.81 Attracts wide media coverage. 0.77 Is of international scale with wide media coverage. 0.70 Involves international participants. 0.60 Attracts a large patronage. 0.57 Is a catalyst for economic development. 0.52 Involves crowds enjoying themselves. 0.46 An exciting experience. 1.9 4.8 0.81 Provides an exhilarating experience. 0.74 Is a colourful experience. 0.69 Provides an exciting experience. 0.61 Provides an emotional experience. 0.55 Offers a great social experience. 0.48 Functional attributes. 1.6 4.2 0.66 Occurs one time or infrequently. 0.78 Is held for a short period. 0.71 Is not held more than once per year. 0.57 Is of a large scale. 0.46 Festive occasion. 1.3 3.4 0.70 Could be a festival. 0.80 Has an air of conviviality. 0.68 Government funds. 1.2 3.1 N/A Receives substantial government funding. 0.51 Sacred / spiritual. 1.1 2.9 0.66 Involves a high sense of mystique. 0.55 Involves an association with hallowed ground. 0.50 Total Variance Explained 64.4 The attributes that were seen as important in terms of the ranking of attribute
mean ratings were identified separately in the EFA. That is, there were factors
based around the image and pride of the host region, the exciting experience, and
the international attention.

82
3.8.4 Rating of Attributes at Specific Events The purpose of this section was to investigate the manner in which respondents
rated particular attributes for a range of named events. It was found that the
overall rating of the possession of the attributes by the event, in terms of the mean
values, was higher for the Olympics followed by Moomba and then followed by
the Stawell Gift. This is consistent with the order of mean values found in the first
part of this questionnaire. ‘Mystique’ was the lowest rated attribute for each event
which is also consistent with the overall attribute rating section where this
particular attribute was ranked 38th in a list of 39 attributes. Again, caution
should be taken with this result because of the concern regarding possible
confusion about the meaning of mystique. The rank orders of the attributes for
each of these events is presented in Table 3.10.
Table 3.10 Comparison of the Rank Order of Attributes of the Three Events Ranking of Attribute Means Attribute Olympics Stawell Moomba International scale & media attention 1 7 8 Provides an exciting experience 2 3 5 Fosters community image & pride 3 2 2 Occurs once or infrequently 4 4 6 Involves substantial govt. funding 5 8 7 Provides a social experience 6 5 3 Is of short duration 7 1 4 Involves fairs or festivals 8 6 1 Involves a sense of mystique 9 9 9 Spearman Rank-Order Coefficients were calculated for the three attribute
rankings in Table 3.10. These results are presented in Table 3.11 where it can be
seen that there were negligible correlations between the rank ordering of the
attributes for the Olympics and both other events, whilst there was a moderate
correlation between Stawell and Moomba. The fact that there was such variability
in the correlations of attributes for the various events suggests that respondents
were able to distinguish between the same attribute at different events and use the
rating scale effectively.
Table 3.11 Spearman Rank-Order Coefficients Events Coefficient Olympics - Stawell 0.27 Olympics - Moomba 0.12

83
Stawell - Moomba 0.60
3.8.5 Conjoint Analysis Results of the conjoint analysis are presented in Table 3.12. The weights shown in
the table refer to the relative importance of the different attributes. They are
analogous to the standardised coefficients in a regression equation and apply
irrespective of the levels of the various attributes in the context of this study. It
can be seen that ‘fostering community image and pride’, ‘providing an exciting
experience’, ‘international scale and media attention’ and ‘provides a social
experience’ accounted for 65 per cent of the relative importance whilst ‘receives
substantial government funding’ and ‘of short duration’ accounted for less than 10
per cent of the relative importance. The preferences column in Table 3.12 indicates the degree of consensus amongst
respondents regarding the level of the various attributes as to which was the better
indicator of an event being special. Results in this column indicated that there was
quite high consensus about levels for the first eight attributes but less so for the
final attribute, ‘of short duration’. This seems to have face validity given that
there could easily have been confusion surrounding special events like World
Expositions which last for about six months.
An overall correlation of 0.8 was found between the actual scores on the two
holdout profiles and the predicted scores. According to Bretton-Clark (1987), a
correlation of this level is well within the acceptable range and indicates that the
results are reasonably reliable. The mean absolute difference between the actual
and the predicted scores was 1.8 on a 10 unit scale.
Table 3.12 Conjoint Analysis Preferences Weights Variables / Levels (%) (%) COMMUNITY IMAGE AND PRIDE 20.7 -contributes greatly to community image and pride. 87 -contributes little to community image and pride. 13 100
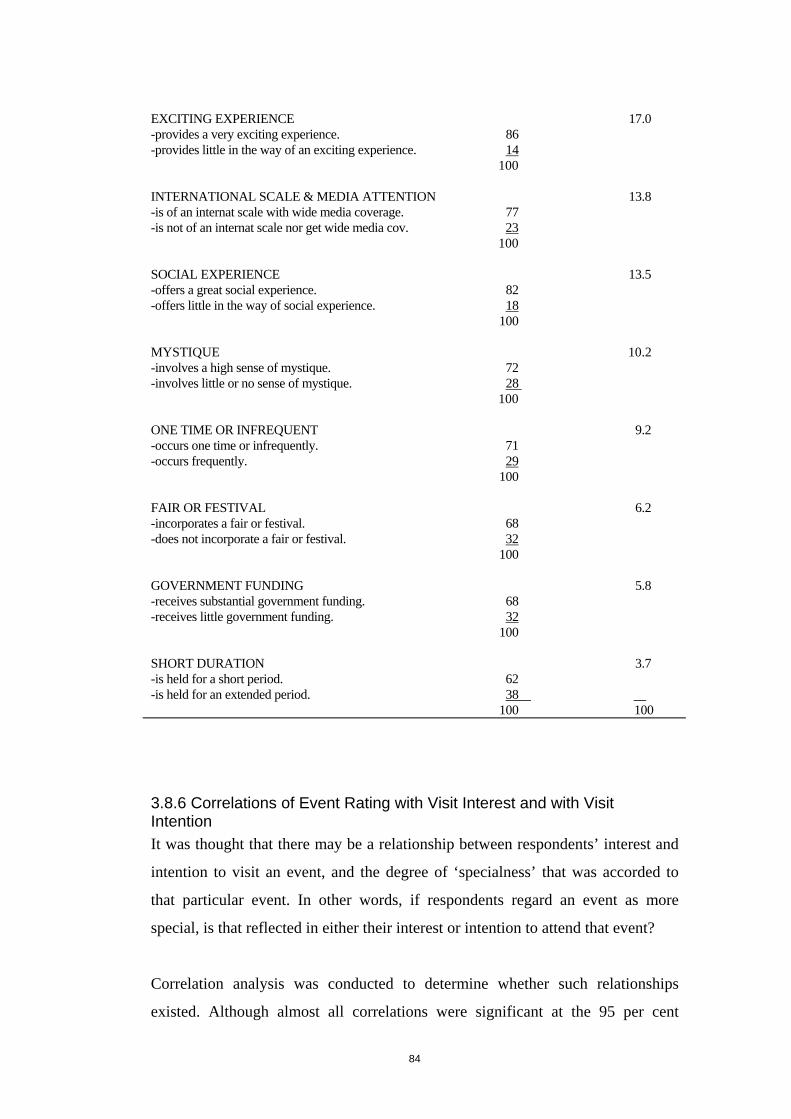
84
EXCITING EXPERIENCE 17.0 -provides a very exciting experience. 86 -provides little in the way of an exciting experience. 14 100 INTERNATIONAL SCALE & MEDIA ATTENTION 13.8 -is of an internat scale with wide media coverage. 77 -is not of an internat scale nor get wide media cov. 23 100 SOCIAL EXPERIENCE 13.5 -offers a great social experience. 82 -offers little in the way of social experience. 18 100 MYSTIQUE 10.2 -involves a high sense of mystique. 72 -involves little or no sense of mystique. 28 100 ONE TIME OR INFREQUENT 9.2 -occurs one time or infrequently. 71 -occurs frequently. 29 100 FAIR OR FESTIVAL 6.2 -incorporates a fair or festival. 68 -does not incorporate a fair or festival. 32 100 GOVERNMENT FUNDING 5.8 -receives substantial government funding. 68 -receives little government funding. 32 100 SHORT DURATION 3.7 -is held for a short period. 62 -is held for an extended period. 38 100 100
3.8.6 Correlations of Event Rating with Visit Interest and with Visit Intention It was thought that there may be a relationship between respondents’ interest and
intention to visit an event, and the degree of ‘specialness’ that was accorded to
that particular event. In other words, if respondents regard an event as more
special, is that reflected in either their interest or intention to attend that event?
Correlation analysis was conducted to determine whether such relationships
existed. Although almost all correlations were significant at the 95 per cent

85
confidence level, the actual correlations between event rating and both visit
interest and visit intention, were generally quite low. As would be expected, the
correlations for visit interest were higher than they were for visit intention. No
correlation coefficient reached 0.5 and only four were in excess of 0.4, three of
these being visit interest and one being visit intention. The three events that
exhibited the strongest correlations for both visit interest and visit intention were
‘AFL Grand Final’, ‘Food and Wine Festival’ and ‘Comedy Festival’, although
the ranking differed for visit interest versus visit intention.
3.8.7 Relationship Between Event Rating and Visit History In a similar fashion, it was also proposed that a respondent’s experience at an event
may influence the level of ‘specialness’ that is accorded to that event, with
experience being measured by whether the respondent had ever attended the event.
Since ‘visit history’ was a dichotomous variable, Pearson’s chi-square was used to
determine whether there was a relationship between visit history and the specialness
rating that a particular event was given.
Based on Pearson’s chi-square test, there was a relationship between visit history
and event rating for the following events at the 95 per cent confidence level: ‘Ford
Australian Open’, ‘Spring Racing Carnival’, ‘Art Festival’, ‘Food and Wine
Festival’, ‘Comedy Festival’ and ‘AFL Grand Final’. However, one must be
extremely careful in the use of the chi-square statistic when 20 per cent or more of
the cells contain fewer than five expected cases (SPSS Australasia, undated), and
in this situation, both ‘Ford Australian Open’ and ‘Food and Wine Festival’ had
28 per cent of cells containing an expected number of cases fewer than five. It
should be noted that the events identified here as having a relationship between
visit history and event rating also had the highest correlations between event
rating and interest to visit and intention to visit.
The lack of strong correlations found in this section of the questionnaire suggest
that respondents’ interest and intention to attend an event was not related to their
view of the specialness of that event.

86
3.9 DISCUSSION
3.9.1 Comparing the Measures Three measures have been used to identify the attributes that respondents regarded as
important in their understanding of the term special event. The next stage was to
examine the convergence of these different techniques. Table 3.13 compares the
rankings of the first nine attributes in three of the measurement techniques used in
this study. If one repeats this table but restricts the analysis to the conjoint
dimensions used in this study, results as shown in Table 3.14 are obtained. Based on the Spearman Rank Order Coefficients presented in Table 3.15, the rank
orderings of the conjoint dimensions showed strong positive correlations between
the three techniques. However, it must be remembered that the analysis has been
restricted to the nine conjoint dimensions only.

87
Table 3.13 Comparison of the Rankings Derived from the Different Measurement Techniques Attribute
Conjoint Ranking
Attribute Ranking
Elicitation Ranking
Community image and pride 1 3 4 Exciting experience 2 5 14 International scale and media attention 3 11 1 Social experience 4 16 24 Mystique 5 38 16 One time or infrequent 6 26 12 Incorporates a fair or festival 7 33 17 Receives government funding 8 37 18 Short duration 9 22 28 Many visitors - 1 2 International attention 3 2 1 Crowds enjoying themselves - 4 2 Stimulates community pride 1 6 4 Builds image of the host region 1 7 4 Attracts many patrons - 8 2 Entertainment for all family - 9 10 Interest - - 3 Significant - - 5 Attraction - - 6 Large size - 18 7 Enjoyment - - 8 Wide media coverage - 15 9
Table 3.14 Comparison of the Rankings Derived from the Different Measurement Techniques (Conjoint Dimensions) Attribute
Conjoint Ranking
Attribute Ranking
Elicitation Ranking
Community image & pride 1 1 2 Exciting experience 2 2 3 International scale & media attention 3 3 1 Social experience 4 4 5 Mystique 5 9 9 One time or infrequent 6 6 4 Fair or festival 7 7 6 Government funding 8 8 7 Short duration 9 5 8
Table 3.15 Spearman Rank-Order Coefficients of the Three Measures Events Coefficient Conjoint - Attribute 0.73 Conjoint - Elicitation 0.75 Attribute - Elicitation 0.82

88
3.9.2 Multi-Attribute Attitude Model For each of the three specific events listed in Part D of the questionnaire, a new
variable was computed that was the sum of: the attribute scores in Part D
multiplied by their importance weighting determined in the attribute rating
section. The maximum score for each event was 441 (9*7*7). In other words, this
new variable represented the sum of the presence of each attribute multiplied by
the importance associated with that attribute. Using more traditional multi-
attribute terminology, this relationship can be represented as:
i ijj
jS B I==∑
1
9
*
where iS is the ‘specialness’ of the ith event, ijB is the belief that event i exhibits the jth attribute,
jI is the importance of the jth attribute. The magnitude of S could be taken as a pseudo ‘specialness’ rating for each event. The score for each event was then correlated with the rating which that particular
event received in the event rating section of the questionnaire. The results are
shown in Table 3.16.
Table 3.16 Event Specialness Correlations Event
Pearson Correlation Coefficient
Significance
Olympics 0.42 <.05 Stawell Gift 0.34 <.05 Moomba 0.42 <.05 Moderate correlations were demonstrated for all three events. The fact that several
of the attributes used in this multi-attribute analysis were themselves ranked in
lowly positions in terms of mean ratings could have explained the occurrence of
only a moderate correlation. One could also question whether a compensatory
linear model such as the multi-attribute model applies in this situation (Lilien and
Kotler 1983).

89
3.9.3 Representativeness of the Conjoint Dimensions An issue that requires further discussion is the representativeness of the
dimensions chosen for the conjoint study. These dimensions were based upon an
extensive literature search, but how well do they relate to the attributes that were
rated more highly in the direct attribute rating section? Table 3.17 lists the ranking
that each of the conjoint dimensions achieved in the attribute rating section.
Table 3.17 Ranking of the Conjoint Dimension Ratings
Conjoint Dimension
Ranking (From a 39 item list)
Provides a very exciting experience. 5 Involves a high sense of mystique. 38 Occurs once or infrequently. 26 Receives substantial government funding. 37 Incorporates a fair or festival. 33 Is held for a short period. 22 Is of an international scale with wide media coverage. 11 Provides a great social experience. 16 Contributes greatly to community image and pride. 3 Only two of the conjoint dimensions were ranked in the top 10 attributes with
respect to mean ratings, whilst three were ranked below 30. At first glance, this
suggests that the dimensions identified in the literature as being the most
important to describe special events and subsequently used as the basis for the
conjoint study, were different to those that respondents identified in the attribute
rating section. However, when one examines more closely the attributes that were
ranked as being the most important in the attribute rating section, it is seen that
many of these items are effectively a subset of, or similar to, the dimensions used
in the conjoint analysis. In fact, the only dimension that was ranked within the top
10 in the rating section that was not included in the conjoint section was ‘number
of attendees’. The first, fourth and eighth ranked attributes related to number of
attendees. Similarly, this was the second ranked attribute in the elicitation section.
This suggests that the choice of dimensions in the conjoint section, although not
perfect, was consistent with respondents’ views provided in other areas of this
study.

90
An alternative way of evaluating the representativeness of the conjoint
dimensions chosen for the study is to relate them back to the underlying factors
identified in the EFA of the special event attributes. Such a comparison between
the dimensions used in the conjoint study and the key underlying factors
identified in the EFA carried out on the responses to the attribute rating section is
presented in Table 3.18.
Table 3.18 Comparison of Conjoint Dimensions and Key Attribute Factors Conjoint Dimensions Underlying Factors Provides a very exciting experience. F4 (Exciting) Involves a high sense of mystique. F8 (Sacred) Occurs once or infrequently. F5 (Functional) Receives substantial government funding. F7 (Government funds) Incorporates a fair or festival. F1 (Many activities) Is held for a short period. F5 (Functional) Is of an international scale with wide media coverage. F3 (International Scale) Provides a great social experience. F1 (Many activities) Contributes greatly to community image and pride. F2 (Image and pride) This table demonstrates that there was a close association between the dimensions
that were used in the conjoint analysis and the key underlying factors derived
from the EFA.
3.9.4 Different Constructs Despite the fact that there was strong convergent validity between the various
techniques used in this study, one must be careful to ensure that the techniques are
actually measuring the same construct. According to Myers and Alpert (1977),
elicitation questions measure salience, rating scales measure attribute importance,
and conjoint analyses measure determinance. Although the differences between
these constructs may be subtle, the differences are, nevertheless, crucial. Salience
is often confused with importance but in fact salience refers to the more obvious
or prominent features which need not be the most important. Both of these
constructs are different to determinance which enables one to define an object or
to identify the boundaries, which may be more determinant in making choices.
This would likely explain the finding that there was not total convergence
between techniques.

91
In this study, both the elicitation and attribute rating sections ranked abstract
attributes more highly than functional attributes, and the order was not dissimilar.
3.9.5 Key Special Event Attributes The key special event attributes that were deemed to be most important based on
this study were:
• The number of attendees,
• The international attention due to the event,
• Improvement to the image and pride of the host region as a result of
hosting the event, and
• The exciting experience associated with the event.
The more functional attributes were ranked further down the list of attributes in
terms of their overall importance.
As mentioned earlier, Table 3.4 presents a list of events that are ranked in terms of
their mean rating of ‘specialness’. If one considers the four attributes that have
been identified in this study as being most important to describe a special event, in
relation to the list of events presented in Table 3.4, a strong relationship becomes
apparent. Of the first 11 events ranked as most special in Table 3.4, only rankings
seven and eight do not demonstrate the presence of the four key special event
attributes; neither ‘Myer Music Bowl Carols by Candlelight’ nor the ‘Melbourne
Moomba Festival’ really attracts substantial international attention. Of the 31
events ranked below 11 in Table 3.4, only the ‘Australian Open Golf’ (ranked 15)
and the ‘Australian International Airshow’ (ranked 16) would seem to
demonstrate the presence of the four key special event attributes.
It would seem, therefore, that these four attributes identified as being most
important in describing a special event do correlate well with the ratings of
‘specialness’ of specific named events as demonstrated in this study.

92
3.9.6 Categorisation of Special Events The factors produced by the EFA that was conducted on the ratings of specialness
are useful in helping to identify the underlying dimensions, or linkages, that
respondents perceived between different types of special events. These underlying
dimensions could be useful in categorising special events. Categorisations of
special events are useful for a number of reasons, including describing special
events to the consumer, listing them in a meaningful manner in special event
calendars and for the linking, or packaging, of special events. Given that such
categorisations are most often used for the benefit of the consumer, having a
categorisation schema that is consumer-based provides an obvious benefit.
The underlying dimensions or themes that were extracted from the EFA are as
follows:
• Sport - Mega
- General
- Other Racing
• Regional Events
• Festivals - Cultural
- City
• Technology
• Service Oriented
• Human Endurance
• Intermittent International
‘Myer Music Bowl Carols by Candlelight’ and ‘Non-special events’ have been
omitted from this listing as the former comprised a single item factor and the latter
did not relate to special events per se.

93
3.10 COMPARISON OF CONSUMER PERSPECTIVE OF SPECIAL EVENTS WITH THE CORE AND QUALIFYING ATTRIBUTES IDENTIFIED IN THE LITERATURE In the previous chapter, a list of core and qualifying attributes was compiled based
upon an examination of the literature. In general, the literature focussed on special
events from a supply perspective. Given that a consumer perspective has now
been collected, it is important to compare the two perspectives.
Of the four attributes identified in this study as being those that consumers use to
describe a special event, only one of them, namely, ‘improvement to image and
pride of the host region’, was included in the list of core special event attributes in
the previous chapter. Two of the others, ‘international attention’ and ‘number of
attendees’, were included in the previous chapter as qualifying attributes for
Major Events, whilst the fourth attribute, ‘an exciting experience’, was not
specifically identified in the list of core and qualifying attributes. One could argue
that synonyms had been used for ‘an exciting experience’ in the literature review
in the previous chapter, by referring to terms such as ‘colour and spectacle’ and
‘festive ambience, revelry and frivolity’ which were used particularly in relation
to festivals. However, although these terms are similar to ‘an exciting experience’,
they are not the same.
Given the publicity that has been accorded the larger types of special events, as
discussed in the previous chapter, it is not surprising that the special event
attributes identified by respondents were more specifically related to major
events.
3.11 LIMITATIONS
The dimensions used in the conjoint analysis acted as the basis for the comparison
of attributes assessed using the various techniques. This meant that many of the
items in the direct attribute rating section were ignored and constraints were
imposed on the key words that were extracted from the elicitation section.

94
Due to the large number of events listed in the questionnaire, it was not
considered reasonable to ask respondents to rate each dimension used in the
conjoint analysis for each of the events. A selection of three events was chosen as
a compromise for this task.
3.12 CONCLUSION This study found that there was quite strong convergence between three major
techniques used to identify the key attributes of a special event. This occurred despite
the suggestion that the different techniques could be measuring similar, but different
constructs.
This study identified four principal attributes that respondents used to describe a
special event, these being: number of attendees, international attention,
improvement to image and pride of the host region, and exciting experience.
Establishing an instrument based on these four attributes could be used to define
events that consumers would regard as special.
A categorisation of events based on an EFA of respondent ratings of special
events identified some underlying dimensions that could be used to help
categorise events in a manner that would have meaning to consumers. Such a
schema could be of particular interest in the proliferation of Special Event
Calendars that are now produced by many of the State and Territory Tourism
Organisations.

95
PART II
The Ability of Individual Differences to Explain Special Event Behaviour
This part of the thesis seeks to explain and predict consumer behaviour in relation
to visitor attractions in general, and special events in particular. In relation to the
Consumer Decision Process Model that was proposed in Chapter One, the focus
for this part of the thesis is on the section of the model between ‘Special Event
Cognition’ and ‘Situation Specific Influences’. Although the core focus of the
study was on special events, it was considered important to examine the
relationship between special events and permanent attractions since the two
effectively compete for consumer leisure time.
In this model there are four elements that impact upon the consumer decision
process, namely, environmental influences, individual influences, situation
specific influences and marketing efforts. On the basis that this thesis adopted a
consumer perspective throughout, the interest in this section was in the influence
of individual consumer differences on the decision process in relation to visitor
attractions. The other influences, whilst recognising that they exist, were ignored
in this study. Of the individual differences that exist between consumers, it was
decided to assess the performance of three, namely, personal values,
psychographics and demographics, in explaining consumer behaviour.
Chapter Four examines the importance of market segmentation and reviews the
literature in relation to the three approaches that were chosen to segment the
consumer market and explain behaviour in relation to visitor attractions. This
discussion leads to a series of research hypotheses that is presented in Chapter
Five. The methodology that was adopted for this part of the primary research is
discussed in Chapter Six.
Chapter Seven provides an analysis and discussion of the data that were collected
via the questionnaire. The analysis explores the relationships between the many

96
items that were identified in the Consumer Decision Process Model in an attempt
to explain behaviour in relation to visitor attractions. Such analysis included:
1. Special events versus permanent attractions,
2. Three levels of visitation: actual, interest and intention,
3. Three approaches to segmentation: personal values, psychographics
and demographics.
The final chapter presents conclusions and implications based upon the primary
research before suggesting some areas for future research.

97
CHAPTER 4
SPECIAL EVENT RELATED CONSUMER BEHAVIOUR
4.1 Introduction An earlier chapter discussed the potential for the special event market to become
saturated and the increasing likelihood that some special events will fail. Already it
appears that certain types of special events in the United States of America are
reducing in their popularity (Janiskee 1994) and it is likely that this trend will
continue, and indeed, spread to Australia. It becomes critical, therefore, that event
organisers are able to ensure that their particular event has a clear market position
that will enable the event to be successful in the longer term. In order to minimise the
chance of an event failing, event organisers must be able to answer questions such as:
-Who are the people most likely to patronise this event?
-Why?
-What are the main reasons for other groups of people not attending?
-How should the event be marketed?
In order to answer these questions, one needs an understanding of who the consumers
are and what motivates, or at least influences their behaviour in relation to special
events, as the success of “special events is driven by consumer demand” (Wicks and
Fesenmaier 1995, p. 25).
This chapter examines the importance of market segmentation in understanding
consumer motives and behaviour, with specific reference to special events. A number
of techniques that can be used to segment the consumer market is then discussed with
the emphasis being on personal values and psychographics.
The chapter then reviews the research conducted on consumer segments and motives
in relation to special events, thereby providing a platform for the research proposed
in this study.

98
4.2 Consumer Behaviour In a situation where demand exceeds supply, there is little incentive for a supplier to
strive to understand the market, as all production will be consumed. This approach
represents what is termed a ‘production orientation’ and is a reasonable
approximation to the manner in which the field of special events has operated in
recent years. Special events, being part of a growth sector and attracting substantial
publicity, have generally been well patronised and special event organisers have not,
therefore, had to spend much effort in trying to attract consumers.
Once demand for a product is exceeded by supply, producers are forced to focus
more of their attention on the needs and interests of the consumer, leading to what is
termed ‘a market orientation’. With the very substantial growth in the number and
type of special events that have been developed in many regions in recent years, there
is now a concern that demand will not be sufficient to sustain all of the scheduled
special events, leading to the failure of some. This puts pressure on event organisers
to develop an in-depth understanding of their market, to ensure that events which
satisfy the needs of the market are developed and these events are promoted in the
most effective means possible. “Understanding and adapting to consumer motivation
and behaviour is not an option - it is an absolute necessity for competitive survival”
(Engel, Blackwell and Miniard 1995, p. 12).
Provided that products meet consumer needs and expectations, marketers can
develop strategies to influence consumer behaviour. The crux, therefore, is to
develop a detailed understanding of consumers so that their needs and expectations
can be identified and then factored into the design of products. The overall objective
is to understand consumer behaviour so that it can then be influenced in line with the
objectives of the firm. A fundamental stage in this process is market segmentation.
4.3 Market Segmentation According to Loudon and Della Bitta (1993), the concept of a mass market no longer
exists, having fragmented in the 1980s into smaller and smaller pieces. Market
segmentation is “the process of dividing a potential market into distinct subsets of
consumers with common needs or characteristics” (Schiffman, Bednall, Watson and

99
Kanuk 1997, p. 48). Having segmented the market, an organisation can then identify
the segment(s) which gives it the best opportunity to compete in the market, rather
than trying to compete across the entire market. The issue, therefore, is not whether
the market should be segmented, but rather, what method is the most effective means
of conducting this segmentation?
When operating with a ‘production orientation’, there is little need to segment the
market because it is expected that all production will be consumed. Consumer needs
and expectations are not generally considered, which explains the often cited
example of Henry Ford suggesting that consumers could purchase a T-Model Ford in
any colour that they liked, provided it was black. This demonstrates the manner in
which suppliers can operate when they have market power.
Since not all consumers are alike, it is not effective to treat the entire market as a
single entity with single products on offer and a single promotional message. In an
ideal world, marketers would focus on the needs of individuals and would develop
marketing strategies for each person. Clearly, this is not feasible and marketers must
consider groups of individuals who behave in similar ways with respect to their
product needs or buying reasons. Marketers are then able to develop strategies
appropriate for the different groups. This reflects a consumer oriented approach
which, in contrast to the production orientation, focuses on the consumer and
requires the development of product strategies based upon consumer needs, albeit
with the profitability of the organisation as the ultimate motive.
In segmenting the market, it is important that within a segment there should be no
more than minor variations in behaviour between members, but that there should be
substantial variations between members of different segments. The key objective,
therefore, is to find appropriate dimensions that can be used to segment the market.
In order that the segmentation adopted be viable, the market segments should be:
• measurable - so that consumers exhibiting behaviour can be identified,
• accessible - so that such consumers can be reached,
• substantial - to justify pursuing such segments, and
• congruous - to ensure that consumers in a segment do fit together.

100
(Engel, Blackwell and Miniard 1995; Loudon and Della Bitta 1993; Soloman 1992;
Schiffman, Bednall, Watson and Kanuk 1997).
The major challenge for marketers is to identify the appropriate characteristics to use
in segmenting the market such that these characteristics are useful in explaining and
predicting behaviour. The segmentation process used should be one that provides
meaning for the segments so identified. Not all segmentation approaches enable
prediction of consumer behaviour, but they all help to further understand differences
between various sectors. In segmentation, it is “important to distinguish between
causal and descriptive differences” (Engel, Blackwell and Miniard 1990, p. 663). The
causal differences indicate motives for behaviour and are essential for effective
segmentation. Once the causal differences have been identified, the descriptive
differences are useful for providing additional information about members of the
segments. Demographics often provide descriptive differences.
There are two fundamental approaches to market segmentation, these being the ‘a
priori approach’ and the ‘post-hoc approach’ (Engel, Blackwell and Miniard 1990;
Loudon and Della Bitta 1993). The a priori approach, which has been the most
common, requires that the basis to be used for segmentation be selected in advance.
For example, if one believes that there are differences based on frequency of product
use, purchase frequency could be used as the basis for dividing the market. Segments
of the market could then be described in terms of their demographic and
psychographic characteristics. A limitation with this approach to segmentation is that
the best basis for segmentation may not be selected and thus the segments so defined
will not be the most effective. This limitation is overcome with the post-hoc approach
in which the basis used for segmentation is determined by the analysis itself. In the
post-hoc approach, consumers are clustered into homogeneous groups based on their
responses to a wide variety of descriptors. Once these natural clusters are identified,
techniques such as demographics and psychographics can be used to profile the
members of the clusters and to help explain the buying behaviour of each group.
A variety of approaches has been used to segment various markets, with some of the
more common approaches being demographics, personality, psychographics,

101
personal values, and combinations of various approaches. Demographics has been a
popular approach to market segmentation, probably due to the fact that demographic
information is more readily available. However, "demographic categories are far less
predictive than they used to be" (Plog 1994, p. 210), particularly due to the narrowing
gap within developed communities with respect to income, education, and
occupational status (Loudon and Della Bitta 1993). Some would argue, however, that
the income gap has in fact widened in recent years which would undermine one of
the reasons proposed for the decline in the predictive power of demographic
segmentation.
After reviewing a large number of segmentation studies that employed many
different segmentation bases, Andereck and Caldwell (1994) concluded that
demographic characteristics of segments rarely varied. Demographics provided some
information that could be used to describe individuals but did little upon which
marketing strategies could be based (Andereck and Caldwell 1994). The other
approaches to segmentation listed here relate to intrinsic characteristics of the
consumer and therefore help to provide information on the needs and motives of the
consumer. Although these approaches are more difficult to measure than
demographics, they are far more likely to be successful in providing causal
differences between segments.
Given the somewhat varied success that the different segmentation techniques have
had to date, it is important that the techniques be seen as complementary and some
discretion is used as to the technique(s) that are used in any given situation. Failure to
do this will reduce the explanatory power of segmentation (Bonn 1991).
4.4 Motivation Motivation is the "driving force within individuals that impels them to action"
(Schiffman, Bednall, Watson and Kanuk 1997, p. 90) in order to reduce tension that
exists because of an unfulfilled need. “Consumer needs are the basis of all modern
marketing” (Schiffman, Bednall, Watson and Kanuk 1997, p. 90) and are of
fundamental importance in understanding consumer behaviour. These needs, which
will be discussed in more detail subsequently, underpin all human activity and result

102
from a “perceived difference between an ideal state and the present state” (Engel,
Blackwell and Miniard 1995, p. 425). Motives, however, “represent enduring
predispositions to behave toward certain goals” (Engel, Blackwell and Miniard 1995,
p. 146). “Goals are the sought-after results of motivated behaviour” (Schiffman,
Bednall, Watson and Kanuk 1997, p. 93) but should not be confused with needs,
although neither can exist without the other.
Although most people experience similar needs and motives, they tend to seek
different goals in order to express these motives (Schiffman, Bednall, Watson and
Kanuk 1997). Thus, it is vital to one’s ability to predict consumer behaviour, to have
a strong grasp of consumer motives. Motives cannot be inferred validly from
behaviour as people seeking to satisfy the same need can select a variety of goals,
and people can select a single goal to satisfy a range of different needs.
The links and differences between motives, goals and products is not always clear to
consumers. Often consumers regard products as goals themselves rather than just as a
means of satisfying motives (Loudon and Della Bitta 1993). This is an important
dimension for marketers as it appears that the degree to which consumers regard
products as goals can be influenced.
A major problem with this area of study is that the actual measurement of motives is
difficult since they are hypothetical constructs. The common techniques that are
adopted in motivational research are observation, depth interviews, projective tests
and focus groups. Each of these techniques involves the interaction of a psychologist
or interviewer and, therefore, it is not usually possible to conduct studies using
substantial numbers of respondents. There is also concern that the results achieved in
these tests are very dependent upon the analyst as opposed to the data themselves,
thus leading to queries regarding the validity of the tests. Psychographics is another
approach that can be used to determine consumer needs and motives. An additional
complication to the measurement of motivation is the fact that motivation is a
dynamic construct (Pearce 1993; Schiffman, Bednall, Watson and Kanuk 1997). Not
only does it vary across individuals, but it also varies over time. Consumer needs and

103
goals are also dynamic as demonstrated by the way in which individuals will
normally raise their goals once a goal has been achieved.
Substantial effort has been expended over the past 100 years endeavouring to identify
and categorise human needs and motives (Loudon and Della Bitta 1993; Engel,
Blackwell and Miniard 1995). The most widely known theory of human motivation
is Maslow’s Hierarchy of Needs which involves five basic levels of needs in
hierarchical order. These needs, in order of decreasing importance, are physiological,
safety and security, social, ego, and self-actualisation.
Maslow proposed that consumers seek to satisfy lower level needs before moving up
the hierarchy to higher level needs, and that higher level needs increase in
importance as lower level needs are largely satisfied. The model accepted that there
is some overlap between levels as no need is ever fully satisfied. Even after being
passed on the need hierarchy, it is possible for lower level needs to assume temporary
dominance of behaviour due to some form of deprivation. For example, even from a
position of affluence in a modern society, it is difficult for one to pursue self
fulfilment needs in the absence of food. As one moves up the need hierarchy, one
moves away from basic biogenic needs to more psychogenic needs. In this process,
the individual grows “psychologically and comes to develop more wants and to seek
a greater variety of ways to satisfy particular motives” (Loudon and Della Bitta 1993,
p. 334).
Maslow’s Hierarchy of Needs provides a useful framework for considering motives
in general, even though it has had limited success in predicting specific behaviour
(Loudon and Della Bitta 1993). From the tourism perspective, for example, despite
the fact that an individual may be operating at a higher level in Maslow’s Hierarchy,
travel decisions have often been found to be determined by safety requirements
which reflect the importance of a lower level need. This model also provides a useful
means for segmenting the market but as a result of the abstract nature of motives, it is
difficult to test this model empirically.

104
Once a special event organiser has an understanding of what motivates groups of
consumers to attend special events, or in fact what precludes others from attending, it
is possible for the organiser to modify the types of special events on offer and to
ensure maximum appeal to the target segments. Unfortunately, it is rare that
researchers consider the motives of non-purchasers or non-attendees and yet doing so
can enhance the understanding of purchaser or attendee motives (Ross 1994).
Crompton and McKay (1997) suggested that it was also important to understand the
motives of special event patrons because of the close association between motives
and satisfaction, and to facilitate an “understanding [of] visitors’ decision processes”
(p. 426).
In order to understand consumer motivation, it is necessary to understand the needs
that the consumer strives to satisfy. Therefore, it is necessary to devise a means of
measuring consumer needs. For patrons of special events, one must discover what
need, or needs they are attempting to satisfy by their attendance at special events. To
date, very little work has been done in this area (Getz 1989; Uysal, Gahan and Martin
1993; Mohr et al 1993; Backman et al 1995; Getz and Cheyne 1997; Mayfield and
Crompton 1995), although a number of recent studies has started to explore this field.
These studies, however, have considered only the motivation of visitors from outside
the host region in relation to special events and have tended to ignore the motivation
of the local population.
The importance of local patronage for the overall success of a special event was
discussed in an earlier chapter, and for special events to be successful, it is vital that
they attract strong local support. It is, therefore, important that motivation in relation
to special events be considered from a more general consumer perspective, not
simply from the perspective of visitors from outside the region.
It has been suggested that "tourism may share or be subject to the same theories and
concerns that characterise leisure" (Mannell and Iso-Ahola 1987, p. 315). Indeed,
Iso-Ahola (1982) suggested that "tourism motivation is a part or one form of leisure
motivation" (p. 257). Mannell and Iso-Ahola (1987) argued that both tourism and
leisure should be viewed as an experience and that this "experience emanate(s) from

105
the interplay of two motivational forces: to escape from routine and stressful
environments and to seek recreational opportunities" (p. 314). Mannell and Iso-
Ahola concluded that the escape motivation had become the more important
motivational force for tourism as demonstrated by the recent trend towards more
frequent but shorter vacations where there is very much an 'escape from the bustle'
focus. Pearce (1993) adopted a different view to Mannell and Iso-Ahola, believing
that tourist motivation was sufficiently different to leisure motivation to justify
separate theory building. According to Pearce (1993), tourist motivation had novel
features in that it was “discretionary, episodic, future oriented, dynamic, socially
influenced and evolving” (p. 114). However, it is hard to see that these features
necessarily make tourism motivation different to leisure motivation. According to
Iso-Ahola (1982), leisure activities, including tourism activities, were motivated by
the desire for intrinsic rewards and individuals’ desire to escape their routine
environment.
An alternative proposal to explain travel motivation is the balance between ‘push’
and ‘pull’ factors (Crompton 1979). Push factors, such as relaxation, escape, desire
for socialisation, and prestige, are within individuals and prompt them to travel. Pull
factors on the other hand, are those that are controlled or influenced by the
destination itself. Motivation to travel can be seen as a combination of both push and
pull factors.
Although there has been a number of research studies into tourism motivation (see,
for example, Crompton 1979; Dann 1981; Fodness 1994; Iso-Ahola 1982; and
Mannell and Iso-Ahola 1987), little has been found that specifically focuses upon the
special event phenomenon.
As motivation theory gained in popularity, more and more has become expected of it
to the stage where there is the unreasonable expectation that it be able to explain
most of the variation in consumer behaviour (Pearce 1993). There is also growing
confusion regarding the concurrent use of similar terms such as values, attitudes and
preferences. Pearce (1993) argued that tourist motivation was a more fundamental
concept than values, as evidenced by the fact that the origins of many of the models

106
of values came from motivation theory. He further suggested that values were a
useful segmentation tool but that the link to motivational analysis should not be
overlooked.
Therefore, an understanding of consumer motivation in relation to special events
should greatly enhance the ability of special event organisers to better meet the needs
of the market. It is also clear that alternative, or pseudo measures, are needed to
measure consumer motivation if it is to be done on a larger scale and the market
should be segmented in order to provide information that is useable. Approaches to
market segmentation, such as personal values and psychographics, can play a large
part in achieving this objective.
4.5 Personal Values Values are regarded as beliefs about life and acceptable behaviour. They are
learned (Williams 1979), closely held, and act as standards to guide behaviour
(Rokeach 1979). They provide an insight into the goals that motivate individuals as
well as the most effective means of attaining these goals (Engel, Blackwell and
Miniard 1995). “Values represent (1) concepts or beliefs, (2) about desirable end
states or behaviours, (3) that transcend specific situations, (4) guide selection or
evaluation of behaviour and events, and (5) are ordered by relative importance”
(Madrigal and Kahle 1994, p. 22).
An individual’s value system is the way in which separate values are arranged in an
hierarchical form, which enables an individual to resolve conflicts and make
decisions (Kamakura and Mazzon 1991). In looking at differences between
individuals, it has been asserted that it is not simply the values per se that should be
considered, but rather the way in which the particular values are arranged into a value
system (Engel, Blackwell and Miniard 1995). Single values are grouped into higher
order value domains based upon their similarities and differences (Madrigal and
Kahle 1994), and it has been suggested by some, that these value domains are better
predictors of behaviour than is achieved using single values (Schwartz and Bilsky
1987; Kamakura and Novak 1992; Kamakura and Mazzon 1991). Rokeach (1968)
argued that virtually all life situations involved more than a single value and

107
invariably there is conflict between a number of values. The value system is needed
to resolve these conflicts. A value system is more abstract than a single value and
segments identified using value systems are better able to describe key underlying
consumer motives. It is important to recognise, however, that other environmental
influences, such as price and promotion, must be taken into account in segmenting
the market (Kamakura and Novak 1992).
Personal values has been used as a basis for segmentation or for predicting consumer
behaviour in a wide range of studies including: cigarette smoking (Grube, Weir,
Getzlaf and Rokeach 1984), religion (Feather 1975), travel decisions (Pitts and
Woodside 1986; Muller 1989; Dalen 1989; Shih 1986; Thrane 1997), choice between
work and leisure pursuits (Jackson 1973), travel style (Madrigal 1995), cross-cultural
differences (Schwartz and Bilsky 1987), discontinuance of leisure activities
(Backman and Crompton 1990) and choice of leisure activities (Beatty, Kahle,
Homer and Misra 1985; Boote 1981; Jackson 1973; Madrigal and Kahle 1994).
Although some researchers have suggested that values strongly influence behaviour
(see, for example, Homer and Kahle 1988), most are more cautious in their views.
Homer and Kahle (1988), in proposing values as a meaningful predictor of
behaviour, suggested that an inability to correctly measure values was a factor in
explaining that there had not been stronger correlations between values and
behaviour in studies conducted to that time. The purpose of this study is to explore
further the extent of any such relationship in a special event context.
According to Madrigal (1995), much of the work that had been carried out on values
concerned their performance in relation to market segmentation, which had been
impressive since “they are less numerous, more centrally-held, and more closely
related to motivations than more traditional demographic and psychographic
measures” (p. 126). Blamey and Braithwaite (1997) suggested that values were a
useful basis for segmentation because they were less problematic to measure than
needs and motives, and they had greater predictive power with respect to behaviour.
They are also useful as indicators of consumer motives and for enriching the
descriptions of market segments formed using more traditional approaches (Munson
1984; Pitts and Woodside 1986).

108
An understanding of personal values provides more information regarding consumer
behaviour than does demographic information (Kahle and Kennedy 1988; Keng and
Yang 1993). An understanding of values is important as “value priorities shape
lifestyles and drive consumer behaviour” (Muller and Woodcock 1997, p. 33). Thus,
if a marketer is able to identify segments that share common value preferences,
products can be designed and promotional strategies developed that are consistent
with those value preferences (Muller 1989). A number of useful examples of how
promotional campaigns can be developed around segments based on individuals with
similar values is provided in Muller (1989).
Unlike attitudes, values are supposedly not tied to any specific object or situation
and, therefore, are able to guide behaviour in a general sense. The assertion that there
are a few major value dimensions which are relatively stable over time and provide
the basis for literally thousands of specific beliefs and attitudes, makes them
important tools in predicting consumer behaviour. Being relatively stable over time
does not mean, however, that values do not change. Muller and Woodcock (1997)
reported on studies that had been conducted in the US which demonstrated that value
priorities of ‘baby boomers’ had changed over a 10 year period. It was suggested that
economic and general resource factors contributed to this change in value priorities.
It is the centrality of values to people’s cognitive structures that enables them to be
“effective predictors of human behaviour in a variety of situational contexts”
(Madrigal 1995, p. 126). However, it is an understanding of the value system rather
than a single value that is necessary to gain an appreciation of an individual's
behaviour (Kamakura and Novak 1992). It has been suggested that consumers who
rate particular values more highly, have different lifestyles which in turn can affect
the way in which they are influenced by promotional appeals, product positioning
and design, pricing approaches, and channels of distribution (Loudon and Della Bitta
1993). However, there is still the need for further research in this area to determine
the origin of values, how firmly they are held by consumers, and their influence on
consumer behaviour for a wider group of products.

109
Rokeach (1979) suggested that there are two main types of values, namely, terminal
values and instrumental values. Instrumental values, such as ‘honest’ and ‘capable’,
are basically the modes of behaviour by which an individual can achieve the
terminal, or end value. Terminal values, which include values such as ‘wisdom’ and
‘happiness’, are acquired early in life and tend to be more stable than instrumental
values which may change as a result of the socialisation process (Prakash 1984).
Rokeach developed a measuring instrument called the Rokeach Value Survey (sic.),
or RVS, that “attempts to identify major end-states of human existence and the
behavioural modes for achieving them” (Rokeach 1979, p. 50). The RVS asks
individuals to rank 18 terminal values and 18 instrumental values in order of
importance as guiding principles, and Rokeach suggested that “extensive research
with it in different societies has consistently shown that it is both a reliable and valid
measuring instrument” (p. 50). The terminal and instrumental values that are
contained in the RVS are presented in Table 4.1. Based on studies conducted in the
United States looking at the relationship between purchases of major appliances and
values, it was found that terminal values tended to guide choice among product
classes and instrumental values tended to guide choice among brands (Loudon and
Della Bitta 1993).
Table 4.1 The Rokeach Value Survey
TERMINAL VALUES Wisdom (a mature understanding of life) Freedom (independence, free choice) Self-respect (self-esteem) A sense of accomplishment (lasting contribution) A world at peace (free of war and conflict) Equality (brotherhood, equal opportunity for all) A world of beauty (beauty of nature and the arts) Inner harmony (freedom from inner conflict) Family security (taking care of loved ones) Social recognition (respect, admiration) Happiness (contentedness) An exciting life (a stimulating, active life) A comfortable life (a prosperous life) True friendship (close companionship) Mature love (sexual and spiritual intimacy) National security (protection from attack) Pleasure (an enjoyable, leisurely life) Salvation (saved, eternal life) INSTRUMENTAL VALUES Intellectual (intelligent, reflective) Capable (competent, effective)

110
Honest (sincere, truthful) Responsible (dependable, reliable) Imaginative (daring, creative) Independent (self-reliant, self-sufficient) Broadminded (open-minded) Logical (consistent, rational) Ambitious (hard-working, aspiring) Helpful (working for the welfare of others) Courageous (standing up for your beliefs) Self-controlled (restrained, self-disciplined) Loving (affectionate, tender) Forgiving (willing to pardon others) Cheerful (lighthearted, joyful) Polite (courteous, well-mannered) Clean (neat, tidy) Obedient (dutiful, respectful)
Source: Rokeach (1979). The RVS was considered somewhat cumbersome by many researchers as it required
respondents to rank, in order of importance, two lists of 18 variables. Criticism was
levelled at the RVS on two main counts; firstly, since people can only generally store
about seven items in short term memory, it would be difficult for an individual to
rank 18 items, and secondly, it was suggested by some (see, for example, Clawson
and Vinson 1978), that less information could be derived from rankings than interval
scaling (Keng and Yang 1993). In order to overcome some of the difficulties with
such a task, the List of Values (LOV), which are presented in Table 4.2, was
developed by researchers at the University of Michigan Survey Research Centre in
1983 (Madrigal and Kahle 1994). The LOV, which was based largely on the work of
Maslow and Rokeach, uses nine terminal values that are derived from the RVS. In
developing the items in the LOV, two specific terminal values from the RVS were
included and the remaining seven items were amalgamations of several RVS items or
a generalisation of a specific RVS item (Kamakura and Novak 1992). The LOV was
based upon terminal values as they are more abstract than instrumental values and
appeared more relevant to consumer behaviour (Madrigal and Kahle 1994). In
administering the LOV, respondents are asked to rank the nine values and are
classified according to their highest ranked value. A modification to this process asks
respondents to rate each of the values, using a Likert scale, regarding the importance
of the individual values as guiding principles.
Table 4.2 The List of Values

111
Self respect Being well respected Security Sense of belonging Warm relationships Self-fulfilment A sense of accomplishment Fun and enjoyment in life Excitement
Source: Kamakura and Novak (1992). However, categorising respondents on the basis of their highest ranked value ignores
the fact that single values fit together to form a value system and, indeed, “conflicts
with Rokeach’s concept of an ordered value system” (Kamukura and Novak 1992, p.
119). Rating each of the values rather than just ranking them, as occurred with the
RVS, helps identify the intensity with which individual values are held. Even with
the RVS, there has been substantial controversy as to whether items should be rated
instead of ranked and this controversy has not yet been resolved (Prakash 1984).
According to Kamakura and Mazzon (1991), “empirical comparisons between the
ranking and rating data-collection methods have shown mixed results” (p. 209) based
on the reliability of test-retest results. Richins and Dawson (1992) argued that there
were problems with both ranking and rating approaches. They suggested that ranking
provided fairly superficial information on any particular value, made comparison
between individuals impossible, and did not indicate how important a particular
value was in a person's life. The ratings approach was accused, also, of providing
somewhat superficial information in that it was not possible to compare the relative
importance of values. Despite the debate about the relative merits of the two
measurement approaches, ranking has been used more often “because it reflects the
inherently comparative nature of values” (Kamakura and Mazzon 1991, p. 209).
Most of the work that has been done with the LOV has been based on single values
rather than these higher order constructs (Madrigal and Kahle 1994).
The Stanford Research Institute (SRI), a management consulting firm in California,
developed a system known as VALS1 and subsequently VALS2, in order to
understand consumers and their purchasing behaviour. VALS, which is an acronym
for Values and Life Styles, combines both concepts and has been widely used in
monitoring and predicting consumer behaviour in relation to many products. The

112
belief that underpinned VALS was that individuals continually seek to improve
themselves throughout their lives which influences their values, lifestyle and hence,
behaviour (Gunter and Furnham 1992). A major problem with this system is that it is
proprietary and thus it usually is not possible to gain access to the specific questions
used in the studies, nor verify the findings. SRI used a 30 item questionnaire
containing 22 attitudinal items and eight demographic items to classify individuals
under the VALS system (Holman 1984). SRI replaced VALS1 with VALS2 because
of poor performance in predicting consumer behaviour based on the VALS1
segments, and because the segments were more aligned with population
demographics in the US from the previous decade (Gunter and Furnham 1992).
Although there are many similarities between VALS and the LOV, one contrast is in
the order of value segments that are derived from each approach. Under the VALS
approach, there is an assumption that the segments are ordered hierarchically and that
members of the higher order segments have greater resources than those in the lower
segments. No such order exists with the LOV.
There has been substantial debate as to whether VALS or the LOV is a more
effective means of understanding and predicting consumer behaviour, but there is
little doubt that the VALS system is more widely known. Novak and MacEvoy
(1990) conducted a study to replicate earlier work by Kahle, Beatty and Homer
comparing the predictive ability of the LOV versus VALS. The Kahle, Beatty and
Homer study, conducted in 1986, found that the LOV had more predictive utility
than VALS, however Novak and MacEvoy (1990) suggested that this was probably
due to the fact that some demographic variables were included with the LOV. They
found that the predictive power of the LOV without the accompanying demographic
variables was significantly less than that achieved with VALS. Indeed, Novak and
MacEvoy (1990) found that demographic variables were more effective predictors of
consumer behaviour than the LOV with no accompanying demographic variables. It
should be noted that in the comparative studies that have been conducted between
VALS and the LOV, it has always been VALS1 as opposed to VALS2 that has been
considered. Given that VALS2 was introduced to improve upon the performance of
VALS1, comparisons with VALS2 may be more conclusive in their results. Since

113
VALS is a proprietary measurement technique, it has not been possible to access
information that would enable this technique to be further analysed in this study and
will not, therefore, be included further.
Since it has been asserted that values are important in understanding, explaining and
predicting human behaviour (Vinson, Scott, and Lamont 1977; Howard and
Woodside 1984; Munson 1984; Pitts and Woodside 1984; Homer and Kahle 1988;
Madrigal and Kahle 1994; Madrigal 1995), one would expect people sharing similar
value systems to relate to products in a similar fashion. Consumers have been found
to use choice criteria related to their value system in product selection, with values
being claimed to be more effective in determining choice behaviour among generic
categories than they are in determining choice behaviour amongst specific brands
within a generic category (Munson 1984). Using values as a basis for market
segmentation can provide valuable insights into the needs and motives of members of
the segment and provide a base for the marketer to develop appropriate marketing
strategies for the particular segments (Pitts and Woodside 1984). More research is
required to identify how personal values are linked to product preferences and
behaviour (Munson 1984).
There is some evidence to suggest that personal values vary by some consumer
demographics such as age, education, income and sex, but this relationship needs
further research (Vinson, Scott, and Lamont 1977; Keng and Yang 1993). Munson
(1984) suggested that some key product dimensions such as conspicuousness, value-
expressiveness, involvement, and susceptibility to peer and family pressure make the
usage of some types of products more closely aligned to values.
Although attitudes have been studied and measured more frequently than values
(Dichter 1984; Loudon and Della Bitta 1993), this should not necessarily be taken as
a measure of their relative importance, and it is essential to consider the relationship
between the two concepts. Values are more fundamental and in fact provide the
foundation for attitudes; in other words, values precede and colour attitudes (Dichter
1984; Kamakura and Novak 1992). Attitudes are more likely to change than values
which tend to be stable over time. Attitudes focus on specific objects or situations

114
whereas values apply more generally and in fact help determine what attitudes should
be held in specific situations (Loudon and Della Bitta 1993). “Rokeach maintains that
values serve to link central beliefs to attitudes, and thus may be more useful than
attitudes in understanding motives and behaviour” (Pitts and Woodside 1986, p. 20).
Rokeach (1968) also suggested that attitudes were value expressive. One must decide
whether values affect behaviour directly or instead affect attitudes which in turn
influence behaviour. The latter option was supported by Homer and Kahle (1988).
The two most widely reported studies that have used values as a basis for explaining
or predicting behaviour in the tourism field are Pitts and Woodside (1986) and
Madrigal and Kahle (1994). Both studies concluded that values were useful in
predicting specific tourism activity, and that values should be considered worthwhile
segmentation tools.
In the Pitts and Woodside (1986) study, the values of members of a convenience
sample were measured using the RVS, and respondents were asked whether they had
visited nine tourist attractions in the past 24 months; in other words, only past
visitation was considered. The tourist attractions used in that study were confined to
“beach locations, theme parks, and state parks” (p. 22), which restricted the
application of the findings to a narrow range of tourist sites. In adopting the RVS
scale which ranks, but does not rate values, there is also the problem that it is difficult
to identify the intensity with which a value is held. Pitts and Woodside found quite
strong evidence to suggest that differences in personal values could be used to predict
visitation to tourist attractions and membership of groups segmented on leisure
choice.
Madrigal and Kahle (1994) used the LOV in their study of vacation activity
preference, and asked respondents in a convenience sample to rate each of the values
and to indicate the single most important value. Like Pitts and Woodside (1986),
however, Madrigal and Kahle considered only an historical perspective. Their study
was restricted to activities given as reasons for visiting Scandinavia, rather than
specific attractions visited while in Scandinavia.

115
Although Gunter and Furnham (1992) acknowledged the claimed benefits of the
LOV in explaining and predicting consumer behaviour, they suggested that the
predictive power of the LOV was well short of perfect. However, Gunter and
Furnham (1992) suggested that the LOV did display some utility and research into
the technique should, therefore, continue. It should be noted that Gunter and
Furnham did not conduct any primary analysis themselves and based their
conclusions on studies reported elsewhere.
Based on this review of the literature, it can be seen that personal values have been
regarded by many researchers as a valuable basis for market segmentation but few
studies have explored the potential of values as a segmentation tool (Madrigal and
Kahle 1994). Few would suggest that personal values be used as the sole
segmentation technique but a number of researchers claim that when combined with
other techniques such as demographics and psychographics, values offer meaningful
insights into consumer segments (see, for example, Madrigal and Kahle 1994). In a
similar way, Homer and Kahle (1988) suggested that values influence behaviour but
recognised that this does not mean that all behaviour can be explained by values. “To
hypothesise an influence of values upon social behaviour under specified conditions
is not to make the absurd claim that all behaviour is merely an expression of values
and has no other determinants” (Williams 1979, p. 28). Results from a number of
studies suggest that values can offer insights into the motives and needs satisfied by a
given product, yielding an understanding which can then be factored into
promotional campaigns.
4.6 Lifestyle and Psychographic Segmentation Personality and its relationships to human behaviour can be traced back thousands of
years, but examination of a large sample of personality studies suggests that if there
is a relationship between personality and consumer behaviour, it is too weak to be of
any real value to the marketer (Loudon and Della Bitta 1993). Engel, Blackwell and
Miniard (1995) stated that personality was unable to explain more than 10 per cent of
the variation in consumer behaviour and even its use as a basis for segmentation had
not been adequately justified.

116
As some marketers concluded that demographic segmentation no longer had the
explanatory power that it once appeared to have and that segmentation based upon
personality had little explanatory power, they sought other bases to use in their
segmentation work. During the late 1960s, interest in lifestyle analysis grew rapidly
(Hustad and Pessemier 1974) as marketers wanted to add 'colour' to their
understanding of the consumer in a manner not possible with demographic
segmentation. It has been found that "psychographic variables are capable of
producing substantial differences between groups of consumers, and that these
differences are often larger than the differences produced by the standard
demographic profile" (Wells 1975, p. 207). It is basically a technique to measure
lifestyles.
“Lifestyle is a summary construct defined as patterns in which people live and spend
time and money” (Engel, Blackwell and Miniard 1995, p. 449) and is reflected by
one’s “overt actions and behaviours” (Mowen 1993, p. 236). Lifestyle research is
based on personality and motivational research. It is contended that it combines the
objectivity of personality research with the descriptive detail of motivation research
(Wells 1975), and has improved marketers’ understanding of the consumer and has
enhanced their ability to predict consumer behaviour. There is a view that a person’s
lifestyle is a reflection of that person’s value system but is more comprehensive and
liable to change more rapidly than a person’s value system, which is enduring
(Gunter and Furnham 1992; Engel, Blackwell and Miniard 1995).
Despite the fact that ‘psychographics’ and ‘lifestyle’ are often used interchangeably,
the two terms, although related, are regarded as being different by some authorities
(Loudon and Della Bitta 1993; Gunter and Furnham 1992). No precise definition of
psychographics has been found (Wells 1975; Loudon and Della Bitta 1993) but it is
generally accepted that psychographics provides a quantifiable means of
operationalising lifestyles. Psychographics could be defined as the description of the
psychological makeup of consumers based on ‘psych’ meaning psychological and
‘graph’ meaning to describe. “Psychographics is the systematic use of relevant
activity, interest and opinion constructs to quantitatively explore and explain the
communicating, purchasing and consuming behaviours of persons for brands,

117
products and clusters of products” (Loudon and Della Bitta 1993, p. 60). AIOs
(Activities, Interests and Opinions) are the prime measure used in psychographics
and AIO is often regarded as a synonym for psychographics. Although
psychographics can be used as a basis for segmentation, some believe that it is more
effective to employ AIOs to understand segments that have been identified using
more traditional segmentation techniques (see, for example, Engel, Blackwell and
Miniard 1995). When segments are formed based upon AIO analysis, consumers are
grouped on their lifestyles.
AIOs are generally presented as a battery of statements and respondents are asked to
indicate, often using a Likert scale, their strength of agreement or disagreement with
each of the statements. These AIOs can be either ‘general’ or ‘specific’. In the case of
general AIOs, information on the profile of groups of consumers is collated whilst in
the case of specific AIOs, the statements used relate more specifically to a given
product thereby enabling information regarding consumers’ views on that product to
be collected.
"Psychographics is a quantitative research procedure which seeks to explain why
people behave as they do and why they hold their current attitudes" (Demby 1974, p.
28). It provides valuable information that can be used to help motivate consumers to
take a particular course of action. However, there is still some controversy about the
usefulness of psychographic studies. The main criticisms of psychographics include
the lack of distinctiveness of psychographic segments, the length of AIO
questionnaires, the lack of relationships between psychographic segments and
behaviour, the exploratory nature of the technique, and the lack of reliability or
validity of AIO instruments. The fact that AIO questionnaires tend to be so much
longer than questionnaires based upon personal values is a major drawback with
respect to the conduct of marketing research (Muller 1989). Supporters of the
psychographic technique seem to recognise many of the limitations but argue that the
technique adds substantially to an understanding of consumers (Wells 1975).
In many of the studies that are conducted using psychographics, batteries of
statements are developed specifically for the study and little effort is made to ensure

118
the validity of the statements (Gunter and Furnham 1992). As a result, one must treat
with caution the results of these studies. It is vital to the acceptance of psychographic
studies that more work is done to justify the validity of the study instrument. The
ultimate success of the technique will be determined by its ability to predict
consumer behaviour.
Since psychographic research is quantitative in nature, generally using pre-coded self
administered questionnaires, it allows the use of multivariate statistical analysis of
the results (Wells 1975). In psychographic research the results are usually factor
analysed in the search for a small number of underlying factors. These factors usually
explain a large percentage of the total variance observed.
4.7 Segmenting the Special Event Consumer Market The earlier discussion relating to the growing importance of market segmentation
in general has particular importance in the field of special events. “Increased
competition between visitor destinations and the high cost of promotion
encourage marketing specialists and event organisers to identify the behavioural
characteristics of visitors they intend to service. A clearly defined market segment
permits specifically directed promotional programs, improves estimates of the size
of a specialised market, and encourages the development of event opportunities
that appeal to the identified groups” (Formica and Uysal 1996, p. 175).
Getz (1994a, p. 440) suggested that "event tourists are a highly segmented market"
which means that it is important to also segment the special event product to match
the needs of the market. At present there are "insufficient data on what festival and
event visitors want, and consequent inability to segment the potential markets for
more effective target marketing" (Getz 1991a, p. 4). Competition for consumer
leisure time is increasing and for special events to be successful they must at least
meet the growing consumer expectations (Wicks and Fesenmaier 1995).
Getz (1997) discussed segmentation in relation to special events and suggested that
segmentation variables could be grouped according to six segmentation questions.
The diagrammatic structure that Getz (1997) used to present these segmentation

119
questions and variables is reproduced in Figure 4.1. The focus of this study is to
answer the question ‘Who are they?’. It should be noted that the socio-economic
variables have been included with the demographic variables in this study.
Figure 4.1 Segmentation Variables for Events. Source: Figure 11.3 in Getz (1997). In discussing the merit of psychographic variables as segmentation tools, Getz (1997)
suggested that they need to be combined with other segmentation variables to be of
value, despite their popularity. He suggested further that “income is the greatest
predictor … of entertainment expenditure” (p. 262).
A number of researchers has stressed the importance of understanding the needs and
motives of special event patrons (see, for example, Formica and Uysal 1996; Getz
1997; Hall 1992; Mayfield and Crompton 1995; Mohr, Backman, Gahan and
Backman 1993; Ritchie and Beliveau 1974; Robinson and Noel 1991; Uysal, Gahan
and Martin 1993). Indeed, failure to understand such motives will greatly diminish
the chance of success that an event will have. However, despite the fact that the need
for an understanding of consumer motivation in relation to special events is widely
recognised, little research has been done in this area (Getz and Frisby 1988; Mohr,
VISITORS FROM WHERE?
GEOGRAPHIC
- Delimit primary and secondary market areas
WHAT DO THEY WANT? (BENEFITS SOUGHT)
- Trip motives - Experiences desired
HOW OFTEN WILL THEY ATTEND?
- One-time only - First-time (might repeat) - Repeaters and regulars
WHO ARE THEY? DEMOGRAPHIC PSYCHOGRAPHIC SOCIO-ECONOMIC - Age - Gender - Personality - Income level - Marital status - Beliefs: attitudes - Employment status - Family status - Values - Education attainment - Race/ethnicity - Lifestyle
UNDER WHAT CONDITIONS WILL THEY ATTEND?
TYPE OF TRIP SEASONALITY - Holiday - Peak season only - Day-trip - All-year potential - Business - Visiting friends/relatives
HOW CAN WE REACH THEM?
PRODUCT USE DISTRIBUTION - Media habits - Will buy packages - Activities enjoyed - Makes own plans - Equipment owned - Travels with affinity groups

120
Backman, Gahan and Backman 1993; Uysal, Gahan and Martin 1993). It is important
that research into consumer motivation be expanded as “the more an event manager
can tell about their (sic.) visitors, the better the chance the event has in matching or
exceeding the visitors previsit expectations and having that visitor leave that event
very satisfied with their experience” (Mohr, Backman, Gahan and Backman 1993, p.
96).
It is also important to consider ‘supply side segmentation’ whereby the special events
on offer are placed in appropriate categories to facilitate the match between consumer
needs and the special events that are available. Some work has been done on
developing and modifying databases to analyse the thematic, temporal and
geographical distribution of special events (see, for example, Janiskee 1996a; Ryan,
Smee and Murphy 1996).
4.7.1 Destination-Based Studies A small number of studies has been conducted in recent years that has added to the
body of knowledge in this area. It would appear that the first of these studies was
conducted by Ralston and Crompton (1988) (reported in Getz 1991a). This
marketing research study was based on the 1987 Dickens on the Strand Festival in
Galverston. The questionnaire used in this study, which was distributed to patrons at
the event, included 48 statements based on the literature relating to leisure motives.
These statements probed respondents’ reasons for attending the festival. Ralston and
Crompton attempted to identify market segments defined by demographic
characteristics, that exhibited similar motives but were unsuccessful, concluding that
"motivations (sic.) dimensions were generic across all groups" (Ralston and
Crompton 1988, quoted in Getz 1991a, p. 262). The most important motivational
groups found in this study, in descending order of importance, were family
togetherness, meeting or observing new people, nostalgia, learning and discovery,
social contact, stimulus seeking, and escape from personal and social pressures.
Uysal, Gahan and Martin (1993) used the 1991 Travellers Rest's County Corn
Festival in South Carolina as a case study to examine event patron motivation. They
based their study on the tourist motivation framework proposed by Mannell and Iso-

121
Ahola (1987) relating to the balance between the motivational forces of escape and
reward. The questionnaire that was used in this study, which was administered by
volunteers to patrons at the event, included a list of 24 motivational items that was
based on earlier studies. The 174 completed questionnaires were factor analysed to
extract five factor groupings which together accounted for 63 per cent of the
variance. The five factors were labelled: escape, excitement and thrills, event
novelty, socialisation, and family togetherness. It was concluded that the results of
this study supported Mannell and Iso-Ahola's proposition regarding the simultaneous
operation of the two motivational forces of escape and reward.
Mohr, Backman, Gahan and Backman (1993) used the 1992 Freedom Weekend
Aloft (FWA) Festival in Greenville South Carolina as the study site to assess the
stability and variability of event motivation for various categories of first time and
repeat visitors. Although there was no specific information regarding the basis of the
23 motivational items used in this study, they appeared similar to those used by
Uysal, Gahan and Martin (1993). Underpinning this project was the view that if
special events are to achieve growth in attendance over time, they must be able to
convert first time visitors into repeat visitors as well as attract first time visitors. Little
research had focussed upon the behaviour of the repeat visitor (Mohr, Backman,
Gahan and Backman 1993), and this study sought to address this deficit by
comparing the first time visitor with the repeat visitor. Volunteers were able to
collect 458 useable questionnaires from patrons at the 1992 FWA.
Once again, Exploratory Factor Analysis was employed on the motivational elements
of the questionnaire and this resulted in five factor groupings that accounted for 58
per cent of the total variance. The factor groupings were very similar to those
extracted in the Uysal, Gahan and Martin (1993) study, although the order of factors
was slightly different. Based on this, it was concluded that “different motivational
dimensions are important to visitors when they attend different festivals” (Mohr,
Backman, Gahan and Backman 1993, p. 95). It was also concluded that there were
differences between first time and repeat visitors in their motivation for attending the
festival. This study, like that of Uysal, Gahan and Martin (1993), found that festival
goers were homogeneous with respect to their demographic characteristics.

122
Mihalik and Ferguson (1994) conducted a study on the 1988 South Carolina Fair.
The prime focus of this study was to develop a demographic profile of visitors to the
fair but six items were also included to assess the importance of the function’s
‘education’, ‘recreation’, and ‘social’ aspects in patrons’ decision to attend the fair.
The fact that the study was constrained to six items on three dimensions prevents one
from drawing too many conclusions, but it was found that, based upon the 432 fair
patrons interviewed, all three functions were seen as important, with ‘family
togetherness’ being the most highly rated item.
Scott (1996) built upon the work conducted by Mohr, Backman, Gahan and
Backman (1993) and Uysal, Gahan and Backman (1993) in seeking to further
explore visitor motivation at festivals. The focus of Scott (1996) was “to determine
whether festival motivations were functions of combined or separate effects of
festival type and past visitation” (p. 121). Scott employed a questionnaire based
heavily on the Mohr et al (1993) and Uysal et al (1993) studies, and administered it
to visitors at three separate festivals in Cleveland. Exploratory Factor Analysis (EFA)
of the motivational items identified six factors of which Scott classified three as push
factors, namely, ‘sociability’, ‘family togetherness’, and ‘escape from routine’, and
three as pull factors, namely, ‘nature appreciation’, ‘event excitement’, and
‘curiosity’. The relative importance of these six factors varied with the different
festivals. Scott concluded that motives varied with the festival being attended and
that “the kind of festival is a far better predictor of people’s motivations than past
experience” (p. 127). In examining the differences between first time and repeat
festival visitors, the main difference found was that first time visitors to a festival
were far more likely to be motivated by curiosity than repeat visitors.
Formica and Uysal (1996) compared the motivation and demographic characteristics
of local residents to out-of-region visitors to the 1995 Umbria Jazz Festival. The
motivational section used in this questionnaire was based upon that used in the earlier
reported study of Uysal et al (1993), and the EFA extracted the same factors as in the
previous study. Unlike earlier studies, however, it was found that ‘event novelty’ was
the most important factor; earlier studies had generally identified ‘family

123
togetherness’ or ‘socialisation’ as being the most important factor. It was also found
that there were statistically significant differences with respect to two of the
motivational factors, ‘socialisation’ and ‘entertainment’, between the two
geographical segments. Based on demographic and motivational differences between
the two segments used in this study, it was suggested that “event attendees are not
homogeneous” (p. 181).
Although the primary purpose of the study conducted by Mayfield and Crompton
(1995) was to develop an instrument for identifying community reasons for staging a
festival, some of the report related to patron motivation. It was suggested that a tool
should be developed to measure the benefits sought by visitors to special events
which would then enable better product development by comparing the benefits
being sought by organisers with those being sought by consumers.
The studies that have been discussed here have used questionnaires containing a
similar array of motivational statements and it is not, therefore, surprising that the
EFAs that have been conducted on the responses have extracted very similar factors.
There has been some variation in the order of importance of the various factors that
have been extracted. Examining these studies as a whole would suggest that there are
indeed motivational differences for the various types of special events. In order to
determine whether cultural factors affected the motives for attending special events,
Schneider and Backman (1996) essentially replicated the earlier work of Uysal,
Gahan and Martin (1993) and Backman, Backman, Uysal and Sunshine (1995) but
using a festival based in Jordan as the study site. The results of this Jordanian study
showed very similar motives to the earlier studies in North America suggesting that
motives transcend cultural boundaries.
The other consistent theme with these studies is that they were all ‘destination
studies’; that is, they were restricted to the patrons who were at the special event.
However, it is important to understand the needs of people who do not attend a
particular special event (Mihalik and Ferguson 1994). Being a destination study is in
fact a major limitation as the needs and motives of the wider community are not
taken into account.

124
Understanding why people did not attend a special event is, in many ways, probably
more important than understanding why people actually attended. Ignoring the non-
patron restricts one’s ability to develop the market by broadening the patron profile
(Backman and Crompton 1990; Davies and Prentice 1995). “Examination of the
value profiles of non-visitors can provide an indication of those needs that the
attraction is not perceived to satisfy and may provide useful data for future marketing
strategies” (Pitts and Woodside 1986, p. 21). A number of research studies has
identified that non-attendees are not a homogeneous group, and little work has been
done to identify variables that could be used to segment non-attendees into sub-
groups (Backman and Crompton 1990). The destination based studies are probably
more useful in determining levels of satisfaction with what was on offer as opposed
to understanding the needs and characteristics of those who are more likely to attend
special events. Origin-based studies are essential if there is a desire to generalise the
findings of a study to the wider community.
4.7.2 Origin-Based Studies Relatively few origin based studies have been conducted in relation to special events.
Getz (1991a) reported on two larger scale studies that had been carried out during the
1980s and which provided some information on the profile of event patrons. These
studies were the 'US Pleasure Travel Market Survey' involving 9,000 interviews and
the 'Canadian Tourism Attitude and Motivation Study (CTAMS)' which involved
15,000 interviews. Both of these studies were directed towards tourism in general
and therefore provided only limited information regarding special events, although
CTAMS did provide some insights into this segment of the tourism market. Based on
CTAMS, undertaken in 1985, Getz (1991a) concluded that special events were an
important motivator of travel and helped shape destination images.
Backman et al (1995) investigated the motives and activities of those who went on a
festival or special event trip. This study was based on the 1985 Travel Study
conducted in Canada which involved 9033 in home interviews lasting about 50
minutes with people over 16, who had made at least one pleasure trip in the previous
three years. A sub-sample of these interviews using people who had taken a festival

125
or special event motivated vacation (533 cases) was used as the basis for this study.
Since this study was restricted to vacations, it ignored the large percentage of the
population who attended special events as a daytrip activity. Twelve motives and 18
activities were used to examine the underlying factors behind the trip but there was
no indication as to the origins of the motives and activities that were used in this
study.
Backman et al concluded that "event attendees are not homogeneous and may require
a combination of segmentation strategies" (p. 23). This study supported the earlier
findings of Getz (1991a), Uysal et al. (1993), and Mohr et al. (1993) that there were
no statistical differences between demographic variables and motivation in relation to
special event attendance.
Wicks and Fesenmaier (1995) conducted a study in 1992 in the Midwest of the US
that involved mailing a questionnaire to 2100 randomly selected residents. The key
interest in this study was in relation to respondents who had taken an overnight
vacation trip. They found that 57 per cent of all pleasure trips taken in the previous
year had included a special event. It was also found that 84 per cent of respondents
indicated that the event was the main purpose of their last trip that included a special
event. Individuals who attended festivals were compared with those who did not and
it was found that event attendees were more active travellers. A relatively large
percentage of respondents indicated that overnight accommodation was required for
special events attended. It was also concluded that although special events may not
have been the primary reason for a trip taking place, attendance at such events was
important. This conclusion was supported by Getz and Cheyne (1997) who
conducted two preliminary focus groups in which it was found that the groups as a
whole considered special events to be something desirable whilst engaged in pleasure
travel but they were not a strong reason to initiate the trip itself.
An important finding of the Wicks and Fesenmaier (1995) study was that event
patrons tended to take more daytrips, overnight trips and long trips than did non
event patrons. It was found that although there were some demographic differences
between the event goers and non event patrons, these differences were not great.

126
The main problems with the studies discussed in this section have been that they
have not been event specific and they have tended to focus only on those who have
taken overnight trips. This has meant that the motives discussed have not focussed on
events specifically and the large percentage of consumers who attend special events
as a daytrip activity has been ignored.
4.7.3 Australian Studies In Australia, the main studies for collecting information regarding people's travel
behaviour are the 'Domestic Tourism Monitor' (DTM) and the 'International Visitor
Survey' (IVS). Despite the interest now given to the field of special events by both
state and national tourism organisations, it is surprising to find that little attention is
paid to special events in these questionnaires.
1992 International Visitor Survey
Few questions relating specifically to special events were included in this
questionnaire. There was one that asked respondents who had visited NSW during
their trip about whether they had visited festivals/events, and for those visiting
Melbourne, a festival and event question was combined with a question related to
shopping. No options were provided for those attending festivals and events in
Victoria other than in Melbourne and there were no questions relating to special
events included in the sections allocated to the other states and territories in the
questionnaire. In the 1993 and 1994 IVS, respondents were asked whether they had
attended a local or ethnic festival or fair.
1992 Domestic Tourism Monitor
There were no items in the questionnaire that related specifically to special events,
although there were some relating to sport. However, in the day trip section,
respondents were asked whether they attended a ‘festival, agricultural show, major
sporting event’. Perhaps this was a recognition of the relative importance of the
daytrip market versus the tourist market in the patronage of special events.

127
In response to this question relating to special events in the 1992 DTM, it was found
that 2,462,000 Australian travellers took a day trip in 1992 to attend a special event,
and that in this same year, Australian travellers took 4.2 day trips on average to
attend special events.
Victorian Regional Travel and Tourism Survey
This survey, which was conducted during 1995, is the most comprehensive survey of
travel within Victoria ever undertaken. The survey examined both day trip activities
and overnight travel and considered demographics, travel behaviour and satisfaction.
Data for the study were derived from both in-home surveys and intercept interviews.
In this survey, one of the 19 activities listed in the questionnaire was to ‘attend a
festival, special or sport event’.
The results of this survey could be used to examine the relative importance of special
events in motivating travel relative to other activities and provided demographic
information on the type of people more inclined to take special event related trips,
but unfortunately little more could be obtained. There was no information that could
be extracted that provided other psychographic information on the respondents and,
indeed, it was not possible to identify who of the travel party, actually completed the
questionnaire.
Omnibus Surveys
Unfortunately, the larger general marketing research studies like omnibus surveys
have not specifically isolated various types of special events. This has meant that
more detailed motivational analysis in relation to special events has not been
possible.
4.8 Summary There is clearly a strong and growing need to develop an in-depth understanding of
people’s behaviour in relation to attendance at special events. This is important so
that appropriate events can be developed and promotional campaigns for both
existing and new events can be made more effective. Improved understanding of

128
behaviour in relation to special events will also enhance the opportunity to package
both events and other activities to increase patron enjoyment and to maximise the
economic injection into the host region.
It is only in the last three years that a small number of studies has been conducted to
try to understand event patron motivation. However, the majority of these studies that
have been conducted have been destination-based and have, therefore, only examined
the motives of people who have attended the event; the wider community has been
ignored. The few studies that have been origin based, have not had special event
behaviour as the prime focus and have had to adapt results to fit the event field.
There is clearly the need for an origin-based study that seeks to understand the
motivation and behaviour of people in relation to special events.

129
CHAPTER 5
RESEARCH HYPOTHESES
5.1 Introduction The objective of this chapter is to develop a series of research hypotheses for
testing in the second stage of the primary research conducted in this thesis, as will
be discussed in the following chapters. These research hypotheses were prompted
by the discussion of the literature in the previous chapter. In the Consumer Decision
Process Model that was presented in Figure 1.4, these hypotheses relate to the section
of the model between ‘Special Event Cognition’ and ‘Situation Specific Influences’.
The key elements of the model that was proposed in Figure 1.4, that are being
researched in this study are as follows:
• Special events versus permanent attractions,
• The segmentation performance and predictive strengths of personal
values, psychographics and demographics in both an absolute and a
relative sense,
• Three dimensions of visitation, namely, interest, intention and actual,
• Visitation behaviour considered at both the individual attraction level and
globally.
This makes for a diverse range of hypotheses which often do not fit neatly into a
single section of the proposed model. Therefore, the hypotheses are grouped into
subsections in this chapter rather than being related to specific points in the model, in
order to assist the reader. It will be seen, however, that the key themes behind these
hypotheses are:
• the relationship between special events and other types of attractions,
• the comparative performance of personal values, psychographics and
demographics in segmenting the market,
• the relationship between actual visitation, visit interest and visit intention,
and
• the prediction of special event visitation.

130
The hypotheses are summarised at the end of the chapter.
5.2 Distinctiveness of Special Events It was discussed in Chapter Two that special events have been widely regarded in
the literature as being a specific type of visitor attraction, but does this view have
support in the wider community?
Hypothesis 1:
Consumers distinguish special events from other types of attractions in terms of
their visit interest preferences.
Hypothesis 2:
Consumers distinguish special events from other types of attractions in terms of
their visit intention preferences.
5.3 Stability of the LOV The LOV comprises items that many people would regard as important guiding
principles in their lives. One could ask, however, whether this list is
comprehensive and whether there are other values, perhaps reflecting a less
laudable side of the human make-up, that could also be important guiding
principles?
Hypothesis 3:
There are values other than those included in the LOV that are the most important
guiding principles in people’s lives.
5.4 Measurement of Values Much of the early research on values was conducted by Rokeach who adopted a
ranking system, as part of his RVS, to assess values. This approach has been
criticised, as ranking “yields ipsative (non-independent) data and thus violates the
assumption of independence among values” (Prakash 1984, p. 145). However,
131
Rokeach countered such criticism claiming that the independence of values was
not seriously violated because intercorrelations between values were so small.
According to Munson (1984), inherent problems with the ranking approach led a
number of researchers to suggest that values could be more accurately measured
using a ratings approach that employs a Likert scale (see, for example, Munson
and McIntyre 1978). A major benefit of using a ratings approach is that since
interval data are collected, parametric statistics can be used in the analysis of the
results. Ratings also provides insights as to the intensity with which particular
values are held and it allows for ‘ties’ which a system of forced rankings does not
permit.
A problem with the ratings approach, however, is that it can lead to end-piling
which reduces the overall effectiveness of the scale. Prakash (1984) suggested
that since values were a relative concept as opposed to an absolute concept,
rankings were, indeed, an appropriate measurement device. Reynolds and Jolly
(1980) stated that ratings were less reliable than the rankings approach and that
more research was needed to determine the most appropriate method.
It would seem that there is still no consensus as to the most effective approach to
measuring values and a number of approaches is adopted. These include ranking,
rating, and a combination of both.
Hypothesis 4:
The ratings approach to value measurement provides a different hierarchical
ordering of items in the LOV than is achieved using the ranking approach.
5.5 Value Domains As indicated earlier, the LOV was introduced as an instrument to measure values
in order to overcome some of the shortcomings of the RVS. Although the LOV
included nine individual value items and asked respondents to rank them in terms
of their importance as guiding principles, respondents were “classified into groups
on the basis of only their top-ranked value” (Kamakura and Mazzon 1991, p.

132
208). It has been suggested that using only the top-ranked value to classify
respondents “may capitalise on measurement error” (Kamakura and Novak 1992,
p.121).
This approach ignores the importance of the value system in which single values
are arranged hierarchically based on similarities and differences between
individual values. Values can be represented by higher order value domains which
Schwartz and Bilsky (1987) suggested were more effective and reliable predictors
of behaviour than were single values. Schwartz and Bilsky further suggested that
consumer behaviour would be better explained by reformulating values at a higher
level of abstraction, which would not only improve the reliability and
interpretability of the results, but would be consistent with Rokeach’s original
theoretical concept. Despite this, however, much of the segmentation work that
has been done using the LOV has classified individuals based on their highest
individual value and has not considered the value system (Kamakura and Novak
1992).
Prakash (1984) suggested that more meaningful results were obtained in relating
behaviour to value domains rather than individual values. This was supported by
Kamakura and Novak (1992) who compared the segments and the coefficients of
determination obtained using the value system versus the top-rated value, finding
that the value systems were superior.
Hypothesis 5:
The values that constitute the LOV are underpinned by a small number of value
domains.
Hypothesis 6a:
Value domains are more closely related to consumer attraction visit interest
behaviour than are individual values.
Hypothesis 6b:

133
Value domains are more closely related to consumer special event visit interest
behaviour than are individual values.
Hypothesis 6c:
Value domains are more closely related to consumer permanent attraction visit
interest behaviour than are individual values.
Hypothesis 7a:
Value domains are more closely related to consumer attraction visit intention
behaviour than are individual values.
Hypothesis 7b:
Value domains are more closely related to consumer special event visit intention
behaviour than are individual values.
Hypothesis 7c:
Value domains are more closely related to consumer permanent attraction visit
intention behaviour than are individual values.
5.6 Internal versus External Locus of Control There are similarities between VALS and the LOV in that both techniques have
identified inner and outer distinctions (Gunter and Furnham 1992). In the LOV,
this distinction was between internal and external locus of control with external
values comprising ‘sense of belonging’, ‘being well-respected’, and ‘security’,
with all other values being classed as internal. “Research has supported the
theoretical notion that the LOV items may be better represented at a more abstract
level by value domains that reflect either an internal or external locus of control”
(Madrigal and Kahle 1994, p. 23).
Studies by Homer and Kahle (1983) and Madrigal and Kahle (1994) supported the
proposition that the underlying dimensions behind the LOV represented internal
and external locus of control, although some of the factors extracted in the EFAs
conducted in each study varied slightly. Homer and Kahle (1988) suggested that

134
situational factors may have caused different dimensions to be important in
different contexts.
Individuals motivated by internal values tend to be more self-motivated and
believe that they can influence or control outcomes, whereas ‘externals’ believe
that success and failure is beyond their control.
In the study conducted by Madrigal and Kahle (1994), an important internal factor
that was identified was termed ‘hedonic’ and comprised ‘excitement’ and ‘fun and
enjoyment in life’, items that would appear to have some connection with special
events.
Hypothesis 8:
The values that constitute the LOV reflect an internal or external orientation.
Hypothesis 9:
Consumers with a high special event visit intention place greater emphasis on
external values than consumers with a low special event visit intention.
Hypothesis 10:
Consumers with a high special event visit intention place a higher emphasis on
hedonic values than consumers with a low special event visit intention.
5.7 Relationship Between Values and Demographics One of the reasons for the increasing use of values in market segmentation and in
the explanation of consumer behaviour has been the concern that demographics
are now less able to fulfil these roles due to structural changes in society,
particularly in relation to the general improvement of educational standards. It is
important, therefore, to examine whether there are relationships between values
and demographics, especially if one technique is to be used to explain segments
identified using the other technique. There is also the issue as to whether values
are impacted on by demographics or the other way around.

135
Although a number of studies has been conducted in this area, the results are not
conclusive. Timmer and Kahle (reported in Keng and Yang 1993) found
correlations between values and the demographic variables age, sex, education,
occupation, income and religion, suggesting that these variables influenced, and
were influenced by values. A number of other studies has supported some of these
findings, including education (Kramer 1984), socioeconomic class (Ness and Stith
1984) and life status (Crosby, Gill and Lee 1984).
Keng and Yang (1993) found that sex, religion, income and education were
related to values but were unable to identify any correlation with age. However, it
was suggested that the lack of relationship with age was likely due to the fact that
age was restricted to the range of 15-39 in the sample used in the study.
Hypothesis 11a:
There is a positive relationship between age and the items in the LOV.
Hypothesis 11b:
There is a positive relationship between education and the items in the LOV.
Hypothesis 11c:
There is a positive relationship between family status and the items in the LOV.
Hypothesis 11d:
There is a positive relationship between income and the items in the LOV.
Hypothesis 11e:
There is a positive relationship between gender and the items in the LOV.
5.8 Generic Versus Specific Behaviour According to Munson (1984), little research had been able to demonstrate
relationships between values and specific (brand) versus more generic consumer
behaviour. This is reinforced by the fact that people sharing a common value

136
system may adopt different final behaviour and also people sharing different value
systems may adopt identical final behaviour.
The LOV was based upon terminal values which are recognised as being more
abstract than instrumental values (Madrigal and Kahle 1994). As a consequence
of this, the LOV is likely to be more effective at explaining behaviour at a more
generic, or abstract level, than it is at the more concrete level involving specific
brand choice. Munson (1984) suggested that other factors, such as attitudes
towards specific products, intervene in the process to influence brand choice. It
should be remembered that “since values are highly abstract, this generalisation
implies that predicting very specific behaviours will not be simple” (Kahle 1984,
p. 85).
Hypothesis 12a:
The items in the LOV are better predictors of generic behaviour (visit interest)
than they are of more concrete behaviour (visit intention).
Hypothesis 12b:
AIOs are better predictors of generic behaviour (visit interest) than they are of
more concrete behaviour (visit intention).
Hypothesis 12c:
Demographics are better predictors of generic behaviour (visit interest) than they
are of more concrete behaviour (visit intention).
Hypothesis 13a:
The items in the LOV are better predictors of behaviour in relation to tourism
attractions overall, including special events, than they are of behaviour in relation
to special events alone.
Hypothesis 13b:

137
AIOs are better predictors of behaviour in relation to tourism attractions overall,
including special events, than they are of behaviour in relation to special events
alone.
Hypothesis 13c:
Demographics are better predictors of behaviour in relation to tourism attractions
overall, including special events, than they are of behaviour in relation to special
events alone.
5.9 The Different Dimensions of Visitation Much research has identified a relationship between attitudes and behaviour
(Assael 1992) but the success of predicting behaviour based on attitudes has been
quite poor (Solomon 1992). Attitudes are regarded as having three components:
cognitive, affective and conative (Engel, Blackwell and Miniard 1995; Zikmund
1991). Engel, Blackwell and Miniard (1995) proposed a contemporary view of the
relationships between the components of attitude and behaviour which is
presented diagrammatically in Figure 5.1.
Figure 5.1 Contemporary View of Attitude.

138
Beliefs
1
Feelings
2
Attitude
3
Intention
4
Behaviour
5
Source: Figure 11.2 in Engel, Blackwell and Miniard (1995).
Using this contemporary view, “attitude is viewed as being distinct from its
components, with each component being related to attitude” (Engel, Blackwell
and Miniard 1995, p. 364). This contemporary view of attitude in which the
components of attitude are presented in a sequential fashion, is used as the basis
for this thesis. The cognitive (beliefs) and affective (feelings) components of
attitude are equated to interest which is taken as the prelude to the conative
(intention) component which itself precedes overt behaviour, as presented in
Figure 5.2. Assael (1992) reported on a range of studies that was conducted which
supported the view that intentions could be used to predict overt behaviour. Figure 5.2 Model of Behaviour.
Consumer Interest
1Consumer Intention
2Overt
Behaviour
3
Much of the research that has been done in this area has treated interest and
intention as independent variables and overt behaviour as the dependent variable.

139
However, it is also important to recognise that there is effectively a feedback
linkage whereby behaviour influences future interest and intention; that is,
behaviour is the independent variable in this scenario.
Although the linkage between intention and overt behaviour is seen as stronger
than between interest and overt behaviour, there are many factors that could
“interfere with the performance of the actual behaviour, even if the consumer
sincerely intends to carry it out” (Solomon 1992, p. 155). As a result, past
behaviour is often taken as a better indicator of future behaviour than either
interest or intention.
Hypothesis 14:
There is a positive relationship between visit interest and visit intention with
respect to attractions.
Hypothesis 15a:
There is a positive relationship between past visitation and overall attraction visit
interest.
Hypothesis 15b:
There is a positive relationship between past visitation and overall attraction visit
intention.
Hypothesis 16a:
Past visitation provides a stronger indication of special event visit interest than it
does of permanent attraction visit interest.
Hypothesis 16b:
Past visitation provides a stronger indication of special event visit intention than it
does of permanent attraction visit intention.

140
5.10 Explaining Behaviour in Relation to Special Events Since this study was not longitudinal in nature, future visit behaviour was not
measured. Therefore, it has been assumed that visit intention is an indicator of
overt behaviour as intention is the last stage before overt behaviour in the
consumer purchase process. It is recognised, however, that intention is a far from
perfect indicator of behaviour (Mowen 1993).
Chapter Four provided an overview of the literature that has supported values as
both a segmentation tool and as a means of explaining consumer behaviour. This
overview also indicated, however, that there has not been unanimous support for
values in either of these roles.
Muller (1991) and Pitts and Woodside (1986), demonstrated that values can be
used to differentiate between tourists segmented on the basis of benefit criteria.
Madrigal and Kahle (1994) used values as the independent variable to
demonstrate that segments of tourists with similar values systems differed in their
importance ratings of activities, and Pitts and Woodside (1986) suggested that
“consumers with similar values will exhibit similar choice criteria” (p. 20) and
behaviour. These results provided more information upon which marketers could
base their strategies.
Pitts and Woodside (1986) were able to support their hypothesis that groups of
individuals with similar leisure choice criteria may be identified and differentiated
on the basis of the personal values of segment members. They also confirmed that
leisure behaviour may be differentiated on the basis of personal values.
It should be noted that most of the studies that have been conducted exploring
values in the leisure and travel fields, have been destination-based and as a
consequence, have not been able to consider non-users. The study by Pitts and
Woodside (1986) was a notable exception and it was suggested that values were
“useful in describing those individuals who visit a specific travel attraction versus
those who do not visit the attraction” (p. 24). Comparing the value profiles of
visitors to non-visitors helps identify the motives and needs that the experience

141
satisfies. Examination of the value profiles of non-visitors will help establish the
needs that are not being satisfied by the experience.
Once marketers understand the particular values that are most closely associated
with special event patronage, they can then modify, as necessary, particular events
to more fully exploit this association.
Hypothesis 17:
Segments comprising people with similar value systems differ in their behaviour
in relation to special events.
Hypothesis 18:
Groups of individuals segmented on their intention to patronise similar types of
special events may be differentiated on the basis of the personal values of segment
members.
Kahle, Beatty and Homer (1986) compared the predictive performance of the
LOV with VALS and concluded that the LOV was superior. VALS is a
proprietary instrument and, as indicated earlier, VALS is basically a battery of
lifestyle questions.
However, Novak and MacEvoy (1990) queried the findings of Kahle, Beatty and
Homer (1986) suggesting that they had overstated the performance of the LOV
because of the demographic variables that were included with it. The replication
study conducted by Novak and MacEvoy found that VALS was as effective in
predicting behaviour as was a combination of the LOV and demographics. They
found that the LOV alone was less able to predict behaviour than demographics
and substantially less able than VALS.
Madrigal and Kahle (1994) found that personal value systems were better
predictors of behaviour than were demographics, although demographics added
value to the understanding of the segments identified.

142
This discussion indicates that there has been no conclusive result to establish the
relative ability of the LOV to predict behaviour in relation to other techniques
such as demographics and psychographics.
Hypothesis 19:
The items in the LOV are better able to predict special event visit intention than
are AIOs.
Hypothesis 20:
The items in the LOV are better able to predict special event visit intention than
are the demographic variables.
Hypothesis 21:
A combination of the items in the LOV and the demographic variables is better
able to predict special event visit intention than are AIOs.
Hypothesis 22a:
The items in the LOV are better able to predict special event visit intention than is
past visitation.
Hypothesis 22b:
AIOs are better able to predict special event visit intention than is past visitation.
Hypothesis 22c:
Demographic variables are better able to predict special event visit intention than
is past visitation.
5.11 One-time Versus Repeat Visitors to Special Events If a particular recurring special event is to be successful over time and achieve
increased attendance, it is important that there be a high level of repeat visitation
(Mohr et al 1993). Despite this, little research has been conducted on the issue of
repeat visitation at special events (Mohr et al 1993). The study conducted by
Mohr et al (1993), which was based on a particular special event, found that there

143
were differences in the motives of first-time versus repeat visitors but no
demographic differences were found between the two groups. Scott (1996) did not
compare demographic characteristics of first-time versus repeat visitors to the
three special events included in the study but did find that there were differences
in motives between the two groups.
Hypothesis 23:
There is a difference with respect to the items in the LOV between one-time and
repeat visitors to special events.
Hypothesis 24:
There is a difference with respect to AIOs between one-time and repeat visitors to
special events.
Hypothesis 25a:
There is a difference with respect to age between one-time and repeat visitors to
special events.
Hypothesis 25b:
There is a difference with respect to gender between one-time and repeat visitors
to special events.
Hypothesis 25c:
There is a difference with respect to education between one-time and repeat
visitors to special events.
Hypothesis 25d:
There is a difference with respect to family status between one-time and repeat
visitors to special events.
Hypothesis 25e:
There is a difference with respect to income between one-time and repeat visitors
to special events.

144
5.12 Comparison of High Special Event Visit Intention and Low Special Event Visit Intention Some people have a higher special event visit intention than others and if it is
possible to identify differences between these two groups, more effective
promotional campaigns can be developed in order to influence the conversion
from intention to actual behaviour.
Hypothesis 26:
There is a difference with respect to value domain profile between those with high
special event visit intention and those with low special event visit intention.
Hypothesis 27:
There is a difference with respect to psychographic profile between those with
high special event visit intention and those with low special event visit intention.
Hypothesis 28a:
There is a difference with respect to age between those with high special event
visit intention and those with low special event visit intention.
Hypothesis 28b:
There is a difference with respect to gender between those with high special event
visit intention and those with low special event visit intention.
Hypothesis 28c:
There is a difference with respect to education between those with high special
event visit intention and those with low special event visit intention.
Hypothesis 28d:
There is a difference with respect to family status between those with high special
event visit intention and those with low special event visit intention.

145
Hypothesis 28e:
There is a difference with respect to income between those with high special event
visit intention and those with low special event visit intention.
5.13 Clusters The comments at the beginning of the last section apply equally to various
approaches to clustering.
Hypothesis 29:
Segments comprising people with similar psychographic systems differ in their
visit intention behaviour in relation to special events.
Hypothesis 30:
Cluster analysis based on segments comprising people with similar value systems
is a better basis for predicting visit intention behaviour in relation to special
events than is cluster analysis based on segments comprising people with similar
psychographic systems.
Hypothesis 31:
Cluster analysis based on segments comprising people with similar value systems
is a better basis for predicting visit intention behaviour in relation to special
events than is cluster analysis based on segments comprising people based on
their top ranked value.
5.14 Summary of Research Hypotheses Hypothesis 1:
Consumers distinguish special events from other types of attractions in terms of
their visit interest preferences.
Hypothesis 2:
Consumers distinguish special events from other types of attractions in terms of
their visit intention preferences.

146
Hypothesis 3:
There are values other than those included in the LOV that are the most important
guiding principles in people’s lives.
Hypothesis 4:
The ratings approach to value measurement provides a different hierarchical
ordering of items in the LOV than is achieved using the ranking approach.
Hypothesis 5:
The values that constitute the LOV underpinned by a small number of value
domains.
Hypothesis 6a:
Value domains are more closely related to consumer attraction visit interest
behaviour than are individual values.
Hypothesis 6b:
Value domains are more closely related to consumer special event visit interest
behaviour than are individual values.
Hypothesis 6c:
Value domains are more closely related to consumer permanent attraction visit
interest behaviour than are individual values.
Hypothesis 7a:
Value domains are more closely related to consumer attraction visit intention
behaviour than are individual values.
Hypothesis 7b:

147
Value domains are more closely related to consumer special event visit intention
behaviour than are individual values.
Hypothesis 7c:
Value domains are more closely related to consumer permanent attraction visit
intention behaviour than are individual values.
Hypothesis 8:
The values that constitute the LOV reflect an internal or external orientation.
Hypothesis 9:
Consumers with a high special event visit intention place greater emphasis on
external values than consumers with a low special event visit intention.
Hypothesis 10:
Consumers with a high special event visit intention place a higher emphasis on
hedonic values than consumers with a low special event visit intention.
Hypothesis 11a:
There is a positive relationship between age and the items in the LOV.
Hypothesis 11b:
There is a positive relationship between education and the items in the LOV.
Hypothesis 11c:
There is a positive relationship between family status and the items in the LOV.
Hypothesis 11d:
There is a positive relationship between income and the items in the LOV.
Hypothesis 11e:
There is a positive relationship between gender and the items in the LOV.

148
Hypothesis 12a:
The items in the LOV are better predictors of generic behaviour (visit interest)
than they are of more concrete behaviour (visit intention).
Hypothesis 12b:
AIOs are better predictors of generic behaviour (visit interest) than they are of
more concrete behaviour (visit intention).
Hypothesis 12c:
Demographics are better predictors of generic behaviour (visit interest) than they
are of more concrete behaviour (visit intention).
Hypothesis 13a:
The items in the LOV are better predictors of behaviour in relation to tourism
attractions overall, including special events, than they are of behaviour in relation
to special events alone.
Hypothesis 13b:
AIOs are better predictors of behaviour in relation to tourism attractions overall,
including special events, than they are of behaviour in relation to special events
alone.
Hypothesis 13c:
Demographics are better predictors of behaviour in relation to tourism attractions
overall, including special events, than they are of behaviour in relation to special
events alone.
Hypothesis 14:

149
There is a positive relationship between visit interest and visit intention with
respect to attractions.
Hypothesis 15a:
There is a positive relationship between past visitation and overall attraction visit
interest.
Hypothesis 15b:
There is a positive relationship between past visitation and overall attraction visit
intention.
Hypothesis 16a:
Past visitation provides a stronger indication of special event visit interest than it
does of permanent attraction visit interest.
Hypothesis 16b:
Past visitation provides a stronger indication of special event visit intention than it
does of permanent attraction visit intention.
Hypothesis 17:
Segments comprising people with similar value systems differ in their behaviour
in relation to special events.
Hypothesis 18:
Groups of individuals segmented on their intention to patronise similar types of
special events may be differentiated on the basis of the personal values of segment
members.
Hypothesis 19:
The items in the LOV are better able to predict special event visit intention than
are AIOs.

150
Hypothesis 20:
The items in the LOV are better able to predict special event visit intention than
are the demographic variables.
Hypothesis 21:
A combination of the items in the LOV and the demographic variables is better
able to predict special event visit intention than are AIOs.
Hypothesis 22a:
The items in the LOV are better able to predict special event visit intention than is
past visitation.
Hypothesis 22b:
AIOs are better able to predict special event visit intention than is past visitation.
Hypothesis 22c:
Demographic variables are better able to predict special event visit intention than
is past visitation.
Hypothesis 23:
There is a difference with respect to the items in the LOV between one-time and
repeat visitors to special events.
Hypothesis 24:
There is a difference with respect to AIOs between one-time and repeat visitors to
special events.
Hypothesis 25a:
There is a difference with respect to age between one-time and repeat visitors to
special events.
Hypothesis 25b:

151
There is a difference with respect to gender between one-time and repeat visitors
to special events.
Hypothesis 25c:
There is a difference with respect to education between one-time and repeat
visitors to special events.
Hypothesis 25d:
There is a difference with respect to family status between one-time and repeat
visitors to special events.
Hypothesis 25e:
There is a difference with respect to income between one-time and repeat visitors
to special events.
Hypothesis 26:
There is a difference with respect to value domain profile between those with high
special event visit intention and those with low special event visit intention.
Hypothesis 27:
There is a difference with respect to psychographic profile between those with
high special event visit intention and those with low special event visit intention.
Hypothesis 28a:
There is a difference with respect to age between those with high special event
visit intention and those with low special event visit intention.
Hypothesis 28b:
There is a difference with respect to gender between those with high special event
visit intention and those with low special event visit intention.
Hypothesis 28c:

152
There is a difference with respect to education between those with high special
event visit intention and those with low special event visit intention.
Hypothesis 28d:
There is a difference with respect to family status between those with high special
event visit intention and those with low special event visit intention.
Hypothesis 28e:
There is a difference with respect to income between those with high special event
visit intention and those with low special event visit intention.
Hypothesis 29:
Segments comprising people with similar psychographic systems differ in their
visit intention behaviour in relation to special events.
Hypothesis 30:
Cluster analysis based on segments comprising people with similar value systems
is a better basis for predicting visit intention behaviour in relation to special
events than is cluster analysis based on segments comprising people with similar
psychographic systems.
Hypothesis 31:
Cluster analysis based on segments comprising people with similar value systems
is a better basis for predicting visit intention behaviour in relation to special
events than is cluster analysis based on segments comprising people based on
their top ranked value.

153
CHAPTER 6
METHODOLOGY
6.1 Introduction An earlier chapter identified the importance of developing a detailed
understanding of consumer behaviour in relation to special events if such events
are to remain viable in the longer term. It was proposed that the List of Values
(LOV) would be adopted to develop such an understanding, and the performance
of the LOV would be compared to that of demographics and psychographics,
measured using AIOs. This chapter contains the background to the development, purification and
application of a questionnaire designed to collect from consumers, information
relating to their behaviour in relation to attractions in general, and special events
in particular. Personal information that could be used to develop consumer
profiles is also collected.
Methodological rigour was listed in Chapter One as an important objective of this
thesis and there was some discussion of the useful role that convergent validation
can play in achieving this objective. It will be shown in this chapter that multiple
approaches to the collection and analysis of data were used wherever possible in
order to gain a more detailed understanding of consumer behaviour and of some
of the techniques used to assess such behaviour. In particular, this involved:
• asking respondents about visitation to a wide range of named
attractions including special events,
• three dimensions of visitation being measured, and
• three approaches to segmentation being adopted.
The same approach was adopted in Chapter Three where a number of techniques
was employed to develop an appreciation of the attributes that consumers
considered important in their understanding of special events.

154
Some discussion of the survey methodology was presented in Chapter Three in
relation to the mail back questionnaire on special event definitions. More detailed
information on the methodology is presented in this chapter.
6.2 Research Methodology Since this study had some common elements with a study being conducted by a
colleague, it was decided to link the respective questionnaires in order to apply for
a research grant to cover the administration of the final questionnaire. This other
study was exploring the use of Holland’s Theory of Personality in order to
understand consumer behaviour in relation to tourist attractions, with a particular
emphasis on industrial tourism attractions.
It was decided to administer the questionnaire in the face-to-face mode since the
combined questionnaire was quite large and had sections requiring the interaction
of an interviewer. The only interactive section of the questionnaire that was part
of this study was the one relating to behaviour at a range of named attractions.
This section was facilitated by the use of show cards. It was also considered that a
face-to-face in-home interview would lead to a higher questionnaire response rate.
6.3 Questionnaire Development The questionnaire was divided into four sections, each of which is discussed in
the following pages.
6.3.1 Attractions: Permanent and Special Events Since the questionnaire was to be administered to Melbourne residents, it was
decided that the attractions chosen for the questionnaire should be clearly
recognisable and easily accessible to members of this market. For this reason, the
majority of the attractions listed were Victorian based, with many being in
Melbourne.
The special events that were included in the questionnaire came from the
following categories:
• Events that Tourism Victoria classes as the state’s Hallmark Events,

155
• Other large Melbourne based events,
• Large international special events,
• Generic un-named special events.
A complete listing of these events is presented in Table 6.1.
Table 6.1 List of Special Events Included in the Questionnaire
Victoria’s Hallmark Events Melbourne International Comedy Festival Melbourne International Festival of the Arts Melbourne Food and Wine Festival Australian Formula One Grand Prix Australian Motorcycle Grand Prix Ford Australian Open Tennis Australian Football League Grand Final Bells Beach Surf Classic Spring Racing Carnival Other Large Melbourne Based Special Events Melbourne Moomba Festival Royal Agricultural Society of Victoria Show (Melbourne Show) Australian International Air Show International Special Event A Commonwealth or Olympic Games Generic Un-named Special Events A Major Sporting Event held in Victoria A Regional Community Festival or Fair in Victoria A Major Cultural Event held in Victoria
The last category was included in the questionnaire in order to enable respondents
to indicate other types of special events which they had attended but which were
not specifically listed on the main show card. Space was left on the answer sheet
for the interviewer to include the names of any such events. The permanent attractions that were included in the questionnaire came from the
following categories:
• Victoria’s leading tourist attractions according to Tourism Victoria,
• Attractions and tours that could be classed as industrial tourism.
A listing of these permanent attractions is presented in Table 6.2.
Table 6.2 Permanent Attractions Included in the Questionnaire
Leading Tourism Attractions According to Tourism Victoria

156
Sovereign Hill, Ballarat Penguin Parade, Phillip Island Puffing Billy, Belgrave Rialto Towers Observation Deck, Melbourne Industrial Tourism Attractions and Tours De Bortoli Winery, Dixons Creek National Gallery of Victoria, Melbourne Bendigo Pottery, Bendigo Powerworks (Formerly tour of SEC power plant), Morwell ‘Pick-your-own’ Fruit and Berry Farm, Drouin West Bureau of Meteorology, Melbourne Scienceworks Museum, Melbourne Our World of Money, Craigieburn (Australian Mint) Victorian Tapestry Workshop, South Melbourne Tour of Parliament House, Melbourne Tour of the Australian Stock Exchange, Melbourne Backstage tour of the Victorian Arts Centre, Melbourne Behind the scenes tour of the Melbourne Cricket Ground (MCG) Tour of Western Wastewater Treatment Plant, Werribee
It should be noted that the second category of permanent attractions contained
items that were more closely related to the other research project that was referred
to earlier.
As discussed in Chapter Four, much of the research that has been conducted into
consumer behaviour in relation to attractions in general and special events in
particular, has been destination-based, which has meant that the focus has been on
actual visitation to a specific attraction. It appears that little has been done to
assess the importance of the earlier stages of the consumer purchase process with
respect to a range of attractions.
The model that was developed to underpin this thesis (Figure 1.4) has consumer
visit interest and consumer visit intention as important steps prior to actual
consumer visitation. It is proposed that an understanding of both visit interest and
visit intention is essential in order to be able to explain and predict actual
visitation. Actual visitation also has an influence on subsequent visit interest and
visit intention and this link needs to be understood in order to explain repeat
visitation and visitation at similar attractions. It was, therefore, fundamental to
this study that visitation be explored on three dimensions, namely, past visitation,
visit interest, and visit intention.

157
Respondents were asked the following three questions in relation to each of the
attractions: have you ever visited the attraction?; how interested are you in
visiting the attraction in the future?; and how likely are you to visit the attraction
in the next twelve months (or the next time the event occurs)? Responses to past
visitation were recorded using a dichotomous yes-no scale, whilst responses to the
visit interest and visit intention questions were recorded on seven-point Likert
scales.
6.3.2 Values The LOV was chosen as the basis for assessing values, and respondents were
asked to use a seven-point Likert scale to rate the importance of particular values
as guiding principles in their lives. Rokeach (1979) suggested that many
respondents rate most values as important or very important, which, if true, would
lead to a concentration of responses at one end of the scale. If this were to occur,
the discriminating power of the values would be reduced in the sense that it would
be difficult to identify the differential contribution of any particular value to the
focal tourist decisions. To try to ameliorate this effect, and to assess the stability,
coherence and comprehensiveness of the LOV elements, a number of additional
values was added to the nine values included in the LOV. A number of the items
that were added were chosen to encourage respondents to make full use of the
entire scale (for example, values such as ‘dominating others’ and ‘materialism’
were expected to result in usage of the lower divisions of the scale). The
additional items were randomly interspersed with the nine original LOV items.
The items included in the LOV and the items that were added to it are presented
in Table 6.3.

158
Table 6.3 Values included in the Questionnaire
Original List of Values (LOV) Self fulfilment Security Accomplishment Belonging Warm relationships with others Being well respected Excitement Self respect Fun and enjoyment in life Items that were added to the LOV Ambition Self reliance Individuality Wealth Popularity Spirituality Status Solitude Materialism Competing with others Dominating others
Respondents were also asked to rank the three values that they regarded as the
most important guiding principles in their lives. This step also helped to overcome
the problem of position bias in that it forced respondents to commit to the values
that they deemed most important in a relative sense. This also allowed for later
comparison of measuring values using ratings and rankings.
6.3.3 AIOs Activities
Despite an extensive search, no comprehensive list of leisure activities in an
Australian setting was found. Tinsley and Eldredge (1995) compiled a list of 82
leisure activities in the United States which they classed as a “representative
sample” (p. 124), although there was no indication in the article as to how this list
was actually compiled. The list appears to be based upon earlier work by Tinsley
and Johnson (1984), and given that Tinsley has been researching and publishing
on leisure activities for over 20 years, the list would be regarded as having
credibility. Leisure can be broken into two components, “At home at leisure”
(Lynch and Veal 1996, p. 195), and leisure away from the home. Given that the
topic of this thesis is special events which is an away from home activity, the

159
interest was in assessing which away from home activities could be seen as
complements to, or replacements for, special events. The ‘at home leisure
activities’ were therefore deleted from the 82 activities in the Tinsley and
Eldredge list.
In late 1996, Tourism Victoria released the Victorian Regional Travel and
Tourism Survey 1995 (RTS) (Tourism Victoria 1996) which included a list of
leisure activities as a core element of the study. Since the RTS used a very large
number of questionnaires to examine tourism behaviour, it was decided to
incorporate the leisure activities used in the RTS so that it would be possible, if
needed at a later stage, to make comparisons between the studies. Providing such
a ‘bridge’ between the studies enhances the likelihood of being able to generalise
some of the findings of this study. There was, however, an overlap between the
RTS list and the Tinsley and Eldredge list.
In order to remove the ‘at home leisure activities’ and the activities not relevant to
Australia from the list taken from Tinsley and Eldredge, the master list was edited
and this edit was reviewed by three independent judges. There were 21 activities
that all three judges deleted and 19 activities that two judges deleted. As a
consequence, 40 activities were deleted at this stage.
Activities listed in Tinsley and Eldredge that were also listed in the RTS were
deleted from the Tinsley and Eldredge list. This resulted in a further 20 deletions.
The list of leisure activities that was used in the pre-test phase of the questionnaire
is presented in Appendix C.
Interests
An extensive literature review was conducted to identify key dimensions that had
been used in relation to tourism and leisure behaviour, especially as it related to
special events. The following list contains the key dimensions so identified:
excitement/thrills, novelty, socialisation, family togetherness, stimulus seeking,
meeting new people, learning and discovery, escape from routine, nostalgia,

160
physical exercise, creativity, relaxation, status, self actualisation, sense of
separation, fantasy, peer pressure, regression, intellectual, stimulus avoidance,
competence/mastery, education, and ego.
Items were derived from the literature for each of the dimensions identified,
resulting in 61 statements that were used in the pre-test questionnaire. These
statements are listed in Appendix C.
Opinions
The Roy Morgan Research Centre (RMRC) has been conducting a value based
segmentation study for Tourism Victoria for a number of years and this
segmentation is based upon consumer responses to some key opinions. Since
value segmentation is an important component of this research project, it was
decided to incorporate the opinions used in the segmentation work by RMRC.
Four other opinion statements were added to the five used in the RMRC work, all
of which are listed in Appendix C.
Pre-testing of AIOs
A questionnaire comprising the statements discussed in the previous sections was
administered to a group of 62 students and academics. The data were entered into
SPSS and analysed using Exploratory Factor Analysis (EFA) with a view to
identifying key underlying factors that could be used to reduce the size of the
questionnaire. The EFA extracted 11 factors with eigenvalues greater than one
which explained 100 percent of the variance. The factors showed high
reliabilities, with most having Cronbach alphas in excess of 0.7.
In order to reduce the total number of statements in the AIO section from 111 to a
more manageable level, the following steps were taken:
Activities
The list was restricted to the 25 items that were contained in the RTM, which
involved the deletion of 16 other activity items. Of the activity items deleted, half

161
had mean values that were ranked towards the bottom of the list of means
arranged in descending order.
Interests
The two highest loading interest items were selected from each of the 11 factors
that were extracted. Added to this list, were two interest items that rated highly in
terms of mean value and were strongly endorsed in the literature as being
important elements.
Opinions
Since there were only nine opinion statements in the preliminary questionnaire, it
was decided that deletion of any would result in too little attention being given to
opinions.
This resulted in a list of 58 AIO statements (25 activities, 24 interests, and nine
opinions). An EFA of the pre-test results was run restricting the analysis to the 58
statements referred to above. The result of this EFA was very similar to the EFA
conducted earlier, with both extracting 11 factors that explained comparable
variances.
6.3.4 Demographics Questions relating to age, gender, education, family status and income were
included in this section of the questionnaire. Categories used in these areas were
similar to those used in the RTS study to facilitate any comparison of results of
the two studies that may take place at a later stage.
6.4 Pilot Testing the Questionnaire A group of 50 undergraduate tourism students was asked to self-complete the
questionnaire and return it to their tutor. Thirty-three questionnaires were returned
representing a 66% response rate.
The data from the pilot questionnaire were entered into SPSS and analysed. Initial
screening of the returned questionnaires did not identify any major problems

162
although there did appear to be slight confusion surrounding the wording used in a
couple of the questions. The wording in these suspect questions was modified for
the final questionnaire. The section that caused the most problem in terms of
incorrect responses was the one that asked respondents to list the three values that
were most important as guiding principles in their life. Of the respondents who
did not answer this section correctly, some ranked all 20 values whilst others rated
each of the values using a three-point scale. Given that the final questionnaire was
to be administered in face-to-face mode by a trained interviewer, it was
considered that this difficulty would be overcome with the involvement of the
interviewer.
Exploratory Factor Analysis (EFA) that was conducted on the responses to the
AIO section extracted 17 factors with eigenvalues in excess of one, which
explained 89% of the total variance. The factors extracted had high face validity
and quite high reliability, based on Cronbach alphas. These factors were quite
similar to those that were extracted during the questionnaire development phase.
An EFA of the LOV extracted factors that were consistent with the factors
extracted in the work of Madrigal and Kahle (1994).
6.5 Questionnaire Administration The bases for the selection of the sampling frame and the selection of the survey
sample itself were discussed in Chapter Three. It has also been mentioned that
receipt of research funding enabled the commissioning of a marketing research
company to actually administer the questionnaire. However, it should be
reiterated that the development of the questionnaire, the selection of the sampling
frame, and the briefing of interviewers, were all conducted by this researcher.
A copy of the final questionnaire is presented in Appendix D.

163
CHAPTER 7
RESULTS AND DISCUSSION
7.1 Introduction This chapter reports and discusses the responses to the in-home questionnaire that
was used to gather data about consumer behaviour in relation to attractions in
general, and special events in particular. The analysis that is reported in this
chapter enables testing of the hypotheses that were developed in Chapter Five.
Since three segmentation techniques were used in relation to 34 named visitor
attractions over three dimensions of visitation, the analysis is, by necessity,
somewhat repetitive. However, a systematic comparative assessment such as this
has not been conducted previously in relation to special events and the findings
help overcome a gap in the literature.
Figure 7.1 provides a diagrammatic representation of the core analysis that was
conducted in relation to visitor attractions. This figure provides information on the
number of elements in each category, the scale properties, and the type of analysis
that was conducted in each case. It can be seen that the LOV, AIOs and
demographics were examined over three levels of visitation for a range of
permanent attractions and special events.

164
Figure 7.1 Relationships between LOV, AIOs and Demographics, and the set of named attractions.
Attractions (34)
-Permanent Attractions (18) -Special Events (16)
-Plus Global (1)
Actual Visitation (Dichotomous)
Visit Intention (Interval)
Visit Interest (Interval)
List of Values (9)
(Interval)
AIOs (58) (Interval)
List of Values (9)
(Interval)
AIOs (58) (Interval)
Demographics (5)
Age (Ordinal) Gender (Nominal)
Family status (Nominal) Education (Ordinal)
Income (Ordinal)
Demographics (5)
Age (Ordinal) Gender (Nominal)
Family status (Nominal) Education (Ordinal)
Income (Ordinal)
Demographics (5)
Age (Ordinal) Gender (Nominal)
Family status (Nominal) Education (Ordinal)
Income (Ordinal)
List of Values (9)
(Interval)
AIOs (58) (Interval)
35*9 Relationships
35*9 Relationships
35*9 Relationships
35*9 Relationships
35*5 Relationships
35*5 Relationships
35*5 Relationships
35*58 Relationships
35*58 Relationships
Chi-Square Chi-Square Chi-Square Chi-Square Chi-Square Correlation Correlation Correlation Correlation

165
The key objectives of this study were to examine the absolute and relative abilities
of the LOV, psychographics, and demographics to explain consumer behaviour in
relation to attractions in general, and special events in particular. Consumer
behaviour was measured as actual visitation, visit interest, and visit intention, in
relation to each of the named attractions. In most of the analysis, therefore, the
LOV, psychographics and demographics were treated as the independent
variables with the components of visit behaviour being the dependent variables.
Since most variables in this study were measured using interval scales,
relationships between variables could be assessed using Pearson Correlation
Coefficients. For the variables that were measured using non-interval scales,
namely, demographics and actual visitation, relationships between variables were
assessed using chi-square analyses. Analysis of Variance (ANOVA) was
employed to assess the relationships between the two types of variables in
situations where the independent variable was categorical and the dependent
variable was measured using an interval scale.
Since much of the analysis that was conducted here was multi-dimensional in
nature, the order in which the hypotheses were tested was not necessarily
consistent with the order in which the hypotheses were introduced in Chapter
Five. Just as the order of presentation of the hypotheses in Chapter Five was kept
in line with a logical flow, so too has the order of hypotheses testing been kept in
line with the natural flow of analysis. This has been done to facilitate reading the
thesis. Results have been presented in sections to make the chapter easier to
follow, and at the start of many of the sections there are diagrammatic
representations of the analysis that has been conducted in the relevant section to
further assist the reader.
The list below provides a guide to the order of analysis that was conducted and an
indication of the statistical procedures and/or tests that were used in each section.
Listed in square brackets, are the hypotheses that were tested in each section.

166
Actual Visitation for All Attractions (Dichotomous Variable)
-Frequencies
Visit Interest for All Attractions (Seven-point Likert Scale)
[Hypothesis 1]
-Mean ratings
-EFA (all attractions)
-EFA (special events)
Visit Intention of All Attractions (Seven-point Likert Scale)
[Hypothesis 2]
-Mean ratings
-EFA (all attractions)
-EFA (special events)
LOV (Seven-point Likert Scale and Ranking of Top Three Values)
[Hypotheses 3, 4, 5, 6, 7, 8, 9, 10, 12a, 13a]
-Mean ratings
-EFA (complete list)
-EFA (LOV only)
-Rankings
-Frequency distribution
-Demographic differences with respect to (wrt) value profiles [ANOVA]
-Demographic differences wrt top-ranked value [Chi-square]
-Comparison of ratings with ranking approaches
-Relationship with actual visitation [Chi-square]
-All attractions
-Permanent attractions
-Special events
-Relationship with visit interest [Correlation]
-All attractions
-Permanent attractions
-Special events

167
-Relationship with visit intention [Correlation]
-All attractions
-Permanent attractions
-Special events
-Relationship between value domains and visit intention [Correlation]
-All attractions
-Permanent attractions
-Special events
AIOs (Seven-point Likert Scale)
[Hypotheses 12b, 13b]
-EFA
-Relationship with actual visitation [Chi-square]
-All attractions
-Permanent attractions
-Special events
-Relationship with visit interest [Correlation]
-All attractions
-Permanent attractions
-Special events
-Relationship with visit intention [Correlation]
-All attractions
-Permanent attractions
-Special events
-Demographic differences wrt psychographic profiles [ANOVA]
-Relationship to LOV [Correlation]
Demographics (Nominal and Ordinal Scales)
[Hypotheses 11, 12c, 13c]
-Relationship with actual visitation [Chi-square]
-All attractions
-Permanent attractions
-Special events
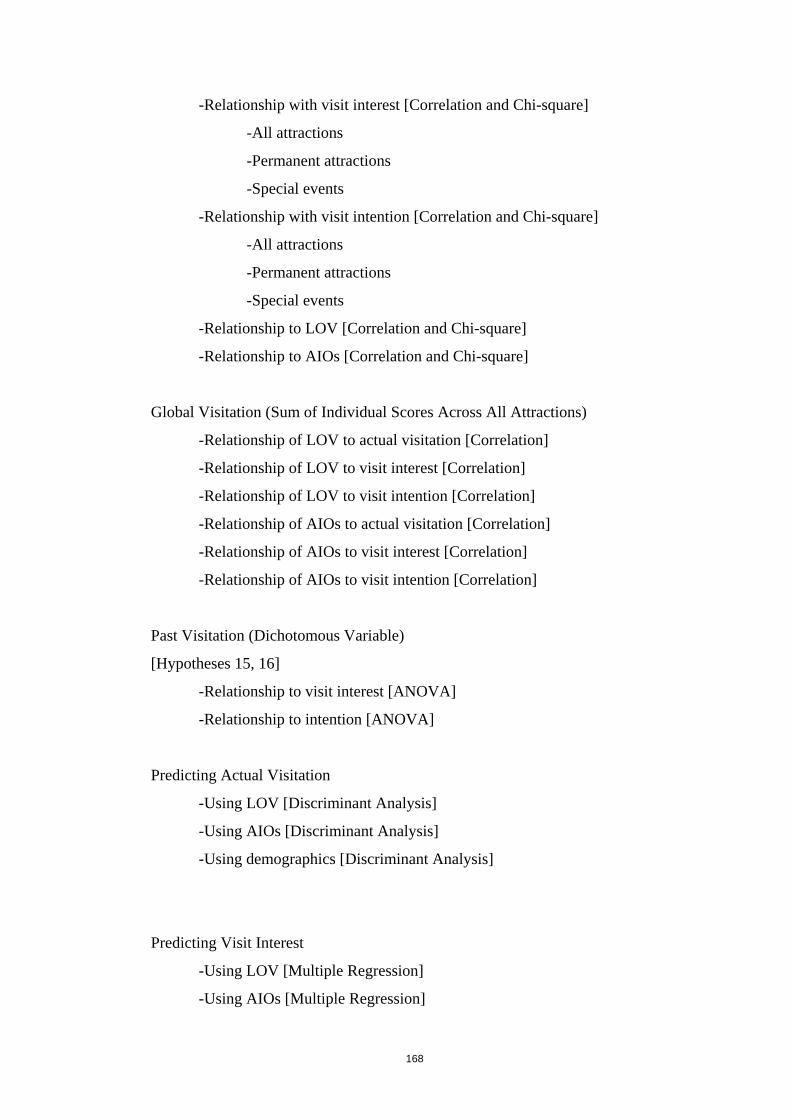
168
-Relationship with visit interest [Correlation and Chi-square]
-All attractions
-Permanent attractions
-Special events
-Relationship with visit intention [Correlation and Chi-square]
-All attractions
-Permanent attractions
-Special events
-Relationship to LOV [Correlation and Chi-square]
-Relationship to AIOs [Correlation and Chi-square]
Global Visitation (Sum of Individual Scores Across All Attractions)
-Relationship of LOV to actual visitation [Correlation]
-Relationship of LOV to visit interest [Correlation]
-Relationship of LOV to visit intention [Correlation]
-Relationship of AIOs to actual visitation [Correlation]
-Relationship of AIOs to visit interest [Correlation]
-Relationship of AIOs to visit intention [Correlation]
Past Visitation (Dichotomous Variable)
[Hypotheses 15, 16]
-Relationship to visit interest [ANOVA]
-Relationship to intention [ANOVA]
Predicting Actual Visitation
-Using LOV [Discriminant Analysis]
-Using AIOs [Discriminant Analysis]
-Using demographics [Discriminant Analysis]
Predicting Visit Interest
-Using LOV [Multiple Regression]
-Using AIOs [Multiple Regression]

169
-Using demographics [Multiple Regression]
-Using combinations [Multiple Regression]
Predicting Visit Intention
[Hypotheses 19, 20, 21, 22]
-Using LOV [Multiple Regression]
-Using AIOs [Multiple Regression]
-Using demographics [Multiple Regression]
-Using combinations [Multiple Regression]
Comparison of High Versus Low Event Visit Intention
[Hypotheses 26, 27, 28]
-LOV profile differences [t-test]
-LOV item differences [t-test]
-AIO profile differences [t-test]
-Demographic differences [Chi-square]
Prediction of High Versus Low Event Visit Intention
-LOV [Discriminant Analysis]
-AIO [Discriminant Analysis]
-Demographics [Discriminant Analysis]
-Visit history [Discriminant Analysis]
-Visit interest [Discriminant Analysis]
Comparison of First Time Versus Repeat Event Patrons
[Hypotheses 23, 24, 25]
-Event differences [Chi-square]
-LOV profile differences [ANOVA]
-AIO profile differences [ANOVA]
-Demographic differences [Chi-square]
Cluster Analyses
[Hypotheses 17, 18, 29, 30, 31]

170
-LOV domains [ANOVA and Chi-square]
-LOV top-ranked item [ANOVA and Chi-square]
-AIO domains [ANOVA and Chi-square]
-Event visit intention domains [ANOVA and Chi-square]
7.2 Survey Response Five hundred completed questionnaires were collected and the data were entered
into SPSS. Descriptives were run to identify missing or incorrect data in the
questionnaire sections that were to be used in this study, namely, actual visitation,
interest in visiting, intention to visit, age, education, family status, gender, LOV,
and AIO. It was found that 52 cases had one or more missing data points but since
the sample size was quite large and multi-variate statistics were to be employed, it
was decided to delete all cases with any data missing. This would also overcome
later questions about the use of incomplete returns. Deletion of cases with missing
data left 448 fully completed questionnaires.
After deletion of the suspect cases as noted above, the descriptives procedure of
SPSS was run on the income variable. It was found that there were 39 cases where
the question relating to respondent income had not been completed, which is not
surprising given past experience with income related questions in other studies.
Deleting cases with a missing income response would involve losing a further
nine per cent of the sample which was not desirable given that the income
variable would only be used in a relatively small percentage of the statistical
analysis. It was decided to determine whether there were differences between
respondents who completed the income question and those who did not, prior to
making a decision about whether to delete all cases in which the income question
had not been answered.
The core focus of this study was the use of various segmentation techniques,
including the LOV and AIOs, to predict consumer behaviour. Therefore, it was
decided that responses to the LOV and AIO questions would be used as the bases
to assess differences between respondents completing the income question and
those who did not. ‘One way ANOVA’ was run to assess these differences and it
was found that there were no statistically significant differences at the 95 per cent

171
confidence level for items in the LOV, and only five per cent of the items in the
AIOs demonstrated statistically significant differences. Since the number of
statistically significant differences observed was less than one would expect to
find by chance, it was decided that the cases containing missing responses for the
income question would not be deleted.
Table 7.1 provides demographic information on the 448 respondents that were
used in this study. The results presented in this table show that a reasonable
coverage of categories was achieved for all demographic variables.
Table 7.1 Demographic Characteristics of Usable Questionnaire Respondents Respondent Characteristic Percentage Gender Female 55 Male 45 Age 18-19 6 20-29 24 30-39 22 40-49 20 50-59 12 >59 16 Education Primary 2 Some secondary 25 Completed secondary 14 Some technical 5 Completed technical 9 Some tertiary 18 Completed tertiary 27 Family Status Married, children at home 39 Married, no children at home 16 Married, no children 7 Not married, children at home 6 Never married, no children at home 24 Widowed, no children at home 4 Divorced, no children at home 4 Respondent Characteristic Percentage Income $/year <10000 11 10000-29999 30 30000-49999 24 50000-69999 18 70000-99999 11 >99999 6
Table 7.1 Demographic Characteristics of Usable Questionnaire Respondents (Continued)

172
7.3 Actual Visitation
Table 7.2 Frequency of Actual Visitation Visitor Attraction
Respondents Having Visited
(Percentage) Melbourne Moomba Festival 82 Penguin Parade 79 Royal Agricultural Society of Victoria Show 78 Puffing Billy 77 Sovereign Hill 77 National Gallery of Victoria 74 A Regional Community Festival or Fair in Victoria 48 Scienceworks Museum 42 A Major Sporting Event held in Victoria 39 Spring Racing Carnival 38 Rialto Towers Observation Deck 38 A Major Cultural Event held in Victoria 37 Australian Football League Grand Final 36 Bendigo Pottery 35 Ford Australian Open Tennis 35 Tour of Parliament House 28 International Festival of the Arts 27 Melbourne International Comedy Festival 23 Behind the scenes tour of the Melbourne Cricket Ground 19 Melbourne Food and Wine Festival 19 Australian International Airshow 17 Powerworks 14 Australian Formula One Grand Prix 14 A Commonwealth or Olympic Games 14 Backstage tour of the Victorian Arts Centre 13 De Bortoli Winery 12 Bells Beach Surf Classic 12 Tour of the Australian Stock Exchange 10 “Pick-your-own” Fruit and Berry Farm 9 Tour of Western Wastewater Treatment Plant 8 Our World of Money 8 Bureau of Meteorology 6 Australian Motorcycle Grand Prix 6 Victorian Tapestry Workshop 6 The frequency analysis of actual visitation is presented in Table 7.2, and shows
that actual visitation overall was quite low. Of the 34 attractions listed in the
questionnaire, only six had been visited by over 50 per cent of the respondents,
and of these only two were events. At the other end of the spectrum, there were 17
attractions that had been visited by less than 25 per cent of the respondents. An
average of 32 per cent of respondents had visited any given attraction.

173
7.4 Visit Interest
Visit Interest All Attractions
(Interval)
1
Attraction Visit Interest
Domains
2
Exploratory
Factor Analysis
Visit Interest Special Events
(Interval)
3
Special Event Visit Interest
Domains
4
Exploratory
Factor Analysis
The average ‘interest in visiting’ across all attractions for all respondents was 3.5,
which was below the mid-point, four, of the seven-point scale, thereby indicating
a relatively low level of interest. There were only 10 attractions which achieved a
mean value above the mid-point of the scale.
An Exploratory Factor Analysis (EFA) was conducted on the ‘interest in visiting’
the attractions and, using a varimax rotation, nine factors were extracted with
eigenvalues greater than one, which explained 57 per cent of the total variation.
The output from this EFA is contained in Table 7.3. Based on the calculation of Cronbach’s alpha for each factor, reliabilities on
factors other than the last two were quite good, being generally above 0.65. The
factors had quite strong face validity which facilitated the task of selecting names
that described the theme of each factor grouping. The names selected for the
different factors seemed consistent with terms that are often used to categorise
visitor attractions, such as, motor sport, major sport, industrial tourism attractions
and community festivals.
It was interesting to note that special events and permanent attractions were
generally in separate factors. Asterisks are used in Table 7.3 to denote special
events as distinct from permanent attractions. It was also interesting to note that
the three ‘un-named events’ were grouped together in a single factor. It can be
seen that factors two, three and six comprise events only, whilst factors four, five

174
and nine involve some mixing of permanent attractions and events. Although
factor four contains one permanent attraction, namely, ‘a tour of the Melbourne
Cricket Ground’, it could be argued that this has close ties with sporting events,
especially the Australian Football League Grand Final, which explains the fact
that it was grouped with such events.
The inclusion of the ‘International Festival of the Arts’ in factor five with the
‘National Gallery of Victoria’ and a ‘Tour of the Victorian Arts Centre’ has strong
face validity, especially if the ‘Scienceworks Museum’, which had low inter-item
reliability, is deleted. There is no obvious reason for the ‘Melbourne International
Comedy Festival’ being associated with the ‘Rialto Towers Observation Deck’
but it should be noted that in the factor loadings, the two items had opposite signs
and that the reliability coefficient for this factor was very low.
Hypothesis 1:
Consumers distinguish special events from other types of attractions in terms of
their visit interest preferences.
The EFA produced visit interest factors that were reasonably distinct with respect
to permanent attractions and special events indicating that respondents did
distinguish between these two types of attractions. This supports Hypothesis 1.

175
Table 7.3 Exploratory Factor Analysis of Visit Interest for all Visitor Attractions Factor Groupings of Statement Items
Factor Loading
Eigen- value
Variance Explained (Percentage)
Reliability Coefficient
Industrial Tourist Attractions 6.14 18.1 0.78 Bureau of Meteorology. .67 Our World of Money. .65 Tour of Western Wastewater Treatment Plant .64 Tour of Parliament House. .59 Powerworks. .56 Tour of the Australian Stock Exchange. .56 “Pick-your-own” Fruit and Berry Farm. .55 Victorian Tapestry Workshop. .49 Motor Sport 3.18 9.4 0.70 * Australian Motorcycle Grand Prix. .78 * Australian Formula One Grand Prix. .67 * Australian International Airshow. .60 * Bells Beach Surf Classic. .58 * Spring Racing Carnival. .38 Un-named Events 2.11 6.2 0.66 * A Regional Community Festival or Fair in Victoria. .75 * A Major cultural Event held in Victoria. .74 * A Major Sporting Event held in Victoria. .59 Major sport 1.63 4.8 0.66 * Australian Football League Grand Final. .70 * Ford Australian Open Tennis. .63 Behind the scenes tour of the Melbourne Cricket Ground. .56 * A Commonwealth or Olympic Games .36 Cultural 1.53 4.5 0.66 National Gallery of Victoria. .67 * International Festival of Arts. .64 Scienceworks Museum. .63 Backstage tour of the Victorian Arts Centre. .51 Community Festivals 1.38 4.0 0.57 * Melbourne Moomba Festival. .73 * Royal Agricultural Society of Victoria Show. .69 * Melbourne Food and Wine Festival. .46 Major Tourist Attractions 1.19 3.5 0.56 Puffing Billy. .72 Penguin Parade. .67 Sovereign Hill. .48 Industrial2 Tourist Attractions 1.15 3.4 0.33 De Bortoli Winery. .72 Bendigo Pottery. .57 Miscellaneous 1.00 2.9 0.13 Rialto Towers Observation Deck. .47 * Melbourne International Comedy Festival. -.46 Total Variance Explained 56.8 Note: Asterisked items refer to special events.
As a consequence of this, it was decided to re-run the EFA using only the events.
The EFA of the events alone resulted in the extraction of four factors with

176
eigenvalues greater than one, which explained 55 per cent of the total variation.
The results of this EFA are presented in Table 7.4. Except for the last two items of the first factor, the face validity of the factors was
quite high. These two items seem more closely associated with the items in factor
three than they do with items in factor one. In fact both items loaded quite
strongly on factor three and being in factor one could simply be measurement or
analysis artefacts.
Table 7.4 Exploratory Factor Analysis of Visit Interest for Special Events Factor Groupings of Statement Items
Factor Loading
Eigen- value
Variance Explained (Percentage)
Reliability Coefficient
Motor Sport 4.12 25.7 0.71 Australian Motorcycle Grand Prix. .75 Australian International Air Show. .69 Australian Formula One Grand Prix. .64 Bells Beach Surf Classic. .52 A Commonwealth or Olympic Games. .39 Cultural or Community Festivals 2.07 12.9 0.69 Melbourne Food and Wine Festival. .68 Melbourne Moomba Festival. .66 Melbourne International Comedy Festival. .62 International Festival of Arts. .57 Royal Agricultural Society of Victoria Show. .56 Athletic Sport 1.31 8.2 0.60 Australian Football League Grand Final. .76 Ford Australian Open Tennis. .67 Spring Racing Carnival. .48 Un-named Events 1.24 7.8 0.66 A Major Cultural Event held in Victoria. .78 A Regional Community Festival or Fair in Victoria. .76 A Major Sporting Event held in Victoria. .65 Total Variance Explained 54.7
It was interesting to note that the un-named events again grouped into a single
factor and that the underlying themes behind the other factors seem consistent
with the groupings that one could develop based on anecdotal evidence, namely,
motor sport, athletic sport and cultural.
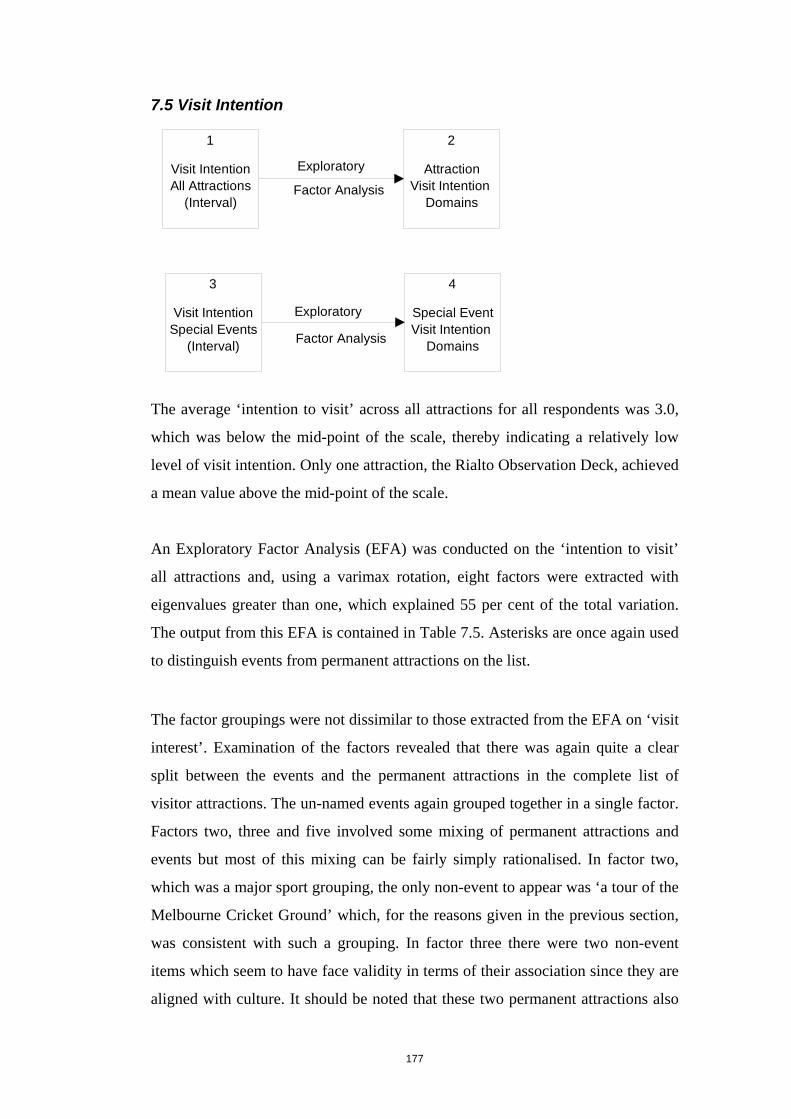
177
7.5 Visit Intention
Visit Intention All Attractions
(Interval)
1
Attraction Visit Intention
Domains
2
Exploratory
Factor Analysis
Visit Intention Special Events
(Interval)
3
Special Event Visit Intention
Domains
4
Exploratory
Factor Analysis
The average ‘intention to visit’ across all attractions for all respondents was 3.0,
which was below the mid-point of the scale, thereby indicating a relatively low
level of visit intention. Only one attraction, the Rialto Observation Deck, achieved
a mean value above the mid-point of the scale.
An Exploratory Factor Analysis (EFA) was conducted on the ‘intention to visit’
all attractions and, using a varimax rotation, eight factors were extracted with
eigenvalues greater than one, which explained 55 per cent of the total variation.
The output from this EFA is contained in Table 7.5. Asterisks are once again used
to distinguish events from permanent attractions on the list. The factor groupings were not dissimilar to those extracted from the EFA on ‘visit
interest’. Examination of the factors revealed that there was again quite a clear
split between the events and the permanent attractions in the complete list of
visitor attractions. The un-named events again grouped together in a single factor.
Factors two, three and five involved some mixing of permanent attractions and
events but most of this mixing can be fairly simply rationalised. In factor two,
which was a major sport grouping, the only non-event to appear was ‘a tour of the
Melbourne Cricket Ground’ which, for the reasons given in the previous section,
was consistent with such a grouping. In factor three there were two non-event
items which seem to have face validity in terms of their association since they are
aligned with culture. It should be noted that these two permanent attractions also

178
loaded quite heavily on other factors, especially factor one. There is no obvious
explanation for the inclusion of one attraction with the two events in factor five.
Table 7.5 Exploratory Factor Analysis of Visit Intention for all Visitor Attractions Factor Groupings of Statement Items
Factor Loading
Eigen- value
Variance Explained (Percentage)
Reliability Coefficient
Industrial Tourist Attractions 7.25 21.3 0.78 Bureau of Meteorology. .70 Tour of Parliament House. .68 Tour of the Australian Stock Exchange. .63 Tour of the Western Wastewater Treatment Plant. .62 Our World of Money. .58 Victorian Tapestry Workshop. .56 "Pick-your-own" Fruit and Berry Farm. .47 Major Sport 2.97 8.7 0.76 * Australian Motorcycle Grand Prix. .74 * Bells Beach Surf Classic. .67 * Australian Formula One Grand Prix. .63 * Australian Football League Grand Final. .60 * Australian International Air Show. .47 * A Commonwealth or Olympic Games. .46 Behind the scenes tour of the Melbourne Cricket Ground. .45 Cultural 2.03 6.0 0.76 * Melbourne International Comedy Festival. .73 * International Festival of the Arts. .72 * Melbourne Food and Wine Festival. .56 National Gallery of Victoria. .54 Backstage tour of the Victorian Arts Centre. .54 Major Tourist Attractions 1.54 4.5 0.61 Sovereign Hill. .67 Puffing Billy. .66 Penguin Parade. .64 Scienceworks Museum. .36 Social Contexts 1.50 4.4 0.54 * Ford Australian Open Tennis. .64 De Bortoli Winery. .60 * Spring Racing Carnival. .51 Un-named events 1.30 3.8 0.56 * A Regional Community Festival or Fair in Victoria. .74 * A Major Cultural Event held in Victoria. .67 * A Major Sporting Event held in Victoria. .56 Community Festivals 1.09 3.2 0.60 * Melbourne Moomba Festival. .71 * Royal Agricultural Society of Victoria Show. .70 Industrial 2 1.02 3.0 0.31 Bendigo Pottery. .60 Powerworks. .52 Rialto Towers Observation Deck. -.41 Total Variance Explained 55.0 Note: Asterisked items refer to events.
Hypothesis 2:

179
Consumers distinguish special events from other types of attractions in terms of
their visit intention preferences.
The EFA produced visit intention factors that were reasonably distinct with
respect to permanent attractions and special events indicating that respondents did
distinguish between these two types of attractions. This supports Hypothesis 2.
Since the EFA of all the attractions listed in the questionnaire again resulted in a
reasonable split between permanent attractions and events, it was decided to re-
run the EFA using only the events. The EFA of the events alone resulted in the
extraction of four factors with eigenvalues greater than one, which explained 55
per cent of the total variation. The results of this EFA are presented in Table 7.6.
Table 7.6 Exploratory Factor Analysis of Visit Intention for Special Events Factor Groupings of Statement Items
Factor Loading
Eigen- value
Variance Explained (Percentage)
Reliability Coefficient
Mega-sport 4.52 28.2 0.76 Australian Formula One Grand Prix. .73 Australian Football League Grand Final. .70 Australian Motorcycle Grand Prix. .69 Bells Beach Surf Classic. .56 Spring Racing Carnival. .48 Ford Australian Open Tennis. .47 A Commonwealth or Olympic Games. .41 Cultural 1.88 11.8 0.76 International Festival of the Arts. .76 Melbourne Food and Wine Festival. .74 Melbourne International Comedy Festival. .72 Popular Festivals 1.27 7.9 0.59 Royal Agricultural Society of Victoria Show. .74 Melbourne Moomba Festival. .66 Australian International Air Show. .59 Un-named events 1.18 7.4 0.56 A Regional Community Festival or Fair in Victoria. .75 A Major Cultural Event held in Victoria. .73 A Major Sporting Event held in Victoria. .58 Total Variance Explained 55.3
The factors extracted generally had high face validity except for some ambiguity
caused by the inclusion of the ‘Australian International Airshow’ in factor three.
However, one could argue that it was simply a measurement problem that this
event was in factor three, as it also had a high loading on factor one. Based on the
calculation of Cronbach’s alpha, the overall reliability of factor three improved
marginally if this particular item was deleted. In conducting a cluster analysis of

180
the intention to visit these events, it could be seen that this item grouped with the
other motorised sports, namely, ‘Australian Formula One Grand Prix’ and
‘Australian Motor Cycle Grand Prix’.
Hypothesis 14:
There is a positive relationship between visit interest and visit intention with
respect to attractions.
It should be noted that there was quite a strong correlation between ‘visit interest’
and ‘visit intention’ ranging from 0.62 for ‘Sovereign Hill’ to 0.91 for the
‘Melbourne Moomba Festival’. The average correlation was 0.83 (0.86 for special
events and 0.81 for permanent attractions). These results are not unexpected given
the common assertion that interest tends to lead to intention. The correlations
found here lend support for Hypothesis 14.
7.6 Values A list containing all of the personal values that were used in this study, arranged
in descending order in terms of mean ratings, is presented in Table 7.7.
The nine items in the original LOV, which are denoted by asterisks in Table 7.7,
fell within the first 12 places, with only positions six, nine and 11 being occupied
by items inserted to test consumer use of the response scale. None of the original
LOV items had a mean value below 5.3 on the seven-point scale. The inclusion of
the additional values to encourage respondents to make greater use of the full
scale succeeded in that the resultant mean values ranged from 2.5 to 6.4 on the
seven-point scale. The fact that the values which were added in this study largely
grouped in the lower part of the list of means lends some support to the stability
of the original LOV scale. The mean value of the mean ratings for all 20 items in
the list was 5.2, whilst the mean value of the mean ratings of the original nine
LOV items was 5.9 on the seven-point scale.
Table 7.7 Mean Ratings for the extended list of Personal Values

181
Personal Value Mean Rating Standard Deviation 1. Self Respect * 6.4 0.9 2. Warm relationship with others * 6.2 1.1 3. Fun and enjoyment in life * 6.2 1.0 4. Security * 6.1 1.0 5. Self fulfilment * 6.1 1.1 6. Self reliance 6.0 1.2 7. Being well respected * 5.9 1.2 8. Accomplishment * 5.8 1.2 9. Individuality 5.5 1.4 10. Belonging * 5.5 1.4 11. Ambition 5.4 1.6 12. Excitement * 5.3 1.5 13. Popularity 4.8 1.4 14. Wealth 4.8 1.6 15. Spirituality 4.8 1.9 16. Solitude 4.6 1.6 17. Status 4.0 1.7 18. Materialism 3.7 1.6 19. Competing with others 3.6 1.9 20. Dominating others 2.5 1.6 *Original LOV items.
7.6.1 Exploratory Factor Analysis (EFA)
Expanded List of Values (Interval)
1
Value Domains
2
Exploratory
Factor Analysis
Original List of Values
(Interval)
3
Value Domains
4
Exploratory
Factor Analysis
An EFA using a varimax rotation resulted in the extraction of five factors with
eigenvalues in excess of one, which explained 58 per cent of the total variance.
Although there was some ‘mixing’ within the factors of the traditional LOV items
and the additional values that were added, the factors were generally divided into
those comprising traditional LOV items and those comprising the additional

182
items. This tended to further support the stability of the original LOV scale. The
output of the EFA is presented in Table 7.8. The face validity and reliability of the factors extracted were quite high despite
the fact that the items were based on the nine items in the LOV as well as a
somewhat arbitrary collection of 11 other items that were inserted purely to act as
a counter to the LOV items on the rating scale. Given this, it is probably unwise to
read too much into these particular factors. It is interesting however, that the
original LOV items fell largely into two factors.
Table 7.8 Exploratory Factor Analysis of the Extended List of Values Factor Groupings of Statement Items
Factor Loading
Eigen- value
Variance Explained (Percentage)
Reliability Coefficient
Enjoyment 5.67 28.2 0.81 * Fun and enjoyment in life. .71 * Excitement. .69 * Self Respect. .62 Ambition. .58 * Self fulfilment. .55 * Being well respected. .51 * Accomplishment. .50 Power 2.21 11.1 0.74 Competing with others. .79 Dominating others. .78 Status. .65 Materialism. .57 Affiliation 1.44 7.2 0.58 * Belonging. .71 * Warm relationship with others. .64 Popularity. .58 Spirituality. .54 Materialistic 1.28 6.4 0.43 Wealth. .74 * Security. .43 Solitude 1.08 5.4 0.54 Solitude. .70 Individuality. .68 Self reliance. .49 Total Variance Explained 58.4 * Original LOV items. An EFA was then conducted on the items in the original LOV and using a
varimax rotation, two factors were extracted with eigenvalues greater than one,
which explained 53 per cent of the total variance. The results of this EFA are
presented in Table 7.9. The reliability of both these factors was quite high based
on the calculation of Cronbach’s alpha.

183
Table 7.9 Exploratory Factor Analysis of the Original List of Values Factor Groupings of Statement Items
Factor Loading
Eigen- value
Variance Explained (Percentage)
Reliability Coefficient
Achievement (LOVF1) 3.75 41.7 0.74 Self fulfilment. .76 Accomplishment. .70 Security. .68 Excitement. .63 Fun and enjoyment in life. .48 Affiliation (LOVF2) 1.01 11.2 0.73 Warm relationship with others. .81 Belonging. .76 Being well respected. .69 Self respect. .47 Total Variance Explained 52.8
Hypothesis 5: The values that constitute the LOV underpinned by a small number of value domains. The results presented in Table 7.9 provides support for Hypothesis 5.
7.6.2 Value Domains Madrigal and Kahle (1994) hypothesised that the items in the LOV “represent a
smaller number of domains that reflect either external or internal orientations” (p.
24). In a study based on a convenience sample of 394, Madrigal and Kahle
extracted four factors, which are reproduced in Table 7.10, that supported their
hypothesis. The study conducted in this thesis used a larger sample than that used by Madrigal
and Kahle and it was randomly selected unlike the sample used by Madrigal and
Kahle. As mentioned earlier, the EFA of the LOV extracted two factors, as
presented in Table 7.9, thereby supporting the hypothesis that there is a small
number of dimensions underlying the LOV. The two factors that were extracted
were virtually a collapse of Madrigal and Kahle’s four factors: factors two and
three in Madrigal and Kahle’s study became factor one in this study, and factors
one and four in the earlier study became factor two in this study. The one value
that was an exception to this trend was ‘security’ which appeared in factor one in
this study but should have appeared in factor two to be consistent with the

184
Madrigal and Kahle findings. Therefore, it could be argued that the factors
produced in this study are fundamentally consistent with the work of Madrigal
and Kahle (1994), but indeed comprise a more parsimonious list of the underlying
values.
Table 7.10 Madrigal and Kahle (1994) Value Domains Factor Items Value Domain 1 Sense of belonging External Being well respected Security 2 Fun and enjoyment Enjoyment/Excitement Excitement 3 Sense of accomplishment Achievement Self fulfilment 4 Self-respect Egocentrism Warm relationships
Other EFAs were conducted on the LOV by Kahle (1983) and Homer and Kahle
(1988), each producing slightly different factor groupings which were explained
and justified using a variety of arguments. The single factor that was consistent in
these studies was the one listed above as factor one which included ‘sense of
belonging’, ‘being well-respected’ and ‘security’. This factor was classed as an
external factor. In the current study, this factor is the one that is split with
‘security’, appearing in a separate factor to the other two items. In the other
studies that have been mentioned, much was made of the fact that this particular
factor represented an external focus and was consistent across the studies. Table
7.11 presents the factors that were extracted in the study conducted by Homer and
Kahle (1988).
Table 7.11 Homer and Kahle (1988) Value Domains Value Value Domain Self-fulfilment Individual Excitement Sense of accomplishment Self-respect Sense of belonging External Being well-respected

185
Security Fun and enjoyment Interpersonal Warm relationships
Kamakura and Novak (1992) conducted a study of the LOV that interpreted the
individual values with respect to motivational domains. These motivational
domains are similar to what was classed as value domains in the other studies.
The motivational domains that were proposed by Kamakura and Novak are listed
in Table 7.12.
Table 7.12 Kamakura and Novak (1992) Motivational Domains Value Motivational Domain Self-respect Self-direction Self-fulfilment Accomplishment Achievement Well-respected Fun and enjoyment Enjoyment Excitement Belonging Maturity Warm relationships Security Security
It was interesting to note that ‘security’ was a separate value in the work of
Kamakura and Novak. It was also interesting that ‘well-respected’ went with
‘accomplishment’ in an achievement domain as opposed to having
‘accomplishment’ with ‘self-fulfilment’ in this domain. There was not a clear
external domain in this study, unlike the others that have been reported. This
demonstrates that there is substantial scope for interpretation in this work.
In the study that is the focus of this thesis, ‘security’ was included with ‘self-
fulfilment’ and ‘accomplishment’ and it could be argued that achieving personal
fulfilment and having a sense of accomplishment, gives one a sense of security.
However, if one accepts that ‘sense of belonging’, ‘being well-respected’ and

186
‘security’ are the three external items, then clearly there was not a single factor
here that represented an external focus.
The first factor in this study combined an achievement domain (‘Self-fulfilment’
and ‘Sense of accomplishment’) and a hedonistic domain (‘Excitement’ and ‘Fun
and Enjoyment’). Although one could argue that the extra item, ‘security’, could
have some association with the achievement domain, the association was not as
obvious as the other connections. The second factor that was extracted in this
study combined a respect domain (‘Being well-respected’ and ‘Self-respect’) and
an affiliation domain (‘Warm relationships’ and ‘Sense of belonging’).
Table 7.13 Keng and Yang (1993) Value Domains Value Value Domain Self-respect Respect Being well-respected Security Harmony Sense of belonging Warm relationships Self-fulfilment Achievement A sense of accomplishment Fun and enjoyment Hedonism Excitement
Keng and Yang (1993) produced value domains that are presented in Table 7.13.
There are strong similarities between the groupings in Table 7.13 and the value
domains identified in the factors that were extracted from the EFA of the LOV in
this study. Indeed, it was once again only the value ‘security’ that prevented the
two groupings of values from being identical. Removing ‘Security’ from the
domain listed by Keng and Yang as harmony, converts the remaining items to
affiliation. As stated earlier, one could argue a case that ‘Security’ could be
included in Keng and Yang’s domain described as achievement without
substantially changing its meaning.

187
Thrane (1997) used the LOV to explore the vacation motives of a stratified
sample of 401 Norwegian residents. The EFA conducted by Thrane extracted two
factors, as presented in Table 7.14, that were very similar to those extracted in this
study. Indeed, there was only a single difference between the factor groupings in
these two studies and this difference once again related to ‘security’.
Table 7.14 Thrane (1997) Value Domains Value Domains Factor 1 External Security Being well respected Self-respect Belonging Warm relationships Factor 2 Internal Excitement Fun and enjoyment Self-fulfilment Accomplishment Thrane (1997) concluded that the two factors extracted in his study had external
and internal foci respectively. Factor 1 was classed as external because it was
considered that the “majority of the values relate to other persons” (p. 237) and
factor 2 was classed as internal because the values indicated an internal
orientation.
Table 7.15 compares the value domains of the LOV items in each of the value
studies that has been discussed. It is clear from this table that ‘security’ in the
current study has been placed in a factor that is the opposite to its location in all of
the other studies. The consistency of this result does call into question the validity
of the finding in this study.
Table 7.15 Comparison of Value Factors across Studies This Thrane Madrigal and Homer and Keng and Value Study (1997) Kahle (1994) Kahle (1988) Yang (1993) Self-fulfilment Achievement Internal Achievement Individual Achievement Accomplishment Achievement Internal Achievement Individual Achievement Security Achievement External External External Harmony Excitement Achievement Internal Enjoyment Individual Hedonism Fun and enjoyment Achievement Internal Enjoyment Interpersonal Hedonism

188
Warm relationships Affiliation External Egocentrism Interpersonal Harmony Belonging Affiliation External External External Harmony Being well-respected Affiliation External External External Respect Self-respect Affiliation External Egocentrism Individual Respect Hypothesis 8:
The values that constitute the LOV reflect an internal or external orientation.
Based on the results of this study, therefore, it is clear that there is a smaller
number of underlying value domains to the LOV. Earlier discussion of other
studies that have explored the orientation of value domains indicates substantial
flexibility in the interpretation of such domains. However, most of the earlier
studies are fairly consistent with respect to the specific values that group together
as the external domain. If these particular values are accepted as forming the
external factor, then it is not possible to support Hypothesis 8 in this study. Given
the apparent scope for interpretation of these factors, however, more research
needs to be conducted to assess the true orientation of these domains.
7.6.3 The Relationship Between Value Domains and Behaviour
List of Values Domains (Ratio)
1
Visit Interest - Permanent Attractions
- Special Events - All Attractions
(Interval)
2
Visit Intention - Permanent Attractions
- Special Events - All Attractions
(Interval)
3
Correlation
In order to assess the relationship between the value domains that were derived in
an earlier section and behaviour in relation to visitor attractions, correlations were
calculated using SPSS. Table 7.16 indicates the incidence of statistically
significant relationships between the value domains (Achievement and

189
Affiliation), and behaviour (visit interest and visit intention), in relation to the
permanent attractions, special events, and visitor attractions overall that were
listed in the questionnaire. The figures in the table represent the percentage of
relationships that were statistically significant.
Table 7.16 Correlations between Value Domains and Visit Behaviour at Visitor Attractions Statistically Significant Relationships Permanent Special All Visitor Attractions (%) Events (%) Attractions (%) Visit Interest Achievement 0 44 21 Affiliation 6 31 18 Visit Intention Achievement 11 44 26 Affiliation 6 50 26 The key results in Table 7.16 are:
• there were many more statistically significant relationships with
special events than there were with permanent attractions,
• there tended to be more statistically significant relationships for visit
intention than there were for visit interest.
7.6.4 Relationship Between Event Visit Intention and Value Domains
Value Domains - External - Hedonic
(Ratio)
1Special Event Visit Intention
- Low - High
(Ordinal)
2Compare Means
Independent Sample t-test
A global summate variable was formed based on respondents’ visit intention in
relation to the range of special events listed in the questionnaire. Given that there
were 16 special events in the questionnaire and visit intention was measured on a
seven-point scale, this new variable could range in value from 16 (16*1) up to 112
(16*7). This global summate variable was then converted into a dichotomous
variable based on a median split to identify respondents that could be classed as
demonstrating high visit intention versus respondents demonstrating low visit
intention.

190
Although the EFA that was conducted on the LOV in this study did not extract a
factor that would be classed as ‘external’, a number of other studies had extracted
such a factor that comprised ‘being well respected’, ‘security’ and ‘sense of
belonging’. In order to assess whether a factor comprising these three items was
related to event visit intention, the mean ratings of these three items were
compared for respondents demonstrating high event visit intention with those
demonstrating low event visit intention.
Hypothesis 9:
Consumers with a high special event visit intention place greater emphasis on
external values than consumers with a low special event visit intention.
It was found that there were statistically significant differences in the means for
only one of the three values that make up the ‘external’ factor, namely, ‘being
well respected’. Therefore, Hypothesis 9 can not be supported.
This analysis was then repeated to assess the relationship between event visit
intention and the hedonic value domain comprising ‘excitement’ and ‘fun and
enjoyment’.
Hypothesis 10:
Consumers with a high special event visit intention place a higher emphasis on
hedonic values than consumers with a low special event visit intention.
Statistically significant differences were found in the means for both values which
make up the hedonic domain which provides support for Hypothesis 10.
7.6.5 Ranking of Values The analysis of values to date has been based upon respondents’ ratings of values.
It has been discussed in earlier chapters that there has been substantial
controversy regarding the relative merits of measuring values using a ratings
versus a ranking approach, and for this reason, a section was included in the

191
questionnaire that asked respondents to rank the three values that they regarded as
the most important guiding principles in their lives.
A weighting scale was then used to determine an overall ranking of the values.
The weighting scale was based on a reverse order weighting, with three points for
the first-ranked value of an individual respondent, two points for the second-
ranked value, and one point for the third-ranked value. A hierarchical listing of
values was then compiled based upon the weighting scale and this is presented in
Table 7.17. It was interesting to note that every value, including the values added to the
original LOV, appeared at least five times in the listings of respondents’ three
most important values. Only the value ‘excitement’, which is in fact one of the
original LOV, did not appear as any respondent’s most important value. This
finding is consistent with a study conducted by Kahle in 1983 which found that
few people selected ‘excitement’ (Kahle, Beatty and Homer 1986).
Table 7.17 Weighted Ranking of Values WEIGHTED VALUE SCORE RANK * Warm relationships 397 1 * Self-respect 392 2 * Fun and enjoyment 332 3 * Self-fulfilment 282 4 * Security 235 5 Spirituality 195 6 * Well-respected 144 7 Self-reliance 130 8 * Accomplishment 129 9 * Belonging 98 10 Wealth 94 11 Ambition 76 12 Individuality 64 13 Status 24 14 Solitude 20 15 Popularity 19 16 * Excitement 17 17 Competing 16 18 Dominate 13 19 Materialism 11 20 * Original LOV items.

192
Items from the original LOV occupy eight of the first 10 places, further
supporting the stability of the original scale. Of the non-LOV items, ‘spirituality’
and ‘self-reliance’ were the only two that were included in the top 10 ranked
values which is not particularly surprising given that most of the other introduced
values were from the less laudable end of the value scale.
7.6.6 Frequency Distribution of Top-ranked Value Choice The percentage of respondents choosing each of the values as their most
important value as a guiding principle in their lives is presented in Table 7.178
The findings of the study conducted by Novak and MacEvoy (1990) are also
included in this table for comparative purposes. It should be noted, however, that
respondents in the Novak and MacEvoy study did not have the option to choose
items from outside the LOV.
Table 7.18 Respondent Choice of Top-ranked Value Percentage of Respondents Choosing a Particular Value as Their Top-Ranked Value This Study Value This Study Adjusted (1) Novak & MacEvoy Self-respect 19 25 21 Warm relationships 13 17 17 Self-fulfilment 13 17 11 Fun and enjoyment 13 17 6 Security 9 12 20 Sense of accomplishment 4 5 17 Being well-respected 3 4 4 Sense of belonging 2 3 4 Excitement 0 0 0 Other 24 N/A N/A Note (1): These results were adjusted to remove the impact of non-LOV items. In comparing the results of the two studies, it can be seen that the more hedonistic
values of ‘fun and enjoyment’ and ‘self-fulfilment’ were regarded as the most
important guiding principles by more respondents to this study than was the case
in the Novak and MacEvoy (1990) study. To offset these differences, ‘security’
and ‘sense of accomplishment’ were seen as the most important guiding principles
by more respondents to the Novak and MacEvoy study. The finding that ‘security’
was not seen as important in this study, which was conducted in Australia, is
consistent with the image that Australians have for a ‘carefree - live for today’

193
attitude. It may also help explain the fact that the EFA of the LOV in this study
placed ‘security’ in a factor that was counter to all of the other studies, as was
discussed in an earlier section.
It was interesting that some 24 per cent of respondents listed a value other than
one of those contained in the LOV as being the most important guiding principle
in their lives. This result questions whether the LOV is truly comprehensive and
representative. It was also found that only 40 per cent of respondents listed three
LOV items as their top three ranked values. Many of the values which were added
to the LOV in this study, were from what could be termed as the ‘less laudable’
end of the value scale and yet many respondents selected these values as being
their most important guiding principles. This suggests that there may be a need to
include in the value scale, some less socially desirable values.
Hypothesis 3:
There are values other than those included in the LOV that are the most important
guiding principles in people’s lives.
The fact that 24 per cent of respondents chose a value that was not contained in
the original LOV provides strong support for this hypothesis.
Although the previous section found that the original items in the LOV generally
rated above the introduced values, the fact that so many respondents chose a non-
LOV item as the most important guiding principle in their lives poses some
concerns regarding the comprehensiveness of the LOV. This is something that
will need to be taken into account when evaluating the performance of values to
explain behaviour using the LOV as the value measure.
7.6.7 Value Domains based upon Top-ranked Value Keng and Yang (1993) compared the percentage of respondents choosing the
different value domains based on their top-ranked value, across a number of
studies. Given that the studies compared in Keng and Yang (1993) did not give
respondents the opportunity to select values that were not included in the LOV,

194
adjustments have been made to the results of this study to exclude those
respondents who selected a non-LOV item. A comparison of the results of the
various studies is presented in Table 7.19.
Table 7.19 Respondent Choice of Value Domain based on Top-ranked Value Percentage of Respondents Choosing a Value Domain with
their top-ranked value Value Domain This study Singapore (1) USA (2) Harmony 32 57 45 Respect 29 17 30 Achievement 22 19 21 Hedonism 17 7 4 Notes: 1. The Singapore study was conducted by Keng and Yang (1993).
2. The USA study was conducted by Kahle (1984). In terms of percentage of respondents subscribing to a particular value domain,
the only one that showed reasonable consistency across the three reported studies
was ‘achievement’. There was also consistency on the ‘respect’ domain between
the study conducted in the USA and the one conducted here. Given that values are
claimed to be related to culture (Engel, Blackwell and Miniard 1995; Schiffman,
Bednall, Watson and Kanuk 1997), the comparison between the study conducted
for this thesis and the one conducted in the USA is more relevant than the
comparison with that conducted in Singapore. The major differences between the
results of this study and that conducted in the USA were in the largely offsetting
differences in the ‘harmony’ and ‘hedonism’ domains. This difference seemed
consistent with anecdotal reports of Australians ‘living for today’ (hence security
being less important) and actively seeking fun and excitement (hence hedonism
being so highly valued).
In comparing the hierarchical listing of value domains in the three studies, one
can see that there is complete consistency or ordering, if not magnitudes, between
this study and the one conducted in the USA. The order of the ‘respect’ and
‘achievement’ domains is reversed in the study conducted in Singapore.

195
7.6.8 Demographic Differences Across Value Profiles
Demographic Variables
(Nominal & Ordinal)
1
Value Domains
2ANOVAs
In order to assess whether there were statistically significant demographic
differences across value profiles, ‘one way ANOVAs’ were conducted using
demographic variables as independent variables and the LOV factor scores,
Achievement and Affiliation, as the dependent variables. Table 7.20 summarises
the results of this analysis and indicates that there were statistically significant
differences in 30 per cent of the relationships. This suggests that respondents were
fairly homogeneous with respect to demographic variables across value domains.
Table 7.20 ANOVA Results - Demographic Variables and LOV Factor Scores DEMOGRAPHIC VARIABLE
Achievement F-Value
Affiliation F-Value
AGE 4.74 * 1.10 GENDER 0.00 19.37 * EDUCATION 0.70 1.20 FAMILY STATUS 2.29 * 0.71 INCOME 0.90 1.48 *Significant at the p<0.05 level.
7.6.9 Demographic Differences in Value Choices as Determined by the Top Ranked Value
Demographic Variables
(Nominal & Ordinal)
1
Top Ranked Value
(Nominal)
2
Differences
Chi-Square Analyses
In Table 7.21, the coding that has been used to denote the various values is: 1 Fulfilment 6 Well-respected 2 Security 7 Excitement 3 Accomplishment 8 Self-respect 4 Sense of belonging 9 Fun and enjoyment 5 Warm relationships 10 Non-LOV items

196
Since none of the respondents listed ‘excitement’ as their most important guiding
principle, there is no column relating to this item which corresponds to 7 in the
above list.
Table 7.21 shows that there were statistically significant differences between
respondents choosing the different values as being most important with regard to
age and gender. These results are consistent with anecdotal evidence that suggests
many values are gender based and that different age groups subscribe to different
value systems. No statistically significant differences existed with regard to
education, family status and income.
Table 7.21 Chi-square Analyses - Demographic Variables and Top-ranked _ Value CLUSTERS Respondent Characteristic 1 2 3 4 5 6 8 9 10 Gender Female 64 66 44 89 61 36 64 40 46 Male 36 34 56 11 39 64 36 60 54 Chi-Square=23.74, df=8, p=0.003. Age 18-19 2 2 13 0 5 7 4 12 9 20-29 22 15 25 11 25 14 21 30 29 30-39 29 22 19 0 25 36 21 32 13 40-49 26 20 31 11 21 0 26 12 19 50-59 9 20 0 56 12 0 15 5 13 >59 12 23 12 22 12 43 13 9 17 Chi-Square=69.06, df=40, p=0.003. Education Primary 2 2 0 0 2 7 0 2 4 Some secondary 16 29 13 44 37 36 25 23 22 Completed secondary 14 12 6 11 16 0 15 16 15 Some technical 3 12 6 0 7 7 5 4 4 Completed technical 9 17 0 22 7 14 5 11 9 Some tertiary 19 7 50 0 12 7 14 25 23 Completed tertiary 37 21 25 23 19 29 36 19 23 Chi-Square = 59.94, df=48, p=0.116. Family Status Married, children at home 38 41 38 78 46 14 39 39 35 Married, no children at home 16 12 6 22 16 14 19 12 19 Married, no children 10 2 13 0 7 14 7 5 6 Not married, children at home 10 7 13 0 4 14 8 4 1 Never married, no children at home 17 20 30 0 23 30 19 35 29 Widowed, no children at home 3 7 0 0 0 14 2 4 4 Divorced, no children at home 6 11 0 0 4 0 6 1 6 Chi-Square=51.62, df=48, p=0.334. Income $/year <10000 11 11 15 0 12 29 8 8 12 10000-29999 33 45 15 38 20 21 21 37 33 30000-49999 24 24 23 25 29 14 25 25 23 50000-69999 19 8 15 0 25 29 21 17 14 70000-99999 7 5 15 0 10 7 16 10 12

197
>99999 6 7 17 37 4 0 9 3 6 Chi-Square = 65.48, df=64, p=0.425.
In the chi-square analysis that was conducted in Table 7.21, clearly there were a
number of cells for which the expected value was less than five which means that
care must be exercised in the interpretation of the results. In order to verify the
results, the analysis was repeated but for demographic variables that were
converted to dichotomous variables. The age, income and education variables
were converted based on a median split and the family status variable was split
based on the presence of children at home. The findings from this repeated
analysis were:
Age: Chi-square=21.07, df=8, p=0.007
Education: Chi-square=22.09, df=8, p=0.005
Income: Chi-square=10.37, df=8, p=0.240
Family status: Chi-square=10.77, df=8, p=0.215
In recalculating the chi-square analyses, education was the only demographic
variable that changed in terms of statistical significance. Overall, therefore, it can
be seen that there were statistically significant differences between respondents
choosing the different values as being most important with regard to age, gender
and education. No statistically significant differences existed with regard to
family status and income. With respect to gender, there was a female positive bias
for each of ‘fulfilment’, ‘security’, ‘warm relationships’ and ‘self-respect’, with a
particularly strong female bias for ‘sense of belonging’. The other values
demonstrated a male bias. The main differences with regards to age were that over
74 per cent of respondents choosing ‘fun and enjoyment’ were aged below 40, 78
per cent of respondents choosing ‘sense of belonging’ were aged above 50, and
the respondents choosing ‘well-respected’ tended to be polarised into the
youngest and the oldest groupings.
Keng and Yang (1993) also examined the manner in which the LOV varied with
demographics in their study in Singapore. They found that there were statistically
significant differences for gender, income and education but that there were no
significant differences for age. The results obtained in the study here are in sharp

198
contrast to those of Keng and Yang, with consistency being found solely on the
gender dimension. The fact that significant differences were found by Keng and
Yang on income and education was attributed to “the importance attached to
education in an Asian society” (Keng and Yang 1993, p. 424) and the impact that
education has on the choice of values. Further, income was said to be closely
related to education, thereby suggesting a link between income and values. As
stated earlier, Keng and Yang commented that the fact that they found no
significant differences with respect to age, was likely due to the restricted age
group range that was included in their sample. They also suggested that other
studies which had not had such restrictions had found that age did significantly
influence value choice.
7.6.10 Comparison of Value Rating with Value Ranking
List of Values Measured
using Ratings Approach
1List of Values
Measured using
Rankings Approach
2
Comparison
Spearman's Rho
The hierarchical positions of the values listed according to mean rating and weighted count are presented in Table 7.22.
Table 7.22 Comparison of Hierarchical Positions of Value Rating versus Value Ranking RANK RANK (MEAN (WEIGHTED RATING) COUNTS) * Self-respect 1 2 * Warm relationships 2 1 * Fun and enjoyment 3 3 * Security 4 5 * Self-fulfilment 5 4 Self-reliance 6 8 * Well-respected 7 7 * Accomplishment 8 15 Individuality 9 13 * Belonging 10 10 Ambition 11 12 * Excitement 12 17 Popularity 13 16 Wealth 14 11

199
Spirituality 15 6 Solitude 16 15 Status 17 14 Materialism 18 20 Competition 19 18 Dominate 20 19 * Original LOV items. Spearman’s rho was calculated for the two lists in Table 7.22 with the result
being: Spearman’s rho = 0.84, p<0.001.
Although there were slight differences in the specific order of items, it was
interesting to note that the same values were listed in the first five places
irrespective of whether the rating or ranking approaches were adopted. It was also
of interest to note that three of the first five most highly ranked values appeared in
the first factor of the EFA. Overall, a Spearman’s rho of 0.84 indicates a strong
correlation between the rankings produced under the mean ratings approach and
the weighted count approach. Hypothesis 4:
The ratings approach to value measurement provides a different hierarchical
ordering of items in the LOV than is achieved using the ranking approach.
A Spearman’s rho of 0.84 suggests that there is consistency in the results of the
LOV irrespective of whether the importance of these values is measured using a
rating or a ranking approach. Based on this result Hypothesis 4 can not be
supported.
This result tends to be counter to much of the literature which indicates an
unresolved debate in this area. Although there has been “a scarcity of systematic
comparisons between rankings and other approaches to measuring values” (Alwin
and Krosnick 1985, p. 535), two studies that did attempt to conduct such
comparisons found that ratings and rankings produced similar results at the
aggregate level (Feather 1973; Alwin and Krosnick 1985). This finding was
supported by the results of the current study, which unlike the earlier studies, was
based on the LOV. Most researchers in this area have tended to adopt a particular
measuring technique and simply discuss the benefits of that technique compared
to the drawbacks of the alternative without actually comparing them. There may

200
well be circumstances in which one technique outperforms the other, but in the
study conducted here the results derived from both techniques were very similar.
7.6.11 Relationship Between LOV Items and the Three Dimensions of Visitation
List of Values (Interval)
1
Actual Visitation (Dichotomous) - All Attractions
- Permanent Attractions - Special Events
2
Visit Interest (Interval)
- All Attractions - Permanent Attractions
- Special Events
3
Visit Intention (Interval)
- All Attractions - Permanent Attractions
- Special Events
4
Correlation
Correlation
Chi-Square Analysis
Since ‘actual visitation’ in the questionnaire was measured using a dichotomous
scale, it was not possible to correlate actual visitation with responses to the LOV.
Therefore, chi-square analysis was conducted for these two variables. Correlations
were conducted between the LOV and each of the ‘visit interest’ and ‘visit
intention’ variables for each permanent attraction and special event. Statistical
significance was taken at the 95 per cent level and tables listing the statistically
significant findings from these three analyses are presented in Appendix E.
Although only 17 per cent of results were statistically significant across the three
analyses, some interesting trends appeared when the results were broken down
further into component parts, as summarised in Table 7.23.

201
Table 7.23 indicates that there were more statistically significant results for visit
intention than for visit interest for each category of attraction which is consistent
with the finding in Section 7.6.3 in relation to value domains. These results appear
contrary to the literature which suggested that values are better indicators of
generic, or abstract behaviour, than they are for more specific behaviour. In terms
of visitation, visit interest is a more abstract form than is visit intention.
Table 7.23 Relationships between the Three Dimensions of Visitation and the LOV for all Visitor Attractions
Percentage of Statistically Significant Relationships
Visitation Dimension
Permanent Attractions
(Percentage)
Special Events (Percentage)
Attractions Overall
(Percentage) Actual Visitation 7 18 12 Visit Interest 4 31 16 Visit Intention 8 41 24 Overall 7 29 17 Hypothesis 12a:
The items in the LOV are better predictors of generic behaviour (visit interest)
than they are of more concrete behaviour (visit intention).
Hypothesis 13a:
The items in the LOV are better predictors of behaviour in relation to tourism
attractions overall, including special events, than they are of behaviour in relation
to special events alone.
Results in Table 7.23 do not provide support for either of the above hypotheses.
Another key finding that can be derived from Table 7.23 is that the percentage of
statistically significant results was much higher for the special events than it was
for permanent attractions.
Testing of the following six hypotheses was based on comparing the results
presented in Table 7.16 with those presented in Table 7.23.

202
Hypothesis 6a:
Value domains are more closely related to consumer attraction visit interest
behaviour than are individual values.
Hypothesis 6b:
Value domains are more closely related to consumer special event visit interest
behaviour than are individual values.
Hypothesis 6c:
Value domains are more closely related to consumer permanent attraction visit
interest behaviour than are individual values.
Comparison of the results in Tables 7.16 and 7.23 shows that the percentage of
statistically significant relationships between value domains and visit interest for
special events and visitor attractions overall were higher than they were for
individual values. The opposite applied for permanent attractions. This lends
support for Hypotheses 6a and 6b, but not for 6c.
Hypothesis 7a:
Value domains are more closely related to consumer attraction visit intention
behaviour than are individual values.
Hypothesis 7b:
Value domains are more closely related to consumer special event visit intention
behaviour than are individual values.
Hypothesis 7c:
Value domains are more closely related to consumer permanent attraction visit
intention behaviour than are individual values.
Comparison of the results in Tables 7.16 and 7.23 shows that the percentage of
statistically significant relationships between value domains and visit intention for
special events and visitor attractions overall were higher than they were for
individual values. It was not possible to determine a result for permanent

203
attractions. This lends support for Hypotheses 7a and 7b, and suggests an
indeterminate result for 7c.
Table 7.24 Incidence of Statistically Significant Relationships between LOV and Three Dimensions of Visitation. Percentage of Results Demonstrating Statistical Significance Actual Visit Visit Overall Value Visitation Interest Intention Visitation Excitement 21 26 24 24 Fun and enjoyment 5 20 15 14 Accomplishment 11 12 14 13 Security 16 8 10 11 Well respected 8 8 13 10 Self respect 8 10 8 9 Warm relationships 11 8 7 8 Belonging 8 6 10 8 Fulfilment 13 2 0 3 ______________________________________________________________________________ Total 100 100 100 100 Table 7.24 indicates that the value ‘excitement’, was clearly the one which
showed the most statistically significant relationships irrespective of which
dimension of visitation was considered. ‘Fun and enjoyment’ was ranked second
in terms of frequent relationships and was especially important for visit interest.
The importance of these two values in relation to special events was not
surprising, although there would be some events, such as religious events, where
such values may not be as important. The importance of these two values, which
make up the hedonic domain, is consistent with the earlier discussion that found
that there were statistically significant differences in terms of this domain between
high and low event visit intention respondents. However, it is interesting to
remember that ‘excitement’ was the lowest ranked of the LOVs in terms of its
mean value and that it was the only value that was not listed by any respondents
as being their most important value.
Most of the other values were similar in terms of the number of statistically
significant relationships, with ‘fulfilment’ being the one that ranked last, being
well behind the other values. The relationships between items in the LOV and
visit behaviour were almost all positive. The main exception to this, which came
as no surprise, was that there was a negative relationship between ‘security’ and

204
visit interest. However, there was generally a positive relationship between
‘security’ and visit intention.
In summary, therefore, the relationship between values using the LOV and special
event visit behaviour was not strong. However, there were more statistically
significant relationships between the LOV and special event behaviour than there
were between the LOV and permanent attraction behaviour. For both special
events and permanent attractions there were more statistically significant
relationships with the LOV for visit intention than there were for visit interest or
actual visitation.
7.7 AIOs
AIOs (Interval)
1
AIO Domains
2Exploratory
Factor Analysis
Table 7.25 Exploratory Factor Analysis of AIOs Factor Groupings of Statement Items
Factor Loading
Eigen- value
Variance Explained (Percentage)
Reliability Coefficient
Self Improvement (AIOF1) 10.10 17.4 0.89 I like to learn about myself. .74 I like to improve my skill and ability. .72 I seek to expand my knowledge. .71 I like to make things more meaningful to me. .70 I like to be involved in activities that require imagination. .70 I seek to satisfy my curiosity. .69 I like to participate in an activity that is mentally challenging. .69 I like to be creative. .68 I enjoy mastering things. .62 I like to be socially competent and skilful. .58 I like to be entertained. .33 Active Outdoors/Sports (AIOF2) 4.41 7.6 0.81 I frequently go sailing or boating. .79 I frequently participate in adventure activities. .71 I frequently water-ski. .65 I frequently go swimming/surfing/diving. .58 I frequently play sport (eg golf, tennis). .57 I frequently go snow skiing. .56 I frequently go fishing. .55 I like to compete against others. .45 I frequently go to a nightclub/disco/or other forms of nightlife. .38 Nature (AIOF3) 3.23 5.6 0.78 I frequently visit animal/wildlife parks or zoos. .76 I frequently visit a national park/forest. .72 I frequently visit a park or garden. .69 I frequently visit a theme, amusement or historic park. .58 I frequently go bushwalking. .47

205
Factor Groupings of Statement Items
Factor Loading
Eigen- value
Variance Explained (Percentage)
Reliability Coefficient
Culture (AIOF4) 2.69 4.6 0.76 I frequently attend the theatre or a concert. .71 I frequently attend a festival, special or sports event. .67 I frequently visit an art gallery or craft centre. .59 I frequently visit a museum or historic site. .56 I frequently go to the cinema/movies. .41 Affiliation/Social (AIOF5) 2.46 4.2 0.72 I enjoy being with my friends. .81 I like to be with people who are enjoying themselves. .74 I frequently visit friends and relatives. .58 I like to interact with others. .49 I like a change of pace from everyday life. .43 Conservative (AIOF6) 1.89 3.3 I like to do things the whole family can enjoy. .65 I believe that religion should be taught in Government schools. .65 I am traditional in my views on social issues and social trends in Australia. .55 I believe that the smoking of marijuana should be made legal. -.47 Stimulation (AIOF7) 1.53 2.6 0.58 I like to talk about an experience afterwards. .62 I like to use my physical abilities. .42 I like to participate in exciting activities. .42 Participating in Causes (AIOF8) 1.41 2.4 0.40 I enjoy participating in activities that are seen to be trendy. .56 I believe that all education should be paid for by the government. .55 I frequently participate in organised tours or group activities. .37 Independence (AIOF9) 1.31 2.3 0.33 I believe that unions have too much power. .71 I believe that people should rely on themselves and not just the government. .62 Away from home (AIOF10) 1.24 2.1 0.50 I frequently go shopping. .74 I frequently dine in restaurants. .46 I frequently go driving to sightsee or just for pleasure. .39 Gambling/Dining (AIOF11) 1.21 2.1 0.35 I frequently gamble, go to a casino, or play gaming machines. .65 I frequently visit a winery. .53 I enjoy food and wine. .48 Peace (AIOF12) 1.19 2.1 0.51 I like to rest and relax. .74 I like to be in a calm atmosphere. .71 Gender Role (AIOF13) 1.08 1.9 N/A I believe that a woman’s role is taking care of the home. .72 Anomie (AIOF14) 1.05 1.8 N/A I feel that I get a raw deal out of life in general. .74 Frugal (AIOF15) 1.02 1.8 N/A I think that it is important to save money rather than spend it all now. .62 Total Variance Explained 61.7
Table 7.25 Exploratory Factor Analysis of AIOs (continued)

206
The mean ratings of the 58 AIO statements ranged from 1.6 up to 6.2 on the
seven-point scale. An EFA using a varimax rotation extracted 15 factors with
eigenvalues in excess of one, that explained 62 per cent of the total variance. The
output of this EFA is contained in Table 7.25.
The face validity of most of the factors that were extracted was quite high. A
number of the later mentioned items within the factors had lower factor loadings,
although all were above the 0.3 that Hair et al (1995) suggest is the minimum
acceptable level for factor loadings. Reliabilities of the first five factors were quite
high but Cronbach’s alpha dropped away substantially for many of the subsequent
factors.
7.7.1 Relationship Between AIOs and the Three Dimensions of Visitation
AIOs (Interval)
1
Actual Visitation (Dichotomous) - All Attractions
- Permanent Attractions - Special Events
2
Visit Interest (Interval)
- All Attractions - Permanent Attractions
- Special Events
3
Visit Intention (Interval)
- All Attractions - Permanent Attractions
- Special Events
4
Correlation
Correlation
Chi-Square Analysis
The approach that was used in an earlier section to examine relationships between
the LOV and the three dimensions of visitation, was repeated with the AIOs in
order to determine the incidence of statistically significant relationships with the

207
three dimensions of visitation. The detailed results of this analysis is presented in
Appendix F.
The results were again broken down into component parts to highlight additional
trends and these findings are summarised in Table 7.26.
Table 7.26 Relationships between the Three Dimensions of Visitation and the AIOs for all Visitor Attractions
Percentage of Statistically Significant Relationships Visitation Dimension
Permanent Attractions
Special Events
Attractions Overall
Actual Visitation 10 24 17 Visit Interest 29 43 35 Visit Intention 32 45 39 Overall 26 35 30 Although the incidence of statistically significant results was much higher
between AIOs and visitation than it was between LOVs and visitation, similar
trends were present. The correlations with AIOs were stronger than found with the
LOV but they were still weak. Again, a greater percentage of relationships with
visit intention was statistically significant than was the case with visit interest,
although the margin between intention and interest for the AIOs was much less
than for the LOVs. The percentage of statistically significant results was again
higher for special events than it was for permanent attractions but the margin
between the two was less than was the case for the LOVs.
Hypothesis 12b:
AIOs are better predictors of generic behaviour (visit interest) than they are of
more concrete behaviour (visit intention).
Hypothesis 13b:
AIOs are better predictors of behaviour in relation to tourism attractions overall,
including special events, than they are of behaviour in relation to special events
alone.

208
The results in Table 7.26 do not provide support for either of the hypotheses listed
above. This result is consistent with the earlier finding in relation to the LOV
which also proved to be more effective at the visit intention level than it was at
the visit interest level.
Table 7.27 presents the incidence of statistically significant results by individual
AIO statement for the statements that accounted for the most significant
relationships.
Table 7.27 provides information on the percentage of statistically significant
relationships with the various dimensions of visitation that were attributable to the
10 AIO statements that showed the greatest number of relationships. It can be
seen that none of the statements accounted for a substantial percentage of the
relationships in its own right.
Table 7.27 Incidence of Statistically Significant Relationships between the AIOs and the Three Dimensions of Visitation Percentage of Results Demonstrating Statistical Significance AIO
Actual Visitation
Visit Interest
Visit Intention
Overall Visitation
I frequently attend a festival, special or sports event
5 3 3 3
I frequently visit a theme, amusement or historic park
2 4 4 3
I like to interact with others 2 3 3 3 I like to participate in exciting activities
2 3 3 3
I frequently visit an art gallery or craft centre
3 3 2 3
I frequently go the cinema / movies
3 2 3 3
I frequently visit animal / wildlife parks / zoos
1 3 3 3
I frequently participate in adventure activities
3 3 2 3
I frequently visit a park or garden
2 2 3 3
I frequently go snow skiing 3 3 2 3 It is possible, however, to identify the statements that accounted for the largest
numbers of statistically significant relationships under each visitation dimension
as well as the statements that accounted for the least numbers under each
dimension. This information is listed below.

209
Actual Visitation
Many: I frequently attend the theatre or a concert.
I frequently attend a festival, special or sports event.
Few: I enjoy mastering things.
I like to be creative.
I enjoy being with my friends.
I believe that a woman’s role is taking care of the home.
Visit Interest
Many: I frequently visit a theme, amusement or historic park.
Few: I like to rest and relax.
Visit Intention
Many: I frequently visit a theme, amusement or historic park.
Few: I like to rest and relax.
Overall
Many: I frequently attend a festival, special or sports event.
I frequently visit a theme, amusement or historic park.
Few: I like to rest and relax.
I frequently go shopping.
The face validity of the AIOs that were involved in the greatest number, and in
the fewest, statistically significant results is high. One would expect a consumer
who rates highly the statements ‘I frequently attend a festival or sports event’ and
‘I frequently attend the theatre or a concert’, to be someone who has a higher
propensity for attraction visitation, in particular, special event visitation.
Similarly, a consumer who rates highly the statement ‘I like to rest and relax’
would be unlikely to have a substantial propensity for attraction visitation as it
would involve a degree of exertion.

210
7.7.2 Demographic Differences Across AIO Profiles
Demographic Variables
(Nominal & Ordinal)
1
AIO Domains
2ANOVAs
In order to assess whether there were statistically significant demographic
differences across psychographic profiles, ‘one way ANOVAs’ were conducted
using demographic variables as independent variables and the AIO factors as the
dependent variables. Table 7.28 summarises the results of this analysis listing the
F-values.
Table 7.28 ANOVA Results - Demographic Variables and AIO Factor Scores F-VALUES DEPENDENT VARIABLES
AGE
GENDER
EDUCATION
FAMILY STATUS
INCOME Self improvement
3.52* 0.17 4.72* 1.24 0.45
Active outdoors
9.98* 36.21* 1.15 3.01* 3.37*
Nature 4.65* 6.85* 1.65 1.58 0.87 Culture 0.67 0.54 5.48* 3.02* 5.35* Affiliation 2.84* 19.13* 2.49* 2.38* 0.30 Conservative 7.67* 5.38* 7.01* 9.65* 2.12 Stimulation 6.29* 3.38 1.79 4.14* 5.65* Participation in causes
2.96* 6.16* 3.33* 1.84 4.22*
Independence 0.41 6.72* 1.64 0.78 4.70* Away from home
2.20 27.90* 0.90 1.75 4.35*
Gambling 1.52 12.41* 1.60 2.62* 3.15* Peace 1.50 11.66* 0.96 1.14 0.51 Gender role 2.01 0.03 2.37* 2.05 1.56 Anomie 10.75* 0.35 1.83 5.61* 3.10* Frugal 0.35 1.37 2.19* 0.26 0.38 *Significant at the p<0.05 level. Overall, there were statistically significant differences in 52 per cent of the
relationships with each of the demographic variables demonstrating a similar
number of statistically significant differences. This indicates that there were some
demographic differences across psychographic profiles that can be summarised as
follows:

211
Self improvement > 30 years of age, no past secondary education
Active outdoors >40 years of age, male, married, income < $50K
Nature < 30 or >60 years of age, male
Culture No past secondary education, married, income <$30K
Affiliation >30 years of age, male, tertiary educated, no children
Conservative <40 years of age, male, tertiary educated, no children
Stimulation >40 years of age, income <$30K
Participation in causes >30 years of age, female, income >$50K
Independence Female, income <$50K
Away from home Male, income <$50K
Gambling Female
Peace Male
Gender role Post secondary education
Anomie >50 years of age, married, income >$30K
Frugal Incomplete education levels
7.8 Demographics
Demographics(Nominal and
Ordinal)
1
Actual Visitation (Dichotomous) - All Attractions
- Permanent Attractions - Special Events
2
Visit Interest (Interval)
- All Attractions - Permanent Attractions
- Special Events
3
Visit Intention (Interval)
- All Attractions - Permanent Attractions
- Special Events
4
Chi-Square Analysis
ANOVA
ANOVA

212
Once again, the approach that was used in an earlier section to examine
relationships between the LOV and the three dimensions of visitation, was
repeated with demographics in order to determine the incidence of statistically
significant relationships with the three dimensions of visitation. In considering
demographics, ‘age’, ‘education’, ‘income’, ‘gender’ and ‘family status’ were
used. Table 7.29 summarises the results in terms of the percentage of statistically
significant relationships in each of the visitation dimensions.
Table 7.29 Relationships between the Three Dimensions of Visitation and Demographics for all Visitor Attractions
Percentage of Statistically Significant Relationships Visitation Dimension
Permanent Attractions
Special Events
Attractions Overall
Actual Visitation 19 24 21 Visit Interest 28 34 31 Visit Intention 22 30 26 Overall 23 29 26 It was found that there were more statistically significant results for the ‘age’ and
‘education’ variables than there were for any of the other demographic
dimensions.
Hypothesis 12c:
Demographics are better predictors of generic behaviour (visit interest) than they
are of more concrete behaviour (visit intention).
Hypothesis 13c:
Demographics are better predictors of behaviour in relation to tourism attractions
overall, including special events, than they are of behaviour in relation to special
events alone.
In terms of the percentage of statistically significant relationships overall,
demographics was ahead of the LOV but behind AIOs. As was found with the
LOV and AIOs, there was a larger percentage of statistically significant
relationships between demographics and special events than there was with
permanent attractions. This does not provide support for Hypothesis 13c.

213
Unlike the results for LOVs and AIOs, however, there were more statistically
significant relationships between demographic variables and visit interest than
there were with visit intention or actual visitation. This finding applied for both
special events and permanent attractions. This suggests that demographic
variables may be better indicators of more abstract behaviour than they are of
specific behaviour. This provides support for Hypothesis 12c.
7.8.1 Relationships of Demographic Variables to LOV
Demographic Variables
(Nominal & Ordinal)
1
List of Values (Interval)
2ANOVAs
In order to assess the relationship between demographic variables and the LOV,
ANOVAs were calculated. The results of this analysis are summarised in the
Table 7.30 which presents the F-values.
Table 7.30 ANOVA Results - Demographic Variables and items in the LOV F-VALUES VALUE
FAMILY STATUS
INCOME
AGE
EDUCATION
GENDER
Self fulfilment 1.66 0.87 1.67 1.50 0.36 Security 1.25 1.30 1.20 5.17* 9.68* Accomplishment 2.46* 0.70 0.66 0.79 0.02 Belonging 2.80* 1.67 3.39* 1.20 9.53* Warm relationships 1.60 0.40 1.18 0.63 18.50* Well respected 0.52 1.12 1.79 0.52 3.74 Excitement 0.26 0.18 5.66* 1.54 0.65 Self respect 0.91 0.47 0.69 1.07 9.45* Fun and enjoyment 0.69 1.25 6.33* 0.67 5.84* *Significant at the p<0.05 level. Several studies were reported earlier that suggested that there is a relationship
between values and demographic variables, but the results in Table 7.29 suggest
that this relationship is not strong and, indeed, only for ‘gender’ was the
percentage of statistically significant relationships in excess of 50.

214
Hypothesis 11a:
There is a positive relationship between age and the items in the LOV.
Hypothesis 11b:
There is a positive relationship between education and the items in the LOV.
Hypothesis 11c:
There is a positive relationship between family status and the items in the LOV.
Hypothesis 11d:
There is a positive relationship between income and the items in the LOV.
Hypothesis 11e:
There is a positive relationship between gender and the items in the LOV.
Results in Table 7.30 enable testing of the five hypotheses listed above with the
outcome that there was no support for Hypothesis 11d and partial support for all
of the others.
7.9 Global Visitation Variable
List of Values (Interval)
1
AIOs (Interval)
2
Demographics (Nominal and Ordinal)
3
Global Summates - Visit History - Visit Interest - Visit Intention
(Interval)
4
Correlation
Correlation
ANOVA
Using an approach discussed by Menon and Wilcox (1994), three new summate
variables were calculated to represent global indications of tourism behaviour.

215
The first one, ‘vishist’, was the sum of each respondent’s actual visitation score to
each of the 34 attractions; the second, ‘visinter’, was a similar summation of each
respondent’s interest in visiting each of the attractions; the final new variable,
‘visinten’, was the summation of each respondent’s intention to visit each of the
attractions. Descriptives for these new variables are presented in Table 7.31. The
score range for the first variable was 34 to 68 (that is, 34*1 up to 34*2), whilst the
second two variables could range from 34 to 238 (that is , 34*1 up to 34*7). Correlations were run between these three new variables and each of the LOV and
the AIOs, whilst ANOVAs were run between the new global summates and the
demographic variables. The results, in terms of the number of statistically
significant correlations, are summarised in Table 7.32.
Table 7.31 Descriptives for Global Visitation Variables Mean Standard Minimum Maximum Variable Value Deviation Value Value VISINTER 120.0 30.4 34 216 VISINTEN 101.0 31.2 34 185 VISHIST 44.8 4.4 34 60
Table 7.32 Relationship between Global Visitation Variables and Segmentation Approaches Percentage of Statistically Significant Relationships Visit History Visit Interest Visit Intention LOVs 11 33 56 AIOs 59 79 79 Demographics 20 40 40 The AIOs produced a larger percentage of statistically significant results than did
either the LOV or the demographic variables using the global summate variables
which is consistent with the result obtained using individual visitor attractions.
However, the overall percentages of significant results were about the same for
the LOV and the demographic variables using the global summate variables. It
was also interesting to note that the percentage of significant results was the same
for visit interest and visit intention for both the AIOs and the demographic

216
variables, unlike the earlier individual attraction analysis where visit intention
consistently exceeded visit interest.
The AIOs that demonstrated statistically significant relationships with the global
interest visitation variable were virtually the same as those demonstrating
relationships with the global intention visitation variable. It was interesting to note
that of the 12 AIO statements that did not demonstrate significant relationships,
four made up the sixth AIO factor which was named ‘conservative’. The
remaining six AIOs which did not demonstrate significant relationships included
items such as ‘I like to rest and relax’, ‘I frequently go fishing’, ‘I feel that I get a
raw deal out of life’, and ‘I frequently go shopping’. It is not surprising that these
statements did not show significant relationships with variables based on
attraction visitation.
In relation to the LOV, the items that showed the greatest number of statistically
significant relationships with the global visitation variables were ‘excitement’,
‘fun and enjoyment’ and ‘accomplishment’.
7.10 Correlation Between the LOVs and the AIOs
List of Values (Interval)
1AIOs
(Interval)
2Correlation
Correlations were run between the LOV and the AIOs with the table of results
being presented in Appendix G. Overall, 53 per cent of the correlations were
statistically significant and the distribution of statistically significant relationships
was fairly evenly spread across all values, although the values ‘Excitement’, ‘Fun
and enjoyment’ and ‘Accomplishment’ had a greater incidence of significance,
whilst the values ‘Security’ and ‘Belonging’ had slightly less. These findings have
high face validity.

217
7.11 Past Visitation as a Predictor of Visit Interest and Visit Intention
Past Visitation (Dichotomous)
1
Visit Interest (Interval)
2
Visit Intention (Interval)
3
ANOVA
In order to assess the importance of past visitation of specific attractions in
influencing future visit interest and visit intention of those same attractions,
ANOVAs were calculated using past visitation as the independent variable and
visit interest and visit intention as dependent variables.
For the permanent attractions, 61 per cent demonstrated statistically significant
relationships with respect to visit interest and 50 per cent for visit intention. It was
interesting to note that none of the ‘pure tourism attractions’, namely, Sovereign
Hill, Penguin Parade and Puffing Billy, had statistically significant relationships
on either interest or intention.
For the special events, all except for the Comedy Festival and the Olympic Games
demonstrated statistically significant relationships for both visit interest and visit
intention. Thus, 88 per cent of the events demonstrated statistically significant
relationships between past visitation and visit interest and intention.
These findings provide the basis to support the following four hypotheses:
Hypothesis 15a:
There is a positive relationship between past visitation and overall attraction visit
interest.
Hypothesis 15b:

218
There is a positive relationship between past visitation and overall attraction visit
intention.
Hypothesis 16a:
Past visitation provides a stronger indication of special event visit interest than it
does of permanent attraction visit interest.
Hypothesis 16b:
Past visitation provides a stronger indication of special event visit intention than it
does of permanent attraction visit intention.
The degree of satisfaction is an important determinant of whether one would
consider re-visiting an attraction, and no measure of satisfaction was included in
this study. Therefore, care must be exercised regarding the conclusions that are
drawn from the results relating to past visitation. However, the results quite
clearly demonstrated more statistically significant relationships between past
visitation and future behaviour for special events than for permanent attractions.
This could possibly be explained by the very nature of events themselves in that
they are more likely to change each time they are held than are permanent
attractions. Therefore, if one is satisfied with the experience at a special event, it
is more likely that one would be interested in returning in the future knowing that
what will be on offer will not be exactly duplicated.

219
7.12 Prediction of Actual Special Event Visitation
List of Values (Interval)
1
AIOs (Interval)
2
Demographics (Nominal and
Ordinal)
3
Actual Event Visitation
(Dichotomous)
4
Discriminant Analysis
Discriminant Analysis
Discriminant Analysis
It is recognised that the term ‘prediction’ used in this study is not strictly correct,
given that the actual visitation that is being predicted had already occurred.
However, the term seemed more appropriate and self explanatory than other terms
that could be used to describe this procedure, such as ‘backcasting’.
In order to compare the performance of the LOV, the AIOs and the demographic
variables (age, income, education, gender and family status) in predicting actual
event visitation, discriminant analysis was employed. In this analysis, the LOV,
the AIOs and demographics were each used separately as the independent
variables to predict actual visitation of the special events listed in the
questionnaire.
Overall, it was found that demographics were able to correctly classify 58 per cent
of cases, the LOV was able to correctly classify 59 per cent of cases and the
AIOs, 73 per cent. Given that by chance alone, one should be able to correctly
classify 50 per cent of respondents, the performance of the LOV and
demographics were only slightly better than would have been attained purely by
chance. The AIOs performed substantially better than both demographics and the
LOV in terms of their ability to correctly classify respondents with respect to
actual visitation.

220
7.13 Prediction of Event Visit Intention
List of Values AIOs
Demographics Visit History Visit Interest
1Event Visit
Intention [Each Event and Global Summate] (Interval)
2
Stepwise
Multiple Regression
Stepwise multiple regressions were used to compare the performance of a range of
independent variables, taken separately and in combination, in predicting visit
intention of the events listed in the questionnaire, as well as the global event visit
intention summate. The independent variables that were used in the regression
analysis were the LOV, demographics, the AIOs, visit history, and visit interest.
Of the demographic variables, only ‘gender’ was measured using a dichotomous
scale. Therefore, it was necessary to convert the other four demographic variables
to dichotomous variables for the regressions. The demographic variables ‘age’,
‘income’, and ‘education’ were also converted to dichotomous variables based on
median splits, and the demographic variable ‘family status’, which was not
ordered, was converted to a dichotomous variable based on whether there were
children at home.
Table 7.33 presents the coefficients of determination (mean adjusted R-square
values), that were obtained across all the events and the global event summate for
each series of stepwise multiple regressions using different independent variables.
This indicates, not unexpectedly, that ‘visit interest’ was by far the best indicator
of ‘visit intention’. The Adjusted R-squares for the LOV, AIOs, demographics
and the combinations of the three were all very low, particularly for the LOV and
demographics. However, according to Frank, Massy and Wind (1972), cited in
Novak and MacEvoy (1990), low R-squares were “typical of values found using
general customer characteristics as segmentation bases” (p. 107). Novak and
MacEvoy further suggested that R-squares as low as one per cent could be
considered important which is lower than the values obtained in this analysis.

221
Table 7.33 Multiple Regressions Using Various Independent Variables to Explain Event Visit Intention Mean Adjusted INDEPENDENT VARIABLES R-Squares LOV 0.04 Demographics 0.06 AIOs 0.20 LOV and Demographics 0.08 AIOs and Demographics 0.22 LOV and AIOs 0.21 LOV, AIOs and Demographics 0.23 Visit History 0.19 Visit Interest 0.74 LOV, AIOs, Demographics and Visit Interest 0.77 LOV, AIOs, Demographics and Visit Interest All Events 0.77
With respect to the LOV, it should be noted that the most important value by far
was ‘excitement’ which for many of the regressions was the only value to enter
the regression equation.
Hypothesis 19:
The items in the LOV are better able to predict special event visit intention than
are AIOs.
Hypothesis 20:
The items in the LOV are better able to predict special event visit intention than
are the demographic variables.
Hypothesis 21:
A combination of the items in the LOV and the demographic variables is better
able to predict special event visit intention than are AIOs.
Hypothesis 22a:
The items in the LOV are better able to predict special event visit intention than is
past visitation.

222
Hypothesis 22b:
AIOs are better able to predict special event visit intention than is past visitation.
Hypothesis 22c:
Demographic variables are better able to predict special event visit intention than
is past visitation.
The results presented in Table 7.33 enable testing of the six hypotheses listed
above with the outcome that only Hypothesis 22b could be supported.
The results that were obtained in this study can be contrasted with those reported
by Novak and MacEvoy (1990) which compared the R-squares in a similar
fashion, although VALs was used in the Novak and MacEvoy study instead of
AIOs. In the Novak and MacEvoy study, 64 activities and media usage habits
were used as the dependent variables. The numbers in Table 7.34 refer to median
values of the Adjusted R-squares.
As has been discussed earlier, Kahle, Beatty and Homer (1986) claimed that the
LOV had greater predictive ability in terms of consumer behaviour than did
VALS. Novak and MacEvoy refuted this claim suggesting that the predictive
ability of the LOV had been increased due to the inclusion of demographics with
the LOV items in the Kahle, Beatty and Homer study.
The results obtained in this study are generally similar to those found by Novak
and MacEvoy (1990) except for the performance of the AIOs. The AIOs achieved
an adjusted R-square in this study that was substantially better than the adjusted
R-square that was achieved for VALS in the Novak and MacEvoy study. The fact
that the AIOs are undoubtedly different to the VALS that was used in Novak and
MacEvoy (1990) likely explains much of the difference in performance between
the two but, unfortunately, it is not possible to explore this further given that
VALS is a proprietary instrument. It is clear that the LOV was the poorest
performer in both studies and in both cases resulted in R-squares that were lower
than those achieved by demographics alone.

223
Table 7.34 Comparison of the Results of Multiple Regressions Conducted Using Various Independent Variables in Two Studies Median Adjusted R-Squares
INDEPENDENT VARIABLE(S) Novak & MacEvoy This Study VALS (or AIOs) .03 .21 LOV .01 .03 Demographics .04 .06 LOV and Demographics .05 .08 VALS (or AIOs) and Demographics .05 .22
The fact that even demographics performed at a higher level than values poses
serious doubts about the effectiveness of using values as a basis for explaining
and predicting consumer behaviour in relation to attractions. However, the issue
of whether the values per se are ineffective or simply the instrument that is being
used to measure them is not valid, needs to be explored. This will be discussed
further in the next chapter.
7.14 Comparing High Event Visit Intention Respondents with Low Event Visit Intention Respondents
Values -List of Value Domains
-List of Value Items (Interval)
1
AIO Domains (Interval)
2
Demographics (Nominal and
Ordinal)
3
Event Visit Intention - High - Low
4
T-Test
Chi-Square
T-Test
New global summate variables were formed based on respondents’ actual
visitation, visit interest and visit intention in relation to special events. These new

224
global event summates were then converted into dichotomous variables based on
median splits. Comparisons were made between respondents in the high event
visit intention group and those in the low event visit intention group. Chi-square
analyses and t-tests were conducted to determine whether there were statistically
significant differences between the two groups on a number of dimensions. Table 7.35 shows that there were statistically significant differences on some of
the demographic variables between the two groups split on their event visit
intention. Age, education and family status showed differences whilst income and
gender did not. Those with high event visit intention tended to be younger (under
30), they were more likely to be tertiary educated, and they were less likely to be
married than those with low event visit intention.
The results presented in Table 7.35 enable the following hypotheses to be tested.
Hypothesis 28a:
There is a difference with respect to age between those with high special event
visit intention and those with low special event visit intention.

225
Table 7.35 Demographic Characteristics of High and Low Visit Intention Respondents Low Event High Event Visit Intention Visit Intention Characteristic of Respondents (Percentage) (Percentage) Sex Male 40.4 49.3 Female 59.6 50.7 Chi-square = 3.57, df=1, p=0.06 Age 18-19 2.2 10.3 20-29 15.1 32.7 30-39 23.1 21.1 40-49 19.6 21.1 50-59 16.0 8.5 60 and above 24.0 6.3 Chi-square = 54.91, df=5, p<0.01 Income ($/year) Less than 10000 11.1 8.5 10000-29999 32.9 21.5 30000-49999 18.7 26.0 50000-69999 15.1 17.0 70000-99999 8.0 11.2 100000 & above 4.9 7.6 Chi-square = 13.67, df=5, p=0.09 Education Primary 3.6 0.4 Some secondary 29.8 20.2 Completed secondary 13.3 14.8 Some technical etc 5.8 4.5 Completed technical etc 10.2 7.6 Some tertiary 14.2 22.4 Completed tertiary 23.1 30.0 Chi-square = 17.03, df=6, p=0.01 Family Status Married, children at home 38.2 39.5 Married, no children at home 23.6 8.5 Married, no children 6.2 7.6 Not married, children at home 6.7 4.5 Never married, no children at home 13.8 34.5 Widowed, no children at home 5.3 1.8 Divorced, no children at home 6.2 3.6 Chi-square = 42.59, df=6, p<0.01
Hypothesis 28b:
There is a difference with respect to gender between those with high special event
visit intention and those with low special event visit intention.
Hypothesis 28c:

226
There is a difference with respect to education between those with high special
event visit intention and those with low special event visit intention.
Hypothesis 28d:
There is a difference with respect to family status between those with high special
event visit intention and those with low special event visit intention.
Hypothesis 28e:
There is a difference with respect to income between those with high special event
visit intention and those with low special event visit intention.
Since there are statistically significant differences for age, education and family
status, Hypotheses 28a, 28c and 28d can be supported but Hypotheses 28b and
28e can not.
Independent sample t-tests were used to examine whether there were differences
with respect to psychographic domains, value domains and LOV items between
those respondents identified as having high event visit intention versus those
identified as having low event visit intention. The results of these t-tests are
presented in Table 7.36. Table 7.36 shows that there were statistically significant differences with respect
to eight of the 12 psychographic domains. Of the domains for which there were
statistically significant differences, only for ‘gender role’ was the mean value of
the high event visit intention group lower than that of the low group. This result is
not surprising given that this particular domain likely reflects a more traditional
group who would not be inclined to patronise events. The face validity of the
other psychographic domains that demonstrated statistically significant
differences in the other direction was quite high except for ‘anomie’. It was
surprising that a group comprising people believing that they get ‘a raw deal out
of life’ would show more intention to patronise events.
Table 7.36 T-test Results between Respondents having High Event Visit Intention and those having Low Event Visit Intention

227
Low Visit High Visit Intention Intention Means Means t-test Psychographic Domains Self improvement 5.15 5.52 -1.5 Active outdoors/sports 2.06 2.85 -5.26* Nature 3.42 3.85 -0.69 Culture 3.25 4.06 -5.65* Affiliation/social 5.55 5.97 -3.46* Conservative 4.05 3.99 0.9 Stimulation 4.76 5.38 -2.63* Participating in causes 3.29 3.97 -3.37* Independence 4.49 4.46 0.9 Away from home 3.98 4.41 0.6 Gambling/dining 2.76 3.26 -2.37* Peace 5.60 5.60 1.1 Gender role 2.96 2.35 3.91* Anomie 2.34 2.54 -2.92* Frugal 5.02 5.26 -0.11 Value Domains Achievement 5.75 6.04 -2.92* Affiliation 5.90 6.10 -1.87 LOV Items Excitement 4.94 5.57 -4.54* Fun and enjoyment 6.00 6.32 -3.24* Security 6.12 6.15 -0.38 Belonging 5.41 5.61 -1.58 Being well-respected 5.78 6.01 -2.03* Self-fulfilment 6.04 6.17 -1.24 Accomplishment 5.65 6.00 -3.08* Self-respect 6.31 6.52 -2.42* Warm relationships 6.11 6.24 -1.23 *Significant at the p<0.05 level.
It was interesting to note that the affiliation domain based on the LOV did not
demonstrate statistically significant differences whilst the affiliation domain in the
psychographics section did. Five of the nine LOV items demonstrated statistically
significant differences between the two groups and as would be expected, the
differences for the ‘excitement’ and ‘fun and enjoyment’ items were the greatest.
In line with earlier findings, ‘security’ showed small differences between the two
groups.
The results in Table 7.36 provides partial support for the following two
hypotheses.
Hypothesis 26:

228
There is a difference with respect to value domain profile between those with high
special event visit intention and those with low special event visit intention.
Hypothesis 27:
There is a difference with respect to psychographic profile between those with
high special event visit intention and those with low special event visit intention.
7.15 Discriminant Analysis to Classify Visit Intention
List of Values (Interval)
1
AIOs (Interval)
2
Demographics (Nominal and
Ordinal)
3
Event Visit Intention
-High -Low
5
Visit History (Dichotomous)
6
Visit Interest (Interval)
7
DiscriminantAnalysis
Discriminant
Analysis
DiscriminantAnalysis
Discriminant
AnalysisDiscriminant
Analysis
Visit interest and visit intention for each of the events listed in the questionnaire
were converted to dichotomous variables based on median splits. The
demographic variables were converted to dichotomous variables as discussed in
an earlier section. Discriminant analysis was conducted using ‘event visit
intention’ as the grouping variable and the LOV, the AIOs, demographics, visit
history and visit interest as independent variables.
It was found that the LOV was able to correctly categorise the event visit
intention for 59 per cent of respondents, demographics 60 per cent, the AIOs 75
per cent, and all three together 79 per cent. If actual visit history was added, the
correct classification increased to 83 per cent and if visit interest was
subsequently added, correct classification increased to 91 per cent. One should be
careful with this, however, as although visit interest is a distinct variable from
visit intention, the two are very closely aligned.

229
The LOV was a poor predictor of behaviour at both the specific event level and
for events overall, as determined using the global summate.
7.16 Comparison Between First Time and Repeat Visitors
List of Value Domains (Interval)
1
AIO Domains (Interval)
2
Demographics (Nominal and
Ordinal)
3
First-time Event Visitor
4
Repeat Event Visitor
5Chi-Square
ANOVA
ANOVA
The literature has suggested that there are differences between first time visitors
and repeat visitors at recurring special events, with respect to motives and other
characteristics. Given that no question was used in this study that asked about
repeat visitation, assumptions had to be made regarding repeat visitation at
specific events. The assumptions were based upon visitation history at the events
which was measured, as well as respondents’ future visitation intention, which
was also measured. It was assumed that first time visitors would be those who had
not visited a specific event but had high intention to do so. Similarly, it was
assumed that repeat visitors were those who had visited a specific event and had
high intention to do so again.
Chi-square analyses were conducted for each event comparing event visit
intention (high and low) with past visitation (yes and no) in order to assess
whether there were differences between visitation and visit intention. Table 7.37
indicates the events for which statistically significant results were obtained and it
can be seen that there were statistically significant differences for 69 per cent of
the events. It was somewhat surprising to note that of the five events which did

230
not demonstrate significant differences, three of them related to community shows
or festivals.
Table 7.37 Chi-square Analysis - Event Visit Intention and Past Visitation Chi-square Event Result Ford Australian Open Tennis 28.28* Spring Racing Carnival 6.79* International Festival of the Arts 17.70* Australian Formula One Grand Prix 6.87* Royal Agricultural Society of Victoria Show 0.03 Melbourne Food and Wine Festival 27.32* Australian Motorcycle Grand Prix 7.28* Melbourne International Comedy Festival 16.87* Melbourne Moomba Festival 3.23 Australian Football League Grand Final 13.11* Bells Beach Surf Classic 9.36* A Commonwealth or Olympic Games 0.03 Australian International Air Show 0.11 A Major Sporting Event held in Victoria 11.36* A Regional Community Festival or Fair in Victoria 3.21 A Major Cultural Event held in Victoria 6.33* *Significant at the p<0.05 level. Chi-square analyses were then conducted for each event to determine whether
there were differences between first time and repeat visitors. In these analyses,
actual visitation (yes and no) was run against the dichotomous visit intention
variable formed by splitting the event visit intention variable about the median.
Table 7.38 shows that differences were statistically significant for all events
except the Olympics. In order to see if there were demographic differences between first time and
repeat visitors, Chi-square analyses were conducted for those who had visited
each event and those who had not, both groups having high visit intention on each
particular event. That is, Chi-square analyses were conducted of demographic
variables and visitation for each event using visit intention for that event as a
covariate. Table 7.39 presents the Pearson coefficients and the asterisks denote the
results that were statistically significant. Abbreviations for the events have been
used in Table 7.38 in order to keep the table to a manageable size. The order of
events is the same as in the previous tables.
Table 7.38 Chi-square Analysis - First Time and Repeat Visitors Chi-square

231
Event Result Ford Australian Open Tennis 108.48* Spring Racing Carnival 64.82* International Festival of the Arts 110.48* Australian Formula One Grand Prix 45.61* Royal Agricultural Society of Victoria Show 12.93* Melbourne Food and Wine Festival 92.31* Australian Motorcycle Grand Prix 28.17* Melbourne International Comedy Festival 63.84* Melbourne Moomba Festival 4.18* Australian Football League Grand Final 76.79* Bells Beach Surf Classic 26.74* A Commonwealth or Olympic Games 1.20 Australian International Air Show 17.75* A Major Sporting Event held in Victoria 137.62* A Regional Community Festival or Fair in Victoria 117.92* A Major Cultural Event held in Victoria 95.39* *Significant at the p<0.05 level.
Table 7.39 Chi-square Analysis - Demographic Variables and Repeat Visitation Family Event Age Education Status Income Gender Ford Open Tennis 1.68 11.45 4.33 11.24 0.97 Spring Racing 21.76* 8.58 8.89 4.88 7.92 Festival of Arts 10.52 5.00 6.67 6.76 0.03 Formula One GP 3.73 11.36 5.89 10.84 4.28 Melbourne Show 7.87 10.04 8.00 10.18 2.11 Food and Wine Fest. 6.41 6.73 6.72 3.15 0.05 Motorcycle GP 6.59 9.27 5.40 11.73 4.30* Comedy Festival 4.24 7.91 11.56 3.19 0.27 Moomba 10.82 1.98 2.29 3.92 0.63 AFL Grand Final 13.32* 4.82 12.27 5.62 0.84 Bells Beach Surf 4.65 5.25 12.33 3.29 0.08 Com. Games/Olympics 42.60* 9.66 17.15* 7.78 1.59 Air Show 2.49 8.59 3.61 9.91 1.91 Major Sport Event 14.44* 4.10 12.72* 6.88 0.70 Regional Festival 2.07 8.64 4.96 8.56 0.96 Major Cultural Event 11.57* 6.10 9.29 8.01 1.19 *Significant at the p<0.05 level. It has been suggested in the literature that there are no demographic differences
between first time and repeat visitors at special events (see, for example, Mohr,
Backman, Gahan and Backman 1993). The results presented in the table above
lend support to this in that only 10 per cent of the events included in the
questionnaire demonstrated any statistically significant demographic differences
between first time and repeat visitors, and of these, five were related to age.
In order to assess whether there were differences across the LOV factors and the
AIO factors between first time and repeat visitors, multivariate ANOVAs

232
(MANOVAs) were calculated using actual visitation of a given event as the
independent variable (yes or no), and the two LOV factors and the 15 AIO factors
respectively as the dependent variables. The data file was split on the ‘intention to
visit that attraction variable’ (a dichotomous variable based on a median split) and
the analysis was restricted to those who were high on visit intention. The
MANOVAs produced statistically significant F-scores for two of the 32 LOV
domain options and 26 of the 240 psychographic domain options.
Thus, there were few statistically significant differences across value and AIO
factors for first time and repeat visitors. This contrasts with the findings of Mohr,
Backman, Gahan and Backman (1993) who found that there were differences in
terms of event motives between first time and repeat festival visitors.
This analysis suggests that none of the following seven hypotheses should be
supported.
Hypothesis 23:
There is a difference with respect to the items in the LOV between one-time and
repeat visitors to special events.
Hypothesis 24:
There is a difference with respect to AIOs between one-time and repeat visitors to
special events.
Hypothesis 25a:
There is a difference with respect to age between one-time and repeat visitors to
special events.
Hypothesis 25b:
There is a difference with respect to gender between one-time and repeat visitors
to special events.
Hypothesis 25c:

233
There is a difference with respect to education between one-time and repeat
visitors to special events.
Hypothesis 25d:
There is a difference with respect to family status between one-time and repeat
visitors to special events.
Hypothesis 25e:
There is a difference with respect to income between one-time and repeat visitors
to special events.
For event organisers, it is important to be able to identify differences between
one-time and repeat patrons in order to streamline marketing campaigns. This
study has not been able to identify any such differences based on demographics,
psychographics or values. However, one must be extremely careful in the
interpretation of the findings here given that no information regarding satisfaction
was obtained. The earlier reported success of Mohr, Backman, Gahan and
Backman (1993) using motives to identify differences between the two groups
suggests that further work on motives may be more rewarding in this area.
7.17 Cluster Analysis In all of the clustering that follows, the K-Means technique was used. One of the
most difficult parts of clustering is in determining the appropriate number of
clusters to select as no objective selection procedure exists (Hair, Anderson,
Tatham and Black 1995). Hair et al (1995) implied that most cluster analyses
would use clusters between three and six in number and that it was best to conduct
the cluster analysis for a range of cluster solutions. Some a priori criteria could
then be used to decide on the best cluster solution. Since the objective of this
analysis was to use the clusters to explain behaviour in relation to event visit
intention, it was decided that the a priori selection criterion would be the
incidence of statistically significant differences in terms of event visit intention at
the range of events listed in the questionnaire. To achieve this, one-way ANOVAs
were calculated for each of the cluster solutions ranging from two to six clusters,

234
of cluster membership (independent variable) and event visit intention (dependent
variable). The solution with the highest number of statistically significant
differences was selected as the optimum solution in each cluster analysis.
7.17.1 Clustering of Value Segments (As Determined by LOV Factor Scores)
List of Value Domains (Interval)
1
Value Segment Clusters
2
K-Means Cluster Analysis
Global Event Visit Intention
(Interval)
3
Event Visit Intention Factors
(Interval)
4
Specific Event Visit Intention
(Interval)
5
Demographics (Nominal and
Ordinal)
6
AIO Factors (Interval)
7MANOVA
Chi-Square
ANOVA
MANOVA
MANOVA
The clustering was based upon respondents’ two LOV factor scores and was
conducted for solutions ranging from two to six clusters. The distribution of the
number of cases under the various solutions is presented in Table 7.40.
Table 7.40 The Number of Members in the Various Cluster Solutions for Value Segments (as determined by LOV factor scores)
Cluster One
Cluster Two
Cluster Three
Cluster Four
Cluster Five
Cluster Six
2 Cluster Solution 335 113 3 Cluster Solution 132 239 72 4 Cluster Solution 2 248 96 102

235
5 Cluster Solution 182 77 118 69 2 6 Cluster Solution 2 169 91 37 108 41
‘One-way ANOVAs’ were used to assess the ability of the various cluster
solutions to show statistically significant differences with respect to event visit
intention at the range of events listed in the questionnaire. Using this approach,
the four cluster solution was selected.
Table 7.41 Cluster Centres for the Four Cluster Solution Cluster 1 Cluster 2 Cluster 3 Cluster 4 Value (n=2) (n=248) (n=96) (n=102) Achievement 1.28 0.30 -1.42 0.58 Affiliation -5.80 0.59 -0.34 -0.99 Based on the figures presented in Table 7.41, it can be seen that the first cluster
included those who were driven by the need for achievement and had very little
regard for affiliation. Since this cluster contained only two members, it was
regarded as unrepresentative of the sample and deleted from further analysis
(Hair, Anderson, Tatham and Black 1995; Madrigal and Kahle 1994). Cluster two
comprised those who regarded both achievement and affiliation as important,
although the latter more so. The third cluster comprised those who had little
regard for either achievement or affiliation whilst the fourth cluster comprised
those who were driven by the need for achievement and had little regard for
affiliation. This final cluster was a more moderate version of the first cluster
where members were not as extreme in their need for achievement and disdain for
affiliation as were the members of cluster one. After the deletion of cluster one,
the remaining clusters represented quite distinct value domains.
The next part of the analysis was to determine whether there were differences in
‘event visit intention’ importance ratings across clusters comprising respondents
grouped on the basis of their value systems. Multivariate analysis of variance
(MANOVA) calculations using the value clusters as the independent variables
were used to test this. The analyses were run at three levels of event visit
intention:
1. global, using the global event visit intention summate,
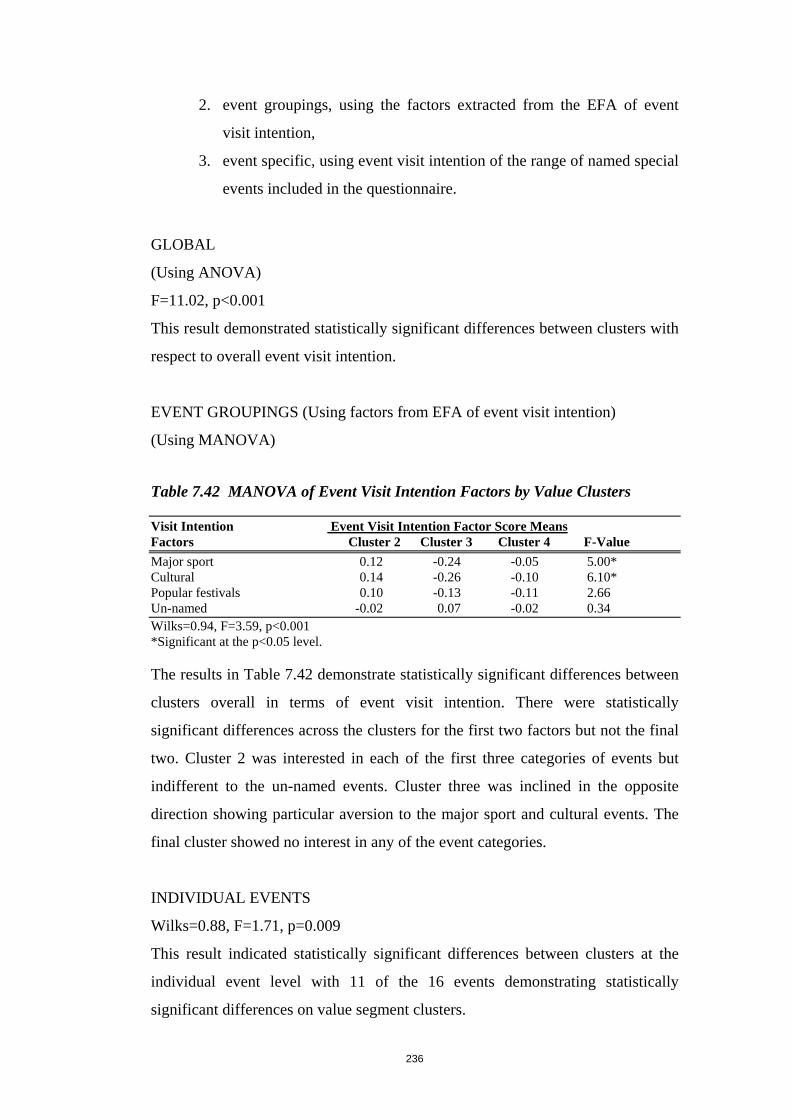
236
2. event groupings, using the factors extracted from the EFA of event
visit intention,
3. event specific, using event visit intention of the range of named special
events included in the questionnaire.
GLOBAL
(Using ANOVA)
F=11.02, p<0.001
This result demonstrated statistically significant differences between clusters with
respect to overall event visit intention.
EVENT GROUPINGS (Using factors from EFA of event visit intention)
(Using MANOVA)
Table 7.42 MANOVA of Event Visit Intention Factors by Value Clusters Visit Intention Event Visit Intention Factor Score Means Factors Cluster 2 Cluster 3 Cluster 4 F-Value Major sport 0.12 -0.24 -0.05 5.00* Cultural 0.14 -0.26 -0.10 6.10* Popular festivals 0.10 -0.13 -0.11 2.66 Un-named -0.02 0.07 -0.02 0.34 Wilks=0.94, F=3.59, p<0.001 *Significant at the p<0.05 level. The results in Table 7.42 demonstrate statistically significant differences between
clusters overall in terms of event visit intention. There were statistically
significant differences across the clusters for the first two factors but not the final
two. Cluster 2 was interested in each of the first three categories of events but
indifferent to the un-named events. Cluster three was inclined in the opposite
direction showing particular aversion to the major sport and cultural events. The
final cluster showed no interest in any of the event categories.
INDIVIDUAL EVENTS
Wilks=0.88, F=1.71, p=0.009
This result indicated statistically significant differences between clusters at the
individual event level with 11 of the 16 events demonstrating statistically
significant differences on value segment clusters.

237
Hypothesis 17:
Segments comprising people with similar value systems differ in their behaviour
in relation to special events.
These results suggest that segments comprising people with similar value systems
differ in their event visit intention at three levels of event visitation, namely,
global, event groupings, and specific events. This provides support for Hypothesis
17.
In order to assess whether demographic differences between clusters may have
contributed to the differences between clusters noted above, chi-square analyses
were conducted for demographic variables and cluster membership, and the
results are reported in Table 7.43. Gender and age were the only demographic variables that demonstrated
statistically significant differences across value segments which suggests that the
differences in event preferences were, indeed, largely explained by differences in
value preferences. That is, personal value systems seem to be better predictors of
special event preferences than demographic segmentation, which is consistent
with the findings of Madrigal and Kahle (1994).

238
Table 7.43 Chi-square Analysis - Demographic Variables and Value Clusters CLUSTERS TWO THREE FOUR Characteristic of Respondent (%) (%) (%) Sex Male 37 53 56 Female 63 47 44 Chi-square = 13.70, df=2, p=0.001 Age 18-19 10 1 3 20-29 24 19 29 30-39 20 26 23 40-49 22 18 19 50-59 11 15 14 60 and above 13 21 12 Chi-square = 19.30, df=10, p=0.037 Income ($/year) Less than 10000 9 16 10 10000-29999 31 31 26 30000-49999 23 20 30 50000-69999 17 18 18 70000-99999 13 8 8 100000 and above 7 7 8 Chi-square = 9.37, df=10, p=0.898 Education Primary 2 1 2 Some secondary 24 22 31 Completed secondary 16 15 10 Some technical etc 6 4 5 Completed technical etc 8 10 9 Some tertiary 19 22 12 Completed tertiary 25 26 31 Chi-square = 9.72, df=12, p=0.640 Family Status Married, children at home 39 41 36 Married, no children at home 15 18 18 Married, no children 4 8 12 Not married, children at home 7 2 5 Never married, no children at home 28 18 21 Widowed, no children at home 3 4 4 Divorced, no children at home 4 9 4 Chi-square = 19.51, df=12, p=0.077 A MANOVA examining the relationship between cluster membership and the
psychographic factors was conducted and the results are presented in Table 7.44.
Although the overall result demonstrated statistically significant differences based
on Wilks Lambda, it can be seen that these differences occurred for four factors
only.

239
Table 7.44 MANOVA of Psychographic Factors by Value Clusters Psychographic Factor Means Factors Cluster 2 Cluster 3 Cluster 4 F-Value Self improvement 0.21 -0.43 -0.08 15.52* Active outdoors/sports -0.06 0.04 0.12 1.19 Nature -0.02 -0.07 0.10 0.75 Culture 0.08 -0.02 -0.15 1.94 Affiliation/social 0.23 -0.53 -0.05 22.67* Conservative 0.12 -0.17 -0.14 4.39* Stimulation 0.06 -0.26 0.11 4.41* Participating in causes 0.08 -0.18 -0.04 2.53 Independence -0.00 -0.05 0.08 0.42 Away from home 0.01 -0.04 0.02 0.13 Gambling/dining 0.01 -0.07 0.04 0.30 Peace 0.04 -0.14 -0.00 1.15 Gender role -0.03 0.06 0.04 0.40 Anomie 0.07 -0.06 -0.09 1.21 Frugal -0.03 -0.11 0.16 1.92 Wilks=0.76, F=4.30, p<0.001 *Significant at the p<0.05 level.
7.17.2 Clustering of Value Segments (As Determined by the Top-Ranked Value)
Global Event Visit Intention
(Interval)
1
Event Visit Intention Factors
(Interval)
2
Specific Event Visit Intention
(Interval)
3
Top Ranked Value Clusters
4
Demographics (Nominal and
Ordinal)
5
AIO Factors (Interval)
6
List of Value Domains (Interval)
7
ANOVA
MANOVA
Chi-Square
MANOVA
MANOVA MANOVA
Clusters were formed based on the value that respondents listed as the most
important guiding principle in their lives. This resulted in 10 clusters, nine of
which related to the LOV, and one that represented the non-LOV items that were
included in the questionnaire, as explained earlier.

240
The next part of the analysis was to determine whether there were differences in
‘event visit intention’ across clusters comprising respondents grouped on the basis
of their top ranked value. Multivariate analysis of variance (MANOVA)
calculations using the value clusters as the independent variables were used to test
this. The analyses were again run at the three levels of event visit intention:
global, event grouping, and event specific.
GLOBAL
(Using ANOVA)
F=0.69, p=0.699
This result did not support the presence of statistically significant differences
between clusters with respect to overall event visit intention.
EVENT GROUPINGS (Using factors from EFA of event visit intention)
(Using MANOVA)
The results in Table 7.45 demonstrate that there were no statistically significant
differences between clusters with respect to event groupings.
Table 7.45 MANOVA of Event Visit Intention Factors by Value Clusters (top-ranked) Visit Intention Factors F-Value Major sport 1.67 Cultural 1.64 Popular festivals 1.24 Un-named 1.02 Wilks=0.89, F=1.39, p=0.062 *Significant at the p<0.05 level. INDIVIDUAL EVENTS
Wilks=0.67, F=1.20, p=0.058
In line with the earlier findings, this result does not support the presence of
statistically significant differences across segments formed using respondents’
top-ranked value. There were statistically significant differences across clusters
for only two of the 16 events listed, namely, the International Festival of the Arts
and the Royal Agricultural Society of Victoria Show.

241
Unlike the earlier clustering based on value systems, the clustering based on
respondents’ top ranked values did not identify differences in relation to visit
intention behaviour on any of the three dimensions of events, namely, global,
event grouping, or specific events. This leads to support for the following
hypothesis.
Hypothesis 31:
Cluster analysis based on segments comprising people with similar value systems
is a better basis for predicting visit intention behaviour in relation to special
events than is cluster analysis based on segments comprising people based on
their top ranked value.
In order to assess whether demographic differences between clusters may have
contributed to differences between clusters, chi-square analyses were run between
demographic variables and cluster membership. This was done in an earlier
section of this chapter and the results were presented in Table 7.21. The results in
Table 7.21, and the discussion following it, indicate that there were statistically
significant differences between respondents clustered on their top-ranked value,
with respect to age, gender and education. MANOVAs examining the relationship between cluster membership and each of
the LOV factors and psychographic factors were calculated, and the results are
presented in Table 7.46. Neither of the LOV factors demonstrated statistically
significant differences across the clusters and only two of the 15 psychographic
factors, namely, ‘nature’ and ‘anomie’ showed differences. Therefore, clusters
based on top-ranked value were fairly homogeneous with respect to
psychographics and value domains.
Table 7.46 MANOVA of Psychographic Factors and LOV Factors by Value Clusters (top-ranked) Factors F-Value LOV Achievement 1.14

242
Affiliation 0.93 Wilks=0.96, F=1.04, p=0.415 Psychographic Self improvement 1.26 Active outdoors/sports 1.15 Nature 2.17* Culture 1.06 Affiliation/social 0.61 Conservative 1.29 Stimulation 1.34 Participating in causes 1.24 Independence 1.18 Away from home 1.42 Gambling/dining 1.52 Peace 0.98 Gender role 1.67 Anomie 1.99* Frugal 0.72 Wilks=0.67, F=1.32, p=0.009 *Significant at the p<0.05 level.

243
7.17.3 Clustering of Psychographic Segments (As Determined by AIO Factor Scores)
AIO Domains (Interval)
1
AIO Segment Clusters
2
K-Means Cluster Analysis
Global Event Visit Intention
(Interval)
3
Event Visit Intention Factors
(Interval)
4
Specific Event Visit Intention
(Interval)
5
Demographics (Nominal and
Ordinal)
6
LOV Factors (Interval)
7MANOVA
Chi-Square
ANOVA
MANOVA
MANOVA
K-Means Cluster Analysis was used to cluster respondents into a small number of
homogeneous groups based upon respondents’ 15 AIO factor scores. The analysis
was repeated for a range of cluster solutions from two to six clusters with the
distribution of cases under the various solutions being presented in Table 7.47.
Table 7.47 The Number of Members in the Various Cluster Solutions for Value Segments (as determined by AIO factor scores) Cluster Cluster Cluster Cluster Cluster Cluster One Two Three Four Five Six 2 Cluster Solution 106 342 3 Cluster Solution 77 140 231 4 Cluster Solution 162 83 81 122 5 Cluster Solution 119 65 77 118 69 6 Cluster Solution 106 115 58 56 46 67

244
‘One-way ANOVAs’ were used to assess the ability of the various cluster
solutions to show statistically significant differences with respect to event visit
intention at the range of events listed in the questionnaire. Using this approach,
the six cluster solution was selected.
The next part of the analysis was to determine whether there were differences in
‘event visit intention’ importance ratings across clusters comprising respondents
grouped on the basis of their psychographic systems. MANOVA calculations
using the value clusters as the independent variables were used to test this. The
analyses were again run at the global, the event grouping, and the event specific
levels of event visit intention.
GLOBAL
(Using ANOVA)
F=4.37, p=0.001
This result demonstrates that there were statistically significant differences
between clusters with respect to overall event visit intention.
EVENT GROUPINGS (Using factors from EFA of event visit intention)
(Using MANOVA)
The results in Table 7.48 show that there were statistically significant differences
across the clusters for three of the four event visit intention factors.
Table 7.48 MANOVA of Event Visit Intention Factors by Psychographic Clusters Visit Intention Event Visit Intention Factor Score Means Factors ONE TWO THREE FOUR FIVE SIX F-VALUE Major sport -0.43 0.14 0.12 0.68 -0.18 -0.11 11.27* Cultural 0.41 -0.17 -0.24 -0.11 0.06 -0.10 5.51* Pop. festival 0.05 -0.15 0.10 0.21 0.09 -0.15 1.57 Un-named 0.01 -0.17 -0.28 0.29 0.26 0.09 3.40* Wilks=0.79, F=5.49, p<0.001 *Significant at the p<0.05 level. INDIVIDUAL EVENTS
Wilks=0.65, F=2.44, p<0.001

245
This result indicated statistically significant differences across clusters at the
individual event level with 12 of the 16 events demonstrating statistically
significant differences.
Hypothesis 29:
Segments comprising people with similar psychographic systems differ in their
visit intention behaviour in relation to special events.
These results suggest that segments comprising people with similar psychographic
systems differ in their event visit intention at three levels of event visitation,
namely, global, event groupings, and specific events. This provides support for
Hypothesis 29.
Hypothesis 30:
Cluster analysis based on segments comprising people with similar value systems
is a better basis for predicting visit intention behaviour in relation to special
events than is cluster analysis based on segments comprising people with similar
psychographic systems.
In order to test Hypothesis 30, it is necessary to compare the performance of
segments comprising people with similar value systems to those comprising
people with similar psychographic systems in terms of their abilities to predict
event visit intention behaviour. It was seen in an earlier section of this chapter that
the clustering based on similar value systems produced statistically significant
differences for the three event levels considered. A similar result was obtained in
this section for clustering based on similar psychographic systems. Table 7.49
compares the outcomes of the two clustering approaches and suggests that
clustering based on psychographic systems is slightly better than that based upon
value systems. This outcome does not provide support for Hypothesis 30. In order to assess whether demographic differences between clusters may have
contributed to the differences between clusters noted above, chi-square analyses
were run between demographic variables and cluster membership and the results
are presented in Table 7.50.

246
Table 7.49 Comparison of the Outcomes of Clustering Based on Values with Clustering Based on Psychographics Value System Psychographic System Visitation Dimension Clusters Clusters Global Event Visit Intention Significant Significant Event Visit Intention Factors 50% Significant 75% Significant Individual Events 69% Significant 75% Significant There were statistically significant differences across psychographic segments for
all demographic variables except income. This would suggest that differences
between clusters could be explained by demographics at least as well as by
psychographics.
A MANOVA examining the relationship between cluster membership and the
LOV factors was calculated and statistically significant differences were found
based on Wilks Lambda. As shown in Table 7.51, there were significant
differences for both value factors.

247
Table 7.50 Chi-square Analysis - Demographic Variables and Psychographic Clusters PERCENTAGE RESPONDENTS IN EACH CLUSTER Characteristic of Respondent ONE TWO THREE FOUR FIVE SIX Sex Male 32 43 53 66 30 52 Female 68 57 47 34 70 48 Chi-square = 24.35, df=5, p<0.001 Age 18-19 2 9 7 14 4 3 20-29 23 24 17 45 26 12 30-39 27 17 28 20 20 22 40-49 24 19 14 20 20 24 50-59 13 12 16 0 20 13 60 and above 11 19 18 1 10 26 Chi-square = 57.28, df=25, p<0.001 Income ($/year) Less than 10000 7 13 13 6 12 14 10000-29999 20 37 40 22 33 29 30000-49999 27 23 24 24 26 24 50000-69999 22 9 16 30 12 19 70000-99999 15 11 5 8 12 8 100000 and above 9 7 2 10 5 6 Chi-square = 41.80, df=40, p=0.392 Education Primary 0 3 0 0 4 4 Some secondary 8 30 38 27 39 19 Completed secondary 14 15 10 13 11 19 Some technical etc 5 9 3 4 0 6 Completed technical etc 9 3 10 13 11 12 Some tertiary 21 21 12 25 13 13 Completed tertiary 43 19 27 18 22 27 Chi-square = 63.75, df=30, p<0.001 Family Status Married, children at home 38 37 50 39 26 43 Married, no children at home 17 19 10 9 13 22 Married, no children 9 5 12 5 0 7 Not married, children at home 6 6 9 4 9 1 Never married, no children at home
22 25 12 39 39 14
Widowed, no children at home 2 5 2 0 9 5 Divorced, no children at home 6 3 5 4 4 8 Chi-square = 48.66, df=30, p=0.017

248
Table 7.51 MANOVA of Value Factors by Psychographic Clusters Factors ONE TWO THREE FOUR FIVE SIX F-VALUE Achievement -0.08 0.33 -0.09 0.14 -0.11 -0.40 5.61* Affiliation 0.12 0.20 -0.03 -0.02 -0.09 -0.44 4.07* Wilks=0.90, F=4.92, p<0.001 *Significant at the p<0.05 level.
7.17.4 Clustering of Event Visit Intention (As Determined by Event Visit Intention Factor Scores)
Event Visit Intention Factors
(Interval)
1
Event Visit Intention Clusters
2
K-Means Cluster Analysis
List of Value Domains (Interval)
3
List of Values (Interval)
4
AIO Factors (Interval)
5
Demographics (Nominal and
Ordinal)
6
MANOVA
MANOVA
MANOVA
Chi-Square
K-Means Cluster Analysis was again used to cluster respondents into a small
number of homogeneous groups with the clustering being based upon
respondents’ four event visit intention factor scores. Analyses were conducted for
solutions ranging from two to six clusters with the distribution of cases under the
various solutions being presented in Table 7.52.

249
Table 7.52 The Number of Members in the Various Cluster Solutions for Value Segments (as determined by event visit intention factor scores) Cluster
One Cluster
Two Cluster Three
Cluster Four
Cluster Five
Cluster Six
2 Cluster Solution 186 262 3 Cluster Solution 140 112 196 4 Cluster Solution 93 119 159 77 5 Cluster Solution 162 64 93 63 66 6 Cluster Solution 78 123 93 50 54 50 ‘One-way ANOVAs’ were used to assess the ability of the various cluster
solutions to show statistically significant differences with respect to the items
contained in the LOV. Using this approach, the five cluster solution was selected.
The next part of the analysis was to determine whether there were differences in
‘value domains’ across clusters comprising respondents grouped on the basis of
their event visit intention. MANOVA calculations using the event visit intention
clusters as the independent variables were used to test this. The analyses were run
at two levels of values:
1. value domains, using the two value factors,
2. the value ratings themselves.
VALUE DOMAINS
(Using MANOVA)
As can be seen in Table 7.53, both value factors demonstrated statistically
significant differences between clusters.
Table 7.53 MANOVA of Value Factors by Event Visit Intention Clusters Visit Intention Event Visit Intention Factor Score Means Factors ONE TWO THREE FOUR FIVE F-VALUE LOVF1 -0.21 0.33 -0.07 0.04 0.27 5.14* LOVF2 -0.22 0.26 0.07 0.13 0.07 3.58* Wilks=0.92, F=4.41, p<0.001 * Significant at the p<0.05 level. INDIVIDUAL VALUES
Wilks=0.82, F=2.47, p<0.001

250
This result supports the earlier finding of statistically significant differences with
respect to values across clusters. It was found that only two of the nine items in
the LOV did not demonstrate statistically significant differences across the
clusters, namely, ‘fulfilment’ and ‘warm relationships’.
Hypothesis 18:
Groups of individuals segmented on their intention to patronise similar types of
special events may be differentiated on the basis of the personal values of segment
members.
The earlier analysis provides support for this hypothesis irrespective of whether
values are measured via the individual items or via the value domains.
In order to assess whether demographic differences between clusters may have
contributed to the differences between clusters noted above in the value analyses,
chi-square analyses were conducted between demographic variables and cluster
membership as noted in Table 7.54. There were statistically significant differences for all demographic variables
across the event visit intention clusters.
In terms of gender, there were quite clear distinctions between clusters with
clusters one, three and five demonstrating a positive female bias. Members of
cluster one were older, with only 17 per cent being under 30 and 37 per cent being
over 50. This contrasts with cluster two where 47 per cent of members were under
30 and only 11 per cent were above 50 years old.
The income profile of clusters showed some consistency with the age profile in
that cluster one, whose members tended to be older, had a lower average income
with 49 per cent of members having an annual income below $30,000 and only 11
per cent having an income above $70,000. Clusters three and four members
tended to have higher annual incomes.

251
Table 7.54 Chi-square Analysis - Demographic Variables and Event Visit Intention Clusters PERCENTAGE OF RESPONDENTS IN
EACH CLUSTER Characteristic of Respondent ONE TWO THREE FOUR FIV
E Sex Male 41 67 32 65 30 Female 59 33 68 35 70 Chi-square = 35.74, df=4, p<0.001 Age 18-19 2 13 3 11 9 20-29 15 34 25 25 32 30-39 26 20 19 21 20 40-49 20 22 22 16 23 50-59 16 3 15 11 9 60 and above 21 8 16 16 7 Chi-square = 39.80, df=20, p=0.005 Income ($/year) Less than 10000 17 13 7 7 3 10000-29999 32 31 20 25 41 30000-49999 23 32 23 19 27 50000-69999 17 16 21 16 17 70000-99999 8 3 17 16 11 100000 and above 3 5 12 17 1 Chi-square = 65.11, df=32, p<0.001 Education Primary 4 0 0 0 3 Some secondary 34 25 14 27 17 Completed secondary 12 17 16 19 9 Some technical etc 6 5 2 6 8 Completed technical etc 13 13 4 8 3 Some tertiary 9 22 17 24 33 Completed tertiary 22 18 47 16 27 Chi-square = 71.55, df=24, p<0.001 Family Status Married, children at home 46 44 33 25 38 Married, no children at home 20 8 13 19 17 Married, no children 8 6 4 10 6 Not married, children at home 7 3 8 2 5 Never married, no children at home 11 34 29 35 29 Widowed, no children at home 5 0 6 3 0 Divorced, no children at home 3 5 7 6 5 Chi-square = 45.62, df=24, p=0.005
Members of cluster one tended to have lower levels of education with 38 per cent
having not completing secondary education, which is consistent with an older age
group. Members of cluster three demonstrated a much higher average education
level with over 64 per cent having had at least some tertiary education.

252
7.18 Summary of Research Hypotheses Results The following table summarises the outcomes of the research hypotheses that
were tested throughout this chapter. HYPOTHESIS SUPPORT? HYPOTHESIS SUPPORT? 1 Yes 16a Yes 2 Yes 16b Yes 3 Yes 17 Yes 4 No 18 Yes 5 Yes 19 No 6a Yes 20 No 6b Yes 21 No 6c No 22a No 7a Yes 22b Yes 7b Yes 22c No 7c Unresolved 23 No 8 No 24 No 9 No 25a No 10 Yes 25b No 11a Partial 25c No 11b Partial 25d No 11c No 25e No 11d No 26 Partial 11e Partial 27 Partial 12a No 28a Yes 12b No 28b No 12c Yes 28c Yes 13a No 28d Yes 13b No 28e No 13c No 29 Yes 14 Yes 30 No 15a Yes 31 Yes 15b Yes

253
CHAPTER 8
CONCLUSION
8.1 Key Findings Despite the fact that the field of special events has become an integral component
of the tourism industry in many regions, relatively little research has been
conducted in this area. Debate has surrounded the meaning of the term itself and
little has been done to understand the needs of the market in relation to special
events and how consumers perceive special events relative to other leisure
activities. These deficiencies must be overcome if the field of special events is to
reach its full potential.
8.1.1 A Conceptualisation of Special Events In Part One, research was conducted to develop a conceptualisation of special
events in order to help overcome a fundamental gap in the knowledge base of
special events. The first part of this conceptualisation study was based on an
extensive and systematic review of the literature from which it was proposed that
special events are a particular type of visitor attraction. It was found that attendees
at many special events were largely from the local area and thus their presence at
a special event would be classed as a daytrip activity and not part of tourism in a
traditional sense. However, many contemporary definitions of tourism now
recognise daytrip activities as part of tourism since the economic impacts are so
similar, and it was, therefore, proposed that special events should be regarded,
principally, as part of tourism. This proposition is consistent with the fact that
special event divisions have been established within many of Australia’s state and
territory tourism organisations.
In conducting the literature search to identify the key characteristics of special
events, one of the major difficulties encountered was the inconsistent use of terms
to describe special events and to identify sub-categories. These terms, such as
festival, mega-event, major event and hallmark event, were used as synonyms by
some researchers and as specific identifiers by others, and there did not appear to

254
be any consistency in the actual usage. If a field of study does not have a sound
definitional base, research output in that field is likely to be less effective as it will
often not be clear as to the categories to which the findings apply. The field of
special events has clearly suffered from the lack of a commonly accepted
definitional base.
In an effort to overcome this problem and to provide a basis for the comparison of
specific special events, a diagrammatic framework of events based on the
literature review was proposed. The literature review was also used as the basis
for identifying core and qualifying attributes of special events that were
subsequently used to support a range of definitions that was proposed for different
special event types. The core attributes of special events that were proposed are:
1. Attracting tourists or tourism development,
2. Being of a limited duration,
3. Being a one-off or infrequent occurrence,
4. Raising the awareness, image or profile of a region,
5. Offering a social experience,
6. Being out of the ordinary.
The primary research that was conducted in an effort to identify the attributes that
consumers regarded as important in defining a special event found four key
attributes:
1. The number of attendees,
2. The international attention due to the event,
3. The improvement in the image and pride of the host region as a result
of hosting the event, and
4. The exciting experience associated with the event.
These attributes, which were identified using a number of techniques that
demonstrated strong convergent validity, correlated well with respondents’ rating
of the specialness of a range of named special events.
Exploratory Factor Analysis was used to examine the underlying connections
between the different special events based on respondents’ ratings of event

255
specialness. Given that such connections or groupings were based on a consumer
perspective, it was considered that they would provide a sound basis for
categorising special events in the various media that are used to promote special
events. The following categories were derived from the EFA:
1. Sport - Mega
- General
- Other Racing
2. Regional Events
3. Festivals - Cultural
- City
4. Technology
5. Service Oriented
6. Human Endurance
7. Intermittent International
8.1.2 The Ability of Individual Differences to Explain Special Event Behaviour The need to understand consumers in relation to special events and the importance
of market segmentation in this process were discussed in Part Two. A small
number of studies has been conducted in recent years that has sought to explain
consumer behaviour in relation to special events, and these studies were reviewed
in Chapter Four. It was found that most of these studies were destination-based
which meant that only the behaviour of attendees was considered and as a
consequence, it was not possible to generalise the findings of the studies to the
wider population. A few studies were found that were origin-based, thus allowing
generalisation of the findings to the wider population, but all of these studies had
a broader focus than special events and indeed, special event behaviour was little
more than an incidental element of these studies.
Three approaches to market segmentation, namely, personal values,
psychographics and demographics, were adopted for use in the origin-based
primary research that underpinned Part Two of this study.

256
Distinctiveness of Special Events
It was discussed in an earlier chapter that some leading researchers (Swarbrooke
1995 and Getz 1997), proposed that special events should be regarded as a
particular type of visitor attraction. Although this proposition was based on a
supply perspective, the findings of the primary research conducted in this study
confirm such a proposition from a consumer perspective. The exploratory factor
analyses that were conducted on both visit interest and visit intention indicated
that respondents viewed special events as distinct from permanent attractions.
There were also differences in terms of respondent behaviour for special events as
opposed to permanent attractions. For example, past visitation was a better
indicator of visit interest and visit intention for special events than it was for
permanent attractions.
The fact that these differences between visitor attraction categories are based upon
the consumer perspective supports the thrust of the Consumer Decision Process
Model (Figure 1.4) which underpinned this thesis, and treated permanent
attractions and special events as distinct forms of visitor attractions. These
differences also have important implications for the manner in which visitor
attractions are promoted. Given that the correlation between visit interest and visit
intention was higher for special events than it was for permanent attractions, this
suggests that promotion campaigns that generate interest in special events will
have more impact on special event patronage than would notionally similar
campaigns for permanent attractions. This goes some way to justifying the
existence of specific special event divisions in many regions and the money that is
spent on publications such as special event calendars which promote special
events to the public. It is also important that permanent attractions be seen as
complementary to special events, as a means of extending visitors’ stay in a
region, and providing an incentive for them to spend more money in the region.
As well as separating special events from permanent attractions, respondents
grouped special events into categories that were consistent with the broad
categories that are used to promote special events by the state and territory special
event divisions. Such categories included ‘sport’, ‘culture’ and ‘festivals’.

257
Although ‘event visit interest’ and ‘event specialness’ appear to be two distinct
concepts, it was interesting to note that there was a similarity between the factor
groupings that were extracted from the EFA of each variable. The factor
groupings that were extracted from the EFA of event visit interest were largely
subsets of the groupings that were extracted from the EFA of event specialness.
There was also a relationship between the factor groupings extracted from the
EFA of event visit intention and the factors extracted from the EFA of event
specialness, but the relationship was less clear.
This link between visit interest, and to a lesser extent visit intention, and
respondents’ perceived degree of specialness of events was confirmed using
correlation analysis. This analysis showed that there were statistically significant
relationships between the concepts for almost all of the events in the
questionnaire. The correlation coefficients, which were in the small to moderate
range, were higher between visit interest and event specialness than they were
between visit intention and event specialness.
Measurement of the List of Values (LOV)
Given the lack of consensus in the literature regarding the most appropriate means
of measuring the LOV, it was decided to use both of the recognised approaches in
this study, namely, ratings and rankings. Not only did inclusion of the two types
of scales enable them to be compared, but it also enabled respondent behaviour to
be assessed and compared based on value domains and on top-ranked value.
As was noted in Chapter Seven, most of the studies that discussed the relative
merits of the two approaches did so without actually conducting comparative
studies. No studies have been found that compare the two approaches in relation
to the LOV. It was found that ratings and rankings produced similar results in
terms of the relative importance of values as guiding principles in respondents’
lives. This finding was consistent with the results of the few studies that had
considered the two approaches to value measurement in relation to the RVS.

258
Despite the consistency that was achieved between the two techniques used in this
study, this researcher believes that both approaches should be adopted in the
measurement of the LOV as both techniques provide different, but
complementary information that helps build a clearer picture of the respondent;
the ‘ratings’ approach indicates the intensity with which a particular value is held
and the ‘rankings’ approach provides information explicitly on how one value is
seen in relation to another. The additional effort required to use both scales is
small in comparison to the benefits derived. Since individual values should be
seen as part of a value system or hierarchy, it is felt that collecting data on
respondents’ top three values as opposed to simply identifying the top-ranked
value provides useful information. A weighting system can then be used to
prioritise values overall.
Comprehensiveness and Stability of the LOV
Additional values were added to the original items in the LOV as part of this
study primarily to encourage respondents to make wider use of the rating scale. A
secondary reason for such an addition was to test, to some extent, the
comprehensiveness of the LOV itself. One could argue that the core values of
many modern economic systems include values such as power, wealth and status,
which do not appear in the LOV. Although some may suggest that such values
could be included in the LOV under ‘achievement’, this is not clear.
Achievement, for example, could have both positive and negative connotations in
that it could relate to achieving spirituality or achieving power. The added values
generally, but not entirely, represented what could intuitively be regarded as less
laudable human characteristics and it was, therefore, not unexpected that they
largely grouped together at the lower end of the spectrum when ranked based on
mean ratings.
Given that the LOV has been proposed as a means of measuring people’s values,
the instrument would be expected to be comprehensive. It was surprising,
therefore, that so many respondents listed a non-LOV item as their top-ranked
value and many more included at least one non-LOV item in their top three
ranked values. This is all the more concerning when one remembers that the

259
values that were added to the LOV as part of this scale were, arguably, from the
less laudable end of the spectrum. Had testing the comprehensiveness of the LOV
been a more fundamental objective and had the additional items been selected
more specifically for this task, it is likely that many more respondents would have
chosen non-LOV items as their most important guiding principles.
This certainly brings into question the comprehensiveness of the LOV. It also
poses the question of how important some of the less laudable characteristics are
as guiding principles within people’s lives? The nine items that make up the LOV
and, indeed, all of the values listed in the RVS upon which the LOV was based,
could be classed as positive values and they would rate quite highly in terms of
their social desirability. Despite suggestions that today’s society has become more
materialistic in its outlook, it is interesting that the LOV does not contain any
‘negative’, or less laudable values, such as wealth, power and status. The results
of this study certainly suggest that less socially desirable values should be
considered for the LOV. Although values are relatively stable, they can change
over time. Muller (1997) indicated that value priorities for “Baby Boomers” (p.
33) had changed over a 10 year period using the LOV. However, there was no
discussion in the Muller study, nor any other study that has been found, as to
whether the actual techniques that are used to measure values should be reviewed
or modified to reflect changes in society. It seems to have been assumed that all
changes occur within the established value systems. The results of this study
challenge this assumption.
Value Domains
Much of the literature suggested that there was a smaller number of value
domains that underpinned the LOV, which was a finding that was supported in
this study which found two value domains behind the nine item LOV. However,
this is hardly a startling discovery as it would be rare that an EFA would not be
able to reduce a nine item set to a smaller number of factors.
Although it was widely accepted in the literature that these value domains
reflected internal and external orientations, the values that made up the various

260
domains showed substantial variation across studies. There was also considerable
arbitrariness in the discussions used to justify the different groupings. However,
there was reasonable consistency across studies in terms of the three items that
made up the external orientation. Although the value domains extracted in this
study, labelled ‘achievement’ and ‘affiliation’, comprised a more parsimonious
list of underlying values, the items that made up the external domain in other
studies were split between the two factors with ‘security’ being located in the
opposite factor to the other two values. Initially, this difference was seen as
questioning the validity of respondent ratings of ‘security’. However, after
observing that the percentage of respondents ranking ‘security’ as their most
important value in this study was well below the percentage that occurred in other
studies, it is suggested that this is a function of respondent culture as opposed to
any flaw in the responses.
The studies that were used for comparative purposes in relation to value domains
were all sited in Europe or Asia, whilst respondents chosen for the current study
were Australian. There is strong anecdotal evidence to suggest that Australians
have a more carefree attitude to life in general and are less inclined to be
concerned with security than many other cultures, as evidenced by the low
propensity to save demonstrated by Australians as a whole. This view was also
supported by the finding of this study that respondents regarded hedonistic values
more importantly than did the respondents of the studies reported in the literature.
This helps explain the fact that there was no clear external domain identified in
this study and supports a link between personal values and culture.
Relationship between Values and Demographics
There was strong consensus in the literature regarding the relationship between
values and demographic variables, with most studies demonstrating relationships
for gender, age, income and education. Using respondents’ top-ranked value, the
results of this study showed some support for the literature with demographic
differences being shown for age, gender and education, but not for income. There
were also some specific trends that were not consistent with the other studies. For

261
example, security was seen as more important in many of the other studies by the
more highly educated respondents and those on a higher income, which was not
the case here. Again, this could be attributable to the manner in which security is
regarded in Australia.
It should also be noted that although significant demographic differences were
found across respondents grouped on the basis of their top-ranked value, this was
not the case for respondents grouped on the basis of their value factor scores. In
these analyses, fewer than 30 per cent of relationships demonstrated statistical
significance.
Care, therefore, should be exercised in the use of blanket statements regarding the
demographic homogeneity of value segments as it is important to know the basis
used to form the segments. Recognising the results of this study and many others
reported in the literature, it seems clear that there are demographic differences
based on top-ranked value but this study does not support demographic
differences across value domains, and the literature found to date has been silent
on this issue. Although segmentation based upon the top-ranked value is more
conveniently calculated than that based upon value domains, the results of this
study indicate that the latter form of segmentation is a better indicator of
behaviour. Therefore, the use of segments based on the top-ranked value are of
limited benefit irrespective of the demographic differences that are shown.
Values and Behaviour
It was noted earlier that values at a global or abstract level are better indicators of
behaviour than the individual values themselves (Kamakura and Novak 1992).
This line of argument was based on the theory that individual values combined to
form a value system and it was the value system that guided behaviour. The
results of this study demonstrated clearly that segmentation using value domains
was better for explaining behaviour than was segmentation using top-ranked
values, where behaviour was taken as special event visit intention. This clearly

262
supports the view that values are of more benefit when considered in a more
abstract form and is consistent with “Rokeach’s theoretical concept of value
systems” (Kamakura and Novak 1992, p. 121).
It has been argued in the literature that since the LOV was based upon terminal
values which are more abstract than instrumental values, the LOV is likely to be
more effective at explaining abstract behaviour than it is at explaining concrete
behaviour. Contrary to this, however, was the finding in this study that values
were better predictors of more concrete behaviour than they were of abstract
behaviour, on the basis that values showed more statistically significant
relationships with visit intention than visit interest. It should be remembered that
the relationships in both situations were weak.
Although the assertion that the LOV should be better able to explain abstract
behaviour because it is was based on terminal values has some appeal, no support
for this assertion has been found nor studies that actually test this proposition.
Given that this study found the LOV to have more relationships to visit intention
than to visit interest at both the specific attraction level and globally, there is
reason to question the assertion noted above.
The LOV demonstrated many more statistically significant relationships with
special events than it did with permanent attractions over all dimensions of visit
behaviour. This was largely due to the two individual values, namely, ‘fun and
enjoyment’ and ‘excitement’, which appear to be more closely associated with
special events. This finding is consistent with the results derived from the mail-
back questionnaire in Part One of this thesis.
Comparative Performance of Values
Despite the claims of many of the proponents of values as a segmentation
technique and an important tool for explaining behaviour, in this study the LOV
was far less effective than psychographics over a range of scenarios. These
scenarios included relationships with various dimensions of behaviour for
different types of visitor attractions at the attraction specific and global levels, as

263
well as classification and forecasting procedures using discriminant analysis and
multiple regressions. The increased performance of psychographics over the LOV
was substantial in all situations.
Indeed, the LOV generally performed at a lower level than demographics, a
segmentation technique that the LOV was expected by some to replace. It is
important to note that not only were demographics generally superior to the LOV,
but neither technique produced results that were comparable to those produced by
psychographics in the discriminant analysis; neither the LOV nor demographics
performed much better than chance alone. This study confirmed that it was
possible to segment people on the basis of their value domains and then to explain
behaviour, at least in part, in relation to special events at three levels. However,
AIOs were able to do this as well and, indeed, more successfully than the LOV
once again.
The results of this study do little to support the claims that values are a powerful
influence on behaviour, underpin lifestyles and provide more useful information
than demographics. However, this researcher believes that values do underpin
lifestyles and purchase behaviour and that failure to determine strong supporting
evidence for such a proposition in this study was a function of the validity of the
measuring tool as opposed to a flaw in the concept itself. There is strong face
validity for the concept of a range of inner stable elements that influence
behaviour and this face validity is enhanced by the enduring nature of the study of
values and the fact that they have been researched in so many varied settings. The
consistency between the rankings and ratings approach to measuring values using
the LOV provided some support for the internal convergent validity of the
technique. However, there was also evidence to question the comprehensiveness
of the LOV and its predictive validity in terms of behaviour in relation to visitor
attractions was relatively low. Overall, the results of this study indicate that
despite the convenience of the LOV as a measure of values, it has limited, at best,
use as a segmentation tool or technique to explain behaviour, but there is enough
evidence to justify exploring further the use of values, per se, in such a role.

264
Special Events
As stated in an earlier section of this chapter, respondents viewed special events
as distinct from permanent attractions based on EFAs of their visit interest and
visit intention behaviour. The existence of these differences was supported by the
fact that special events were well ahead of permanent attractions in terms of the
number of statistically significant relationships with the LOV, AIOs and
demographics. There was also a much stronger relationship between past
visitation and visit intention for special events than there was for permanent
attractions. This finding suggests that, other things being equal, repeat visitation
would be easier to achieve for a recurring special event than for a permanent
attraction. This supports the increasing incidence of special events being held in
conjunction with permanent attractions in order to provide consumers with a
reason to return to the attraction.
In comparing first-time with repeat visitors to special events, there appeared few
demographic, value or AIO differences across the two groups which lends support
to earlier studies which suggested that the two groups are fairly homogeneous. It
should be remembered, however, that since there were no specific measures of
repeat visitation or of visit satisfaction in this study, some simplifying
assumptions had to be made in this section.
Respondents clustered on value segments showed differences in event visit
intention behaviour at three levels, namely, event specific, event grouping and
globally. They also varied according to gender. Developing clusters based on
respondents’ top-ranked value did not produce statistically significant differences
at any of the three levels.
In comparing respondents classed as having a high event visit intention versus
those having a low event visit intention, it was found that there were
demographic, value and psychographic differences between the two groups. The
high event visit intention group had a higher proportion of males, was younger,
less likely to be married and more highly educated, and placed more emphasis on
the achievement domain and on hedonistic values. With respect to psychographic

265
differences, the high event visit intention group placed more emphasis on outdoor
activities, culture, and affiliation and was less conservative. It was interesting that
the ‘affiliation’ dimension, which has been identified in other studies as an
important motive for attending special events, was identified in the psychographic
section but not in the values section. The differences between the two groups that
were identified in this study seem consistent with conventional wisdom and may
provide the basis for developing promotion campaigns for those people more
inclined to patronise special events.
Past visitation showed statistically significant correlations with visit interest and
visit intention for a moderate number of permanent attractions and for a large
number of special events. This again demonstrated that special events should be
regarded as a distinct type of visitor attraction. The increased number of
correlations with special events was consistent with the view that special events,
being transitory, tend to be different each time that they are held, thereby
providing additional incentive to revisit. Obviously consumer satisfaction with the
attractions has a substantial bearing on this and care should be exercised in the
interpretation of this result given that no specific measure of satisfaction was
included in this study.
Predicting Special Event Behaviour
The final outcome in the Consumer Decision Process Model that was presented in
Figure 1.4 is actual visitation. The discriminant analysis that was used to test the
absolute and relative abilities of the LOV, psychographics and demographics to
classify respondents on whether they had attended the special events listed in the
questionnaire, provided fairly disappointing results. Psychographics was far more
successful than either the LOV or demographics but still was only able to
correctly classify 73 per cent of the respondents.
Similar findings were derived from the multiple regressions that were conducted
to explain event visit intention using a range of independent variables taken from
Figure 1.4. In these regressions, only the visit interest variable was able to
produce coefficients of determination that were above 0.7. Combining all of the

266
independent variables in the regression equation, increased the resultant
coefficient to 0.77. This indicates that in order to explain the variation in event
visit intention, either there are other variables that were not measured in this study
or there are variables that were not measured accurately. It is suggested that both
these factors contributed to the lower than anticipated explanatory power of the
model.
The ability of the LOV to accurately measure consumers’ personal value systems
so that values can be used as a basis to explain behaviour was questioned in an
earlier section. The view that a more accurate measure of personal values would
help explain the variance in behaviour in relation to special events is reiterated
here. In particular, recognition needs to be made that there may be other less
socially desirable values that drive people’s behaviour.
It is also proposed that the measurement of a ‘travel party’ variable would
enhance the explanatory power of the model. This variable was identified in the
model under ‘situation influences’ but was not measured because this study
focused specifically on the ‘individual influence’ section of the model in Figure
1.4. There is strong anecdotal evidence to suggest that travel party has a
substantial influence on travel behaviour. In a family situation, for example,
holiday destinations and activities are often chosen by the parents to satisfy the
desires of their dependent children which means that the behavioural outcome
may relate more closely to the value system of the children rather than that of the
parents. An alternative means of overcoming this problem may be to introduce a
value that assesses the importance of children in respondents’ lives.
8.2 Summary The field of special events now plays an important role in the economic well-
being of many regions and often helps determine, or at least influences, the image
that is projected for the various regions. An in-depth understanding of special
events and consumer behaviour in relation to these events is critical if regions are
to maximise the net benefits that are derived from these events. This thesis has
added to the body of knowledge on both counts.

267
A conceptualisation and definitional framework has been proposed that will
enable the various categories of special events to be compared in research
projects. The consumer perspective upon which the conceptualisation was based,
will enable special events to be developed and promoted in a manner that has
relevance for the consumer.
The three individual influences that were used in this study to examine consumer
behaviour in relation to a range of visitor attractions including special events,
provided additional information on consumer segments but were varied in their
ability to explain a substantial percentage of the variation in behaviour. Personal
values, in particular, performed at a level well below that claimed by proponents
of the technique. The various segmentation techniques were able to demonstrate
differences between respondents having a high event visit intention and
respondents having a low event visit intention. These differences could be of
value to event organisers and promoters. The fact that behaviour was measured on
three dimensions and in relation to a wide range of visitor attractions enabled a
systematic assessment to be made.
Although the individual influences section of the Consumer Decision Process
Model was not able to explain all of the variation in consumer behaviour, it was
proposed that other elements of the model would likely account for much of this,
yet unexplained, variation.
Since the primary research that underpinned this thesis was based upon a
randomly selected sample of 500 Melbourne residents, the findings of the
research can be generalised to the Melbourne population with a reasonable degree
of confidence.
8.3 Future Research Four key attributes were identified in Part One of this study as being important to
consumers in defining events as special. Having identified these attributes, it

268
would be useful to attempt to operationalise them and to develop an instrument
based on these four attributes that would help categorise events.
Despite the fact that values were not able to explain all of the variation in
consumer behaviour in relation to visitor attractions based on measurement of the
LOV, personal values still has appeal as a basis for explaining behaviour.
Research needs to be undertaken to explore further the instruments used to
measure personal values before the fate of values as a segmentation tool can be
decided; is the poor performance of values a fundamental problem with the values
concept, or merely a problem with the measurement tool?
The importance of the situation specific influences, in particular travel party and
travel occasion, that appeared in the Consumer Decision Process Model need to
be assessed.
It could be useful to the understanding of consumer behaviour in relation to
special events to explore further the links between the two primary research
components of this study. Is there a connection between consumers’
understanding of special events and their behaviour in relation to them?
In order to develop further an understanding of the influence of past visitation on
future visit interest and visit intention, it is necessary to include the issue of
satisfaction in future studies. This will help improve the likelihood of converting
first-time visitors into repeat visitors which is important for the long term success
of special events. The issue of ‘novelty seeking’ also needs to be assessed as a
consumer who is motivated by ‘novelty seeking’ could be highly satisfied with an
event visit, but not be interested in revisiting that particular event. Scott (1996)
found that “first-time visitors were far more likely to be motivated by curiosity
than repeat visitors” (p. 127).
The aforementioned suggestions for further research are based upon trying to
improve the explanation of consumer behaviour in relation to special events in
particular. This endeavour is related to the consumer perspective which is a single

269
perspective in the proposed Model of Special Events that was presented in Figure
1.2. In order to develop a comprehensive understanding of the field of special
events, it is important that research be conducted on the other perspectives that
were identified in Figure 1.2, such as those of organisers, local communities,
sponsors and governments.

270
BIBLIOGRAPHY Abrahams, R. (1987). An American Vocabulary of Celebrations, In Falassi, A. (ed), Time Out of Time: Essays on the Festival, University of New Mexico Press, Albuquerque, 173-183. Alwin, D. and J. Krosnick (1985). The Measurement of Values in Surveys: A Comparison of Ratings and Rankings, Public Opinion Quarterly, 49, 535-552. Andereck, K. and L. Caldwell (1994). Variable Selection in Tourism Market Segmentation Models, Journal of Travel Research, 33 (2), 40-46. Assael, H. (1992). Consumer Behavior & Marketing Action (fourth edition). PWS-KENT Publishing Company, Boston. Australian Bureau of Statistics (1993). Victoria’s Statistical Geography, Catalogue No. 1103.2, Commonwealth of Australia, Canberra. Backman, S. and J. Crompton (1990). Differentiating Between Active and Passive Discontinuers of Two Leisure Activities, Journal of Leisure Research, 22 (3), 197-212. Backman, K., S. Backman, M. Uysal, and K. Mohr Sunshine, (1995). Event Tourism: An Examination of Motivations and Activities, Festival Management & Event Tourism, 3 (1), 15-24. Beatty, S., L. Kahle, P. Homer, and S. Mirsa (1985). Alternative Measurement Approaches to Consumer Values. Psychology and Marketing, 3, 181-200. Berkowitz, E., R. Kerin and W. Rudelius (1989). Marketing (second edition), Irwin, Boston. Blamey, R. and V. Braithwaite (1997). A Social Values Segmentation of the Potential Ecotourism Market, Journal of Sustainable Tourism, 5 (1), 29-45. Bonn, M. (1991). The Relative Utility of Sociodemographics, Psychographic Scales and Benefit Scales for Segmenting Pleasure Vacation Travel, PhD Dissertation, University Microfilms International, Ann Arbor. Boote, A. (1981). Market Segmentation by Personal Values and Salient Product Attributes, Journal of Advertising Research, 21, February, 29-35. Bos, H. (1994). The Importance of Mega-events in the Development of Tourism Demand, Festival Management & Event Tourism, 2 (1), 55-58.
271
Bos, H., C. Van Der Kamp and J. Zom (1987). Events in Holland, Resolutions of the 37th Congress of the AIEST, Calgary, Revue de Tourisme, 4, 16-19. Bratton, B. and D. Getz (1992). The Economic Impact of Hosting Amateur Sports Events in Calgary and Alberta, Unpublished Research, University of Calgary, Calgary. Bretton-Clark (1987). Conjoint Analyzer, Version 2, Bretton-Clark, New York. Burgan, B. and T. Mules (1992). Economic Impact of Sporting Events, Annals of Tourism Research, 19 (5), 700-710. Burns, J., J. Hatch and T. Mules, (eds), (1986). The Adelaide Grand Prix: The Impact of a Special Event, The Centre for South Australian Economic Studies, Adelaide. Butler, R. and B. Smale (1991). Geographic Perspectives on Festivals in Ontario, Journal of Applied Recreation Research, 16 (1), 3-23. Carmichael, B. (1996). Conjoint Analysis of Downhill Skiers Used to Improve Data Collection for Market Segmentation, Journal of Travel & Tourism Marketing, 5 (3), 187-206. Chacko, H. and J. Schaffer (1993). The Evolution of a Festival: Creole Christmas in New Orleans, Tourism Management, 14 (6), 475-482. Churchill, G. (1979). A Paradigm for Developing Better Measures of Marketing Constructs, Journal of Marketing Research, 16, February, 64-73. Claxton, J. (1987). Conjoint Analysis in Travel Research; A Manager’s Guide, In Ritchie, J. and C. Goeldner (eds), Travel Tourism and Hospitality Research; A Handbook for Managers and Researchers, John Wiley and Sons Inc, New York, 459-469. Clawson, C. and D. Vinson (1978). Human Values: A Historical and Interdisciplinary Analysis, in Hunt, H. (ed) Advances in Consumer Research, Ann Arbor: Association for Consumer Research, Michigan. Cooper, C., J. Fletcher, D. Gilbert, and S. Wanhill (1993). Tourism; Principles & Practice, Pitman Publishing, London. Commonwealth Department of Tourism (1992). Tourism, Australia's Passport to Growth: A National Tourism Strategy, Australian Government Publishing Service, Canberra. Cousineau, C. (1991). Festivals and Events: A Fertile Ground for Leisure Research, Journal of Applied Recreation Research, 16 (1), 1-2. Crompton, J. (1979). Motivations for Pleasure Vacation, Annals of Tourism Research, 6, 408-424.

272
Crompton, J. (1992). Structure of Vacation Destination Choice Sets, Annals of Tourism Research, 19 (3), 420-434. Crompton, J. and P. Ankomah (1993). Choice Set Propositions in Destination Decisions, Annals of Tourism Research, 20 (3), 461-476. Crompton, J. and S. McKay (1997). Motives of Visitors Attending Festival Events, Annals of Tourism Research, 24 (2), 425-439. Crosby, L., J. Gill and R. Lee (1984). Life Status and Age as Predictors of Value Orientation, In Pitts, R. and A. Woodside (eds), Personal Values and Consumer Psychology. Lexington Books, Lexington, 201-218. Crouch, G. (1992). Marketing International Tourism: A Meta-Analytical Study of Demand, Doctoral Thesis, Graduate School of Management, Monash University, Melbourne. Dalen, E. (1989). Research into Values and Consumer Trends in Norway, Tourism Management, 10, 183-186. Dann, G. (1981). Tourist Motivation: An Appraisal, Annals of Tourism Research. 8 (2), 187-219. Davies, A. and R. Prentice (1995). Conceptualising the Latent Visitor to Heritage Attractions, Tourism Management, 16 (7), 491-500. Delamere, T. and T. Hinch (1994). Community Festivals: Understanding Resident Perspectives and Priorities, In Murphy, P. (ed), Quality Management in Urban Tourism: Balancing Business and Environment, Proceedings, University of Victoria, Victoria, 355-367. Demby, E. (1974). Psychographics and from Whence It Came. In Wells. W. (ed), Lifestyle and Psychographics, American Marketing Association, Chicago, 9-30. Dichter, E. (1984). How Values Influence Attitudes, In Pitts, R. and A. Woodside (eds), Personal Values and Consumer Psychology. Lexington Books, Lexington, 139-144. Dickman, S. (1994). Tourism in Australia; An Introductory Text (Second edition). Edward Arnold, Melbourne. Dignam, M. (1991). Evaluation of the Impact of the 1991 Tooheys’ Australian Motorcycle Grand Prix at Eastern Creek NSW, Reark Research, Sydney. Dryden, P. (1987). Assessing Economic Impacts of Regional Short Term Events, Marketing Sport and Recreation Events in Country Regions, Conference Proceedings, Department of Sport and Recreation, Melbourne, 70-84.
273
Echtner, C. and J. Ritchie (1993). The Measurement of Destination Image: An Empirical Assessment, Journal of Travel Research, 31 (4), 3-13. Engel, J., R. Blackwell, and P. Miniard (1995). Consumer Behavior (eighth edition). The Dryden Press, Orlando. Evans, G. (1995). The Role of the Festival in Urban Regeneration: Planning for the British Millennium Festival, Paper presented at International Festivals Association Second European Research Symposium, 17 August 1995, Edinburgh. Falassi, A. (1987). Festival: Definition and Morphology, In Falassi, A. (ed), Time Out of Time: Essays on the Festival, University of New Mexico Press, Albuquerque, 1-10. Faulkner, B. (1993). Evaluating the Tourism Impact of Hallmark Events, Occasional Paper No. 16, Bureau of Tourism Research, Canberra. Feather, N. (1973). The Measurement of Values: Effects of Different Assessment Procedures, Australian Journal of Psychology, 25 (3), 221-231. Feather, N. (1975). Values in Education and Society, The Free Press, New York. Fodness, D. (1994). Measuring Tourist Motivation, Annals of Tourism Research, 21 (3), 555-581. Formica, S. and M. Uysal (1996). A Market Segmentation of Festival Visitors: Umbria Jazz Festival in Italy, Festival Management & Event Tourism, 3 (4), 175-182. French, C., S. Craig-Smith and A. Collier (1995). Principles of Tourism, Longman, Melbourne. Gauthier, M. (1987). Festivals: A New Clientele, Paper presented at the TTRA Annual Conference, International Festivals Association 2nd European Research Symposium, Edinburgh. Geier, T. (1986). Make Your Events Special; How to Plan and Organise Successful Special Events Programs for Nonprofit Organisations, Cause Effective: Nonprofit Resource Development Centre, New York. Getz, D. (1986). Models in Tourism Planning; Towards Integration of Theory and Practice, Tourism Management, 7 (1), 21-32. Getz, D. (1989). Special Events: Defining the Product, Tourism Management, 10 (2), 125-137. Getz, D. (1991a). Festivals, Special Events, and Tourism, Van Nostrand Reinhold, New York.

274
Getz, D. (1991b). Assessing the Economic Impacts of Festivals and Events: Research Issues, Journal of Applied Recreation Research, 16 (1), 61-77. Getz, D. (1994a). Event Tourism: Evaluating the Impacts, In Ritchie, J. and C. Goeldner (eds), Travel, Tourism, and Hospitality Research, John Wiley & Sons, New York, 437-450. Getz, D. (1994b). Event Tourism and the Authenticity Dilemma, In Theobald, W. (ed), Global Tourism; The Next Decade, Butterworth Heinemann, Oxford, 313-329. Getz, D. (1994c). In Pursuit of the Quality Tourist, Paper presented at Tourism Down-under Conference, Massey University, Palmerston North, December. Getz, D. (1997). Event Management and Event Tourism, Cognizant Communications, New York. Getz, D. and J. Cheyne (1997). Special Event Motivations and Behaviour, in Ryan, C. (ed) The Tourist Experience; A New Introduction, Cassell, London, 136-154. Getz, D. and W. Frisby (1988). Evaluating Management Effectiveness in Community-run Festivals, Journal of Travel Research, 27 (1), 22-27. Getz, D. and W. Frisby (1990). A Study of the Role of Municipalities in Developing Festivals and Special Events in Ontario, Occasional Paper No. 16, Department of Recreation and Leisure Studies, University of Waterloo, Waterloo. Getz, D. and S. Smith (1994). Festivals and Event Tourism: Selected International Perspectives, Report prepared for the Scottish Tourist Board, Calgary. Getz, D. and B. Wicks (1993a). Editorial, Festival Management & Event Tourism, 1 (1), 1-3. Getz, D. and B. Wicks (1993b). Policy Report: Cultural Tourism Studies in Australia and Canada, Festival Management & Event Tourism, 1 (4), 163-170. Getz, D. and B. Wicks (1994). Professionalism and Certification for Festival and Event Practitioners: Trends and Issues, Festival Management & Event Tourism, 2 (2), 103-109. Goeldner, C. and P. Long (1987). The Role and Impact of Mega-Events and Attractions on Tourism Development in North America, Proceedings of the 37th Congress of AIEST, Calgary, 28, 119-131. Goldblatt, J, (1990). Special Events; The Art and Science of Celebration, Van Nostrand Reinhold, New York.

275
Gorney, S. and J. Busser (1996). The Effect of Participation in a Special Event on the Importance and Satisfaction with Community Life, Festival Management & Event Tourism, 3 (3), 139-148. Grube, J., I. Weir, S. Getzlaf and M. Rokeach (1984). Own Values System, Value Images, and Cigarette Smoking, Personality and Social Psychology Bulletin, 10, 306-313. Gunn, C. (1994). Tourism Planning (third edition). Taylor & Francis, New York. Gunter, B. and A. Furnham (1992). Consumer Profiles: An Introduction to Psychographics, Routledge, London. Hair, J., R. Anderson, R. Tatham and W. Black (1995). Multivariate Data Analysis (fourth edition). Prentice Hall, Englewood Cliffs, New Jersey. Hall, C. (1987). The Effects of Hallmark Events on Cities, Journal of Travel Research, 26 (2), 44-45. Hall, C. (1990). The Impacts of Hallmark Tourist Events, Workshop Paper at Metropolis 90, 3rd International Congress of the World Association of the Major Metropolises, Recreation & Tourism Development Branch of the City of Melbourne, Melbourne. Hall, C. (1991). Hallmark Tourist Events: Analysis, Definition, Methodology and Review, In Syme, G., B. Shaw, D. Fenton, and W. Mueller (eds) The Planning and Evaluation of Hallmark Events, Gower Publishing Company, London, 3-19. Hall, C. (1992). Hallmark Tourist Events: Impacts, Management & Planning, Belhaven Press, London. Hall, C. (1995). Introduction to Tourism in Australia; Impacts, Planning and Development (second edition). Longman Australia Pty Ltd, Melbourne. Hall, C. (1996). Hallmark Events and Urban Reimaging Strategies, In Harrison, L. and W. Husbands (eds), Practising Responsible Tourism; International Case Studies in Tourism Planning, Policy and Development, John Wiley & Sons, Toronto, 366-379. Hawkins, D. and J. Goldblatt (1995). Event Management; Implications for Tourism Education, Tourism Recreation Research, 20 (2), 42-45. Hodges, J, and C. Hall (1996). The Housing and Social Impacts of Mega-events: Lessons for the Sydney 2000 Olympics, In Kearsley, G. (ed) Tourism Down Under II; Towards a More Sustainable Tourism, Centre for Tourism, University of Otago, Dunedin, 152-166.

276
Holman, R. (1984). A Values and Lifestyles Perspective on Human Behaviour, In R. Pitts and A. Woodside (eds), Personal Values and Consumer Psychology. Lexington Books, Lexington, 35-54. Homer, P. and L. Kahle (1988). A Structural Equation Test of the Value-Attitude-Behavior Hierarchy, Journal of Personality and Social Psychology, 54 (4): 638-646. Howard, J. and A. Woodside (1984). Personal Values Affecting Consumer Psychology, In Pitts, R. and A. Woodside (eds), Personal Values and Consumer Psychology. Lexington Books, Lexington, 3-12. Hughes, H. (1993a). Olympic Tourism and Urban Regeneration, Festival Management and Event Tourism, 1 (4), 157-162. Hughes, H. (1993b). The Role of Hallmark Event Tourism in Urban Regeneration, Paper presented at The First International Conference on Investments and Financing in the Tourism Industry, Jerusalem. Hustad, T. and E. Pessemier (1974). The Development and Application of Psychographic Life Style and Associated Activity and Attitude Measures, In Wells, W. (ed), Life Style and Psychographics, American Marketing Association, Chicago, 31-70. Inskeep, E. (1991). Tourism Planning: An Integrated and Sustainable Development Approach, Van Nostrand Reinhold, New York. Iso-Ahola, S. (1982). Toward A Social Psychological Theory of Tourism Motivation: A Rejoinder, Annals of Tourism Research, 9 (2), 256-262. Jaccard, J., D. Brinberg and L. Ackerman (1986). Assessing Attribute Importance: A Comparison of Six Methods, Journal of Consumer Research, 12, 463-468. Jackson, R. (1973). A Preliminary Bicultural Study of Value Orientations and Leisure Attitudes, Journal of Leisure Research, 5, 10-22. Jago, L. and R. Shaw (1994). Categorisation of Special Events: A Market Perspective, Tourism Down Under: Perceptions, Problems and Proposals, Conference Proceedings, Massey University, Palmerston North, 682-708. Jago, L. and R. Shaw (1995). Special Event Calendars: Conceptual and Research Issues, Proceedings of the National Tourism and Hospitality Conference, CAUTHE, Melbourne, 60-73. Jago, L. and R. Shaw (1995). Special Event Calendars: Some Exploratory Research, Festival Management & Event Tourism, 3 (2), 49-58. Janiskee, R. (1994). Some Macroscale Growth Trends in America's Community Festival Industry, Festival Management & Event Tourism, 2 (1), 10-14.
277
Janiskee, R. (1996a). The Temporal Distribution of America’s Community Festivals, Festival Management & Event Tourism, 3 (3), 129-137. Janiskee, R. (1996b). Historic Houses and Special Events, Annals of Tourism Research, 23 (2), 398-414. Kahle, L. (1984). The Values of Americans: Implications for Consumer Adaptation, In Pitts, R. and A. Woodside (eds), Personal Values and Consumer Psychology. Lexington Books, Lexington, 77-86. Kahle, L., S. Beatty and P. Homer (1986). Alternative Measurement Approaches to Consumer Values: The List of Values (LOV) and Values and Life Style (VALS), Journal of Consumer Research, 13, December, 405-409. Kahle, L. and P. Kennedy (1988). Using the List of Values to Understand Consumers, Journal of Services Marketing, 2 (4), 49-56. Kamakura, W. and J. Mazzon (1991). Value Segmentation: A Model for the Measurement of Values and Value Systems, Journal of Consumer Research, 18, 208-218. Kamakura, W. and T. Novak (1992). Value-System Segmentation: Exploring the Meaning of LOV, Journal of Consumer Research, 19, 119-132. Kang, Y. and R. Perdue (1994). Long-term Impact of a Mega-Event on International Tourism to the Host Country: A Conceptual Model and the Case of the 1988 Seoul Olympics, In Uysal, M. (ed), Global Tourist Behaviour, International Business Press, New York, 205-225. Kaspar, C. (1987). The Role and Impact of Mega-Events and Attractions on National and Regional Tourism Development; Introduction into the General Topic of the 37th AIEST Congress, Proceedings of the 37th Congress of AIEST, Calgary, 28, 11-12. Keng, K. and C. Yang (1993). Value Choice, Demographics, and Life Satisfaction, Psychology and Marketing, 10 (5), 413-432. Kramer, H. (1984). The Value of Higher Education and Its Impact on Value Formation, In Pitts, R. and A. Woodside (eds), Personal Values and Consumer Psychology. Lexington Books, Lexington, 239-251. Lavenda, R. (1991). Community Festivals, Paradox, and the Manipulation of Uncertainty, Play and Culture, 4, 153-168. Law, C. (1993). Urban Tourism; Attracting Visitors to Large Cities, Mansell Publishing Limited, London. Lego, R. and R. Shaw (1992). Convergent Validity in Tourism Research: An Empirical Analysis, Tourism Management, 13 (4), 387-393.

278
Leiper, N. (1995). Tourism Management. TAFE Publications, Melbourne. Lew, A. (1987). A Framework of Tourist Attraction Research, Annals of Tourism Research, 14 (3), 553-575. Light, D. (1996). Characteristics of the Audience for ‘Events’ at a Heritage Site, Tourism Management, 17 (3), 183-190. Lilien, G. and P. Kotler (1983). Marketing Decision Making: A Model Building Approach, Harper & Row, New York. Lynch, R. and A. Veal (1996). Australian Leisure, Addison Wesley Longman Australia Pty Ltd, South Melbourne. Loudon, D. and A. Della Bitta (1993). Consumer Behavior (fourth edition). McGraw-Hill, Singapore. Macdonald, R. (1994). Special Events; The Urban Context, The British Example, Tourism Down Under: Perceptions, Problems and Proposals, Conference Proceedings, Massey University, Palmerston North, 317-330. Madrigal, R. (1995). Personal Values, Traveler Personality Type, and Leisure Travel Style, Journal of Leisure Research, 27 (2), 125-142. Madrigal, R. and L. Kahle (1994). Predicting Vacation Activity Preferences on the Basis of Value-System Segmentation. Journal of Travel Research, 32 (3), 22-28. Mannell, R. and S. Iso-Ahola (1987). Psychological Nature of Leisure and Tourism Experience, Annals of Tourism Research, 14 (3), 314-331. Marris, T. (1987). The Role and Impact of Mega-events and Attractions on Regional and National Tourism Development, Resolutions of the 37th Congress of the AIEST, Calgary, Revue de Tourisme, 4, 3-12. Mayfield, T. and J. Crompton (1995). Development of an Instrument for Identifying Community Reasons for Staging a Festival, Journal of Travel Research, 33 (3), 37-44. McCann, C. and G. Thompson (1992). An Economic Analysis of the First Western Australian State Masters Games, Journal of Tourism Studies, 3 (1), 28-34. McIntosh, R. and C. Goeldner (1990). Tourism Practices, Principles, Philosophies (sixth edition). Wiley, New York. McIntosh, R., C. Goeldner and B. Ritchie (1995). Tourism Practices, Principles, Philosophies (seventh edition). Wiley, New York.

279
Menon, A. and J. Wilcox (1994). USER: A Scale to Measure Use of Market Research, Technical Working Paper, Report No. 94-108, Marketing Science Institute, Cambridge. Meyer, P. (1970). Festivals: USA and Canada, Ives Washburn, New York. Mihalik, B. (1994). Mega-Event Legacies of the 1996 Atlanta Olympics, In Murphy, P. (ed), Quality Management in Urban Tourism: Balancing Business and Environment, Proceedings, University of Victoria, Victoria, Canada, 151-161. Mihalik, B. and M. Ferguson (1994). A Case Study of a Tourism Special Event: An Analysis of an American State Fair, Festival Management & Event Tourism, 2 (2), 75-83. Mill, R. and A. Morrison (1992). The Tourism System (second edition). Prentice Hall, Englewood Cliffs, New Jersey. Mohr, K., K. Backman, L. Gahan, and S. Backman (1993), An Investigation of Festival Motivations and Event Satisfaction by Visitor Type, Festival Management & Event Tourism, 1 (3), 89-97. Mount, J. and C. Leroux (1994). Assessing the Effects of a Mega-event: A Retrospective Study of the Impact of the Olympic Games on the Calgary Business Sector, Festival Management & Event Tourism, 2 (1), 15-23. Mowen, J. (1993). Consumer Behaviour (third edition). Macmillan Publishing Company, New York. Mueller, W. and D. Fenton (1989). Psychological and Community Issues, In Syme, G., B. Shaw, D. Fenton and W. Mueller (eds), The Planning and Evaluation of Hallmark Events. Gower Publishing Company Limited, Hants, England, 274-285. Mules, T. and B. Faulkner (1996). An Economic Perspective on Special Events, Tourism Economics, 2 (2), 107-117. Muller, T. (1989). Using Personal Values to Define Segments in an International Tourism Market, International Marketing Review, 8 (1), 57-70. Muller, T. and N. Woodcock (1997). Tracking the Values of Ageing Baby Boomers: will Middle Age be Making a Difference?, Australasian Journal of Market Research, 5 (1), 33-48. Munson, J. (1984). Personal Values: Considerations on Their Measurement and Application to Five Areas of Research Inquiry, In Pitts, R. and A. Woodside (eds), Personal Values and Consumer Psychology. Lexington Books, Lexington, 13-33. Munson, J. and S. McIntyre (1978). Personal Values: A Cross-cultural Assessment of Self Values and Values Attributed to a Distant Cultural Stereotype, In Hunt, H. (ed),

280
Advances in Consumer Research, Ann Arbor: Association for Consumer Research, Michigan, 160-166. Murphy, P. (ed) (1997). Quality Management in Urban Tourism, John Wiley and Sons Ltd, West Sussex. Murphy, P. and B. Carmichael (1991). Assessing the Tourism Benefits of an Open Access Sports Tournament: The 1989 B.C. Winter Games, Journal of Travel Research, 29 (3), 32-36. Myers, J. and M. Alpert (1977). Semantic Confusion in attitude Research: Salience vs. Importance vs. Determinance, In Perreault, W. (ed), Advances in Consumer Research, 4, Association for Consumer Research, Atlanta, 106-110. National Task Force on Tourism Data (1986). Identifying and Measuring Festivals and Special Events, Report of the Project Team on Festivals and Special Events, Ottawa. NIEIR (1990). The Economic Impact of the 1990 Ford Open at the National Tennis Centre Melbourne, NIEIR, Melbourne. Ness, T. and M. Stith (1984). Middle-Class Values in Blacks and Whites, In Pitts, R. and A. Woodside (eds), Personal Values and Consumer Psychology. Lexington Books, Lexington, 231-237. Nicholls, J., H. Laskey and S. Roslow (1992). A Comparison of Audiences at Selected Hallmark Events in the United States, International Journal of Advertising, 11, 215-225. Norusis, M. (1994). SPSS Professional Statistics 6.1, SPSS Inc., Chicago. Novak, T. and B. MacEvoy (1990). On Comparing Alternative Segmentation Schemes: The List of Values (LOV) and Values and Life Styles (VALS), Journal of Consumer Research, 17, June, 105-109. Page, S. (1995). Urban Tourism, Routledge, London. PATA (1992). Endemic Tourism; A Profitable Industry in a Sustainable Environment, PATA Think Tank, Sydney. Pearce, P. (1991). Analysing Tourist Attractions. Journal of Tourism Studies, 2 (1), 46-55. Pearce, P. (1993). Fundamentals of Tourist Motivation, In Pearce, D. and R. Butler (eds), Tourism Research: Critiques and Challenges, Routledge, London, 113-134. Pitts, R. and A. Woodside (1984). Personal Values and Market Segmentation: Applying the Value Construct, In Pitts, R. and A. Woodside (eds), Personal Values and Consumer Psychology. Lexington Books, Lexington, 55-67.

281
Pitts, R. and A. Woodside (1986). Personal Values and Travel Decisions, Journal of Travel Research, 25 (1), 20-25. Plog, S. (1994). Developing and Using Psychographics in Tourism Research, In Ritchie, J. and C. Goeldner (eds), Travel, Tourism, and Hospitality Research (second edition). John Wiley & Sons, New York, 209-218. Prakash, V. (1984). Personal Values and Product Expectations, In Pitts, R. and A. Woodside (eds), Personal Values and Consumer Psychology. Lexington Books, Lexington, 3-12. Price Waterhouse (1993). 1992 Formula One Grand Prix: Economic Evaluation, Price Waterhouse, Canberra. Prosser, G. (1993). Mansell Meets Mozart: Event Tourism in Adelaide, South Australia, Festival Management & Event Tourism, 1 (3), 125-130. Pyo, S., R. Cook, and R. Howell (1988). Summer Olympic Tourism Market; Learning From the Past, Tourism Management, 9 (2), 137-144. Reynolds, T. and J. Jolly (1980). Measuring Personal Values: An Evaluation of Alternative Methods, Journal of Marketing Research, 17, November, 531-536. Richins, M. and S. Dawson (1992). A Consumer Values Orientation for Materialism and Its Measurement: Scale Development and Validation, Journal of Consumer Research, 19, December, 303-316. Ritchie, B. (1996). How Special are Special Events? An Impact Study of the National Mutual New Zealand Masters Games on Dunedin’s Economy, in Kearsley, G. (ed) Tourism Down Under II; Towards a More Sustainable Tourism, Centre for Tourism, University of Otago, Dunedin, 73-79. Ritchie, J. (1984). Assessing the Impact of Hallmark Events: Conceptual and Research Issues, Journal of Travel Research, 23 (1), 2-11. Ritchie, J. (1990). Promoting Calgary Through the Olympics; The Mega-Event as a Strategy for Community Development, In Fine, S. (ed), Social Marketing, Allyn & Bacon, Boston, 258-274. Ritchie, J. and D. Beliveau (1974). Hallmark Events: An Evaluation of a Strategic Response to Seasonality in the Travel Market, Journal of Travel Research, 13 (2), 14-20. Ritchie, J. and B. Smith (1991). The Impact of a Mega-Event on Host Region Awareness: A Longitudinal Study, Journal of Travel Research, 30 (1), 3-10.

282
Ritchie, J. and J. Yangzhou (1987). The Role and Impact of Mega-Events and Attractions on National and Regional Tourism: A Conceptual and Methodological Overview, Proceedings of the 37th Congress of AIEST, Calgary, 28, 17-58. Robinson, A. and J. Noel, (1991). Research Needs for Festivals: A Management Perspective, Journal of Applied Recreation Research, 16 (1), 78-88. Roche, M. (1994). Mega-events and Urban Policy, Annals of Tourism Research, 21 (1), 1-19. Rokeach, M. (1968). The Nature of Human Values. The Free Press, New York. Rokeach, M. (1979). From Individual to Institutional Values: With Special Reference to the Values of Science, In Rokeach, M. (ed), Understanding Human Values; Individual and Societal, The Free Press, New York, 47-70. Rooney, J. (1988). Mega-sports Events as Tourist Attractions: A Geographical Analysis, In Tourism Research: Expanding Boundaries, The Travel and Tourism Research Association Nineteenth Annual Conference, Montreal, 93-99. Roslow, S., J. Nicholls and H. Laskey (1992). Hallmark Events and Measures of Reach and Audience Characteristics, Journal of Advertising Research, July/August, 53-59. Ross, G. (1994). The Psychology of Tourism, Hospitality Press, Melbourne. Ryan, C. (1994). Leisure and Tourism; The Application of Leisure Concepts to Tourist Behaviour - A Proposed Model, Tourism, The State of the Art, Strathclyde University, Glasgow, 294-307. Ryan, C. (1995). Researching Tourist Satisfaction; Issues, Concepts, Problems, Routledge, London. Ryan, C. (ed) (1997). The Tourist Experience: A New Introduction, Cassell, London. Ryan, C., A. Smee and S. Murphy (1996). Creating a Data Base of Events in New Zealand: Early Results, Festival Management & Event Tourism, 4 (3/4), 151-155. Schiffman, L., D. Bednall, J. Watson and L. Kanuk (1997). Consumer Behaviour, Prentice Hall Australia Pty Ltd, Sydney. Schneider, I. and S. Backman (1996). Cross-Cultural Equivalence of Festival Motivations: A Study in Jordan, Festival Management & Event Tourism, 4 (3/4), 139-144. Schofield, L. (1995). Making and Marketing a Festival, SMARTS, Department of Communications and the Arts, Canberra, 4, 7-8.

283
Schwartz, S. and W. Bilsky (1987). Toward a Universal Psychological Structure of Human Values, Journal of Personality and Social Psychology, 53 (3), 550-562. Scott, D. (1996). A Comparison of Visitors’ Motivation to Attend Three Urban Festivals, Festival Management & Event Tourism, 3 (3), 121-128. Shih, D. (1986). VALS as a Tool of Tourism Market Research: The Pennsylvania Experience, Journal of Travel Research, Spring, 2-11. Shultis, J., M. Johnston and D. Twynam (1994). Social Impacts of a Hallmark Event; Development and Description of a Case Study in Thunder Bay Ontario, In Murphy, P. (ed), Quality Management in Urban Tourism: Balancing Business and Environment, Proceedings, University of Victoria, Victoria, 166-177. Smith, S. and G. Godbey (1991). Leisure, Recreation and Tourism, Annals of Tourism Research, 18 (1), 85-100. Socher, K. and P. Tschurtschenthaler (1987). The Role and Impact of Mega-Events: Economic Perspectives - The Case of the Winter Olympic Games 1964 and 1976 at Innsbruck, Proceedings of the 37th Congress of AIEST, Calgary, 28, 103-117. Solomon, M. (1992). Consumer Behaviour, Allyn and Bacon, Boston. Sonmez, S., S. Backman and L. Allen (1993). Crisis Management for Event Tourism, Festival Management & Event Tourism, 1 (3), 110-120. Soutar, G. and P. McLeod (1993). Residents' Perceptions on Impact of the America's Cup, Annals of Tourism Research, 20 (3), 571-582. Sparrow, M. (1989). A Tourism Planning Model for Hallmark Events, In Syme, G., B. Shaw, D. Fenton and W. Mueller (eds), The Planning and Evaluation of Hallmark Events, Gower Publishing Company Limited, Hants, England, 250-262. Spilling, O. (1996). Mega-Event as a Strategy for Regional Development: The Case of the 1994 Lillehammer Olympic Games, Proceedings of Institute of Tourism and Service Economics, International Centre for Research and Education in Tourism, International Conference, Innsbruck, 128-154. Stokes, R. (1996). Identifying Dimensions of a Portfolio Analysis Model for Events Tourism, Working Paper presented at Australian Tourism and Hospitality Research Conference, Coffs Harbour. Swarbrooke, J. (1995). The Development & Management of Visitor Attractions, Butterworth Heinemann Ltd, Oxford. The Centre for Hospitality and Tourism Research (1994). Shell Presents Van Gogh: His Sources, Genius and Influences, Victoria University, Melbourne. The Oxford English Dictionary (1933). Oxford University Press, Oxford.

284
Theobold, W. (ed) (1994). Global Tourism; The Next Decade, Butterworth-Heinemann Ltd, Oxford. Thrane, C. (1997). Vacation Motives and Personal Value Systems, Journal of Vacation Marketing, 3 (3), 234-244. Tinsley, E. and B. Eldredge (1995). Psychological Benefits of Leisure Participation: A Taxonomy of Leisure Activities Based on Their Need-Gratifying Properties, Journal of Counselling Psychology, 42 (2), 123-132. Tinsley, E. and T. Johnson (1984). A Preliminary Taxonomy of Leisure Activities, Journal of Leisure Research, 16 (3), 234-244. Torkildsen, G. (1992). Leisure and Recreation Management, E & FN Spon, London. Tourism Canada (undated). Planning Festivals and Events, Ottawa. Tourism Canada (1989). Festivals and Events; A Position Paper, Tourism Canada, Ottawa. Tourism Canada (1990). Proposed Action Plan for the Development of the Festivals and Events Sector, Tourism Canada, Ottawa. Tourism South Australia (1990). Planning of Festivals and Special Events, Tourism South Australia, Adelaide. Tourism Victoria (1993). Strategic Business Plan 1997-2001; Building Partnerships, Tourism Victoria, Melbourne. Tourism Victoria (1996). Victorian Regional Travel and Tourism Survey, 1995, Tourism Victoria, Melbourne. Tourism Victoria (1997). Strategic Business Plan 1997-2001; Building Partnerships, Tourism Victoria, Melbourne. Travis, A. and J. Croize (1987). The Role and Impact of Mega-Events and Attractions on Tourism Development in Europe: A Micro Perspective, Proceedings of the 37th Congress of AIEST, Calgary, 28, 59-78. Um, S. and J. Crompton (1990). Attitude Determinants in Tourism Destination Choice, Annals of Tourism Research, 17 (3), 432-448. Uysal, M., L. Gahan, and B. Martin (1993). An Examination of Event Motivations: A Case Study, Festival Management & Event Tourism, 1 (1), 5-10. Uysal, M. and R. Gitelson (1994). Assessment of Economic Impacts: Festivals and Special Events, Festival Management & Event Tourism, 2 (1), 3-9.

285
Vinson, D., J. Scott, and L. Lamont (1977). The Role of Personal Values in Marketing and Consumer Behavior, Journal of Marketing, April, 44-50. Walle, A. (1996). Festivals and Megaevents: Varying Roles and Responsibilities, Festival Management & Event Tourism, 3 (3), 115-119. Wells, J. (1994). Floriade: A Study in Re-imaging Australia's Capital Through Event Tourism, Working paper at Tourism Down-Under Conference, Massey University, Palmerston North. Wells, W. (1975). Psychographics: A Critical Review, Journal of Marketing Research, 12, May, 196-213. Wicks, B. and D. Fesenmaier (1995). Market Potential for Special Events: A Midwestern Case Study, Festival Management & Event Tourism, 3 (1), 25-31. Williams, P., D. Hainsworth and K. Dossa (1995). Community Development and Special Event Tourism: The Men's World Cup of Skiing at Whistler, British Columbia, The Journal of Tourism Studies, 6 (2), 11-20. Williams, R. (1979). Change and Stability in Values and Value Systems: A Sociological Perspective, In Rokeach, M. (ed), Understanding Human Values; Individual and Societal, The Free Press, New York, 15-46. Wilson, J. and L. Udall (1982). Folk Festivals: A Handbook for Organisation and Management, University of Tennessee Press, Knoxville. Witt, S. (1988). Mega-events and Mega-attractions, Tourism Management, 9 (1), 76-77. Witt, S. and L. Moutinho (1995). Tourism Marketing and Management Handbook (Student Edition). Prentice Hall, London. Woodside, A. and S. Lysonski (1989). A General Model of Traveler Destination Choice, Journal of Travel Research, 27 (4), 8-14. Youell, R. (1995). Leisure and Tourism, Longman, Essex. Zikmund, W. (1991). Business Research Methods (third edition). The Dryden Press, Orlando. Zwolak, R. (1987). Hallmark Events and their Economic Impact, Marketing Sport and Recreation Events in Country Regions, Conference Proceedings, Department of Sport and Recreation, Melbourne, 7-25.

286
APPENDICES

287
APPENDIX A
SPECIAL EVENT ATTRIBUTE QUESTIONNAIRE

288
APPENDIX B
SPECIAL EVENT MAIL BACK QUESTIONNAIRE

289
APPENDIX C
ACTIVITY, INTEREST AND OPINION (AIO) MASTER LIST

290
APPENDIX D
INTERVIEWER ADMINISTERED QUESTIONNAIRE
This appendix contains a reformatted copy of the questionnaire and the showcards that were used in the face-to-face interviews of 500 randomly selected Melbourne residents.

291
APPENDIX E
RELATIONSHIPS BETWEEN THE LOV AND THE THREE DIMENSIONS OF VISITATION

292
Listed below are the abbreviations used in Appendices E, F and G. LOV FULFIL Self-fulfilment SECURE Security ACCOMP A sense of accomplishment BELONG Sense of belonging WARM Warm relationships WELLRES Being well respected EXCITE Excitement SELFRES Self respect FUN Fun and enjoyment in life AIOs VFR I frequently visit friends and relatives. EXCITING I like to participate in exciting activities. SHOP I frequently go shopping. RAWDEAL I feel that I get a raw deal out of life in general. DINING I frequently dine in restaurants. TLKABOUT I like to talk about an experience afterwards. MASTER I enjoy mastering things. DRIVE I frequently go driving to sightsee or just for pleasure. CREATIVE I like to be creative. GALLERY I frequently visit an art gallery or craft centre. PHYSABIL I like to use my physical abilities. FESTIVAL I frequently attend a festival, special or sports event. INTERACT I like to interact with others. THEATRE I frequently attend the theatre or a concert. IMAGINAT I like to be involved in activities that require imagination. MUSEUM I frequently visit a museum or historic site. WATERSKI I frequently water-ski. TRADVIEW I am traditional in my views on social issues and social trends in Australia. CINEMA I frequently go to the cinema / movies. CASINO I frequently gamble, go to a casino, or play gaming machines. FAMENJOY I like doing things the whole family can enjoy. DISCO I frequently go to a nightclub / disco / or other form of nightlife. CALM I like to be in a calm atmosphere. TRENDY I enjoy participating in activities that are seen to be trendy. UNIONPOW I believe that unions have too much power. SKILLS I like to improve my skill and ability. WINERY I frequently visit a winery. LEARN I like to learn about myself. THEMEPAR I frequently visit a theme, amusement or historic park. CURIOUS I seek to satisfy my curiosity. BUSHWALK I frequently go bushwalking. MEANING I like to make things more meaningful to me. AIOs (continued)

293
FOREST I frequently visit a national park / forest. REST I like to rest and relax. BOATING I frequently go sailing or boating. FOODWINE I enjoy food and wine. ZOO I frequently visit animal / wildlife parks / zoos. MARIJUAN I believe that the smoking of marijuana should be made legal. COMPETE I like to compete against others. SWIM I frequently go swimming / surfing / diving. ENTERTAI I like to be entertained. PARK I frequently visit a park or garden. RELIGION I believe that religion should be taught in Government schools. FISHING I frequently go fishing. KNOWLEDG I seek to expand my knowledge. SAVE I think that it is important to save money rather than spend it all now. FRIENDS I enjoy being with my friends. ENJOY I like to be with people who are enjoying themselves. PACECHG I like a change of pace from everyday life. EDUCATE I believe that all education should be paid for by the government. SPORT I frequently play sport (eg. golf, tennis) SELFRELY I believe that people should rely on themselves and not just the government. SOCIAL I like to be socially competent and skillful. HOMEWOM I believe that a woman’s role is taking care of the home. SNOWSKI I frequently go snow skiing. MENTCHAL I like to participate in an activity that is mentally challenging. ADVENTUR I frequently participate in adventure activities (eg. rafting, horseriding) GROUP I frequently participate in organised tours or group activities. VISITOR ATTRACTIONS SOVHILL Sovereign Hill, Ballarat DEBORT De Bortoli Winery, Dixons Creek NATGAL National Gallery of Victoria, Melbourne BENDPOT Bendigo Pottery, Bendigo PENGUIN Penguin Parade, Phillip Island POWERWKS Powerworks (Formerly tour of SEC power plant), Morwell BERRY ‘Pick-your-own’ Fruit and Berry Farm, Drouin West METEOR Bureau of Meteorology, Melbourne SCIENCE Scienceworks Museum, Melbourne PUFFING Puffing Billy, Belgrave MONWLD Our World of Money, Craigieburn (Australian Mint) TAPEST Victorian Tapestry Workshop, South Melbourne RIALTO Rialto Towers Observation Deck, Melbourne PARLIAMT Tour of Parliament House, Melbourne STOCKEX Tour of the Australian Stock Exchange, Melbourne ARTCENT Backstage tour of the Victorian Arts Centre, Melbourne VISITOR ATTRACTIONS (continued) MCG Behind the scenes tour of the Melbourne Cricket Ground (MCG)
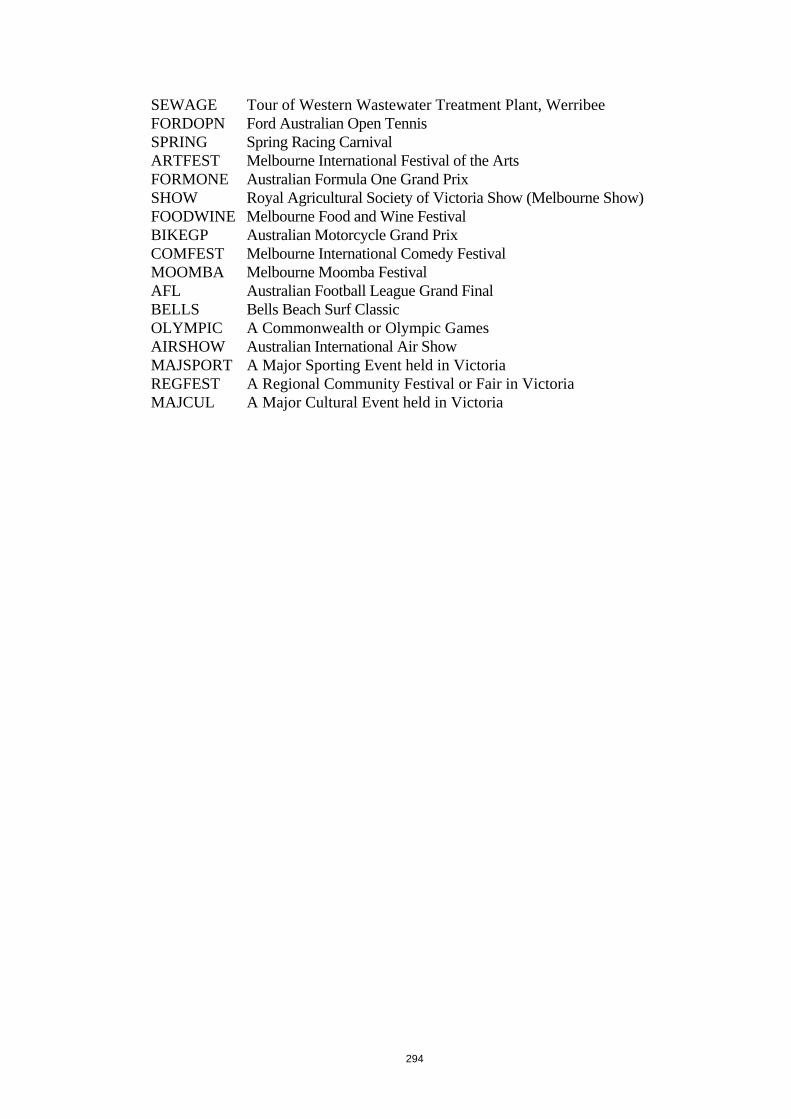
294
SEWAGE Tour of Western Wastewater Treatment Plant, Werribee FORDOPN Ford Australian Open Tennis SPRING Spring Racing Carnival ARTFEST Melbourne International Festival of the Arts FORMONE Australian Formula One Grand Prix SHOW Royal Agricultural Society of Victoria Show (Melbourne Show) FOODWINE Melbourne Food and Wine Festival BIKEGP Australian Motorcycle Grand Prix COMFEST Melbourne International Comedy Festival MOOMBA Melbourne Moomba Festival AFL Australian Football League Grand Final BELLS Bells Beach Surf Classic OLYMPIC A Commonwealth or Olympic Games AIRSHOW Australian International Air Show MAJSPORT A Major Sporting Event held in Victoria REGFEST A Regional Community Festival or Fair in Victoria MAJCUL A Major Cultural Event held in Victoria

295
APPENDIX F
RELATIONSHIPS BETWEEN AIOs AND THE THREE DIMENSIONS OF VISITATION

296
APPENDIX G
RELATIONSHIPS BETWEEN THE LOV AND AIOs