spe - ntnucurtis/courses/reservoir-recovery/... · formation compaction treated with a constant...
TRANSCRIPT

SPE SPE 22921
APPLICATION OF A GENERAL MATERIAL BALANCE FOR HIGH-PRESSURE GAS RESERVOIRS
by M. J. Fetkovich, D. E. Reese, and C. H. Whitson, Phillips Petroleum Co.
SPEMembcts
Ccpynght 1991, Society o1 Petroleum E119i,,..,. Inc. Thio - was prepared lot pr-1•11011 al the 661h Annual TchnicaJ Ccnterence and Exhibition ol lhe Society ol "-um e_.. held in Dallas. TX. OetOber 6-9. 1991. This - WU Mlec!ed lo, pr-t•tion by an SPE Program Committee followtng - o1 information contained in an lbslrlld SUCffllfted by the tut11or1s1. Cont- ol lhe -.u presented. haw not been ,...,,_ by the Society of P- Ef19,,_,. and are subject to correct,on by the authorts). The maiW\al. u -.cl. does not MC-,,ty nt11ec:any pos,t,on of the Society ol PetrOleum Engineers. rtS oflteerS. o, members. P-,s presented at SPE meetings are Subf«l to l)UbllCAIJ0rl ,...,,_ by Editonal ComtMtea of the Soc,r.yol PW0ieum �- Plffl!IUIOn toc:q,y • rNlnCl80to an-.:t ol not men than 300 wudl. �may not becap,ed. The---conllCliCUOUl ada-iedgnwftol -. and by whom the - • presenUld. wnte Publica- Manager. SPE. P.O. Box 8338:le. Rlchardaon. TX 75083-3836 U..s.A. r-. 7309111 SPEOAL
Abstract This paper presents the derivation of a general gu material balance that has particular application to high pressure gas reservoin. The material balance is valid �or both �ormal-prc.uure and over-pressured (geopressured) reservom. Its main application is to calculate original gas in place and usist in calculating remaining recoverable reserves Crom pressure-production data.
The form of the material balance equation is
(plz)[l-c.(p)(p,-p)J • (p/z),(1-G/G) ............. .. (1)
which includes a pressure-dependent cumulative effective comp�sibility term c.(p) that is defined in terms of the following reservou parameters: (1) pore compressibility, (2) water compressibility, (3) gas solubility, and (4) total water associated with the gas reservoir volume. • Associated• water includes connate water �� with� interbedded shales and non-pay reservoir roclc, and any �ted aquifer volume. c. physically reprcaenta the cumulative change m hyd�n pore volume caused by comprcaaibility effects and encroaching water.
High prcasure gas ,cservoin typically have curved p/z-G plots � conca�e downwan_f ). I!lcorrect e�polation. of early data may' resultin senoua overestunatton of onginal gas in place and remaining recov�rable l"C;'erves. The propo� form of the gas material balance equa�on provides a_ �cthod to linearize the p/z-G, plot and thereby predict_ th<: � on� gas in place. A method is suggested todctcrr�une wtial g�. � place by analyzing the behavior of cumulativeeffec�ve comp�sibility �aclccalculated Crom prcasure-production data. The c.(p) �net.ion determined by this procedure, or estimated Crom logs �d geological maps (when sufficient production data is not available), IS then used to forecast pressure-cumulative behavior.
For ff!Ost reservoin c. is fairly constant through most of depiction. The mapu�� of c.(p? at initial pressure usually ranges from IS to 1�10"") psi , depending mostly on the volume of water associated with the gas rese�oir. As defined in this paper, all components of c. represent cumulative volume changes; i.e., instantaneous water and rock comprcssibilities are not used directly.
References and illustrations at end of paper.
We show that the effect of pore collapse on high pressure gas reservoin is generally positive, providing additional pressure support. There is not a clear discontinuity in the behavior of p/z-G, where pore collapse occurs, and pore colla.psc tends to flatten or increase p/z-G, at lower presaurca.
c. may increase significantly at lower prcasurcs because of gusolubility effccu. An example is given for a large gu reservoir with high-CO2 content that requirca an increasing c. term at lower pressures to linearize the p/z-G, plot; the increasing c. behavior is substantiated by calculations based on gas 10lubility effccu.
The proposed gu material balance is applicable (and should be applied) to any high pressure gas reservoir with an appreciable volume of associated water. Numerous field examples arc provided showing the application of the material balance equation to high pressure gas reservoin.
Introduction High pressure gas reservoirs experiencing depiction drive typically have downward curving plz-G, behavior. Incorrect extrapolation of early depletion data may result in serious over estimation of original gas in place and remaining reserves. Bruns ct al.1 work in 1965 was a result of a field study conducted on a large moderately overpressured gas reservoir in the Texas Gulf Coast area. Investments were made, and never needed, bued on linear extrapolation of the early field p/z-G performance to an apparent original gu in place that wu later found tcibe overstated by about 200 Bscf. Fig. S in Ref. 1 (Run 20) shows the concave downward curvature typical for the pressure response of a conventional limited external aquifer system that simulated the reservoir's response.
This type of "limited" aquifer behavior where pressure in the reservoir and aquifer arc virtually equal led to the derivation in 1969 of a general material balance for high pressure gas reservoin. The derivation includes prcasure-dcpcndcnt roclc and water compressibility (with gas evolving from solution). All water and rock volumes associated with the reservoir and available for expansion, including a limited aquifer volume, were included in a cumulative effective compressibility term c.(p). Rocle and water compressibilitica were defined to account for cumulative changes in pore volume to be multiplied by the cumulative pressure drop (p.p); instantaneous compressibilitica are not used at all. The final form of the material balance is similar to that published by RJunogast and Farshad2, except
2 APPLICATION OF A GENERAL MATERIAL BALANCE FOR HIGH PRESSURE GAS RESERVOIRS SPE 22921
that Ref. 2 considered c. u a constant. The 1969 derivation u presented in this paper defines a cumu�tive effective co1:1prcssib�ty c0(p) u a function of pressure expressed m terms of rcscrvotr properties and volumes.
Literature Review Harville and Hawk::inss and Hammerlindl4 attribute the concavedownward shape of plz-G, curves obtained in ab�rmally prcss�rcd gas n:scrvoin entirely to pore collapse and formauon compacUon. No definition of pore collapse is given in Ref. 3, but a plot of back:calculated pore volume change indicated a system compressibility change from 28(10"6) psi•1 at initial pressure to about �10:6) psi•1 at_ lowpressures. This magnitude of pore volume change unplies usociatcd water volume. The decrcuing •system• compressibility is expected for an overpressured reservoir with pressure dcpcndcnt pore volume compressibility, and bucd on results presented in this paper pore collapse is Mt a necessary condition for such behavior.
The Anderson "L • reservoir performance presented by Duggan.!
shows curved p/z-G, field behavior which was primarily attributed to shale water influx wtth no evidence of reservoir pore compaction. The water influx drive mechanism was supported by the fact that several wells watered out. Wallace', in a 1969 paper, also concluded that shale water influx is an important drive mechanism in abnormally pressured gu reservoin. Bass7 discounts shale water influx, and attributes curved p/z-G, behavior to peripheral water influx from a limited aquifer and formation compaction treated with a constant pore volume compressibility c,. For a limited aquifer Bus defines a term F u �e ratio of peripheral water pore volume to the pore volume of gas.t;.rmg rock.
Roach' and Ramagost and Farshad2 both utilize the term p/z(lc0(p.p)] for gcopressuredand abnormallyp�suredgu reservoin. �� authors consider c0 a constant and they consider only the Anderson L example.
Bernanr' docs not accept the rock: collapse theory u the cause for ovcrpressured p/z�
., behavior, concluding that water influx is the buic
drive mechanism. He also usca p/z(l-c(p,-p)) where c is a "catch-all" approximation for treating the effects of rock: and water compressibility, a small steady-state acting aquifer, and steady state shale water influx. He further states that the term c is virtually impossible to quantify in terms of reservoir propcrtica.
Begland and Whitehead 1°, Prasad and Rogera11, and Wang andTcudalc12 all present studies of overpressured gu rcscrvoin bucd on computer models. Refs. 10 and 11 treat c, and c,. as functions of pressure, including the effect of solution gu in the water. Extcmal water sources arc also included in Refs. 11 and 12. The differential forms of the material balance used in these refcrcncc, correctly apply instantaneous compressibility in a history matching approach to determine initial gu in place. A direct plot of (p/z)(l-c0(p.-p)) versus G, wu not made because the c
0 tenn had not been defined.
Poston and Chcn13 analyzed several abnormally pressured gu rcscrvoin, and recognized that calculated valuea of c
0 > 30(10'6) psi•'
required to lincarizc the material balance equation reflected the influence of water influx.
Bourgoync14 demonstrates that reasonable values of shale permeability and compressibilitics treated u a function of pressure can be used to match abnormal gu reservoir performance behavior. He points out, however, that determining le and c, of the shale necessary for modelling this behavior is virtually impossible.
Ambastha.., UICI Bourgoync's general material balance equation to develop a graphical matching technique bucd on a constant effective compressibility c •. The example considered shows a lack: of uniqueness in determining initial gu in place.
General Material Balance The general form of the gas material balance derived in Appendix A is:
pf l - c (p)(p -p)] =1 e I
(2) (p/ ) . -
(p/z), [o - G +WR + 5·615tw B - W B - W ']z • G , "' , - B \ .. , w "' ., el I
which reduces to Eq. 1 when water terms and gu injection can be neglected. The cumulative effective compressibility term c0
(p) is pressure dependent consisting of a cumulative pore volume compressibility ci(p), cumulative total water compressibility yp), and the total pore and water volumes associated (i.e. in pressure communication) with the gu reservoir,
_ s c,.,(p)+c,(p)•MCc,.(p )+c,(p)J C (p) • • .............. (3) • 1-s.
,. The formation and total water compressibility terms er and c.., account for cumulative changes in pore volume from initial pressure to the current pressure.
The interbcdded non-pay volume and limited aquifer contributions to pressure support arc quantified in terms of the M ratio,
V pHNP (NON-NET PAY)+ V pAQ (LIMITED AQUIFER) M •
V ,a (NET PAY RESERVOIR) (4)
An important upcct of the material balance for high-pressure gas rcscrvoin is that the gu in solution in the connatc and usociatcd water provide both pressure support and additional gu available for production. The level of pn:ssure support provided by the evolved solution gu depends on the level of depiction, and it is shown that this support is significant below about 1500 psia. The solution gu available for production also depends on the level of depiction, i.e. how much of the original solution gu hu evolved [R..,(p-.)-R_(p)) and the quantity of this gu that is mobile.
The term G is used for the inilial fru gas in place, and it is this quantity that will be dctcnnincd from the material balance plot given by Eq. 1 when extrapolated to (p/z)(l-c.(P;-p)]=O. Thia condition is reached at a pressure when c.(p)(p;-p)=O, and not when p=O, i.e. additional gu may be produced after G, reaches original free gas in place G. At pressures where G, exceeds G the corrected p/z term (p/z)[l-c.(P;-p)) becomes negative. If pressure could be brought to standard conditions (p=p..) the total gu produced would be G plus the total solution gu in place G., G,(@p..)= G+G,.
The effect of connatc water saturation S... and M arc important tothe magnitude of c0
• With typical values of cr=c6=4(1o-6) psi•1 andc.,=c,.=3(1O4) psi•' for a high-pressured Gulf Coast sandstone reservoir the cumulative effective compressibility is initially a. =7 .5(1 o·6) psi•' for S,..=35� and M=O; and c.= 15(10"6) for S,..=35� andM=l. Fig. 1 shows the pen:cntage of true original free gas in placethat would be overestimated by extrapolating early p/z-G, data,indicating that the overestimation is greater for larger initial pressureand higher c. valuea at initial conditions. For an initial pressure of10,000 psia and a c. = 10(10"6) psi•1 the extrapolation of early data givesan estimate of G that is about 25 percent higher than the true originalfree gu in place. The sections below discuss the calculation of ci(p) andc...(p) functions.
Cumulative Pore Volume Compressibility er. The material balance presented in this paper uses a c101111lative pore volume compressibility Cr defined u
c,(p) • _1 [V,.-V,(p)] ...................... (5)V,. Pi-p

SPE 22921 M.I. FETKOVICH, D.E. REESE, AND C.H. WHITSON 3
The term in brackcu is the slope of the chord from the initial condition (J>.,V p> to any lower pressure (p,V ,) , u shown � fig. 2. � implies that Cr is a function of both pressure and the 101Ual condition. The instantaneous pore volume compressibility c, is defined u
1 av,c,(p) • -
v, ap ..••.•••• .••..•..•.•..•••• .. (6)
and is only a function of pressure. At initial pressure the two pore volume compressibilities arc equal: c,(p;)=cr(p;). The instantaneous compressibility function c,(p) should be used in reservoir simulation and differential forms of the material balance, while the cumulative compressibility function c,(p) should be used with forms of the material balance that apply the cumulative pressure drop (P.-p), i.e. p/z vs G, plots.
The pressure dependence of cr is best determined by special core analysis under appropriate reservoir conditions. Table 1 summarizca the calculation of c, u a function of pressure using laboratory data for a Gulf Coast sandstone. Fig. 3 shows how c, and Cr vary u a function of prcasurc for this overpressurcd reservoir rock.
In the absence of pore collapse er is always greater than or equal to Cr· The cumulative pore volume compressibility remains higher than the instantaneous compressibility because of an averaging effect that rcduca the pressure dependence of c, compared with c,. An important consequence of this behavior is that a rock exhibiting large pore volume change because of a high level of overpressure (and consequently with a high initial er value dropping rapidly to a •normal" value) will initially have and maintain a high cumulative compressibility c, u shown in Fig. 3.
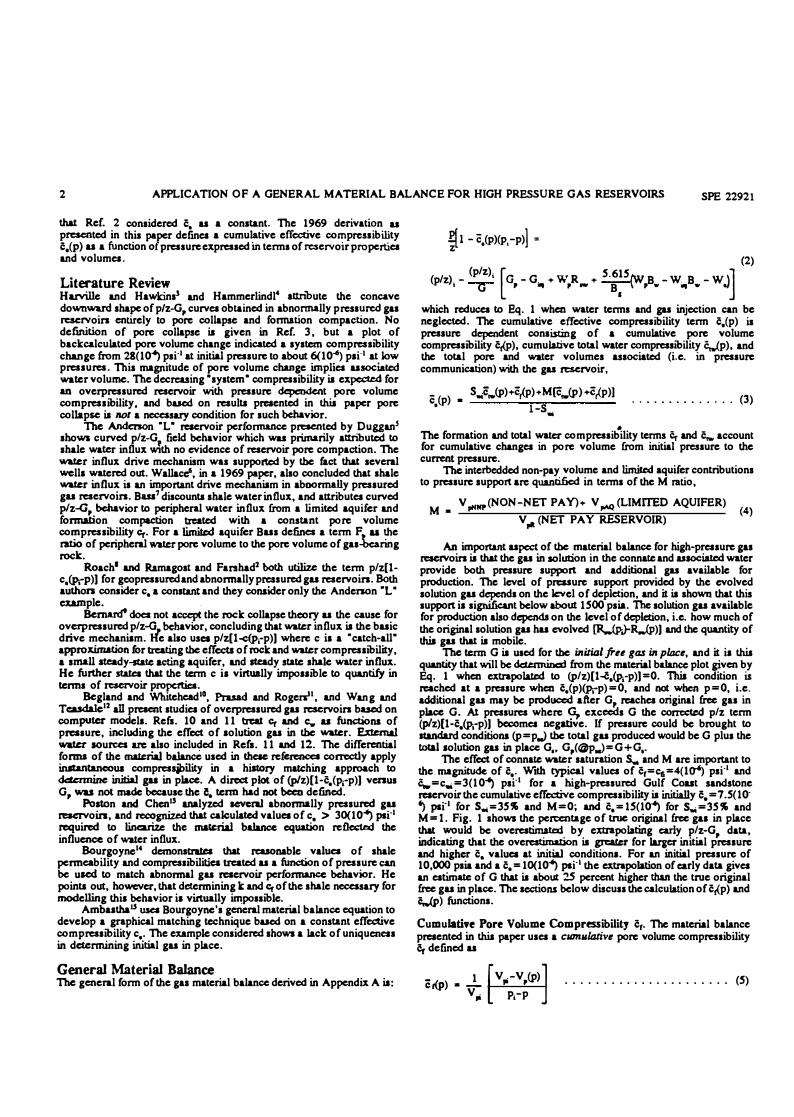
Pore collapse is defined u the condition when a rock's instantaneous pore volume compressibility starts to increase at decreasing reservoir pressure. Pore collapse provides greater pressure support when collapse occurs at a high pressure. However, pore collapse is not reflected by the c.(p) function and will not therefore be scco on the p/z-G, plot at the pressure when pore collapse occurs. In fact pore collapse may not be identifiable at all on the cu_mulative compressibility term. For example, the Gulf Coast sandstone 10 Fig. 3 exlubits pore collapse at 4000 psia (about 5000 psi less than initial pressure p;). Despite the incrcuc in c, from 4 to 25(10"4) pai•1 in the prcasure range 4000 to 1000 psia, the change in c, over the same pressure range is almost insignificant. Fig. 4 shows a North Sea Chalksample from a reservoir with initial pressure of 7000 psia exhibitingpore collapse at 6000 psia. Herc the effect of pore collapse is greater, causing cr to increase from 6 to 20(10"4) psi•' in the pressure range from 6000 to 2000 psia. In general, howe11er, pore collapse in and of itselfdoes not have a significant effect on the plt.-G, plot.
In the absence of laboratory data, pore volume compreasibilities can be estimated from correlationa presented by Hall16 and by Von Gontcn and Choudhary17• Hall's correlation (his Fig. 2) givesinstantaneous pore volume compressibility u a function of porosity, i.e. there is no pressure dependence. The Hall correlation is probably adequate for normal pressured reservoirs. Von Gontcn develops correlations for instantaneous pore volume compressibility Cr u a function of net overburden preasurc (pJ, where Po equals the overburden gradient times depth minus reservoir pressure.
Table 2 gives example values of initial pore volume compressibility cr(p-,) for overprcssured and normal pressured reservoir conditiona. Typically there are not large differences in c, values for these two conditiona .
Cumulative Total Water Compressibility fi..,. The pressure support provided by water is made up of two components . First the water expanaion with decreasing pressure, and second the rclcue of solution gu and its expansion. The total or composite compressibility effect is expressed u
c..,(p) = _1 _B..,(p) -8,.(p) . . . . . . . . . . . . . . . . . . . (7)
B...,(p) P;-P
in terms of the tot.al water formation volume factor B,.,,
B (p) • B (p) + [R,..-R .. (p)JB
,(p) . .... .. .... . .. . (8) .., "' 5.615
Fig. 5 shows typical behavior for B., and B,., u a function of pressure; the figure also shows the behavior of yp) where it is seen that little increase occurs before a pressure of about 1500 psia, and that at pressures below 1000 psia there is a significant increase in c.., with a limiting relationship c.., oc 1/p at low pressures,
_ (p--0) [ 1 Tp.. R..,. ] 1 . . . . . . . . . . . . . . . . (9)c...,
= s.61s TIC P.a. P •
Specifically at standard conditions (p.J, c.,. is given by
- [ 1 T R..,. 1]c,_(p.,) • ----- - -.S.615 T .. P; B_ P;
(10)
To calculate c..,, values of B.,. R_, and B1 are tabulated with pressure u shown in Table 3. These properties can be obtained from correlations at pressures less than about 10,000 psia and 300"F. At more extreme conditions of pressure and temperature, and for gases with high concentrations of oonhldrocarbons CO2, N2, and HiS, we have used the Pcnc-Robinson1 equation of st.ate with volumetranslation, and using binary interaction coefficients that arc dependent on both temperature and salinity19•
Another approach for high prcssurea is simply to extrapolate B., linearly and R_ with a flattening curvature towards a constant value. Nonhydrocarbons can be treated by evaluating R_ of each component separately at its partial pressure, and summing the values for all soluble components
[R..,(p))TOl"AI. = L CR ... <Y;P>J; • . . . • • . . . . . . . . . . . . . (11)J
y is the reservoir gu mole fraction of componentj. Typically the only ci>mponents with appreciable solubility arc methane, CO2, and HiS.
Associated Water Volume Ratio M. The total compressibility effect on the gas material balance depends on the magnitudes of rock and total water compressibilitica and on the total pore and water volumes in pressure communication with the gas reservoir (including connatc water and the pore volume within the net pay).
Associated water and pore volumes external to the net pay include non-net pay (NNP) such u interbcdded shales and dirty sands, plus external water volume found in limited aquifers. Including these water volumes in reservoir simulation is referred to as using a •gross• model. In the proposed material balance equations this usociated volume _is expressed u a ratio relative to the pore volume of the net-pay reservoir,
M • MMNP + MAQ . . . . . . . . . . . . . . . . . . . . . . . . . (12)
where
VpH)IP (INTERBEDDED NONNET PAY) MNNP ,. _.::;:;,;;;.. __ .,,.,......,..,==-=--:-:-,,,-----
. . . . . (13) v
,.(NET PAY)

4 APPLICATION OF A GENERAL MATERIAL BALANCE FOR HIGH PRESSURE GAS RESERVOIRS SPE 2 29 21
V,.,.q (AQUIFER) M
AQ,.
v,.(NET PAY
)..................... (l4)
In the simplest case when M =0 there will be pressure support only from connate water and the net-pay pore volume. This is equivalent in simulation to building a net model. The cumulative effective compressibility term c, will then be expected to have values rangingfrom 7 to 1S(10-, psi•1 for normal-pressurcrcscrvoin, where the largervalues will generally result from high connate water saturation. Even larger valuca can be obtained in some overprcsaurcd rcscrvoin (ace Table 2).
Net-pay compressibility effects alone can cause noticeable curvature in the p/z-G. plot with potential overestimation of initial free gu in place (G) (sec Fig. 1).
�- The non-net pay water volume ratio M!IMP is comprised of interbcdded reservoir pore volume, including shalca and poor quality rock, that arc usumed to be completely filled with water. With this definition MHNP can be written in terms of the net-to-gross ratio NGR defined u
ha ha NGR • -- • -- . . . . . . . . . . . . . . . . . . . . (1S) ha +hxM, hOROIIS
Accounting for different porosities in the net pay and non-net pay M!IMP
is given by
MN"HP = (ili'X)HNP • 41HNP [
1-NGR)
(ili'X)a •a 7iicnr-..••...•...• (16)
Propcrtica and thicknessca of the net pay and non-net pay are readily available from log analysis.
If the non-net pay pore volume is known to have an initial gu saturation, a.lbcit immobile, the material balance ia readily modified to account for this fact; the term M-Ccr+ c..,) is replaced by M,oo,{c,+S.._inn,C,..] and the initial gu volume ia included in the total original free gu in place G.
M-'Q
. Aquifcn with sufficient permeability and limited areal extent can be treated u part of the total cumulative compressibility tenn. The water volume ratio of the aquifer M
AQ can be determined using
geological maps and well control to define areal extent, and elcctri.c logs to define the gu-water contact. In general, M
AQ ia defined u
,, . . . . • . • • • • . • . . • • • • • . • • • • . . (1 7)
and for a radial aquifer geometry quantified in terms of the aquifer--toreservoir radius r�r1, the aquifer volume ratio can be exprcascd
MAQ
= c.Ji)M2[<rM/r1)2 - 1] ................... (18){iilijl
Bruns ct al.1 show that limited aquifen with r,.dr1 ratio• up to S have the same p/z-G, behavior for permeabilities ioo md and higher. TIUI implies that the transient effects in the aquifer have negligible effect on reservoir performance and the aquifer can be treated u part of the cum��tive effective comp�sibility term. Valuca of M� used in the defimuon of c, may be u high u 2S (M
AQ=(r�r.)2-1) 111 n::servoin
with moderate permeability. With higher permcabilitica limited aquifers can include r ,.dr1 ratios greater than S and still be treated as part of the cumulative eticctive compressibility term.
When the aquifer ia sufficiently large and requires treatment with either superposition or the Schilthius infinite aquifer model, the c term should still be used but it will only contain the effect of net p;y and non-net pay volumes, i.e. M=MNNP-
Cumulative Effective Compressibility c •. Total cumulative effectivecompressibility represents all available pressure support from rock and water. The equation for c, is
_ (p s .• ,.c..,(p)+c,(p)+M[c,.(p)+c,(p)]c. ) •
l-S .. ............ (19)
..
For a specific reservoir a family of c,(p) curves can be generated for several M values. These curves will have specific characteristics depending on the pressure dependence of rock and water compresaibilities. The c..,(p) curves are relatively constant at high pressure, incrcuing slightly u pressure d,crcasca, then rising sharply at low pressure around 1000 psia. Typically a constant pore volume compressibility Cr can be usumcd and the c,(p) curves will then have the same character u the c..,(p) curve. Fig. 6 illustrates an example of c,(p) curves at various M ratios for a typical Gulf Cout reservoir with J>;=9000 psia, T= 200"F, -y1=0. 7 (air= 1), and a constant c,=3.2(10°6) pai°l.
For overprcssurcd reservoirs exhibiting a prcssurc-dcpcndentci(p), the family of c,(p) curves al high prus11res will tend to dccrca.sc with depletion. In the absence of pore collapse Cr(p) dccrcuca to a constant value at lower pressure and the c,(p) curves at lower pressure arc dominated by the incrcuing c,.(p) function. If pore collapse occurs, but not early in depiction, the pore collapse is almost insignificant because (a) the c,(p) function docs not start increasing until low pressuresbecause it represents a cumulative pore volume change, and (b) whenthe c,(p) function finally starts to increase it will be masked by thec..,(p) function which ia increasing u 1/p. Fig. 7 illustrates this pointfor a Gulf Coast overpressurcd rcscrvoir with P; =9000 psia, T=300"F,and -y
1=0.71 (air=l). Although pore collapscoccun at 4000psia (Fig.
3), c, doca not start increasing until 2000 psia. The increase isinsignificant relative to the increase in c,..(p) at lower pressures.
The next example ia a North Sea chalk (Fig. 4) that shows pore collapse at a pressure only 1000 psi below initial pressure of 7000 psia. The Cr(p) function incrcasca almost simultaneously with instantaneous c,, and the effect of Cr(p) on c.(p) is shown in Fig. 8. Although Cr(p) hu an impact on c,(p) at modcntc and high pressures for this example, the c...(p) function still dominalcs the behavior of '5,(p) at pressures less than 1500 psia.
Estimating Gu-la-Place. A method is proposed for estimating the initial (free) gu in place G based on historical pn:asu�umulative data. The procedure also determines the water volume ratio M and the c.(p) function. rint, a plot of p/z venus cumulative gu production G, should have the characteristic concave downward shape of a highpressure rcscrvoir influenced by usociated water and pore volume comprcaaibility.
A range of valuca for G should then be usumcd, with the largest value based on an extrapolation of the early depiction data and the lowest value being somewhat larger than the current G,. For an uaumcd value of G, calculate for each mcuurcd p/z and G, iiata the a.value from the rearranged material balance equation (Eq. 1),
(c.)Maciw:tn.AT6D • (1 - ::• (1 - �>] (p,:P) ...... ( 20)
At this point, a plot can be made of backcalculated c, u a function of prcsaurc given the usumcd G. Using reservoir rock and water properties, a family of c,(p) curves at various M values can be generated to match against the backcalculated c, values. The data should

SPE 22 921 M.J. FETKOVIC H, D.E. REESE, AND C.H. WHITSON 5
honor the shape and magnitude of one a.(p) curve, where this match yields G, the M value, and a a.(p) function that can be used to forecast future p/z-G, behavior. Thi.a procedure gives a sound physical significance to the estimation of G u opposed to a pure statistical �fit that may lead to unrealistic solutions. The FJCld Eu.mples scctlon discussca criteria for matching field data, and the expected behavior of a.(p).
Characteristics of p/z-G, Plots for High-Pr�ure Reservoirs Pore volume reduction, water expansion, and solution gu evolution, expressed in terms of a.(p) in the general material balance equation, provide pres1urc support for all rcscrvoin during depiction. 'The reservoir docs not have to be overprcssured or gcopressured. 'The term a.(p)(p.-p) dctcnnines whether the convenl:1<>nal_ plz-G,. plot yields _a straight line. For most low-pressure reservoin this term II small and 11 often neglected because a lltrlight-line p/z-G, plot is obtained. Rcscrvoin undergoing depiction with initial pressure exceeding 5000 psia arc automatically candidates for being treated with the complete material balance equation.
Fig. 9 presents three generated p/z-G, curves for a Gulf Cout overpreuured sandstone r e servoir using M = 0 ( i.e. a.(p)= [½)+S .. l,..(J))]/(1-S,,.). Curve A accounts for pore volume l'Cduction including pore collapse at about 4000 psia. Curve B uses the same ½) function u Curve A down to 4000 psia (where pore collapse occurs) and thereafter uses a comtant instantaneous compressibility of 4(10"6) pai•1• p/z-G, plots for A and B arc almost identical, showing only a alight separation at pressures less than 3500 psia. Thi.a clearly shows the limited effect of pore collapse on the p/z� plot when collapse occurs late in depiction. Curve C usumcs, 1U1Teali.sticaily, that the initial pore volume compressibility of 1 3(10"5) psi•1 rcmainl constant throughout depiction. 'The difference between the two p/z-G, curves A and C is a result of the actual dccrcue in pore volume compressibility. Including an external water volume quantified with M = 2 produces more curvature in the p/z-G, plots, but the separation bctwccn curves with and without pore collapse is still very small (not shown).
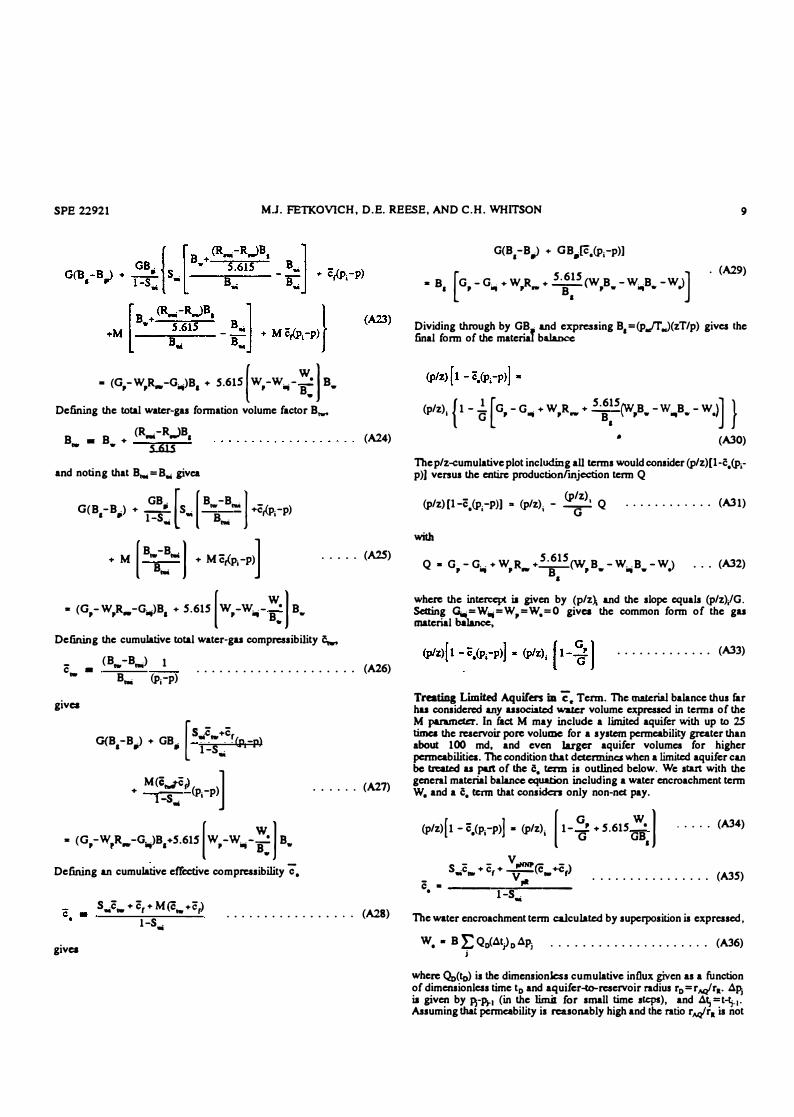
Another example rclatca to a North Sea chalk reservoir where pore collapse occurs just below initial pressure. Fig. 10 presents generated p/z-G, plots for M=0 with pore collapse (curve A) and with no pore collapse (curve B). The effect of po re collapse is more significant than in the previous example because it occurs at a relatively high pressure.
Field Examples Elleaburser Gas Resenoir. This field example is for a normal prcs,ured (O.S psi/ft) 1600-foot thick, dry gu reservoir with initial reservoir pressure of 6675 psia at 200"F. Average porosity is about 5.0� with connatc Wit« saturation in the pay of about 35�. Permeability is high because of an extensive micro fracture system that results in a high degree of intcrwell pressure communication and almost instantaneous pressure buildup to static conditions. Initial CO2
concentration wu about 2 8 mol-"• and a gradual incrcuc in CO2
concentration to 31 mol-" hu been observed. The reservoir hu produced about 3.1 Tscf and currently hu an average fieldwidc bottomhole pressure of approximately 1000 psia. The p/z-G, plot shows a characteristic concave downward behavior, with an initial gu in place estimate of more than 4.4 Tacf using early data (Fig. 11). The p/z-G, data at low pressures has started flattening.
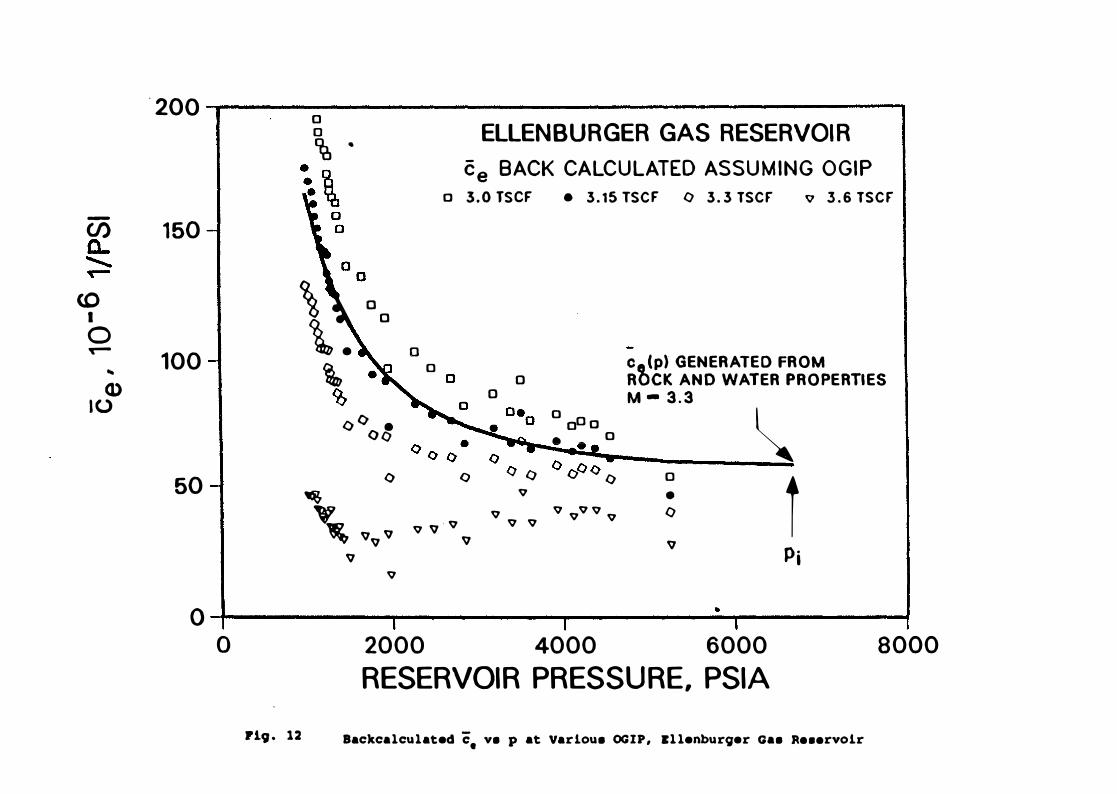
'The procedure outlined carlicr for determining initial free gu in place G wu used for this reservoir. Fig. 12 shows a plot of backcalculatcd c. versus pressure for a range of G from 3.0 Tscf to 3.6 Tscf. Another plot of a.(p) wu generated for several values of M using S,..
=0.35, ey=6.5(10_., psi•1 (from Hall16), and a...(p) calculated from equation of state results. Fig. 1 3 shows the best-fit of data on the a.(p) curve for M = 3.3, corresponding to an initial free gu in place G= 3.15 Tacf.
The total water volume including connatc and usociated waters is given by
1 GB• (S .+M) W = ______ .. _ . . . . . . . . . . . • . . . • • . . . . (21) 5.615 B,... (1-S.J
which yields 8.45(109) STB. Tbc initial solution gu in place G. is equal to W times the initial solution gas-water ratio R,,.,
G, • WR,... ............................. (22)
Because of the high CO2 concentration in this reservoir the solution guwatcr ratio (R...= 6 7.5 scf/STB) is about three times larger than for hydrocarbon gu systems. This yields a solution gu in place of G =0.55 Tscf and a total initial gu in place of G+G,= 3.70 Tscf. � 1i shows the p/z-G forccut using the b\ value determined from the match to calculate the a.(p) function from S..., M, a,, and �). Also shown on this figure is the plot of (p/z)[l-c.(p)<P;-p)] versus G, for historical performance data and for the forecast, where it is ICCll that the current cumulative gu produced equals the original free gu in place.
The uaociatcd water volume given by M = 3.3 consists of non-net pay and an external limited aquifer. Log analysis indicates a nct-togro11 ratio NGR=0.5, <Pa= 0.05, and t!>m,p=0.03, yielding MlfNP
=0.6. External water is known to exist but hu not been mapped due to lack of well control. The calculated aquifer water volume ratio M
AB=.2.7
( 3.3--0.6), or an equivalent rAQ"ra= l.9, SCCIDI reasonable for a limited aquifer.
Anderson "L". Thi.a reservoir bu been studied by several authors and it is perhaps the best recognized example of a high-pressure gu reservoir with concave downward p/z-G behavior (Fig. 14). 'The reservoir wu abandoned after producing 5; Bscf, but pressure tests of public record were discontinued after 40 Bscf had been produced.
Different analyses by other authors have indicated original free gu in place bctwccn 65 to 75 Bscf. Fig. 15 shows baci:calculatcd a. versus pressure for values of G equal to 65, 72, and� Bscf. The 72 B�f volume is chosen bued on a best-tit match with the a.(p) function calculated using M = 2.2S, S,.=0.35, a,= 3.2(10"5) psi•1, and a a...(p} function from equation of state results. Although the first four data do not fall on the slightly-increasing a.(p) curve, data at pressures below this value do follow the trend down to the last pressure data near 3000 psia.
'The 90 Bscf estimate produces unrealistically low a. values, lower than would be calculated using the net reservoir pore volume _and connate water comprcs1ibilitica. 'The lowest estimate of 65 Bscf gives a shape for a.(p) that cannot be accounted for using normal a,<p) and c,.(p) functions.
The forccasted p/z-G, perl'onn'!lce (Fig. 14) is calcu� "!sing the match determined above. Total gu m place of 7 6 Bscf which mcludcs 72 Bscf of original free gu plus 4 Bscf of solution gu.
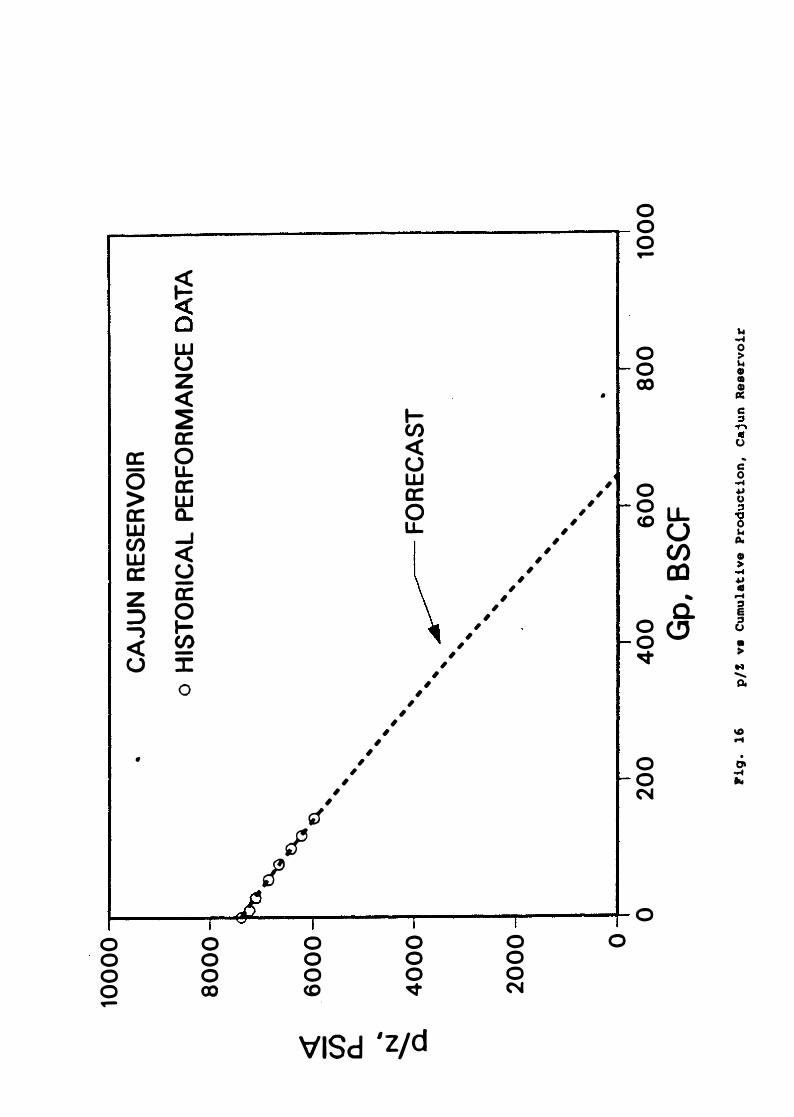
Cajun F"ield. Thi.a reservoir was originallt reported by Stelly and Faraha<f» and recently analyzed by Ambastha . Initial pressure is 11450 psia at 1 3,300 ft (0.8 6 psi/ft). CoMate water saturation is reJ?Orted u 22�. Production data is reported to a pressure of 6850 ps11 and a cumulative of 145 Bacf.
Using the p/z-G, data shown in Fig. 1 6, backcalculated values of 3- arc shown in Fig. 1 7. The range of values for G arc the same u considered by Ambutha: 410 to 760 Bscf. The 760 Bscf estimate yields unacceptably low a. values, leu than 2(10"5) psi•1• Values lower than 5 65 Bscf produce a.(p) functions that incrcsac more steeply than would be expected from a...(p) behavior. The expected magnitude and shape of cumulative effective compressibility ii exhibited by thebackcalculated a. values for an usumed G of 650 Bsc(. Thi.a

6 APPLICATION OF A GENERAL MATERIAL BALANCE FOR HIGH PRESSURE GAS RESERVOIRS SPE 22921
corresponds to M=0.2 using S,..= 0.22, c,=4(10� psi•1, and c,.(p)
from com:latiom.
Gulf' Coast Resenoir C. Thia example is taken from Bernard' (his Fig. 1) and represents a high-preaaure, overpreaaured gu reservoir taken toa low abandonment preaaure. The p/z-G, plot (Fig. 18) shows significant concave downward character with an extrapolation of early data giving an initial free gu in place of 380 Bscf. Depletion from P; = 11S00 paia to about 1200 paia produced 180 B1cf, verifying that the early-data extrapolation of 380 Bscf was incorrect.
Fig. 19 •howl backc:alculated c.(p) for values of G from 160 to 240 Baef. The only curve that produces an approximately constant c
0 at
high preasurcs ii G= l60 Bae(, a value 30 Baeflcaa than the volume already produced. The curve for G=240 Baefhas a downward sloping c.(p) that becomes negative, also an unrealistic solution. The 0 =200 Baef curve has a downward sloping c.(p) function that can be explained by a pressu� pore volume compressibility. A highly overpressured formation can readily have a prcs1urc-dc:pendent c,(p) function, i.e. one that dccn:uea with depletion.
Rcacrvoir data wu not preaented by Bernard' for this field example, but making some usumptions about typical Gulf Cout reacrvoir propertiea we matched the c.(p) bacltcalculated behavior using G = 18S Bscf, and a c,(p) function that decreased linearly by a factor of about 2 from initial conditions to abandonment pressure. The backcalculated c.(p) behavior at 2000 psia started incrcuing, indicating that pore collapae could have occurred earlier in depletion.
Duck Lake F"ield. Cason21 presents production performance data from the Discorbia 1 reservoir in the Duck Lake field of southern Louisiana. This high-pressure gu reservoir wu waterflooded for more than 10 years aft.er first being depleted to about 1000 paia. Fig. 20 shows the p/z-cumulative plot for data prior to the waterflooding project, showing typical concave downward curvature.
Cason reports an initial gu in place of 680 Bscf using traditional water influx analysis. Sued on the high reservoir permeability (It= 1,750 md) we eatabliahed that the reservoir performance could be analyzed with the general material balance where the external aquifer wu treated u put of the c
0 term. Using 0 =680 Bscf, c.(p) wu
backcalculated from the general material balance u shown in Fig. 21. The c.(p) behavior ii flat throughout depletion. This behavior should be compared with the duhed line repreaenting the expected c.(p) behavior baaed on Eq. 3 using a constant c,=3.4(1� psi•1, M=4.8, and an appropriate yp) function. The duhed curve has significant increase in c
0(p) already at 2000 psia, and the more-or-tea, constant c.(p)
behavior backcak:ulated from production data can not be readily explained. h ia expected, however, that conventional water influx analysis which assumes constant water and pore volume compressibility will yield an estimate of initial gu in place that retlectl a constant c. when backcalcuJated from the general gu material balance.
Using a smaller estimate of G= 62S Baef yields bacltcalculated c
0(p) behavior that is very similar to c.(p) c:alculated from Eq. 3 using
a constant c,=3.4(1� psi"1, M=6.S, and yp) function. Cumulative production at abandonment wu about 650 Bscf, indicating that about 25 Bscf of the total produced gu came from solution. Sued on G =625 Baef, R,,..=20.6 acf/STB, S,.=0.18, and M=6.5 the initial so"'1io11 gu in place ia 0,=6S Baef.
Condusiom 1. A general form of the material balance equation for gu reservoirshas been presented. This equation has particular application to highpressure reacrvoirs. A cumulative effective compreasibility term c.(p) has been defined in terma of preasurc-dependent pore volume and total water cumulative compressibilities, Ci(p) and c,,.(p), and the total volume of water usociated with the net pay reservoir expressed u a ratio M.
2. The general material bala.ncc equation applies to aU high-pressurereservoirs, both normal pressured and abnonnally pressured (overpreasured and geopressured).
3. The effect of a limited aquifer can be included as part of the M termfor most depletion-type reservoirs. Using the water volume ratio M in the cumulative effective compressibility term, together with nonnal values of c, and f,,.,. explains the "large" c. values commonly reportedfor high-pressure gu reaervoirs when linearizing. the material balanceequation. In fact, large values of c, baclccalculated from field performance datl indicate that associated water influx ia a dominant drive mechanism.
4. Only cunudati1111 compreuibilities (lit and c,.,) can be used in the general gu material balance equation because they arc applied against the cumulative pressure drop (p.-p) in p/z-G, plots. A method ia given for calculating cumulative total water and pore volume compressibility c,.(p) and c,(p ). •
S. A method ia proposed for estimating the original free gu in placefrom production data. This method uaea bacltcalculated cumulative effective compressibility c. which ia plotted versus pressure and compared with expected c,(p) behavior calculated from rock and water properties for a range of values of the usociated water volume ratio M.
6. In lieu of laboratory data for pore volume compaction werecommend Hall's" com:lation for normal-pressured reservoirs, and Von Gonten's17 com:lation for abnormally-pressured reservoirs.
7. Pore collapse in and of itself does not contribute aigniticantly topreasure support in overpreasured gu reservoirs. In fact, pore collapse has little effect unless it occun early in depletion at a relatively high pressure. The effect of pore collapse, if present, is a positive effect and tends to flatten the p/z-O, curve, not bending the CIITYe downward u has been implied by others.
8. Gu found initially in solution in the conn.ate and associated water isan important component of pressure support late in depletion (below 1S00 psia) and may contribute additional producible volumea of gu. Typically the solution gu in place G, represents 2 to 10 percent of the original free gu in place, the value depending primarily on total water volume (M + S..)/(1-S,.J and the initial solution gu-water ratio R...- Gu reservoirs with high CO2 concentration (>20 mot-%) can have even higher solution gu in place, G,,.
Nomenclature A = area, t\2 [m2] B = formation volume factor, reservoir per standard volume c = instantaneous compressibility, I/psi (1/kPa] c = cumulative compressibility, 1/psi (1/kPa) 0 = original free gu-in-place, Bscf [std m']
� = cumulative gu production, Bscf [std nr]
...._ = initial solution gu in place, Baef [std nr] G,, = early overestimate of 0, Bscf [std m'J � = cumulative gu injection, Bscf [std '] b = thickness, t\ [ml M = volume ratio, dimensionleu NGR = net-to-gro11 ratio, dimensionleu p == reservoir pressure, paia [k:Pa] P; = initial reservoir preasure, paia [k:Pa] P. = net overburden pressure, paia [k:Pa]ra = radius of reservoir, t\ [m] rAQ
= radius of aquifer, t\ [m) R_ = solution gu water ratio, SCF/STB [std m3/m'] S,..
= initial water saturation, fncticn T = reaervoir temperature, •R [JC}

SPE 22921
V
M.J. FETKOVICH, D.E. REESE, AND C.H. WHITSON 7
� �w
w. w w
"'
,
Subscripts A AQ e
f g GROSS i inj NNP R SC
tw w
= volume, A' [m'J = pore volume, cm' and ft5 [m'J = bulk volume, cm' [m'J = total water in place, bbl [m'J = cumulative -ter influx, bbl [m'J = cumulative -ter injection, bbl [m'J = cumulative water production, bbl [m'J = gas compressibility factor, dimensionless = porosity, fraction
= associated water = limited aquifer == effective = pore volume ("formation") = 1as = ,roas interval thickness = initial ... injection = non-net pay
reservoir = standard conditions = total-ter = water
Acknowledgements We thank the management of Phillipa Petroleum Company
for penninion to publish this paper. We also acknowledge Fred Kent for work done on the Ellenburger example.
Rererences 1. Bruna, J.R., Fctltovich, M.J., and Meitzen, V.C.: "The
Effec:t of Water Influx on p/z-Cumulative Gu ProductionCurves," JPT (March 1965) 287-91.
2. Ramaaost, 8. P. and Farshad, F. F.: "p/z AbnormalPressured Gas Reservoirs,• paper 10125 preacnted at the56th Annual Meeting of SPE of AIME, San Antonio, TX,(Oct. S-7, 1981).
3. Harville, D. W. and Hawkins, M. F. Jr.: "RockCompressibility and Failure as Reservoir Mechanisms inGeopreasured Gas Reservoirs,• JPT (Dec. 1969)1528-30.
4. Hammerlindl, D. J.: "Predicting Gu Reserves inAbnormally Pressured Reservoirs,• paper SPE 3479presented at the 46th Annual Mectin& of SPE of AIME,New Orleans, LA, (Oct. 3-6, 1971).
5. Duggan, J. 0.: "The Anderson "L" - An AbnonnallyPressured Gp Reservoir in South Texas,• JPT (Feb.1971)132-131.
6. Wallace, W.E.: "Water Production from AbnonnallyPressured Gas Reservoirs in Louisiana,• JPT (Aua., 1968)969-982.
7. Bua, D.M.: • Analysis of Abnormally Pressured GasReservoirs with Partial Water Influx,• paper SPE 3850presented at the 1972 Abnormal Subsurface PressureSymposium, May 15-16.
8. Roach, R. H.: "Analyzing Geopressured Reservoirs - AMaterial Balance Technique," paper SPE 9968 (1981).
9. Bernard, W. J.: "Gulf Coast Geopressured Gu Reservoirs:Drive Mechanism and Performance Prediction,• paper SPE14362 presented at the 60th Annual Meeting of SPE ofAIME, Lu Vegas, NV, (Sept. 22-25, 1985).
10. Begland, T. F. and Whitehead, W. R.: "DepletionPerformance of Volumetric High Pressured GasReservoirs," SPE Reservoir Engineering (Aug. 1989) 279-282. SPE 15523 first presented at the SPE Annual Meeting(Oct. 5-8, 1986) New Orleans, LA.
11. Pruad, R. K. and Rogers, L. A.: "Superpressured GasReservoirs: Case Studies and a Generalized Tanlc Model,•paper SPE 16861 presented at the 62nd Annual Meeting ofSPE of AIME, Dallu, TX, (Sept. 27-30, 1987).
12. Wang, 8. and Teudale, T.S.: "GASWAT-PC: AMicrocomputer Program for Gas Material Balance W"tthWater Influx," paper SPE 16484 presented at the 1987Petroleum Industry Applications of Microcomputers held in Del Lago on Lake Conroe, MontgomeryTexas,June23-26,1987.
13. Poston, S. W. and Chen, H. Y.: "Case History Studies:Abnormal Pressured Gu Reservoirs," paper SPE 18857.
14. Bourgoyne, A.T. Jr.: "Shale Water as a Pressure SupportMechanism in Gu �oirs Having Abnormal FormationPressure,• J.Ptt.Scinu:e, 3(1990)305-319.
15. Ambastha, A. K.: • Analysis of Material Balance Equationsfor Gas Reservoirs.• Paper No. CIM/SPE 90-36, June 10-13, 1990. •
16. Hall, H.N.: "Compressibility of Reservoir Rocks," TransAIME (1953)198,.309-311.
17. Von Gonten, W. 0. and Choudhary, 8. K.: "The Effect ofPreuure and Tem perature on Pore-VolumeCompressibility,• paper SPE 2526 presented at the AnnualMeeting of SPE of AIME, Denver, CO (Sept. 28-0ct. 1,1969).
18. Paig, D.-Y. and Robinson, D.B.: "A New Two-ConstantEquation of State,• bid.Eng. Chem.Flllld., No. 1 (1976) 59-64.
19. Soreide, I. and Whitson, C.H.: "Mutual Solubilitiea ofPetroleum Reservoir Fluids Including Brine From a CubicEquation of State,• paper submitted for publication in FlllidPhase Eq11ilibria (April 10, 1990).
20. Stelly, O.V. and Fanhad, F.F.: "Predicting Gas In Place InAbnormal Reservoirs,• Pet.Eng.(June 1981) 104-110.
21. Cason, L. D. Jr.: "Waterflooding Increases GasRecovery," J.Ptt.Tech. (Oct. 1989)1102-1106.
Appendix A _ Derivation or General Gas Material Balance 1be derivation that follows is based on the, following assumptions:
1. Any pressure change caused by production or injectioninto the reservoir will be fell immediately throughout the total system including:
a. Net Pay Reservoir ("R").b. Non-Net Pay ("NNP") including interbedded shales and poor
quality rock assumed to be 100� water saturated. e. Limiled Aqllifer (" AQ"), when present, also assumed to be water
saturated. 1be non-net pay and aquifer volumes are referred to u •usociated" water volumes and both contri>ute to -ter influx during depiction.
2. Simple modifications to the material balance equationscan be made to generalize for non-net pay that has an initial free gas saturation.
3. All water in the system is initially saturated with solutiongas. Fig. 22 shows a schematic of the rcservoir/usociated water system.
Practically, the usumption of equal pressure throughout the system is reuonable, and any transients effects caused by a large aquifer may be treated by a oonventional -ier influx tenn (W J as shown below.
For the sake of brevity we have choac:n to omit explicit reference to pressure dependcncc - i.e. c., Cr, and a.., should actually read c.(p), c,(p), and c,...(p).

8 APPLICATIO N OF A GENERAL MATERIAL BALANCE FOR HIGH PRESSURE G AS RESERVOIRS SPE 22921
Derintioa. The volumetric balance at any pressure states that the total pore volume (V ,a+ V .J equals the net reservoir pore volume occupiedby gas and water ('v .,_ + V.,,,) plus the usociated (non-net pay and aquifer) pore volume which also is occupied by gu and water (V,,,.+V..,.):
(V,,_+V,J • (V
.,_+V.,.) + (V,,,.+V..,.) ..•••....•... (Al)
The net-pay reservoir pore volume V �- ia given by the initial volume V ,a; less the change in pore volume AV ,a,
v,.
- v,..
-..1v,.
.......................... (A2)
GB. ..•••.••..•••••....... (A3) V
,a; • GB. + --• S.
• 1-s .. "'
c, • (c,)a . . . . . . . . . . . . . (A4)
yielding
GB. GB. V ,,_ • GB . + --• S . - --• c, (p.-p)
• 1-s ..
• 1-s..
· ...••..... (AS)
Pore volume of the usociated rock is given by the initial pore volume leas the change in pore volume,
V""
• V,,_
-AV""
......................... (A 6)
GB. V
,.. •
1-s•.
M ........................... (A7) ..
GB AV
'"'= i-t M c,<P;-P> ; c,. <c,>A ............ (AS>
..
yielding
GB GB. V
"" • --• M - --• M ctp.-p) · · · · · · · · · · · · · · (A9)
1-s.. 1-s.. •
The net reservoir gu volume is given by the sum of unproduced free gu, gas released from solution, and any injected &u,
V ,,_ • (V ,,_)u.- + (V .. )- + (V .. )....,_. (AlO) -a. --- --
(V .-)�� • [G-(G,-W,R •• )]B1
GB. S . 1 <V.->=-i_ • 1-t B�
{R ... -R..) B,'3':6n .. ..
resulting in
V,,_
• [G-(G,-W,R..)JB1
(All)
{A12)
(Al3)
GB . S . · B · · · · · · · · · . . (Al4) + 1-s: B:
(R ... -R.J 5.6�5
+ G., B,
PVT properties B and R.. a.re evaluated at current reservoir pressure. G, for a gu con�te is the wet gu volume calculated by adding separator gu to liquid condensate converted to an equivalent surface gu volume. Alao, the two-phase Z-factor must be used to calculated B
1 for gu condensate reservoirs. Strictly spealcing the cumulative water production term w, represents •free• water production and not the water condensed out of solution from the produced gu wellatream.
The gu volume in the usociated pore volume is a function of the amount of ,u that bas co me out of solution,
• GB• 1 _ B _1_ v
,,,. -_-M-(R ... R..) 1 5 6151 s
.. B,.
........... (AlS)
The water volume in the net-pay reservoir equals the unproduced initial water plus injected water plus water encroachment from an externalaquifer,
V.,. • (V.,.)u.- + (V.,.>i.,..... + [('/.,.)-] .... (A1 6)
(V .,.)u_._. • GB• S,. B - W B _1_ ..-- 1-S,. B,. • ' • 5.615
(V .,.)_ • 5.61S W.
yielding
(Al7)
(Al8)
(Al9)
GB . S. V
.,. •--•-=.a. + S.61S(W..;
B.+W.-W,B.) ...•. (A20) 1-S,. B,.
The aquifer encroachment term w. represents any external water volume that ia not ahudy included in the "M• term. Later in the derivation we show the conditions required so that water encroachment(treated rigorously by the method of superposition) caa be included u part of the M term used in the cumulative effective compressibility c •.
The water volume in the usociated pore volume is given by simple expansion,
V.,._ •GB•
M -1- B. . .•••................. (A21) 1-S,. B,.
Combining terms gives
GB. GB. GB. GB _ GB. + --• S. - --•-c,<p -p) + --• M - --• M c,<P;-P)
• 1-s.. .. 1-s.. • 1-s.. 1-s ..
GB• S,. (R ... -R.JB1 • GB, - (G, -W,R..)B, + a .. B, + 5.61S 1-S., B.
+GB•
M 1 (R_-R..)B1 +
GB• s.B
1-s..
B,.
S.61S 1-s. B. •
GB 1 + 5.61S(W. B +W -W B.) + --• M -B
.. • • • 1-s. a. •
Changing signs and grouping terms yields
(A22)
SPE 22921 M.J. FETKOVIC H, D.E. REESE, AND C.H. WHITSON 9
• (G,-W,R.-0..,)B, + S.61s[w,-w .. -:�]e ..
Defining the total water-gas formation volume factor B,,..
(R..,.-R..)B1 B,. • B .. + S.61S
and noting that B,,. = B,.. givea
GB . [ [
B.,. -B,.. I -G(B -B .) + --• S . --- +c,(p.-p) • • 1-s
.. .. e
,..
•
(A24)
[ B -B ·
] ] + M ·e...
... + Mc,(p;-P) ..••• (A2S)
• (G,-W,R..,-G..,)B, + S.61S [w,-w .. -:·] e.•
Defining the cumulative total water-gu compressibility c;....
c,.
• (B,. -B,..) 1 . . . . . . . . . . . . . . . . . . . . . (A26) B.,. (p;-p)
gives
[s i +c G(B -B.,) + GB. • ,. '(p.-p)I • 1-S,.. I
M (c -\
] +
1�"(p;-p)
• (G, -W,R_ -0.,;)B, +S.615 [ W, -w.-� I ••Defining an cumulative effective compreasibility c.
.•.... (A27)
s,..c
,. • c,. M rc .. +er>
1-s .. .....•.....•..... (A28)
gives
G(B1-B.,) + GB•[c•(pi-p)]
. (A29) • 81
G, - G., + W,R.., + _
8_(W,B., -W.,B., -WJ [
S.61S
] I
Dividing through by G�, and expressing B1=(p./f .)(zT/p) givea the
final form of the material balance
(p/z). 1 - - G - G . + W R + --� B -W B -W J{ 1
[ S.61S
] } I G
, .. , - B, , ., .. .,
It (A30)
The p/z-cumulative plot including all terms would consider (p/z)[l •c.<J>ip)} versus the entire production/injection term Q
(p/z) (p/z) [l-c.(p;-PH • (p/z); - 7r Q ............ (A31)
with
S.61S Q • G, - G., + W, R.., +-8-(W, B., -W.,B.-W.) ... (A32) •
where the intercept is given by (p/z� and the slope equals (p/z)/G. Setting G..=W.-=W =W.= 0 gives the common form of the gu material �
,
............. (A33)
Treating Limited Aquifers ill c. Term. The material balance thus far hu considered any usociated water volume expressed in terms of the M parameter. In fact M may include a limited aquifer with up to 2S times the reaervoir pore volume for a sy stem permeability greater than about 100 md, and even larger aquifer volumes for higher permeabilities. The condition that dc:tcrminea when a limited aquifer can be treated u part of the c. tcnn is outlined below. We start with the general material balance equation including a water encroachment term w. and a c. term that considen only non-net pay.
(p/z)[ 1 - c.(p;-P)] • (p/z) ; [ 1- ':; + S.61S ;;, ]
· · · · · (A34)
S - - vpllNPr:: ->,..c.,. + c, +
y-\c. +cf
c. • ----1,.._-=s,... __ ,. __ _ ................ (A3S )
The water encroachment term calculated by superposition is expressed,
w. • BE Q0(At)0 Apj . . . . . . . . . . . . . . . . . . . . . (A36) j
where Qo(to) is the dimensionless cumulative influx given as a function of dimensionleas time t0 and aquifer-to-reservoir radius r0 =r;,qlr,.. AP; is given by �-Pi-• (in the lim.it for small time steps), and A�= t-t;.1• Assuming that permeability is reasonably high and the ratio r ;,qlr,. is not

10 APPLICATION OF A GENERAL MATERIAL BALANC E FOR HIGH PRESSURE GAS RESERVOIRS
too large, Q0 for the smallest time step will approach the limiting value Q0, and the summation can be closely approximated by
giving a simple expression for w. which is independent of time and only dependent on reservoir pressure,
w • ., B Qi;'(p;-p) ; W0(bbl} . . . . . . . . . . . . . . . . . . (A38)
..................... (A39)
Expressing w. in terms of aquifer pore volume V P"Q•
w. • r(r�-ri�h(c._+c1}(p;-P) ; W0(ft3}
...••.... (A40) • V
pAQ(c._+c1)(p.-p)
The material balance equation can then be written:
(plz)[l-c0(p.-p)] • (p/z); [ 1 - �} +(plz);:;;
, S.61S .. (A41)
and simplified in a form where the c. term includes the aquifer contnbution to pressure support,
w. w. T.(plz},GB
1 =
(p/z);G P.T
(plz)
w w (p/Z)·-• ., (p/z)-" ; GB . • V ,a(l-S..) . . . . . . . . (A42)
'GB1
GB• •
(p/Z); W0 "' (p/z) V
pAQ(ctw +c1)(p.-p)GB, V
,.( 1-S.J
Rearranging we arrive at the general form of the material balance (without water productiqp and gas/water injection terms):
(p/z) [l-c0(p;-p)] • (p/z). [ 1- �] .............. (A43)
where
vplfNp
vpAQ -- + -- Cc.,
+ c,> v
,. v ..
c • • ____ ...__.,:....,,,....--:.r-_,,1, __ _ 1-s ...
•.•••••.. (A44)
M V ,-, + V pM1 V
,,. • V ,a • V ,a
. . . . . . . . . . . . . . .
. . . . (A4S)
c • •
S._c._ + c, + M (c,. + c,) (1-S.J
........•••.•.•.•. (A46)
•
SPE 22921

TABLE 1 - CALCULATION OF PORE VOLUME COMPRESSIBILITY FROM LABORATORY DATA
Reported Laboratory Data Calculations for p1 =9800 psia
Po VP
vb <f, p P1-P VP1-VP
Cr
(psia) (cm3) (cm3) (%) Cr (psia) (psi) (cm3) Eq.5
200.0 3.420 20.530 16.70 16.50 9800 0 0.000 16.50 1000.0 3.379 20.489 16.49 13.70 9000 800 0.041 14.99
2000.0 3.337 20.447 16.32 11.40 8000 1800 0.083 13.48 3000.0 3.303 20.413 16.18 9.10 7000 2800 0.117 12.22 4000.0 3.276 20.386 16.07 6.90 6000 3800 0.144 11.08 5000.0 3.257 20.367 15.99 5.00 5000 4800 0.163 9.93 6000.0 3.243 20.353 15.93 3.80 4000 5800 0.177 8.92 7000.0 3.230 20.340 15.88 4.10 3000 6800 0.190 8.17 8000.0 3.213 20.323 15.81 7.30 2000 7800 0.207 7.76 9000.0 3.ln 20.287 15.70 16.80 1000 8800 0.243 8.07 9500.0 3.144 20.254 15.50 25.80 500 9300 0.276 8.68
All compressibilities in 10'6 psi••.
..

TABLE 2 - COMPARISON OF Cr FOR NORMAL PRESSURE AND OVERPRESSURED CONDITIONS
Normal Over-Sample Initial Pressure Pressured
Porosity Cr. Cr.
(%) (psi• 1) (psi• 1)
Gulf Coast Sandstones
Sample 1 13 4.8 6.4 Sample 2 20 4.4 16.S
North Sea Chalk
Sample 9 (pore collapse) 32 18.3 7.9 Sample 10 (pore collapse) 30 20.1 7.4
Von Gonten
Sample 9A 11 3.0 6.0 Sample 4A 22 4.6 9.2 Sample 7A 26 5.9 7.2 Sample 3A 28 8.6 10.6 Sample 6A 25 7.8 8.6
Normal Pressured is 0.5 psi/ft x Depth ; Overpressured is 0.8 psi/ft x Depth. Depth Used is 10,000 ft.
•

TABLE 3A - EXAMPLE CALCULATION OF TOTAL WATER CUMULATIVE COMPRESSIBILITY FOR THE ANDERSON "L" RESERVOIR
Pressure Bw Raw B, Btw ctw .
bbl/STB scf/STB z, ft3/scf bbl/STB 10' psi-1ps1a
9510 1.0560 31.8 1.4401 0.00282 1.056 2.40
9000 1.0569 31.0 1.3923 0.00288 1.057 2.43
8000 1.0586 29.2 1.2991 0.00303 1.060 2.51
7000 1.0604 27.2 1.2072 0.00322 1.063 2.65
6000 1.0621 25.0 1.1176 0.00347 1.066 2.78
5000 1.0638 22.5 1.0325 0.00385 1.070 2.98
4000 1.0654 19.6 0.9562 0.00446 1.075 3.28
3000 1.0669 16.1 0.8977 0.00558 1.083 3.86
2000 1.0681 11.8 0.8744 0.00815 1.097 5.19
1500 1.0686 9.3 0.8832 0.01098 1.113 6.69 1000 1.0691 6.S 0.9078 0.01693 1.145 9.95 750 1.0692 5.0 0.9258 0.02302 1.179 13.30
500 1.0693 3.3 0.9472 0.03533 1.249 20.24
250 1.0694 1.6 0.9708 0.07242 1.459 41.20
100 1.0694 0.5 0.9835 0.18341 2.092 104.23
14.7 1.0694 0.0 1.0000 1.26860 8.254 717.86
B. and R.. were calculated from the Peng-Robinson EOS with volume translation using binary interaction parameters that are functions oftemperature and salinity (28,000 PPM for this example); the gas Z-factor was calculated from the Standing-Katz correlation .
..

TABLE 3B - EXAMPLE CALCULATION OF TOTAL WATER CUMULATIVE COMPRESSIBILITY FOR THE ELLENBURGER RESERVOIR WITH INITIAL 28% CO2 CONCENTRATION
Pressure Bw Rn, B, B
lW ClW.
bbl/STB scf/STB z, ft3/scf bbl/STB 106 psi·1ps1a
6675 1.0761 67.5 1.0464 0.00292 1.076 2.75 6000 1.0765 64.S 0.9962 0.00310 1.078 2.83 5000 1.0768 59.5 0.9262 0.00345 1.082 3.12 4000 1.0770 53.5 0.8732 0.00407 1.087 3.84
3000 1.0767 46.1 0.8493 0.00528 l.@7 5.24
2500 1.0764 41.5 0.8513 0.00635 1.106 6.61 2000 1.0758 36.1 0.8638 0.00805 1.121 8.89 1750 1.0754 33.0 0.8742 0.00932 1.133 10.67 1500 1.0749 29.6 0.8872 0.01103 1.149 13.15 1250 1.0743 25.8 0.9028 0.01347 1.174 16.83 1000 1.0735 21.6 0.9208 0.01717 1.214 22.56 750 1.0727 16.9 0.9408 0.02339 1.284 32.53 500 1.0716 11.7 0.9621 0.03588 1.428 52.99 250 1.0704 5.8 0.9833 0.07335 1.876 115.75 100 1.0695 1.9 0.9946 0.18548 3.236 305.33 14.7 1.0689 0.0 1.0000 1.26860 16.319 2126.80
B. and R.., were calculated from the Peng-Robinson BOS with volume translation using binary interaction parameters that arc functions oftemperature and salinity (50,000 PPM for this example); the gas Z-factor was calculated from the Standing-Katz correlation .
•

tfl. -.
..--I
---..
600
600-1
400
300
200-1
100
o , 0
10000
G Cl
1 8000
G. (1 + (2x10⁻⁴) Cp!) Cc.)]8000
p/z with p1 (psia) & c. ( 1 /psi)
4000
2000
o k 6 '\
P;-12000 P�0 60
/
50
� Pi - 10000 PSIA
Pi - 8000 PSIA
Pi - 6000 PSIA
Pi - 4000 PSIA· - 2000 PSIA
100 160
68
. , 10-6 1/PSII
100
Gp
••
Fi9. 1 Bffect of p1 and c• on Overe■timatin9 G
"-. Gx160 200
200

3.60 0 0
I
.. 3.46 w
::> 3.40 ..J I 0 > 3.36 w
a: 3.30 0 a..
Cl 3.26w
� 3.20 _j
3.15 w
3.10
3.05 0
..
INITIAL RESERVOIR PRESSURE�
':,\, 0 y'(,
�o�O_.c
te
� p
•
2000 4000 6000 8000 PORE PRESSURE, PSIA
rig. 2 cumulative Pore Volume Compreeeibility •• a Chord Slope
10000

-
en 0. ' .-
(0 I
0 .-
..
>-!:J -
en -
en en w
a: 0. � 0 u
w � ::)....J0 >
w a: 0 0.
30---------------------------
26
20
16
10
6
.. SANDSTONE WITH PORE COLLAPSE
� I
I
t♦INSTANTANEOUS, Cf I
' I
' ' I I �'I
' I
INITIAL RESERVOIR PRESSURE. Pi--.., ' ' ' ' ' ' ' '
CUMULATIVE. �f
• ' -
-' --
' ._, - /if'"" --
i)"'
.,Ii:! --
.,,fif
---
� - -1\t..� -'---- START OF PORE COLLAPSE
•
---
-,
, , � ,
0-t------,.----------.-------,.----t
0 2000 4000 6000 8000 10000
1'19. l
PORE PRESSURE, PSIA
Cumulative and Inetantaneoue c, ve p for a Sandstone With PoreCollapae
-
(/) a. -............
(0 I
0 ..... ..
>-!:i -
al -
(/) (/) w a: a.
� 0 u w
� :::) ....I 0 >
w
a: 0 a.
30-------------------------
26
20
16
10
6
.. 0 ' ' ' ' ' '
�
CUMULATIVE, Cf �
' ' ' ' ' ' '®
CHALK
WITH PORE COLLAPSE
\♦INSTANTANEOUS.cf ' ' ' ' ' ' ' INITIAL RESERVOIR PRESSURE, Pi '
-- -
.()- - - - -@ -- -
€>
t START OF PORE COLLAPSE
0 -
0 2000 4000 6000 8000
PORE PRESSURE, PSIA
10000
Fi9. 4 Cumulative and Inatantaneou• c, va p for a Chalk With Pore Collap••

-
Cl) a.. "�
co I
0�
...
� ....,
I(.)
40 I I 1.1 40
m" I-
_,
m 8twm
-30 3
-m
.,
� m
1 0
20i \0 10000
RESERVOIR PRESSURE. PSIA
10
0
0 2000 4000 6000 8000
RESERVOIR PRESSURE, PSIA
Fig. 5 Cumulative Total Water Compreeeibility, ctw' ve P
m
I-Cl)
u:-0 Cl)
-3 fl)
a:
Pi
10000

(0
"
Q) 10
100
\ .. c
8 WITH CONSTANT ROCK COMPRESSIBILITY Cf
80
60
40 J ,, � P·. I
I \ \ t M-4.0
I \' 20
_____ :_:_:_-_-_-_-_-_-_-_-_- _-_- _-_-_ -_ -=.-=.--:::--:::--:::-=-=-=-=-=-=-= M - 1.0
_________________________ M - 0.6M • O.
0-+---------------------..
0 2000 4000 6000 8000
RESERVOIR PRESSURE, PSIA
Pig. 6 Cumulative Effective Compreaaibility va pat Various M Ratios
10000

100
80
-
......... �
60
I0 �
...
I I \ \ I I \ \ I I I ,
I \ \ \
\ '
�
M-= 2.0
p·
•
a> 4010
20 ------------
-�M�•== 0.0
• •
O f SANDSTON� WITH PORE ?OLLAPSE I
I f2000 4000 6000 8000
RESERVOIR PRESSURE, PSIA
10000
Pig. 7 Cumulative lffective COmpr•••ibility v• p for a sand•tone W/Pore COllapae

I
0 ,:-
..
10
100 I \
CHALK WITH PORE COLLAPSE
ao I \ "
60
40�.
p·
� M == 2.0
----- M-1.0
20 ------ M == 0.5
...........,.__ __ M == 0.0
0
0 2000 4000 6000 8000 .
RESERVOIR PRESSURE, PSIA
10000
Fig. 8 Cumulative Effective Compressibility v• p for a Chalk W/Pore Collapse

<(
0...
C.
8000 M == 0
•
7000 �IC
-
Cf -6000
--
5000 B
0 SANDSTONE
0 p
4000 B. Cb WITHOUT
P RE COLLAPSE3000 � � C. Cf == CONSTANT
2000
1000 A. Cf WITH
PORE COLLAPSE
•
O-t----........ ------------.--------1
0 20 40 60 80 Gp/G, %
Fig. 9 Effect on p/Z ve GP
With and Without Pore Collapae, Sandstone
100
7000 A .. Cf WITH
PORE COLLAPSE -i M-0
6000� Cf
5000 I \
I """-.. \ 0
<( 4000 I
�.
a.. IB. Cf WITHOUT
0
...
p
PORE COLLAPSE
� 3000 C.
2000
1000
0-t------.----------.----...-----f
20 40 60 80 100
Gp/G, %
r19. 10 Effect on p/Z v• Gp With and Without Pore Collap•e, Chalk

<
a...
I ·-
a. -
-
a. � 10
I T-. ........,N
........ a.
7000 "
6000-t �
6000� �
4000 ◄
3000
2000
1000
0
-1000�
-20000 1
7000 ELLENBURGER GAS RESERVOIR
o HISTORICAL PERFORMANCE DATA I- 6000FORECAST LINE M - 3.3
l-6000
(-4000
<( 3000 u.,
a. ..
2000 N ......_,_0.
�,, 1-1000' ',
,,I
0.
MATERIAL BALANCE LINE
"' t- -1000• '
G .. IG+G8 -2000
2 3 3.16 3.7 4
Gp, TSCF
1'19. 11 Pree■ure ve cumulative Production, lllenburger Ca• Re■ervoir
·200g % ·
ELLENBURGER GAS RESERVOIR
c8
BA CK CALCULATED ASSUMING OGIP
o 3.0 TSCF • 3.15 TSCF Q 3. 3 TSCr v 3.6 TSCr
V5 150
(0 I
0 or-
..
Q) 10
100
\ ;. □ \. □
0
\, 0
c (p) GENERATED FROM a R!>CK AND WATER PROPERTIES
a M- 3.3
c:, c:, •
0
�
aDo OQ • - 0
50 Q 0 ..., Q ,.r "'
O 0
i� V • '9 V V
VV V
V Q
� VV V V V V V V
V VV Pi
V
0
0
1'19. 12
2000 4000 6000
RESERVOIR PRESSURE, PSIA
Backcalculated c• ve pat Varioue OCIP, Sllenbur9er oae R•••rvoir
8000

200
180
160
140 �
(0 120
� 100 ...
10 80
60
40
20
0 , 0
.. ELLENBURGER RESERVOIR
0 ce(P} BACK CALCUL�TED ASSUMING 0GIP = 3.15 TSCf
"'O 9g)q M == 4.0
6 M - 3.3
0
--------------------�•' '�-, M == 1.0 ----------------=====1�1 �· ·= M == 0.5------------------ M - 0.0
I! •
2000 4000 6000
RESERVOIR PRESSURE, PSIA
8000
Fig. 13 Matching Backcalculated c• to Generated c• Curvea, Ellenburger Ca•
Reservoir

<( -
en a.
....
� C.
1000----------------------,
�
6000-l'
6000-
4000-
3000-
2000-
1000-
''Ga. ',
' c,,,
�
ANDERSON .,L.,
RESERVOIR
o HISTORICAL PERFORMANCE DATA
'�
' '(i) '
' ' ' ' ' ' •••••,,,
/F�R!_
C{f_l USING
' ' '
' ' ' ' ' ' ' ' ' .
,. o_.,_-----------------..---�
0 20 40 60 80 100
Gp,BSCF
Pi9. 14 p/Z v• Cumulative Production, Ander•on •L• Reaarvoir

" �
100-----------------------------.
ANDERSON .. L. RESERVOIR •
Ce BACK CALCULATED ASSUMING OGIP
80 A 65 escr • 72 BSCF □ 90 BSCF
60
A
A
10(]) 40
A
P;
20 c9 (p) GENERATED FROM
• e A
•
ROCK AND WATER PROPERTIES
M - 2.26 a
a
a
AA A A
•
a
□a O a
A
• ••
A
a a a •
0 a □
0 2000 4000 6000 8000
RESERVOIR PRESSURE, PSIA
Fig. 15 Backcalculated c• ve p at Varioue OGIP, Anderson •L• Reeervoir
10000
0 0 0 ....
�
'4.... w 0
0
(J >
0 '4
z •
CX) CD
<( QI • ix:
� ....C
a: CJ)
0 <(
0
a: (J ..
- LL C
0 a: w 0
, .... > w a: , 0 +I
0 , 0
LL
u
a: a.. , w LL , (0 CJ
0
_. , M
CJ) , 0.
w <( , Cl) , • a: (J , co - , +I
z a: , .. , .. ....
::, 0 , C. ::s
, e
-, .... , 0 (!J a
<( (J') ,
0 - , •
(J :r: , �
>
, , -
0 , ell
, ,
, ,
, '°
, ... • ,
, 0 .
, 01
0 ....
, ... , N ,
'1
J' J'
0
0 0 0 0 0 0
0 0 0 0 0
0 0 0 0 0
0 (X) (0 ,q- N .....
VISd 'z/d

a.. ......... �
co I
0 �
100 -----------------------,
..
80-
60-
CAJUN RESERVOIR
c8 BACK CALCULATED ASSUMING OGIP
X 760 BSCf + 565 BSCF D 450 BSCF
e 650 BSCF l:i 500 BSCF O 410 escr
0
0 40- c8 (p) GENERATED FROM
0 0
0 D 1(.)
20-
ROCK AND WATER PROPERTIES
M- 0.2
'- + • • • •
0-------------------..r..L.
0 D D D
0 D
p·
l:i l:i b,. l:i
l:i D
�
l:i + + + + +
I
- ••
0
-
2 '>t � X
V ' ,
+
-20-t----...-------------....---,----t
0 2000 4000 6000 8000 10000 12000 RESERVOIR PRESSURE, PSIA
Fi9. 17 Backcalculated ce v• pat Varioue OGIP, Cajun Reservoir

<(
N
8000-------------------7
7000
6000
5000-t
4000
aoooi
2000�
1000
-
GULF COAST RESERVOIR ·c·
o HISTORICAL PERFORMANCE DATA
0
0
0
0
0
Q:)<?o
0-.----.....-------------...------t
0 60 100 160 200
Gp,BSCF
Pig. 18 p/Z va cumulative Production, Gulf Coaat Reaervoir -c-
260

200---------------------,
- 150-(,/)
� 100-0
..
I(.) 50 -
l:&1 l:&1 l:&1
+l:&1•1:&1
� l:&1 ♦
\"+ .,1:&1
6. +66 l:&1
1:&1
•• 6 6 6 �
�xx xx
++
o I ,ffl-4-+
+ o ◊
0◊
�
GULF COAST RESERVOIR ·c·
Ce BACK CALCULATED ASSUMING 0GIP 181 1so escr 6. 1so escr + 220 escr
♦ 170 escr X 200 BSCF ◊ 240 BSCF
l:&1 ♦
181 181 l:&1
♦ + ♦
6 6 6. 6
X X
X
X + +
+ + ◊ ◊
◊ ◊
181 l:&1
♦♦
6. 6.
X X
+ + ◊
◊
181
! X + ◊
• •
I
-50-t------------------.----40 2000 4000 6000 8000 10000 12000 14000
RESERVOIR PRESSURE, PSIA
Fig. 19 Backcalculated c• v• pat Variou• OGIP, Gulf coa■t Reaervoir "C"

6000 6000 ..
DUCK RESERVOIR
<( 6000i�. o HISTORICAL PERFORMANCE DATA � 6000
... 4000-1 �� l-4000 . ,---, a. I ►
a.3000 3000
<( EXTRAPOLATES TO 860 BSCF -
- U) a. 2000 a.� 2000
10 ...
N
I
1000 1000 ....__,
a. a
I � '
I0
I
-1000-I . I
I- -1000I I
I I
G - 826 G+G8
• 180
-2000 -20000 100 200 300 400 600 600 700 800 900
Gp,BSCF
Fig. 20 Preaaure va Cumulative Production, Duck Reservoir

160-------------------------,
� 100 �
co I
�
I o<D
60
0
0
• DUCK RESERVOIR
ce BACK CALCULATED ASSUMING OGIP o 625 escr "v 680 ascr
0
,,
M = 6.5
\,\ Ooo o
i
tfJ
' ' ',
a o "'"' 'J 'J 'J
�--ll. -<.z. � ��------ -',;I. -tl. 'IJ'-� -
-...... 0 0 0
'J
1 'J
'J 'J "'""" "
CtwM = 4.8
� i
I
1000 2000 3000 4000 6000 6000 7000 RESERVOIR PRESSURE, PSIA
Fig. 21 Backcalculated c• va pat Variou• OGIP, Duck Reservoir

I
I
CONNATE WA1ER (CONTAINING s«VTION GAS)
1.
INTERBF.DDE'D SHALES AND POOR QUAIJTY RESER.VOIR ROCK
(CON1'AlNING SOLunON GAS)
2.
LIMJTFD AQUIFER (CONTAINING SOW110N GAS)
Ex:IERNAL •URGE• AQUIFER. WTI1I 71U.NSIFNT ENCROACBMENI' BEHAVIOR
Fig. 22 General Material Balance Schematic