spawning activity and migratory characteristics of
TRANSCRIPT

Abstract
SMITH, JOSEPH ALAN. Spawning Activity and Migratory Characteristics of American
Shad and Striped Bass in the Cape Fear River, North Carolina. (Under the direction of
Joseph E. Hightower.)
Anadromous fish populations within the Cape Fear River, North Carolina have
experienced declines since the late 1800s. Three low-head lock and dam structures
contributed to this decline by limiting access to upstream habitat. I used egg sampling and
sonic telemetry to characterize patterns of migration and spawning activity for American
shad (Alosa sapidissima) and striped bass (Morone saxatilis). Plankton samples were
collected below each lock and dam, and at two locations farther upstream. Distribution
and stage of development of American shad eggs, as well as observed spawning activity,
suggest that most American shad spawning took place downstream of the lowermost lock
and dam [river km (rkm) 97]. Egg density decreased by an estimated 90% with each
successive dam moving upstream. In 2007, 20 American shad and 20 striped bass were
captured and transported to a release location upstream of the three locks and dams, where
they were tagged with sonic transmitters and released. Sixty percent of American shad in
2007 moved 1 to 33 rkm upstream of the release site, at an average migration rate of 2.30
rkm/hr. All striped bass tagged in 2007 moved downstream upon release. However, two
striped bass made secondary upstream migrations of 52 and 134 rkm, through two and
three dams, respectively, and at an average rate of 2.58 rkm/hr. In 2008, 20 American
shad and 20 striped bass were captured, tagged with sonic transmitters, and released at

their capture locations (all but two striped bass downstream of the first lock and dam).
Sixty-five percent of American shad and 77% of striped bass made upstream movements
past the lowermost lock and dam in 2008, with average migration rates of 3.2 rkm/hr for
American shad and 3.0 rkm/hr for striped bass. Furthermore, 35% of American shad and
25% of striped bass that made upstream movements were able to migrate upstream of the
uppermost lock and dam (rkm 186). Based on passage rates at the three locks and dams,
American shad would be expected to be most abundant downstream of Lock and Dam 1
(where egg collections were highest) and upstream of Lock and Dam 3. For striped bass,
the section of the river between Lock and Dams 2 (rkm 149) and 3 (rkm 186) had the
highest egg collections and highest predicted proportion of the run. In combination, these
results demonstrate that the locking program provides some access to historical spawning
habitat, although further improvements in fish passage could benefit both species.
Spawning Activity and Migratory Characteristics of American Shad and Striped Bass in
the Cape Fear River, North Carolina
by
Joseph Alan Smith
A thesis submitted to the Graduate Faculty of
North Carolina State University
In partial fulfillment of the
requirements for the Degree of
Master of Science
Fisheries and Wildlife Sciences
Raleigh, North Carolina
2009
APPROVED BY:
Thomas J. Kwak Kevin Gross
Joseph E. Hightower
Chair of Advisory Committee

ii
Biography
My homeland is the great “volunteer” state of Tennessee, specifically, a small city
in the Ridge and Valley Physiographic Province of upper east Tennessee called Kingsport.
As a child, I was very fortunate to live at the base of Bays Mountain Park and State
Natural Area, which lies along the crest and inside slopes of Holston River Mountain and
Bays Mountain. The forests and waters of that land were ecological playgrounds and are
the origins of my interest in the world of natural resources. I spent countless hours wading
through creeks flipping rocks for “crawdads” and “grampus” and hauling my seine made
from an old window screen in pursuit of “minnows”. I took advantage of every chance I
had to fish for bass and bluegill in the small reservoir that was the centerpiece of the
park‟s watershed. Needless to say, my “fishing fever” was contracted right in my own
backyard.
Although the majority of my free time was spent fishing the ponds, creeks, rivers,
and reservoirs of my home state, the idea of a career conserving such valuable resources
did not arise until many years after high school. My true appreciation for aquatic resource
management began with volunteer work at the Tennessee Valley Authority (TVA) in
Knoxville, Tennessee, where I worked with biologists sampling aquatic organisms and
habitat of small streams and rivers in the Tennessee River watershed. This experience
opened my eyes to new possibilities and led to my decision to return to college.
While pursuing my education, I continued to volunteer and subsequently work as a
contract biologist for TVA. I graduated from Pellissippi State Technical Community

iii
College with an Associate of Science degree and immediately transferred to the
University of Tennessee (UTK), where I obtained a Bachelor of Science in wildlife and
fisheries science. While at UTK, I was employed as a field technician, worked with
graduate students on various fisheries projects, and took part in volunteer activities as part
of a student fisheries group.
After graduation from UTK, I obtained a position as a Natural Resource Biologist
with the Maryland Department of Natural Resources (MDNR). While at MDNR, I was
part of the Monitoring and Non-Tidal Assessment group, which was responsible for
tracking the status of the state‟s low-order streams. Although appreciative of the
experience in Maryland, I was eager for the opportunity to obtain a Master of Science in
aquatic resource management. So when I saw an opening available at North Carolina State
University to work with Dr. Joe Hightower on unique species, in a large coastal river
system, I jumped at the chance. Since my fortunate acceptance to the project, I have been
given outstanding guidance, support and encouragement. I hope to use the knowledge and
skills from all my experiences to protect and conserve the priceless natural resources that
have given so much to me throughout my life.
iv
Acknowledgments
I give great thanks to my committee chair Dr. Joseph E. Hightower for giving me
the opportunity to work under his direction. I have gained much respect and admiration
for him over the years and I have benefited greatly from his guidance. I also thank my
committee members; Kevin Gross for volunteering his time and effort to assist me with
critical data analysis and Tom Kwak for also volunteering his time and providing me with
valuable input.
I thank United States Army Corps of Engineers personnel Frank Yelverton, Carol
Banaitis, and Craig Shoe for funding and logistical support, as well as lockmasters Robin
Hall and Phil Edge for their time and assistance. I also give great appreciation to North
Carolina Wildlife Resources Commission (NCWRC) biologists Keith Ashley and Tom
Rachels for their valuable time and effort collecting and transporting fish for tagging, Jeff
Evans and staff at the NCWRC Watha Hatchery, and the staff at the Pechmann Fishing
Eduction Center.
I especially thank field technicians McLean Seward and Matt Lubejko for putting
in all the hours of hard work through rainy days and bug infested nights, as well as for
being outstanding living and working partners in the quest for Cape Fear knowledge. I
also appreciate access to the river provided by landowners David “Poke” Hurley, Randy
Joyner and the late Sol Rose. Great appreciation is also given to my fellow graduate
students for their assistance and moral support over the years. Last, but definitely not
least, I thank my mom for always being my best supporter in all of my life‟s endeavors.

v
Table of Contents
List of Tables .............................................................................................................. viii
List of Figures .............................................................................................................. xi
Introduction .................................................................................................................. 1
Species Accounts ........................................................................................................... 6
Reproductive Biology-American Shad ............................................................... 6
Reproductive Biology-Striped Bass ................................................................... 8
Study Area ................................................................................................................... 10
Methods ....................................................................................................................... 11
Egg Sampling ................................................................................................... 11
Egg Data Analysis ............................................................................................ 13
Tag Retention ................................................................................................... 14
Fish Collection and Tagging ............................................................................ 15
Tracking ............................................................................................................ 17
Detection Probability ........................................................................................ 19
Receiver Detections and Relocations ............................................................... 20
Migration Rate Analysis ................................................................................... 20
Results .......................................................................................................................... 22
Egg Sampling ................................................................................................... 22
Egg Data-American Shad ................................................................................. 23

vi
Egg Data-Striped Bass ...................................................................................... 25
Spawning Observations .................................................................................... 26
Tag Retention ................................................................................................... 26
Migratory Characteristics ................................................................................. 27
Passage Efficiency ............................................................................................ 29
Detection Probability ........................................................................................ 29
Migration Rate Analysis ................................................................................... 30
Discussion .................................................................................................................... 31
Egg Sampling ................................................................................................... 31
Spawning Observations .................................................................................... 32
Spawning Distribution ...................................................................................... 33
Sampling Efficiency ......................................................................................... 37
Telemetry .......................................................................................................... 39
Detection Probability ........................................................................................ 41
Migration .......................................................................................................... 42
Migration Rate .................................................................................................. 44
Passage ............................................................................................................. 46
Future Directions .............................................................................................. 49
Literature Cited .......................................................................................................... 51
Tables ........................................................................................................................... 60
Figures ......................................................................................................................... 71

vii
APPENDICES ............................................................................................................. 93
Appendix A. Number of eggs and larvae for both species collected in
plankton tows and volume of water filtered in each sample for all sites
in 2007-2008 ..................................................................................................... 94
Appendix B. Movement of sonically tagged American shad and striped bass
based on stationary receiver and manual relocation data in 2007 ................. 104
Appendix C. Movement of sonically tagged American shad and striped bass
based on stationary receiver and manual relocation data in 2008 ................. 112
viii
List of Tables
Table 1 Coordinates and average temperature, dissolved oxygen, depth,
volume of water sampled, and density of stage 1 American shad
eggs (eggs/1000 m3) collected at each egg sampling location on the
Cape Fear River, NC. Averages based on all samples taken at each
location from 9 March – 31 May 2007 and 5 March – 4 June 2008 .... 60
Table 2 American shad eggs by stage of development collected from five
sites sampled March 9 - June 1, 2007 and March 5 – June 4, 2008
on the Cape Fear River, NC. Development criteria provided by
Jones et. al. (1978) ................................................................................ 61
Table 3 Nominal logistic regression model results for effect of temperature
on presence/absence of American shad eggs in plankton net samples
from 2007 and 2008 on the Cape Fear River, NC ................................ 62
Table 4 Regression model results for effects of sample site location, hour bin,
and temperature on log-scale density (eggs/1000m3) of American
shad eggs in plankton net samples from 2007 and 2008 on the
Cape Fear River, NC ............................................................................ 62
Table 5 Striped bass eggs by stage of development collected from five sites
sampled March 9 - June 1, 2007 and March 5 – June 4, 2008 on the
Cape Fear River, NC. Development criteria provided by Jones et. al.
(1978) ................................................................................................... 63
Table 6 Tag retention experiment conducted on April 4, 2007 at the NC
Wildlife Resources Commission‟s Watha Hatchery. Ten American
shad were implanted with VEMCO V9-1L-R04K coded transmitters
and an additional 11 were held as controls. Fish were held in a round
hatchery tank and observed over a five-day period for mortality and
tag expulsion. There were no mortalities among the control fish ........ 64
ix
Table 7 Date of release, tag identification number, sex, and total length for
American shad implanted with VEMCO V9-1L-R04K coded
transmitters during the 2007 field season. Release treatments indicate
whether or not fish were held in the instream holding pen or released
directly into the river. Duration listed (hours) indicates how long fish
were held with the door closed. The total number of fish held is given;
tagged fish are identified by (T) and untagged by (U). First receiver
detection refers to stationary receivers; fish not detected = ND .......... 65
Table 8 Date of release, tag identification number, sex, total length, and total
time spent in surgery for striped bass implanted with VEMCO
V13-1L-R64K coded transmitters during the 2007 field season.
Release treatments indicate whether or not fish were held in the
instream holding pen or released directly into the river. Duration listed
(hours) indicates how long fish were held with the door closed. The
total number of fish held is given; tagged fish are identified by (T) and
untagged by (U). First receiver detection refers to stationary
receivers; fish not detected = ND ......................................................... 66
Table 9 Date of release, tag identification number, sex, and total length for
American shad implanted with VEMCO V9-1L-R04K coded
transmitters during the 2008 field season. Last column denotes
whether or not fish moved upstream of Lock and Dam 1 (rkm 97)
post release, Y=yes, N=no .................................................................... 67
Table 10 Date of release, tag identification number, gender, total length, and
time spent in surgery for striped bass implanted with VEMCO
V13-1L-R64K coded transmitters during the 2008 field season. Last
column denotes whether or not fish moved upstream of Lock and
Dam 1 (rkm 97) post release. ** Fish 10231 and 10232 were caught
and released below Lock and Dam 2 (rkm 149) ................................... 68
Table 11 Multiple regression model results for effects of start location
(start rkm), fish length, and streamflow on migration rate of sonically
tagged American shad, based on calculations from stationary receiver
detection data from 2007 and 2008 in the Cape Fear River, NC ......... 69

x
Table 12 Multiple regression model results for effects of start location
(start rkm), fish length, and streamflow on migration rate of sonically
tagged American shad, based on calculations from stationary receiver
detection data from 2007 and 2008 in the Cape Fear River, NC ......... 70
Table 13. Published reports of range of temperatures (C°) over which peak
American shad spawning occurs .......................................................... 70
xi
List of Figures
Figure 1 Location and associated river km of egg sampling stations within the
Cape Fear river during the 2007 and 2008 field seasons. Locks and
dams are shown for reference ............................................................... 71
Figure 2 Location and associated river km of stationary receivers within the
Cape Fear River during the 2007 and 2008 field seasons. Locks and
dams are shown for reference ............................................................... 72
Figure 3 Linear fit of streamflow (m3/s) and water velocity (km/hr)
measurements from the Cape Fear River, NC ...................................... 73
Figure 4 Average daily streamflow (m3/s) and precipitation (cm) data from
March 1 to June 1, 2007 and 2008 from the USGS gauge at lock and
dam 1 on the Cape Fear River, NC ....................................................... 74
Figure 5 Density of stage-1 American shad eggs (number/1000 m3) collected
from each sampling station on the Cape Fear River, March 5-June 5,
2007. The line is an exponential model fitted using least squares
regression .............................................................................................. 75
Figure 6 Density of stage-1 American shad eggs (number/1000 m3) collected
from each sampling station on the Cape Fear River, March 5-June 5,
2008. The line is an exponential model fitted using least squares
regression .............................................................................................. 76
Figure 7 Density (eggs/1000 m3) of American shad eggs and streamflow
(m3/s) for samples below lock and dam 1 (rkm 97) on the Cape Fear
River during the 2007 field season ....................................................... 77
Figure 8 Density (eggs/1000 m3) of American shad eggs and streamflow
(m3/s) for samples below lock and dam 1 (rkm 97) on the Cape Fear
River during the 2008 field season ....................................................... 78
Figure 9 Density (eggs/1000m3) of American shad eggs and streamflow (m3/s)
for samples below lock and dam 2 (rkm 149) on the Cape Fear River
during the 2007 field season ................................................................. 79
xii
Figure 10 Density (eggs/1000m3) of American shad eggs and streamflow (m3/s)
for samples below lock and dam 2 (rkm 149) on the Cape Fear River
during the 2008 field season ................................................................. 80
Figure 11 Density (eggs/1000m3) of American shad eggs and streamflow (m
3/s)
for samples below lock and dam 3 (rkm 186) on the Cape Fear River
during the 2007 field season ................................................................. 81
Figure 12 Density (eggs/1000m3) of American shad eggs and streamflow (m3/s)
for samples below lock and dam 3 (rkm 186) on the Cape Fear River
during the 2008 field season ................................................................. 82
Figure 13 Density (eggs/1000m3) of American shad eggs and streamflow (m3/s)
for samples near Fayetteville, NC (rkm 226) on the Cape Fear River
during the 2007 field season ................................................................. 83
Figure 14 Density (eggs/1000m3) of American shad eggs and streamflow (m3/s)
for samples near Fayetteville, NC (rkm 226) on the Cape Fear River
during the 2008 field season ................................................................. 84
Figure 15 Logistic regression analysis showing water temperature effect on
probability of American shad egg presence in plankton net samples
based on observed (bars) and predicted (line) values during 2007 and
2008 in the Cape Fear River, NC ......................................................... 85
Figure 16 Estimated least square means of log transformed egg densities for the
three lock and dams, based on a multiple regression model
incorporating location, sampling time and water temperature ............. 86
Figure 17 Minimum extent of upstream migration by American shad and
striped bass, based on stationary receiver detections in 2008. The X
axis shows river kilometer and location of receivers. The Y axis gives
number of fish that migrated at least as far upstream as the associated
rkm. For example, rkm 246 was the known minimum upriver migration
for 2 striped bass and 1 American shad. These fish were detected by
other downstream receivers but not by any receivers further upstream
of rkm 246. The dashed line represents the dam at Lock and Dam 1.
The first receiver (rkm 97) was located inside of the lock chamber at
Lock and Dam 1 and fish only detected here (3 striped bass) were not
successful in migrating upstream of the dam ....................................... 87
xiii
Figure 18 Detection probabilities of stationary receivers for tagged American
shad movements in 2007-2008 on the Cape Fear River, NC.
N = number of fish used in calculation ................................................ 88
Figure 19 Detection probabilities of stationary receivers for tagged striped bass
movements in 2007-2008 on the Cape Fear River, NC. N = number
of fish used in calculation. . .................................................................. 89
Figure 20 Plot of migration rate least square means values at each start rkm for
tagged American shad migrating in the Cape Fear River, NC from
2007-2008 ............................................................................................. 90
Figure 21 Plot of migration rate least square means values at each start rkm for
tagged striped bass migrating in the Cape Fear River, NC from
2007-2008 ............................................................................................. 91
Figure 22. Estimated distribution of spawning adults (Migr %) and observed
distribution of collected eggs (Egg %) for American shad (upper panel)
and striped bass (lower panel) .............................................................. 92

1
Introduction
Anadromous fish species (those that live primarily in saltwater and migrate into
freshwater to spawn) have long been an important resource along the Atlantic coast of the
United States. These fish depend on coastal freshwater systems to provide spawning and
nursery habitat for their unique life history strategy. The success of these species depends
on their ability to reach suitable spawning habitat that is often hundreds of kilometers
upriver from the sea. Dams are obviously a major factor affecting these populations. They
alter downstream habitat, block migration to upstream spawning areas, and limit the
availability of nursery habitat for progeny (Beasley and Hightower 2000; Burdick and
Hightower 2006). The loss of habitat can be substantial; for example, Collier and Odum
(1989) reported that American shad lost 350 km of habitat in the main stem and tributaries
of the Roanoke River due to construction of dams. Patrick (2006) hypothesized that dams
force anadromous fishes to spawn in marginalized habitats that lessen reproductive
success and recruitment.
There are about 2,000,000 dams less than 14 m tall in the United States (Collier et
al. 1996; Poff and Hart 2002). Only a small number are removed annually due to factors
including dam age and negative environmental impacts (Shuman 1995). However, the cost
of dam removal is often prohibitive (Born et al. 1998; Smith et al. 2000), so different
methods of upstream passage have been implemented in lieu of dam removal. These
methods include the construction of fishways and fish ladders or the operation of fish lifts
2
(Weaver et al. 2003; Sprankle 2005). In the Savannah River, Georgia/South Carolina,
navigation locks are utilized to promote upriver passage of anadromous fish through a
low-head lock and dam (Bailey et al. 2004). This scenario is similar to that currently faced
by anadromous fishes migrating in the Cape Fear River, North Carolina.
The Cape Fear River historically supported large runs of anadromous species, but
population levels have declined substantially over the last two centuries (Rulifson 1994;
Winslow 1994). The most important species historically, in terms of commercial and
recreational fishing, were sturgeon Acipenser spp., American shad Alosa sapidissima and
striped bass Morone saxatilis. Sturgeon dominated the fishery of the late 1800s
(McDonald 1887) but only a small population of Atlantic sturgeon A. oxyrinchus and very
small number of shortnose sturgeon A. brevirostrum persist today (Winslow et al. 1983;
Moser and Ross 1995). At the turn of the 20th
century, this was one of the most productive
rivers for American shad in North Carolina (Nichols and Lounder 1970). Estimated
commercial landings within the Cape Fear River system in 1896 totaled 144,072 kg, of
which the Cape Fear River produced 76%, the Northeast Cape Fear River 15%, and the
Black River 9% (Stevenson 1899). In 1904, Cobb (1906) reported basinwide landings of
140,398 kg, with the Cape Fear River again accounting for the majority (77%) of the
catch. However, the average commercial landing of American shad in the Cape Fear
River system fell from over 136, 080 kg in 1896 and 1904, to 80,287 kg from 1957 to
1965 (Nichols and Louder 1970). The commercial harvest of American shad in 2005 on
the Cape Fear River was only 7,852 kg (ASMFC 2007).
3
The American shad fishery of the 1800s also included annual incidental catches of
striped bass of about 545 kg. In comparison to other North Carolina coastal river systems,
however, the striped bass fishery in the Cape Fear River system has traditionally been
small (Ashley and Rachels 2007). Currently, the Cape Fear River striped bass population
is among the lowest of North Carolina‟s coastal rivers (McDonald 1887; Patrick and
Moser 2001; Ashley and Rachels 2007). In 2008, the North Carolina Division of Marine
Fisheries (NCDMF) and North Carolina Wildlife Resources Commission (NCWRC)
implemented a complete harvest moratorium on striped bass in the Cape Fear River
system for both the recreational and commercial sectors in an attempt to promote recovery
of the fishery (NCDMF 2008; NCWRC 2008).
Declines in anadromous species landings in the Cape Fear River have been
attributed to the same variety of anthropogenic effects (overfishing, pollution, habitat
degridation, dam construction) that have impacted many other Atlantic coastal rivers
(Winslow et al. 1983; Winslow 1994). However, the most obvious of these effects in the
Cape Fear River is the presence of three low-head lock and dam structures, approximately
4 m tall, constructed between 1915 and 1934 by the United States Army Corps of
Engineers (USACOE) for the purpose of commercial navigation. Lock and Dam 1 (LD-1)
was constructed at river kilometer (rkm) 97 in 1915, Lock and Dam 2 (LD-2) at rkm 149
in 1917, and Lock and Dam 3 (LD-3) at rkm 186 in 1934 (Nichols and Louder 1970).
These obstructions were not the first to impact anadromous fish migration in the
Cape Fear River. A map from 1852 shows the presence of many lock and dam structures
4
along the Cape Fear River upstream of Fayetteville, North Carolina (Thompson 1852).
These early structures were built to aid ships transporting coal from the Deep River Coal
Company. located along the shores of the lower portion of the Deep River. However,
disrepair of these locks and dams after destructive flooding around the time of the Civil
War rendered them ineffective (NCDCR 2008). Shortly after this period, Stevenson
(1899) reported no artificial barriers to migration in the Cape Fear River and found
American shad migrating upstream to Smiley Falls (rkm 261). Similarly in 1904,
American shad were found 224 kilometers upstream near Fayetteville, North Carolina,
and spawning occurred from the mouth of the Black River to Fayetteville (Cobb 1906).
However, the construction of the locks and dams prevented such upstream passage, except
during boat lockage and possibly during extended periods of high flow (Nichols and
Louder 1970). Although fish ladders were constructed at each of the three locks and dams,
anadromous fish were shown to be unsuccessful at utilizing them (Davis and Cheek 1967;
Nichols and Louder 1970).
In 1962, a program was implemented through an agreement among the NCWRC,
USACOE, and United States Fish and Wildlife Service (USFWS) to use the lock at each
dam to move fish upstream to continue their spawning run (Fischer 1980; Moser et al.
2000). Nichols and Louder (1970) evaluated the use of the locks for anadromous fish
passage from 1962 to 1966. They estimated that 9,770 American shad passed through LD-
1, 1,110 at LD-2, and 50 at LD-3. Moser et. al. (2000) estimated that passage efficiency
rates for American shad at LD-1 were 18-61% over a three-year period, with higher rates
5
resulting from changes in lockage frequency, length of operating season, gate arrangement
and attractant flow. Additional telemetry studies from 2003 to 2004 (when 10 or more
individuals with transmitters reached LD-1) found passage rates were 26-33% for
American shad and 23-61% for striped bass (CZR 2004). Currently, the USACOE
conducts fish lockages at each dam three times per day, from March to June and once each
day throughout the remainder of the year, under normal flow conditions (R. Hall,
USACOE, personal communication). The procedure entails opening one side of the lower
gate of the lock for an extended period of time while valves within the upstream gate are
opened to create an attractant flow. The lower gate is then closed and the water level
inside the chamber is raised to that of the upstream pool. The upper gate is then opened to
allow fish to move upstream (Moser et. al. 2000; R. Hall, USACOE, personal
communication).
Although the findings of previous researchers on the Cape Fear River indicate
some upstream passage of American shad via the lock chambers, they also illustrate that
there remains a substantial proportion of fish that do not access upstream spawning areas.
That problem has prompted new discussion about ways to further improve anadromous
fish passage on the Cape Fear River. The goal of this research was to characterize the
current patterns of migration and spawning activity for American shad and striped bass in
the Cape Fear River and to examine the potential effect of the locks and dams on fish
passage and spawning distribution. Tracking the movements of these fish, along with
conducting egg and larval fish surveys, will help to identify areas of concentrated

6
spawning activity, uncover patterns and preferences in habitat characteristics, and further
assess the impact of the three dams on fish distribution. Ultimately, the new findings
provided by this study will serve to aid in present and future management decisions
regarding the recovery of this important resource.
Reproductive Biology
American shad
Male American shad reach sexual maturity between three and five years old, while
females mature between four and six years old (Leim 1924). Egg development in females
occurs between 13°C and 17°C, and increases in rate from 17°C to 20°C (Walburg and
Nichols 1967). Fecundity (58,000 to 660,000 eggs per female) is highly variable among
populations of American shad (Cheek 1968; Jones et al. 1978; Leggett and Carscadden
1978). Studies suggest fecundity is highest in populations along the southern U.S. Atlantic
coast and lowest among those in the northern range (Walburg and Nichols 1967). The
percentage of shad that undertake repeat spawning runs shows an opposite trend and
increases from south to north (Walburg and Nichols 1967; Leggett and Carscadden 1978).
Shad native to rivers north of latitude 35° are believed to experience lower post-spawn
mortality than those in rivers south of this latitude (Weiss-Glanz et al. 1986).
Spawning migration timing for American shad is heavily regulated by water
temperature. American shad occur in coastal rivers across a 4 to 25°C water temperature
range, with a peak around 18°C (McDonald 1884; Massmann and Pacheco1957; Leggett

7
and Whitney 1972). In the Neuse River, North Carolina, Beasley and Hightower (2000)
observed American shad migrating upstream when temperatures at the mouth of the river
were between 18.6 ºC and 19.0 ºC.
Variability exists between studies as to specific habitat requirements for American
shad spawning sites (Stier and Crance 1985, Ross et al. 1993). Depth at spawning
locations is highly variable, with a reported range between 0.45 m and 10.0 m (Mansueti
and Kolb 1953; Walburg 1957; Marcy 1972; Bilkovic 2000). American shad spawning in
the Neuse River predominantly occurred in depths less than 2 m (Beasley and Hightower
2000). Eggs have been collected at velocities ranging from 0.15 to 0.61 m/s (Marcy 1972;
Williams and Bruger 1972). Ross et al. (1993) found no correlation between spawning
activity and water velocity. However, Walburg (1960) concluded that sufficient current is
required to buoy eggs in the water column to maximize hatching success. Bowman and
Hightower (2001) and Hightower and Sparks (2003) found substrates dominated by
cobble at American shad spawning sites. However, Massmann (1952) reported high
concentrations of eggs over sandy bottoms free of mud and silt. Bilkovic (2000) asserted
that sediment size was not an important factor in determining habitat suitability.
Spawning typically occurs from sunset to approximately midnight (Massman
1952; Chittenden 1969) and often involves a single female and group of males. Spawning
is often characterized by splashing or “fighting” at the surface (Leim 1925). Eggs are
considered demersal and quickly become non-adhesive after release and begin to sink
once water-hardened (Chittenden 1969; Rulifson 1994). Drifting eggs have been found to

8
lodge in downstream substrate or travel several kilometers from the spawning grounds
(Chittenden 1969; Marcy 1972). Massmann (1952) suggested high current velocity and
water turbulence increase distance traveled by newly spawned eggs.
American shad eggs undergo rapid development during the first 48 hours after
fertilization (Jones et al. 1978 and references therein). Eggs typically hatch in two days
post-spawn at water temperatures of 12°C, but may take up to 17 days at temperatures of
27° C. Larvae drift downstream until they are free-swimming and begin to utilize fresh
and brackish water nursery habitat. Young-of-the-year American shad move into estuarine
habitats as they continue their seaward migration (Jones et al. 1978). Juvenile American
shad generally remain in riverine or estuarine areas until the fall of their first year, then
move offshore when temperatures fall below 15ºC (Walburg and Nichols 1967).
Striped bass
Male striped bass can mature as early as two years; however, both sexes typically
reach maturity between ages three and six (Setzler et al. 1980; Olsen and Rulifson 1992).
Lewis (1962) found virtually 100% maturity by age seven for fish collected from North
Carolina, Connecticut, and California. Striped bass are found to be highly migratory in
both saltwater and freshwater environments (Raney and Sylva 1953; Rulifson and
Dadswell 1995). For example, fish spawned in the Hudson River and tributaries of the
Chesapeake Bay will move northward along the coast in the spring, spend summer in
coastal waters of mid-Atlantic and New England states, and return south along the coast in
9
fall (Boreman and Lewis 1987; Dorazio et al. 1994). However, many southern populations
are different in that a large percentage of adults reside in the lower-river or estuary
throughout the winter as opposed to making coastal migrations (Raney 1952; Chapoton
and Sykes 1961; Rulifson et al. 1982).
Striped bass experience a similarly wide range of water temperatures (4 to 27°C)
as that of American shad during their spawning migration (Talbot 1966). Beasley and
Hightower (2000) found striped bass on the spawning grounds of the Neuse River, North
Carolina at temperatures between 13.9°C and 23.2°C. Spawning grounds for striped bass
are typically in shoal areas where boulder substrate and higher current velocities are
present (Raney 1952; Mansueti and Hollis 1963; Talbot 1966; Beasley and Hightower
2000). Bayless (1967) found higher egg survival when spawning occurred over large
substrate or when flow conditions kept eggs suspended in the water column.
Striped bass spawning is generally greatest in late afternoon and early evening
(Jones et al. 1978; Rulifson and Manooch 1990). Striped bass eggs are semi-buoyant and
rely on sufficient streamflow to prevent sinking and allow ample time for development
(Mansueti 1958). Egg development is dependent on water temperature and hatching
typically occurs within 29 to 48 hours after release (Jones et al. 1978 and references
therein; Setzler et al. 1980; Boreman 1983). Eggs progress through several stages of
development as they remain suspended in the water column and once larvae become free-
swimming juveniles they move into nearshore estuarine habitat to feed (Jones et al. 1978
and references therein; Boynton et al. 1981.) Most anadromous striped bass live in estuarine
10
waters for the first several years of life, then migrate to coastal waters to feed and overwinter
(Richards and Rago 1999).
Study Area
The Cape Fear River Basin is the largest watershed in North Carolina, with a total
drainage area of 23,310 km2, and contains 27% of the State's population (Mallin et al.
2008). The Cape Fear River flows south/southeast, approximately 320 km from the
confluence of the Deep and Haw rivers in Chatham County, North Carolina, to the
Atlantic Ocean, 40 km downstream of Wilmington, North Carolina (Walburg and Nichols
1967). Because of the open connection with the Atlantic Ocean, tidal effects are detectable
97 rkm upstream at the first lock and dam (Mallin et al. 2008). Channel morphology and
substrate types are distinct between the upper and lower portions of the river. Above the
fall line, substrates are dominated by coarse rocky material and exposed shoals are
common. In contrast, the lower river has relatively monotypic depth and substrates are
dominated by sand and fine material.
Swamp forests comprise most of the land surrounding the lower tidal portion of
the river (Mallin et al. 2008). Timber harvesting is an important industry in the watershed
due to the large amount of forested land. Crop agriculture is the single largest use category
and represents 22% of the land coverage. The remaining land coverage is comprised of
forest (38.7%), water (15.8%), urban (10.1%), grassland (9.1%), shrubland (3.7%) and
barren (0.3%) (USGS 2008). The Cape Fear is the most heavily industrialized basin in
11
North Carolina, with numerous industries utilizing the Cape Fear River in the upper
watershed and 11 major industrial dischargers in the tidal basin itself (Mallin et al. 2008).
Methods
Egg Sampling
Egg surveys were conducted twice a week from March 9 through May 31, 2007
and March 5 through June 4, 2008 at five locations (Figure 1). One sampling location was
established within 0.5 km downstream of each lock and dam (rkm 97, 149, and 186). All
lock and dam sites were sampled after sunset, with the exception of two samples in 2007.
A fourth site was established in the city of Fayetteville, approximately 3 km above the NC
24 Bridge (rkm 226). The fifth sampling station was located just east of the city of
Lillington in 2007, below a shoal at the NCWRC Wildlife Road access area (rkm 273).
However, low water levels resulted in poor sampling conditions at this site, so in 2008, the
location was moved 3 km upstream (rkm 276) to a site just upstream of the NC 401
bridge. Latitude and longitude for each site were determined using a Garmin Etrex Vista
handheld GPS unit and surrounding physical landmarks were noted for reference.
Depth at each site was measured using an Eagle model Cuda fishfinder.
Temperature and dissolved oxygen readings were taken using a YSI (Yellow Springs
Instrument) handheld multi-parameter water quality unit (moled 85). Plankton samples
were collected using a bongo style net consisting of two 0.3-m hoops with 500-µm mesh,
6:1 tail-to-mouth ratio nets, and solid cup cod ends. A weight was attached to the crossbar

12
of the frame in order to reach bottom. A General Oceanics Model 2030R flowmeter was
used to calculate the volume of water sampled during each collection effort. A 2.27-kg
weight was attached to the lower line of this unit to reach bottom. Once in position, both
rigs were slowly lowered off the stern of the vessel until the weights made contact with
the bottom. This would begin the 15-minute oblique tow, in which the instruments were
raised at consistent intervals to sample the entire water column evenly. The rope attached
to each instrument was marked in 0.3-m increments to ensure consistency between
retrievals. After 15 minutes, the net and the flowmeter were removed from the water.
The walls of the net were washed down into the solid cup ends and the contents of
the cups were then fixed with a 5-10% solution of formalin and labeled for processing.
Processed American shad eggs were categorized by developmental stage using criteria
provided by Jones et al. (1978). Stages were as follows: (1) first two hours of
development; (2) 4 to 6 hours; (3) around 20 hours; (4) around 38 hours; (5) 42 hours and
beyond. American shad larvae were collected during the study, but numbers were
insufficient for useful analyses. Relatively small numbers of non-target species eggs and
larvae were also collected, but were likewise not used in analysis.
In 2008, observations of American shad spawning activity were also noted during
egg sampling events. Presence of spawning activity was determined through auditory or
visual detection of the characteristic behavior of spawning American shad. The behavior,
often referred to as “fighting”, is characterized by one or more male American shad
moving along side a female American shad in a circular motion at the surface of the water

13
(Leim 1924; Ross et al. 1994; Bowman and Hightower 2001). Fish typically turn on their
sides and vibrate against one another during this motion, which creates an audible and
visual disturbance in the water.
Egg Data Analysis
Only American shad egg data were included in the statistical analysis due to the
extremely low numbers of striped bass eggs collected during the course of the study.
Stage-1 American shad egg densities (eggs/m3) were calculated for each sampling station
by dividing the number collected by the volume of water sampled. A nonlinear regression
equation was used to examine the relationship between the density of stage-1 American
shad eggs and sampling location. Least-squares parameter estimates were obtained using
the Solver function in Microsoft Excel.
Logistic regression using presence/absence of American shad eggs was used to
investigate factors affecting spawning activity. Due to the absence of eggs in samples
from sites upstream of the locks and dams, only data from the sample sites below each
lock and dam were included in the analyses. Sample times were assigned to hour (e.g.
20:00-20:59 = 20:00) to examine temporal differences in egg collections. Factors
evaluated using logistic regression were water temperature (C), dissolved oxygen (mg/L),
and streamflow (m3/s).
Multiple regression analysis was used to examine the effects of sample location,
sample time, and water temperature on American shad egg densities. Due to the
14
frequency of zero values and hence non-normally distributed data, a count of 0.5 was
added to the total number of eggs collected during each sample event. Egg density values
were then recalculated and loge transformed for analysis. Statistical significance for all
analyses was based on an alpha value of 0.05.
Tag Retention
The tracking objective of this project consisted of several phases, one of which
was to determine how American shad would react to the proposed tagging procedure. A
tag retention study was conducted in 2007 at the NCWRC‟s Watha Hatchery in Pender
County. NCWRC biologists collected 25 American shad on April 2, 2007 by boat
electrofishing below LD-1. The fish were transported to the facility in a 378 liter, round
live-well and placed into a large round indoor hatchery tank for recovery. On April 4,
2007 we implanted VEMCO V9-1L-R04K coded transmitters in ten of the fish, with the
remaining fish serving as controls. Tagged fish were netted from the tank, quickly
measured, assigned sex if possible, implanted with a transmitter, and returned to the tank.
Transmitters were 24 mm long, weighed 2.2 g in water, and were inserted into the gut
through the esophagus using a small length of clear tubing with glycerin lubricant. The
fish were held for a five-day observational period over which mortality and tag retention
were recorded.
15
Fish Collection and Tagging
Protocol for telemetry work conducted in 2008 differed from that used in 2007. In
2007, American shad were collected 24 April – 14 May and striped bass collections
occurred 13 April – 7 May. In 2007, American shad and striped bass were collected from
areas below the locks and dams, and then transported upstream of the locks and dams to
rkm 219 to be tagged and released. Fish were collected by NCWRC biologists by
electrofishing and were held in a round 378-liter onboard livewell, which included a
circulating system, and an airstone that was fed directly from a tank of 100% oxygen. The
first six striped bass collected were taken directly to the Pechmann Fishing Eduction
Center in Fayetteville to be held until they could be processed. All other fish were
transported directly from the collection location to the release point, just downstream of
the NC 24 Bridge (rkm 219). On several occasions, fish were moved from the NCWRC
livewell into a 378-liter plastic oval tank onboard a boat. This tank was equipped with a
circulation system, sprayer hose, and oxygen-fed airstone, and held the fish during
transport to the release site.
At the release site, live fish were measured (total length, TL, in mm), examined to
determine sex, tagged, and placed into an instream holding pen. The American shad were
implanted using the same type of VEMCO transmitter and method as discussed in the tag
retention section. Striped bass received a similar but larger (36 mm, 6 g in water) V13-1L-
R64k coded transmitter through surgical implantation, following the methods used by
16
Haeseker et al. (1996). Striped bass were placed into a tub of water prepared with Tricaine
Methanesulfonate [Finquel® (MS-222)] anesthetic to induce sedation. Each fish was then
placed ventral side up, into a foam-lined trough that stabilized the fish during surgery. The
trough was positioned atop a cooler of water prepared with a weak solution of MS-222.
Sedation and oxygen flow during surgery were maintained by re-circulating the solution
from the cooler into the oral cavity and across the gills. A small incision was made along
the centerline of the ventral body cavity wall posterior to the pelvic fins but anterior to the
vent, into which the transmitter was inserted. Gonads were also visible through the
incision and therefore sex could be verified. The incision was then sutured and antiseptic
ointment was applied to the wound. Fish were placed in a recovery tank or held by hand in
the river current until able to swim away under their own power.
To hold telemetered fish in 2007, I constructed a 1.5 m wide x 3.4 m long x 1.3 m
deep floating oval frame made of polyvinyl chloride (PVC) pipe, with custom 0.63-cm ace
knotless netting (Midlakes Corp., Knoxville, TN). The number of fish tagged on each
occasion varied depending on the number captured, so different combinations of tagged
and untagged fish were held in the pen to see if it affected the response of the tagged fish
upon release. Also, some fish were held in the pen for 24 hours prior to release while
some were released directly into the river. Holding times, pen arrangements (door open
vs. door closed), number of fish in the pen, and release (immediate vs. delayed) were
purposely varied among release events in order to see how these different approaches
affected tagged fish behavior after release.
17
The poor performance of telemetered fish in 2007 led us to abandon the trap and
transport method in 2008. All fish in 2008 were tagged and released at their capture sites.
In 2008, American shad were collected 13 March – 25 March and striped bass collections
took place 26 February – 21 April. Two striped bass were caught and released
downstream of lock and dam 2 (LD-2) ; all others were captured, tagged, and released
from locations downstream of LD-1 . All but one striped bass and eight of 20 American
shad were collected by NCWRC biologists by electrofishing. The remaining fish (12 of 20
American shad, one striped bass) were captured using hook and line. The single striped
bass was caught approximately 200 m downstream of LD-1 using a piece of fresh-cut
American shad. The first two American shad were caught within 75 m of the dam at LD-1
using shad darts on light-tackle spinning rods. Robin Hall (lockmaster at LD-1) advised
angling for American shad inside the lock chamber at LD-1. He had observed American
shad congregated near the upstream gate of the lock chamber, where attractant flow
generated by an open valve in the gate created a boil of water against the lock wall. With
his assistance, I captured the remaining 10 American shad in one short effort. The boat
was tied off inside the lock chamber and fish were processed on board. The same tag types
and implantation procedures used for both species in 2007 were used again in 2008.
Tracking
Monitoring fish movement after release was the final phase of the telemetry work.
All transmitters emitted a unique sequence at random time intervals that allowed for
18
individual identification. Time intervals between coded tag bursts were set at once every
30-60 seconds for American shad and 60-90 seconds for striped bass. I incorporated two
different methods of transmitter detection. One method included an array of six stationary
VEMCO VR2W receivers in 2007 and 10 receivers in 2008 (Figure 2). In 2007 one
receiver was deployed at I-295 bridge (rkm 231), NC 301 bridge (rkm 220), I-95 bridge
(rkm 212), and Lock and Dam 3 (LD-3) (rkm 186) on April 12 and at LD-2 (rkm 149) and
LD-1 (rkm 97). All receivers, except the one at the 301 bridge which was missing, were
removed from the river on June 12. In 2008, four additional receivers were added to the
2007 array. One of the four was the missing receiver from the end of the 2007 season
which had washed downstream but was recovered in 2008. The four new locations were
inside the lock chamber at LD-1, at rkm 246, the NC 217 bridge in Erwin, NC (rkm 261),
and at the NC 401 bridge in Lillington, NC (rkm 276).
Each stationary receiver was attached to a length of braided nylon rope with a
weight attached to the bottom and a large foam float tied to the top. This arrangement
allowed the receiver to be suspended in the water column in order to maximize reception
capability. A second length of rope was tied to a permanently fixed object in the river and
then attached to the weight to prevent the receiver from being swept downstream during
high flow events. These receivers operated continuously and automatically logged any
detection event. The unique tag identification number, date, and time were recorded for
each signal detected by the receiver.
19
Manual tracking was conducted by boat, using a portable VEMCO VR100
receiver equipped with either a VH165 omni-directional or VH110 directional
hydrophone. Relocation coordinates were logged using the receiver‟s internal GPS unit.
Date, time, depth, temperature, dissolved oxygen, and flow rate measurements were also
taken, along with a Petite Ponar sample to determine substrate. Streamflow and
precipitation data were obtained from the USGS at http://waterdata.usgs.gov/nwis/sw for
USGS site number 02105769 at LD-1.
Detection Probability
Estimates of detection probability were determined for most stationary receivers
using detection histories from 2007 and 2008. Separate probabilities were calculated for
American shad and striped bass in both years. Probabilities were calculated for a given
receiver (B), with a downstream receiver (A) and an upstream receiver (or manual
relocation point) (C) on either side. Detection probability for receiver B was estimated by
dividing the number of fish that passed from receiver A to C and were detected by
receiver B by the total number of fish that passed from receiver A to C. Separate estimates
were made for upstream and downstream movements. Logistic regression analysis was
performed to examine the effect of receiver station location and travel direction on
receiver detection for both species.

20
Receiver Detections and Relocations
Results from stationary receivers and manual tracking events were used to
characterize the migration of telemetered American shad and striped bass. Minimum
extent of upstream migration was established for each fish based on the furthest upstream
stationary receiver detection or manual relocation. Upstream passage efficiency through
the locks and dams was calculated for both species in 2008. Calculations were based on
the number of fish that could potentially be present downstream of a lock and dam divided
by the number of those fish detected by the receiver upstream of that lock and dam. For
striped bass, the potential number of fish present downstream of LD-1 was established by
confirmed detections on the receiver located inside the lock chamber of LD-1. This
estimate may slightly overestimate passage due to fish that may have returned to the dam
but were not detected by the chamber receiver. Due to the fact that American shad were
tagged and released prior to the deployment of the chamber receiver at LD-1, the potential
number present downstream of LD-1 was the total number of American shad tagged and
released during 2008. Therefore, the passage estimate obtained using this number may be
more conservative than that of striped bass. This also does not account for any handling
stress bias that may have influenced American shad migratory behavior.
Migration Rate Analysis
Upstream migration rates (km/hr) of 2007 and 2008 sonic-tagged American shad
and striped bass were determined using a calculation similar to one used by Katz (1986)

21
for American shad in the Connecticut River. Calculated migration ratess are relative to
water velocity and take into account the additive effect of water current speeds that fish
must overcome to achieve upstream movement. For example, a fish traveling upstream at
1 km/hr, in a current velocity of 1 km/hr has a migration rate of 2 km/hr. The equation for
upstream migrants was S = (D / T) + V, where D = distance in kilometers between two
stationary receivers, T = time in hours between the last detection a particular downstream
receiver (start rkm) and the first detection at the next upstream receiver (end rkm), and V
= water velocity in kilometers per hour. Ground speeds (S = D/T) are also given for
comparison with studies where water velocity was not taken into consideration for
migration rate calculations.
Water velocities (V) used for the migration rate calculations were determined
using the linear regression equation (y = 0.007x + 0.9772, R2 = 0.691), which assumes a
linear relationship between the independent (x) variable instream flow (m3/s) and the
dependent (y) variable water velocity (m/s) (Figure 3). The regression equation was
obtained using observed velocity values taken during egg sampling events and USGS
average instream flow values on those dates. The instream flow value used to calculate
migration rate for a particular fish‟s migration from one receiver to the next was the
median from all the USGS instream flow values observed between the starting and ending
dates. USGS instream flow data were available from three locations along the Cape Fear
River (rkm 97, 186, and 276). Flow values were chosen based on the location of the
receivers used to calculate a fish‟s distance traveled. Migration rates were also reported in
22
terms of fish body length per second (BL/s), which entailed converting the original
relative speed calculations from km/hr to cm/s and dividing that figure by fish total length
in cm.
One-way analysis of variance (ANOVA) and multiple regression were used to
examine relationships between migration rates and biological and spatial parameters.
Primary factors of interest were start rkm of the migration calculation and fish length.
Results
Egg Sampling
Average water temperature, dissolved oxygen level, and sample volume were
fairly similar among plankton sampling sites and between sampling seasons (Table 1).
Average sample depth was greater at sites below the locks and dams in both seasons.
Mean water temperature was about 1° in 2008 (Table 1). Streamflow at LD-1 ranged from
23 m3/s to 510 m
3/s, with an average of 163 m
3/s in 2007 and from 26 m
3/s to 700 m
3/s,
with an average of 134 m3/s in 2008 (Figure 4). Nineteen rain events, totaling 23.42 cm of
rainfall, occurred during the 2007 season, with five events resulting in accumulation
greater than 1.27 cm. Thirty-four rainfall events, totaling 26.47 cm, occurred during the
2008 season, with four events resulting in accumulation greater than 1.27 cm (Figure 4).
Average daily precipitation in 2007 was 0.25 cm, with a maximum accumulation of 9.70
23
cm on April 15, and 0.28 cm in 2008, with a maximum accumulation of 6.63 cm on April
5.
Egg Data-American Shad
A total of 586 American shad eggs were collected in 2007 and 728 in 2008 from
the five sampling locations (Table 2). Egg collection results for all samples are given in
Appendix A. The earliest American shad egg collected during the study came from below
LD- 2 on March 17, 2008, at a water temperature of 14.0°C. This collection came just
after the USACOE began their multiple daily locking procedures at each lock and dam.
The earliest date of collection at LD-1 was March 28, compared to April 12 for LD-3 and
April 22 for Fayetteville. The last date of collection at any site was May 30, 2008 at water
temperature 25.4°C. For both years combined, site LD-1 yielded 1083 eggs or
approximately 82% of the total number collected during the study, compared to 154 eggs
(12%) at LD-2, 72 (6%) from below LD-3, and 6 (0.003%) from the site near Fayetteville.
No eggs were collected from the Lillington site in either year. Stage 1 eggs (age 0-2 hrs)
made up 95% of total American shad eggs collected, with 4% found to be in stage 2
(Table 2).
Average density of American shad eggs was 122.4 (SD ± 229.1) eggs/1,000 m3
among sites in 2007 and 100.4 (± 185.3) eggs/1,000 m3 in 2008, with highest densities
collected at the LD-1 site in both years. Peak densities of stage-1 American shad eggs
collected from a single sample, 6161 eggs/1,000 m3
in 2007 and 4984 eggs/1,000 m3
in
24
2008, occurred below LD-1. In 2007 and in 2008, density declined at an exponential rate
moving upstream from the lowermost site at LD-1(Figures 5-6). Fitted curves from least
squares regression analysis indicate that egg density decreases by about 90% with each
additional lock and dam.
Water temperature was found to be highly correlated (p=0.0337) to
presence/absence of American shad eggs in samples. I did not detect a significant
relationship between streamflow (p=0.1730) or dissolved oxygen (p=0.5533) and
presence/absence of American shad eggs in samples, despite the fact that spawning
activity often appeared to increase as flow decreased following a spike in streamflow
(Figure 7-14). The linear and quadratic terms for temperature were significant, so the
final model for probability of egg absence (SAS Institute Inc. 2007) was
2)()((1
1
210 CtempCtempe
y
(Table 3, Figure 15). The model illustrated the non-linear relationship of water
temperature to the presence/absence of American shad eggs within samples. The
probability that at least one egg would be present peaked near 20°C, with probability
declining to approximately zero at water temperatures around 12 and 29°C.
Least squares regression modeling shows a significant effect of sample location (p
= 0.0065), sample time (p = 0.0021), and water temperature (p = <0.0001) on the density
(eggs/m3) of American shad eggs collected by plankton sampling (Table 4). The estimated
25
least square mean was highest below LD-1 and decreased for each upstream lock and dam
(Figure 16), although the decline was less dramatic than predicted from the simple
exponential model relating egg density to sampling location. Likewise, estimates indicate
samples taken between 20:00 and 21:00h produced highest densities of American shad
eggs. The model includes a significant linear effect of water temperature on egg density.
A quadratic term for water temperature was not significant for density, unlike the logistic
regression model for egg presence/absence.
Egg Data-Striped Bass
No striped bass eggs were collected during the 2007 season; however, similar
efforts yielded 41 eggs in 2008 (Table 5). The earliest collection of striped bass eggs
occurred on April 30 at LD-3, and one day later at both LD-2 and LD-1. The last
collection of striped bass eggs from any site occurred on May 15, 2008 at LD-1. In 2008,
all sites except the uppermost site in Lillington produced at least one egg. The majority
(29 eggs, 71%) of striped bass eggs were collected at LD-3. Only seven eggs (17%) were
collected at LD-1, four (10%) at LD-2, and one (2%) from the Fayetteville site. Average
density of eggs collected in 2008 was 45.9 (± 97.3) eggs/1000 m3, with highest densities
collected at LD-3. Sample sizes were small but a majority of striped bass eggs (56%) were
in the first stage of development, with all but two of the remaining eggs (39%) in the third
stage.
26
Spawning Observations
In 2008, American shad spawning activity was only observed at sampling sites
below the three locks and dams. Seventeen (65%) of the 26 observations of spawning
were made at LD-1, with 7 observations at LD-2 and 2 observations at LD-3. Spawning
activity was documented at LD-1 between 17 April 2008 and 4 June 2008, over a 17.1°C
to 26.1°C range of temperatures and 20:37 to 00:00 time range. Observations made at LD-
2 came between 21 April 2008 and 27 May 2008, over an 18.3°C to 23.4°C range of
temperatures and 20:40 to 23:09 time range. Only two observations were noted at LD-3 on
6 and 13 May 2008 at 20:35 and 21:45 respectively, with water temperatures around
21°C.
Tag Retention
The tag retention experiment in 2007 resulted in an 80% post-tagging survival rate for
tagged fish (Table 6). Three of the original 25 fish died in transit before the tagging
procedure and one fish died due to improper tag insertion (ruptured viscera), leaving 21
fish for the experiment. Only two of the 10 tagged fish died (one within 12 hours of tag
insertion and the other three days after tag insertion) and none of the 11 untagged fish
died.

27
Migratory Characteristics
Twenty American shad and 20 striped bass were tagged and tracked during each
year of the study. The group of American shad consisted of eight males (mean TL 440
mm) and 12 females (mean TL 503 mm) in 2007 and 19 males (mean TL 427 mm) and
one female at 505 mm TL in 2008 (Tables 7, 9). The striped bass group consisted of 16
males (mean TL 626 mm) and four females (mean TL 749 mm) in 2007 and 16 males
(mean TL 630 mm) and four females (mean TL 756 mm) in 2008 (Tables 8, 10).
In 2007, 18 American shad were relocated at some point in the study, based on
combined data from manual tracking and stationary receivers (Appendix B Figures 1-4).
Twelve (60%) American shad moved upstream of the release site and 6 (30%) moved
downstream. Three of the six fish moving downstream went below LD-3, and none of
those made secondary upstream movements. American shad 2428 was detected at LD-3
and made a secondary upstream movement, but it is unclear as to whether or not the fish
moved downstream over the dam and then back upstream. Three American shad moved
upstream of the uppermost receiver at rkm 231 based on manual relocations. One other
American shad was detected by this receiver, but there is insufficient evidence to suggest
that it moved upstream beyond that point. Unfortunately, manual tracking above rkm 231
was limited to three events (May 16, May 24, and June 7) due to logistics, time, and
access restraints. The uppermost relocation was at rkm 252, based on manual tracking
(Appendix B Figure 3).

28
Nineteen striped bass were relocated in 2007 and all fish immediately moved
downstream of the release site at rkm 219 (Appendix B Figures 5-8). Two striped bass
that initially moved downstream, within range of the receiver at LD-1, made secondary
movements upstream using the fish locking procedure (Appendix B Figure 6). Striped
bass 3276 (586-mm male) successfully locked through LD-2, while striped bass 3275
(589-mm male) passed back upstream of LD-2 and LD-3, and continued on past the
furthest upstream receiver located at rkm 231. Although these fish were not manually
detected below LD-1, I speculate that both fish fell below LD-1 and later locked through
LD-1 as they began their secondary upstream movement. This is based on the large gap in
time between detections at LD-1 in between downstream to upstream movements.
In 2008, 15 American shad and 16 striped bass, including two striped bass tagged
in 2007, were relocated by stationary receivers or by manual tracking efforts. Thirteen
American shad and 12 striped bass made movements upstream through at least one lock
and dam (Figure 17). Seven American shad and four striped bass migrated upstream
above LD-3 and all but two of these fish moved upstream to or beyond rkm 231 where
shoal habitat first becomes present in the river.
The maximum documented upstream migration was made by striped bass 3274, a
761-mm male from the 2007 group of tagged fish. The fish was found by manual tracking
on May, 7 2008 at rkm 299 just downstream of Buckhorn Dam (rkm 300), which
represents the end point for upstream migration. The maximum distance for American
shad was also recorded by manual tracking. American shad 10246, a 442-mm male, was
29
released on March, 25 2008 and detected at rkm 280 on May 7, 2008. Migration of each
fish released in 2008, as detected by stationary receivers and manual tracking, is
illustrated in Appendix C.
Passage Efficiency
Passage rates for American shad were 65% (13 of 20) through LD-1, 85% (11 of
13) through LD-2 and 64% (7 of 11) through LD-3. Striped bass passage results were
relatively similar, with 77% (10 of 13) through LD-1, 75 % (9 of 12) through LD-2, and
44% (4 of 9) through LD-3. Note that the number in striped bass available for passage at
LD-2 (12 fish rather than the 10 passing LD-1) was due to the collection and release of
two striped bass in 2008 downstream of LD-2. These fish were not counted in the
available pool of fish starting migration downstream of LD-1 but were subsequently
added in to those with potential to move upstream of LD-2.
Detection Probability
American shad detection probabilities were calculated for eight stationary
receivers for fish moving upstream and four stationary receivers for fish moving
downstream (Figure 18). Probabilities of detection were similar for upstream (60-100%)
and downstream (67-100%) moving fish. Upstream detection probability appeared lower
in the uppermost section of the river (rkms 246 and 261). Downstream detection
probability was 100% for all but one receiver (rkm 186, 2 of 3 fish detected) from which

30
data were available. Logistic regression analysis showed no significant effect of station
location (p = 0.4406) or travel direction (p = 0.6802) on detection probability of
American shad, although the analysis was based on very small sample sizes for all
receivers.
Striped bass detection probabilities were calculated for eight stationary receivers
for fish moving both upstream and downstream (Figure 19). Probabilities of detection
were similar for upstream (50-100%) and downstream (67-100%) moving fish. Upstream
detection probability was lower in the upper river section (rkms 231 and 246). Similar to
American shad results, downstream detection probability was 100% for all but one
receiver (rkm 231, 3 of 4 fish detected) from which data were available. In this case,
logistic regression analysis indicated a significant effect of station location (p = 0.0024)
and marginally insignificant effect of travel direction (p = 0.0708). As for American shad,
this analysis was based on small sample sizes at all receivers. A more intensive study,
using a greater number of tagged fish, would be needed to thoroughly evaluate detection
probability.
Migration Rate Analysis
Upstream ground speeds averaged 1.1 km/hr (range 0.08-4.3 km/hr) for American
shad and 1.3 km/hr (range 0.08-3.7 km/hr) for striped bass. Migration rates adjusted for
flow averaged 3.2 km/hr (range 1.4 - 6.4 km/hr) for American shad and 3.0 km/hr (range
1.3 - 5.5 km/hr) for striped bass. Migration rates, in terms of speed by body length (BL),
31
were also calculated using an adjustment for flow. American shad swam at a mean rate of
2.00 BL/s (range 0.7 - 4.1 BL/s), while striped bass averaged 1.3 BL/s (range 0.50 - 2.4
BL/s)
Migration rates appeared to be somewhat greater from rkm 186 (upstream of LD-
3) to rkm 212 for both species (Figures 20-21). However, ANOVA results showed no
significant effect of starting rkm (p = 0.1827) on migration rates of American shad.
Regression analysis also revealed no significant relationship between start rkm or fish
length and migration rate.
Similar ANOVA testing and regression analysis for striped bass indicated starting
rkm has a significant effect (p = 0.0118 and p = 0.0100) on migration rates. Analyses
indicated fish swam at higher speeds in the middle section of the river, upstream of LD-3
(Table 12). As with American shad, regression analysis revealed no significant correlation
between fish length and migration rate.
Discussion
Egg Sampling
The plankton sampling strategy used during this study proved to be more effective
for collecting American shad eggs than the approach used during a similar study on the
Cape Fear River in 2006 (Dial Cordy and Associates 2006). In both cases, samples were
taken downstream of the locks and dams, but my sampling was conducted during dusk
32
and evening hours, while those in the DCA study were taken during the day. The
increased success rate is consistent with findings in the literature that the timing of
spawning for American shad is concentrated around the early evening hours (Massman
1952; Walburg and Nichols 1967; Chittenden 1976; Ross et al. 1993). My analysis
showed samples taken between 20:00 and 21:00h were most likely to have higher
densities of American shad eggs. This finding is similar to that of Hightower and Sparks
(1998) who found higher numbers of eggs in samples around 21:00h. In addition, Ross et
al. (1993) found that American shad eggs were most numerous in samples taken between
20:00 and 24:00h on the Delaware River. The timing of sampling is particularly critical
for a site below an obstruction, because spawning fish are likely to be immediately
upstream of the sampling site.
Spawning Observations
Evening observations of American shad spawning made during the current study
further support previous findings on timing of spawning. Spawning activity was most
prevalent from mid-April to early-June, during the 20:00 to 24:00h time period, and at
temperatures between 17 and 26°C. These ranges of dates, times, and water temperatures
are similar to those of Bowman and Hightower (2001) for American shad in the Neuse
River, as well as Ross et al. (1993) for American shad in the Delaware River. Spawning
activity showed a similar pattern as that of egg density, with most observations occurring
at the site downstream of LD-1. Spawning activity on the Cape Fear River was typically

33
observed near the shoreline on both sides of the river. More extensive observations of
spawning activity would be required to determine whether this pattern is consistent at all
spawning locations along the river.
Spawning Distribution
American shad eggs were collected at a range of water temperatures consistent
with previous studies (Table 13) and very similar to the range of temperatures for
observed American shad spawning activity in the Neuse River (18-23.7°C; Beasley and
Hightower 2000). I found a significant relationship between water temperature and
density of American shad eggs. Streamflow and dissolved oxygen were not significantly
related to egg density, although this could be due to the fact that the observed values for
both parameters were consistently in the range of suitability for American shad spawning
(Stier and Crance 1985; Ross et. al. 1993).
Average densities of American shad eggs collected in my study (122.4
eggs/1,000m3 in 2007, 100.4 eggs/1,000m
3 in 2008) were lower than those reported in
other studies. Bilkovic et al. (2002) found higher densities of American shad eggs in two
tributaries to the York River. They sampled 8 - 15 sites using a combination of plankton
tows and push net samples from 1997 to 1999 and found an average of 591 eggs/1,000 m3
in the Mattaponi River and 337 eggs/1,000 m3
in the Pamunkey River. Smith (2006,
Appendices I-J) reported very high mean densities of American shad eggs in the Tar River
(11,000/1,000 m3 in 2004 and 2,400/1,000 m
3 in 2005). The high estimates may be due to
34
the variability in Tar River flows, resulting in spawning being concentrated in relatively
small volumes on some sampling occasions (R. Rulifson, East Carolina University,
personal communication).
The egg distribution pattern at upriver sites in the current study remained
consistent between years, despite the relocation of the uppermost sampling site in
Lillington. Over the entire study period, only six American shad eggs were collected
upstream of the locks and dams, all from one location at rkm 226. This finding is similar
to that of DCA in 2006 on the Cape Fear River where only one American shad egg was
collected upstream of the locks and dams at rkm 273 (Dial Cordy and Associates 2006).
Coupled with the decline in egg collections from LD-1 to LD-3, this suggests that access
to habitat above the locks and dams remains substantially limited.
The lack of eggs collected at upstream sites could be due in part to the inherent
differences between upriver sites and those downstream of the locks and dams. Lock and
dam sites tend to concentrate fish in one location, so samples taken below these
obstructions are more likely to contain newly spawned eggs if spawning occurs. Evidence
for this is seen in the fact that the vast majority (95%) of American shad eggs collected
downstream of the locks and dams were in the first stage of development. Samples at
upriver sites were not taken downstream of any barriers that may have concentrated fish
and were therefore likely to capture eggs drifting from random upstream spawning
locations. Such was the case on the Neuse River where American shad eggs were
collected at multiple sites after the removal of a low-head dam (Burdick and Hightower
35
2006). Many of those sites were not immediately downstream of obstructions or known
aggregates of fish and collections contained eggs at various stages of development.
Similarly, Marcy (1972) collected American shad eggs up to 6.4 km from where the fish
were assumed to spawn.
It is also possible (depending on streamflow and channel morphology) that
American shad eggs, drifting downstream from upriver spawning events, may have settled
out before reaching the upper basin sampling locations. Massmann (1952) suggested the
distance traveled by newly spawned American shad eggs is positively correlated to water
current and turbulence. The run-riffle-pool complex present in the upper portion of the
Cape Fear River produces a much different flow regime than that of the lower river.
During normal flow conditions, the upriver section contains more breaks in current
velocity where drifting eggs may have an opportunity to settle out. Such variation could
have limited downstream drift distance of eggs that were spawned upstream of my
sampling locations. The upper basin sites also have more diverse substrates including
gravel and cobble. This could have substantially limited downstream transport of eggs;
for example, Chittenden (1969) observed stripped American shad eggs lodging in large
substrates 1.5 to 1.8 m downstream of their release point.
Conducting day as opposed to night samples at upriver sites should not have
negatively affected egg collections since I was not sampling downstream of known
aggregates of fish. Many previous studies have resulted in successful collection of
American shad eggs in daytime plankton samples (Massman 1952; Marcy 1972; Hawkins

36
1980; Burdick and Hightower 2006). However, if night spawning did occur in close
proximity upstream of these sites, it is possible that drifting eggs may have passed by the
site before samples were taken.
No striped bass eggs were collected in 2007 but successful collections did occur in
2008. However the number collected is still relatively low when compared to most other
Atlantic drainages. For example, I collected an average of 0.32 eggs per 15-minute sample
whereas Rulifson in 1991 collected an average of 14.9 striped bass eggs per 5-minute
sample from two Roanoke River sites using a similar protocol (Rulifson 1992). My
average density (46 eggs/1,000 m3) was similar to estimates for the Neuse River (35-
61/1,000 m3, data from Burdick and Hightower 2006) but considerably less than for the
Tar (1,440-1,520/1,000 m3; Smith (2006) Mattaponi (2,053/1,000 m
3; Bilkovic et al.
2002), and Pamunkey 40,165 eggs/1,000m3; Bilkovic et al. 2002). The estimated density
of striped bass eggs in the lower Savannah River based on push-net sampling (2.65
eggs/1,000m3; Wallin et al. 1994) was lower than my estimate for the Cape Fear.
The high numbers of striped bass eggs collected by researchers in other Atlantic
drainages possibly reflect a positive response of striped bass to directed management
efforts enacted to boost declining populations all along the Atlantic coast (Richards and
Rago 1999; Bilkovic et al. 2002; Thomas 2002). However, based on current egg collection
efforts, the Cape Fear River striped bass population appears not to have experienced such
a positive response. Ashley and Rachels (2007) characterized the population of striped
37
bass in the Cape Fear as severely diminished and my findings still appear to reflect that
assessment.
One point of interest about the 2008 striped bass egg collections is that the peak in
the distribution of striped bass eggs appears to be below LD-3 unlike that of American
shad, which is at LD-1. Furthermore, a large portion (39%) of those eggs were in the third
stage of development, suggesting the presence of spawning upstream of LD-3. DCA saw
similar results in 2006, with 9 of 37 striped bass eggs collected from a site downstream of
LD-3 and 26 of 37 collected from a site approximately 22 rkm upstream of LD-3 (Dial
Cordy and Associates 2006). These findings bring up questions about whether striped
bass are selecting for spawning locations at or upstream of LD-3, or whether fish passage
using the locks is more effective for striped bass than for American shad. Further egg
collections are needed to determine if this trend is indicative of the distribution of striped
bass in the Cape Fear River.
Sampling Efficiency
Differences in egg densities between this and other studies could be related in part
to differences in sampling equipment. For example, some researchers have incorporated
the use of bow-mounted pushnets to sample American shad and striped bass eggs (Wallin
et al. 1994; Bilkovic et al. 2002). Their effectiveness relative to oblique tows would
depend on the distribution of eggs within the water column. Some of the discrepancy
between findings might also be related to overall population size. Systems containing
38
larger populations of spawning fish may inherently result in higher densities of eggs in
samples. An example of this scenario would be the larger population of striped bass
spawning in the Roanoke River system as compared to the Cape Fear River (Thomas
2002; Ashley and Rachels 2007).
Another potential factor is drainage size. A given run size (level of egg
production) would result in a higher density in a smaller system, although the low
streamflows often present in small systems could result in a quicker deposition of drifting
eggs. For example, the Little River in North Carolina (tributary to the Neuse) has a decent
run of American shad and river volumes are sometimes low due to variable flows, but
eggs are rarely collected due to the low flows and braided stream reaches (Burdick and
Hightower 2006;). Larger systems would result in a lower egg density for a given run size
but might be more likely to keep eggs suspended.
The inherent high water velocities often associated with high streamflows may
negatively affect sampling efforts. Such an effect was apparent during several of my
sampling events where high flows prevented sampling or pushed the plankton net toward
the surface, making it impossible to obtain a sample from the lower portion of the water
column. This problem could result in an underestimate of eggs for both species.
39
Telemetry
American shad and striped bass demonstrated very different reactions to trap and
transport activities in 2007. Many previous studies have shown that both American shad
and striped bass exhibit a strong “fallback” response (movement downstream after
release) to the handling stress of tagging procedures (Barry and Kynard 1986; Beasley and
Hightower 2000; Moser et al.2000; Bowman and Hightower 2001; Hightower and Sparks
2003). I found this response to be less intense in American shad than in striped bass. Only
9 (45%) American shad moved downstream after release; however, three fish later moved
back upstream for a total of 12 (60%) fish relocated at or upstream of the initial release
point. These results are in the range of those of Moser et al. (2000) who saw 39% - 95% of
telemetered American shad returning upstream to the lock and dam after an initial
downstream movement.
Striped bass, on the other hand, responded very poorly to stress, with all fish
making immediate downstream movements upon release. These findings are similar to
those of Carmichael et al. (1998) who saw substantial downriver movement of telemetered
striped bass in the Roanoke River. However, two striped bass made secondary movements
upstream and both fish made use of the locking procedure at more than one lock and dam.
This claim is based on the fact that water levels during the periods in which they moved
beyond the dams were insufficient to provide passage over the dam.
The changes in telemetry protocol in 2008 were based on the poor previous results
in 2007 and the findings of other investigators (Moser and Ross 1993; Carmichael et al.
40
1998; Bowman and Hightower 2001). The decision to abandon the trap and transport
approach was aimed at minimizing the handling stress fish would undergo prior to release.
Instead of trap and transport, fish in 2008 were captured, tagged and released at the same
location. To further improve fish response to tagging, an effort was made to collect fish
from areas at or downstream of LD-1, as early in the year as possible. Earlier collection
times provided cooler water temperatures and allowed for increased recovery time before
the spawning run. The cooler water temperatures earlier in the season may have allowed
fish to better handle the stress of capture and tagging.
Such an approach was used by Carmichael et al. (1998) in the Roanoke River.
They collected striped bass for the 1994 spawning season from the Albemarle and Croatan
sounds between December 1993 and March 1994. Their results show 25 of 41 striped bass
tagged with sonic transmitters and released prior to the spawning season entered the
Roanoke River. My decision to change protocol appeared to be correct based on the
number of fish that moved upstream after release and the number of fish that moved above
all three locks and dams. Limiting handling stress should be a goal of similar projects in
the future in order to improve post-release migration.
On a similar note, the use of hook and line to collect fish for tagging appeared to
lead to greater post-release movement upriver. Although I was largely unsuccessful in
obtaining striped bass using this method (one fish), it was particularly effective for
capturing American shad. Eleven of the 12 American shad collected on hook and line
made movements upstream of LD-1. Ten of the 12 hook and line captured American shad
41
were collected on the same day from inside the lock chamber at LD-1. These 10 fish were
released inside the chamber after tagging and all made movements upstream of LD-1. Ely
(2008) used hook and line to collect Alabama shad for a tagging study on the
Apalachicola River. This method was also incorporated by the Maryland Department of
Natural Resources as a low-cost and non-lethal way to collect broodfish for an American
shad aquaculture program (Minkinnen and Richards 1998). I recommend using this
method to collect all American shad in future studies to minimize handling stress and
maximize potential for upstream movement after release.
Detection Probability
Overall, detection probabilities were acceptably high at all receiver locations.
Differences in detection probability among receivers may be due to their positioning.
Receivers just upstream of the locks and dams were placed within 250 m of the upper
gate, on the same side of the river. Fish exiting the lock upstream would most likely be
immediately detected due to this positioning. Receivers in the upper portions of the river
may have been adversely affected by fluctuations in streamflow due to their position in
areas with higher variation in channel depth. This effect would be a factor if low flows
resulted in obstructions to detection (e.g. channel braiding, exposed boulders), or if high
flows pushed receivers into a horizontal position near or onto the bottom of the river.
Furthermore, increased channel width at one of my upstream sites (rkm 261) may have
adversely affected detection probability.
42
Migration
Prior to 1900, the extent of migration for American shad in Atlantic coastal
systems with substantial runs was 300 – 500 rkm (Stevenson 1899). However, the
construction of small low-head mill dams, locks and dams, and large hydroelectric dams
over the past century substantially limited the range of migration for fish in many of these
rivers (Walburg and Nichols 1967). The locks and dams present in the Cape Fear River
were constructed between 1913 and 1934; however they were not the first obstructions to
impede the spawning runs of the river‟s anadromous fishes.
By 1852, 11 locks and dams had been constructed between Fayetteville, North
Carolina (rkm 220) and the modern day site of Buckhorn Dam (rkm 300) to aid the
passage of company ships bound for the coal fields of the Deep River Coal Company
(Thompson 1852). This stretch of river includes the Smiley Falls area, which is considered
to be the historical spawning grounds for American shad in the Cape Fear River (Nichols
and Louder 1970). It also coincides with the natural shift in habitat that occurs in the river
around rkm 231. This shift is associated with the geologic and topographic transition zone
in North Carolina referred to as the “fall line” (Hack 1982). Much attention is given to the
impact of the current locks and dams on anadromous fishes; however it is likely that
migration has been affected by dams for a substantially longer period.
The upriver extension of the stationary receiver array in 2008 beyond rkm 231
allowed me to refine my manual searches in the upper river reaches, and thus more
43
effectively document the extent of migration of both species. The farthest upriver
migration by an American shad during the study, based on manual relocation, was 280
rkm. Similar telemetry work by CZR in 2003 on the Cape Fear River showed a maximum
American shad upstream migration of approximately 257 rkm (CZR 2004). I documented
a maximum upriver migration of 299 rkm for striped bass. This fish was manually
relocated less than one kilometer downstream of Buckhorn Dam, which represents the
maximum possible extent of upriver migration. CZR (2004) also manually relocated a
telemetered striped bass from their study just downstream of this barrier. Results from
both studies demonstrate successful migration upstream of LD-3 by some American shad
and striped bass.
These distances are similar to those traveled by anadromous species in other
systems to reach spawning grounds or before reaching man-made obstructions. In the
Roanoke River, the striped bass spawning grounds are 12 rkm downstream of a large
hydroelectric dam (Carmichael 1998). In the Neuse River, Beasley and Hightower (2000)
observed a maximum upstream migration of 224 rkm for American shad and 352 rkm for
striped bass prior to the removal of a low-head dam at rkm 225. Bowman and Hightower
documented migration extents of 241 rkm for American shad and 302 rkm for striped bass
in the two years after dam removal. American shad in the Savannah River travel 295 -300
rkm to spawn downstream of a lock and dam (Bailey et al. 2004). In comparison,
Chittenden (1976) observed American shad migrations of 430 rkm in the unobstructed
Delaware River.

44
Six American shad and three striped bass were detected at or upstream of the
receiver at rkm 231. This is the location where the habitat structure of the river begins to
shift from a monotypic depth, flow, and channel shape to a more complex structure of
shoals and pools. Five of the manually relocated American shad were found in shoal
areas. Although these were just point locations and do not provide enough information to
show patterns of selectivity, it does indicate that American shad move into areas with
distinctly different habitat characteristics than that of the lower river. Detections from
stationary receivers illustrate this movement in both species. Researchers in other coastal
rivers of North Carolina have observed anadromous fish migrating to upriver spawning
grounds where habitat structure is distinctly different than that of the lower river (Beasley
and Hightower 2000; Hightower and Sparks 2003). Further concentrated efforts are
needed to reveal any patterns in habitat selection in the Cape Fear River.
Migration Rate
Although the ranges of ground speeds for the two species were slightly higher than
those seen in other telemetry studies, the means were similar. Katz (1986) calculated
apparent (not adjusted for flow) speeds for American shad in the Connecticut River and
found a mean of 1.6 km/h (range 0.4-2.4 km/h). Similarly, Hightower and Sparks (2003)
calculated mean migration rate of migrating American shad in the Roanoke River at 0.99
km/h. Beasley and Hightower (2000) estimated migration rates ranging from 0.29 km/h to
1.5 km/h in 1996 and 0.23 km/h to 2.3 km/h in 1997 for sonic-tagged striped bass in the
45
Neuse River. Similarly, Kynard (1987) found striped bass migrating up the Connecticut
River at a mean rate of 0.7 km/h (range 0.3 – 1.2 km/h); while Wingate and Secor (2007)
saw Hudson River striped bass moving at a mean rate of 0.6 km/h (range 0.06 – 2.6 km/h).
Estimated migration rates in this study were obviously higher than the ground
speeds because they adjusted for the velocity of the water. These adjustments were based
on oblique measurements of current velocities at plankton sampling sites. They may
overestimate migration rates if upstream-migrating fish are close to the shore or bottom
where velocities would be lower. I could not find studies that reported ranges of migration
rates for either species that were calculated using this adjustment. Speeds relative to flow
seem more logical and appropriate for fish movement and therefore I chose to report them
as such.
The significant difference of American shad and striped bass migration rates
between receiver locations is possibly a function of the physical differences of the Cape
Fear River itself. The slower speeds through the lower portion of the river are most likely
linked to the presence of the locks and dams. Migrating fish would almost certainly
experience a delay unless arrival at a particular lock and dam coincided with times when
locking procedures for fish passage were occurring. Slower speeds found in the upper
portions of the river may be due to the presence of shoal habitat. These areas may
concentrate fish in a similar fashion as the locks and dams. Some fish may continue to
move through these sections, while others may delay migration and use these areas for
spawning. The faster migration rates in the middle portion of the river (rkm 187-230)
46
could be due to the absence of obstructions and hypothesized lack of suitable spawning
habitat. Fish may be more likely to move through these areas of monotypic depth,
substrate, and channel morphology, in route to upriver habitat where fish may be
concentrated.
Leonard et al. (1999) conducted respirometer experiments and found that
American shad migration efficiency, in terms of metabolic rate regulation, was greater at
high aerobic migration rates. They swam American shad in a large respirometer at a rate
of 1.0 - 2.3 body lengths (BL) s and found that metabolic rates were intermediate between
salmonids and fast-swimming perciforms (including tunas) and may be a result of
evolutionary adaptation to their active pelagic schooling life history (Leonard et al. 1999).
This experimental rate is consistent with the average migration rate (2.0 BL/s) of upriver
migrating American shad in my study.
Passage
One of the main approaches used to restore runs of anadromous fishes is to
provide access to upriver habitats using fish passage. Methods range from straightforward
approaches, such as complete dam removal, to more complex operations like the
construction of fishways and fish lifts (Weaver et al. 2003; Sprankle 2005; Burdick and
Hightower 2006). The current approach on the Cape Fear River entails using the chambers
at each lock and dam to move fish from the lower to upper pool. My data show successful
upstream passage of both species through the use of this method.

47
Passage rates through LD-1 and LD-2 were relatively similar between species;
however, American shad showed higher passage rates through LD-3 than striped bass.
This could indicate a problem with striped bass passage at LD-3, but might also be linked
to the fact that the majority of striped bass eggs were collected from the LD-3 site. Striped
bass might forgo migration beyond LD-3 if this section of the river is suitable for
spawning. Further investigations are required to better understand this potential link.
The passage rates can be used to estimate the fraction of the spawning population
that would be present below each lock and dam and above the three dams. For example,
passage estimates for American shad (65, 85, and 64%) suggest that 35% ((1-0.65)*100)
of fish would remain below LD-1, 10% (0.65*(1-0.85)*100) would be between LD-1 and
LD-2, 20% (0.65*0.85*(1-0.64)*100) would be between LD-2 and LD-3, with the
remainder (35%) above LD-3. For striped bass, the predicted distribution is 23% below
LD-1, 19% between LD-1 and LD-2, 32% between LD-2 and LD-3, with the remainder
(25%) above LD-3. These predicted distributions shares some characteristics with the
distributions of collected eggs although both overestimate the proportion of eggs that
would be collected above LD-3 (Figure 22). As discussed above, the low percentages of
eggs collected from the upper river may be due to sampling inefficiencies.
Overall, passage rates of American shad and striped bass through locks and dams
on the Cape Fear River were higher than those seen by other researchers looking at
anadromous fish passage. Moser et al. (2000) used sonic telemetry and found rates of
passage of American shad at LD-1 on the Cape Fear River to be 38% in 1996, 18% in

48
1997, and 61% in 1998. Also in 1998, they calculated the passage rate of American shad
through LD-2 at 33%. As in my study, these rates of passage were based on fish that
remained or returned to the dam after tagging and had potential for passage (N=16 in
1996, N=11 in 1997 and N=36 (LD-1) N=15 (LD-2) in 1998). It is also important to point
out that my estimates of passage occurred a decade after the changes in locking
procedures aimed at improving fish passage were initiated during the study by Moser et al.
(2000). CZR Inc. also used this method for reporting passage rates of both species on the
Cape Fear River. They found rates for American shad of 50% in 2002 (N=8), 33% in 2003
(N=12), and 25% in 2004 (N=40); and for striped bass at 0% in 2002 (N=2), 23% in 2003
(N=22), and 61% in 2004 (N=46). In comparison, Bailey et al. (2004) used radio
telemetry observations and found rates of passage for American shad returning to New
Savannah Bluff Lock and Dam on the Savannah River to be 50% in 2001 and 9% in 2002
(N=30 in 2001 and N=12 in 2002).
The additional receiver placed inside the lock chamber at LD-1 provided
interesting data on fish passage. Particularly, three striped bass were detected by the
receiver inside the chamber at LD-1 but failed to utilize the lock to move upstream. This is
despite the fact that they were detected during times of the day when locking procedures
would have been conducted. Similarly, Moser et al. (2000) saw American shad enter the
lock chamber at LD-1 on the Cape Fear River but fail to pass upstream. Future
investigation should incorporate the use of a receiver inside the chamber at each lock and
dam to further understand passage of fish via the locks.
49
Future Directions
Despite low sample sizes and variability in egg sampling there are some
encouraging similarities in results from egg sampling and telemetry. For American shad,
the section of the river below LD-1 had the highest egg collections and a tie for the
predicted proportion of the run (35%, tied with the upper river). For striped bass, the
section below LD-3 had the highest egg collections and highest predicted proportion of
the run. Egg collections were lower than expected from the upper river. This is likely due
to the fact that lock and dam sites provide sampling of aggregates of fish during peak
spawning times and upriver sites do not. Further directed efforts will need to be
undertaken in order to better evaluate these differences and provide a more accurate
characterization of spawning distribution of anadromous fishes in the Cape Fear River. A
possible direction for future research could be more intensive diel tracking of tagged fish
to locate potential upriver spawning areas. These locations could then be sampled during
the evening hours when spawning activity is more likely to take place. This approach
would be logistically challenging due to limited access of the upper sections of the Cape
Fear River.
It would also be valuable to estimate the size of the American shad spawning
population present in the Cape Fear River. Such estimates have been obtained in other
systems through mark-recapture (American shad, Bailey et al. 2004). An estimate for the
Cape Fear population, coupled with information about egg densities and passage rates,

50
could provide a much clearer picture of the impact of the locks and dams on anadromous
fish migrations. Further investigations are needed if these questions are to be sufficiently
answered.

51
Literature Cited
Ashley, K. W., and R. T. Rachels. 2007. Cape Fear River striped bass spawning stock
survey, 2007. Final Report, Coastal Fisheries Investigations, Federal Aid in Fish
Restoration Project F-22, Raleigh.
ASMFC. 2007. American shad stock assessment report for peer review Vol. III. Stock
assessment report No. 07-01 (Supplement) of the Atlantic States Marine Fisheries
Commission.
Bailey, M. M., J. J. Isley and W. C. Bridges Jr. 2004. Movement and population size of
American shad near a low-head lock and dam. Transactions of the American
Fisheries Society 133:300–308.
Barry, T., and B. E. Kynard. 1986. Attraction of adult American shad to fish lifts at
Holyoke Dam, Connecticut River. North American Journal of Fisheries
Management 6:233–241.
Bayless, J. D., 1967. Striped bass hatching and hybridization experiments. Proceedings of
the Southeastern Association of Fish and Wildlife Agencies 21: 233-244
Beasley, C.A. and J.E. Hightower. 2000. Effects of a low-head dam on the distribution
and
characteristics of spawning habitat used by striped bass and American shad.
Transactions of the American Fisheries Society 129:1372-1386.
Bilkovic, D. M., J. E. Olney and C. H. Hershner. 2002. Spawning of American shad
(Alosa sapidissima) and striped bass (Morone saxatilis) in the Mattaponi and
Pamunkey Rivers, Virginia. Fisheries Bulletin. 100:632–640.
Boreman, J., 1983. Simulation of striped bass egg and larva development based on
temperature. Transactions of the American Fisheries Society 112: 286-292.
Boreman, J., and R. R. Lewis. 1987. Atlantic coastal migration of striped bass. American
Fisheries Society Symposium 1:331-339.
Born, S. M., K. D. Genskow, T. L. Filbert, N. Hernandez-Mora, M. Keefer, and K. White,
1998. Socioeconomic and institutional dimensions of dam removals: the
Wisconsin experience. Environmental Management 22: 359-370.
52
Bowman, S., and J. E. Hightower. 2001. American shad and striped bass spawning
migration and habitat selection in the Neuse River, North Carolina. Master‟s
Thesis, North Carolina State University, Raleigh.
Boynton, W. R., T. T. Polgar, and H. H. Zion. 1981. Importance of juvenile striped bass
food habits in the Potomac Estuary.Transactions of the American Fisheries Society
110:56-63.
Burdick, S.M. and J.E. Hightower. 2006. Distribution of spawning activity by anadromous
fishes in an Atlantic slope drainage after removal of a low-head dam. Transactions
of the American Fisheries Society 135:1290–1300.
Carmichael, J. T., S. L. Haeseker, and J. E. Hightower. 1998. Spawning migration of
telemetered striped bass in the Roanoke River, North Carolina. Transactions of the
American Fisheries Society, 127: 286-297.
Chittenden, M. E., 1969. Life history and ecology of the American shad, Alosa
sapidissima, in the Delaware River. Ph.D. Dissertation, Rutgers University,
NewBrunswick, New Jersey.
Chittenden, M. E, Jr. 1976. Present and historical spawning grounds and nurseries of
American shad, Alosa sapidissima, in the Delaware River. United States National
Marine Fisheries Service Fishery Bulletin 74:343-352.
Cobb, J. N. 1906. Investigations relative to the shad fisheries of North Carolina. The
North Carolina Geological Survey, Economic Paper 12, Raleigh.
Collier, R.S and M.C. Odum. 1989. Obstructions to anadromous fish migration. U.S. Fish
and Wildlife Service. Project Number 88-12.
CZR Incorporated. 2003. Pre-construction monitoring of American shad, Atlantic
sturgeon, and striped bass passage at Lock and Dam 1 on the Cape Fear River,
North Carolina. Report to U. S. Army Corps of Engineers, Contract DACW 54-
97-D-0028, Wilmington.
CZR Incorporated. 2004. Pre-construction monitoring of American shad and striped bass
passage at Lock and Dam 1 on the Cape Fear River, North Carolina. Report to U.
S. Army Corps of Engineers, Contract GS-10F-0043P, Wilmington.
53
Davis, J.R. and R.P. Cheek. 1966. Distribution, food habits, and growth of young
clupeids,
Cape Fear River system, North Carolina. Proceedings of the Annual Conference of
the Southeastern Association of the Game and Fish Commission 20:250-260.
Dial Cordy and Associates. 2006. Cape Fear River anadromous fish egg and larval survey.
Draft Report to U. S. Army Corps of Engineers, Contract W912HN-05-D-0014,
Wilmington, NC.
Dorazio, R. M., K. A. Hattala, C. B. McCollough, and J. E. Skjeveland. 1994. Tag
recovery estimates of migration of striped bass from spawning areas of the
Chesapeake Bay. Transactions of the American Fisheries Society123:950-963
Ely, P. C., S. P. Young and J. J. Isley. 2008. Population size and relative abundance of
adult Alabama shad reaching Jim Woodruff Lock and Dam, Apalachicola River,
Florida. North American Journal of Fisheries Management 28:827–831.
Fischer, C. A. 1980. Anadromous fisheries research program Cape Fear River system
phase II. North Carolina Department of Natural Resources and Community
Development Division of Marine Services, Completion Report for Project AFCS-
15.
Hack, J. T. 1982. Physiographic divisions and differential uplift in the Piedmont and Blue
ridge: U. S. Geological Survey Professional Paper 1265, 49 p.
Hart, D. D., T. E. Johnson, K. L. Bushaw-Newton, R. J. Horwitz, A. T. Bednarek, D. F.
Charles, D. A. Kreeger, and D. J. Velinsky, 2002. Dam removal: challenges and
opportunities for ecological research and river restoration. BioScience 52: 669-
681.
Hawkins, J. H., 1980. Investigations of anadromous fishes of the Neuse River, North
Carolina. North Carolina Department of Natural Resources and Community
Development, Morehead City, North Carolina.
Haeseker S. L., J. T. Carmichael, and J. E. Hightower. 1996. Summer distribution and
condition of striped bass within Albemarle Sound, North Carolina. Transactions of
the American Fisheries Society. 125:690–704.
54
Hightower, J. E., and K. L. Sparks. 2003. Migration and spawning habitat of American
shad in the Roanoke River, North Carolina. Pages 193-199 in K. E. Limburg and J.
R. Waldman, editors, Biodiversity, status, and conservation of the world's shads.
American Fisheries Society Symposium 35, Bethesda, Maryland.
Jones, P. W., F. D. Martin, and J. D. Hardy. 1978. Development of fishes of the Mid-
Atlantic Bight, volumes 1–3. Biological Services Program, Solomons, Maryland.
Katz, H. M. 1986. Migrational swimming speeds of the American shad, Alosa
sapidissima, in the Connecticut River, Massachusetts, U.S.A. Journal of Fish
Biology. 29: 189-197.
Klauda, R. J., S. A. Fischer, L. W. Hall, Jr., and J. A. Sullivan. 1991. American shad and
hickory shad. Pages 9-1 to 9-27 in S. L. Funderburk, J. A. Mihursky, S. J. Jordan,
and D. Riley, editors. Habitat requirements for Chesapeake Bay living resources.
Chesapeake Bay Program, Annapolis, Maryland.
Kynard, B. 1987. Spring and summer movements of subadult striped bass, Morone
saxatilis, in the Connecticut River. Fishery Bulletin 85: 143-146.
Leggett, W. C. and J. F. Carscadden. 1978. Latitudinal variation in the reproductive
characteristics of American Shad Alosa sapidissima: evidence for population
specific life history strategies in fish. Journal of the Fisheries Research Board of
Canada. 35, 1469-1478.
Leggett, W. C., R. R. Whitney. 1972. Water temperature and the migrations of American
shad. United States National Marine Fisheries Service Fisheries Bulletin. 70: 659-
670.
Leim, A. H., 1924. The life history of the shad, Alosa sapidissima (Wilson), with special
reference to the factors limiting its abundance. Canadian Biology and Fisheries
2:163-284.
Leonard, J. B. K., J. F. Norieka, B. Kynard and S. D. McCormick. 1999. Metabolic rates
in an anadromous clupeid, the American shad (Alosa sapidissima). Journal of
Comparative Physiology and Biology 169: 287-295
Lewis, R. M. 1962. Sexual maturity as determined from ovum diameters in striped bass
from North Carolina. Transactions of the American Fisheries Society 91:279-282.
55
Mallin, M. A., M. R. McIver and J. F. Merritt. 2008. Environmental Assessment of the
Lower Cape Fear River System, 2007. CMS Report No. 08-03 Center for Marine
Science University of North Carolina, Wilmington.
Mansueti, R.J. 1958. Eggs, larvae and young of the striped bass, Roccus saxatilis.
University of Maryland, Chesapeake Biological Laboratory Contributions 112.
Mansueti, R. J., and E. H. Hollis, 1963. Striped bass in Maryland tidewater. Maryland
Department of Natural Resources, Solomons, Maryland.
Marcy, B. C., 1972. Spawning of the American shad, Alosa sapidissima, in the lower
Connecticut River. Chesapeake Science 13: 116-119.
Massman, W. H. 1952. Characteristics of spawning areas of shad, Alosa sapidissima
(Wilson), in some Virginia streams. Transactions of the American Fisheries
Society 81:78-93.
Massman, W. H., A. L. Pacheco. 1957. Shad catches and water temperatures in Virginia.
Journal of Wildlife Management 21: 351-352.
McDonald, M.1884. The shad and alewives. United States Commission of Fisheries, 52
Washington D. C.
McDonald, M. 1887. The rivers and sounds of North Carolina. Pages 625-637 in Goode,
G. B. The Fisheries and Fisheries Industry of the United States. Section V. History
and methods of the fisheries. Volume I. United States Commission of Fish and
Fisheries. Government Printing Office, Washington, D.C.
Minkkinen, S. P., B. M. Richardson. 1998. American shad (Alosa sapidissima) culture.
Aquaculture „98 Book of Abstracts. 369.
Moser, M. L., A. M. Darazsdi, and J. R. Hall. 2000. Improving passage efficiency of adult
American shad at low-elevation dams with navigation locks. North American
Journal of Fisheries Management 20:376-385.
Moser, M. L. and S.W. Ross. 1995. Habitat use and movements of shortnose and Atlantic
sturgeons in the lower Cape Fear River, North Carolina. Transactions of the
American Fisheries Society 24:225-234.
56
Moser, M.L., and S.W. Ross. 1993. Distribution and movements of shortnose sturgeon
(Acipenser brevirostrum) and other anadromous fishes in the lower Cape Fear
River, NC. Final Report to the U.S. Army Corps of Engineers, Wilmington
District, Wilmington, NC.
NCDCR. 2008. North Carolina highway historical marker program. North Carolina
Department of Cultural Resources. Available:
http://www.ncmarkers.com/Markers.aspx?ct=ddl&sp=search&k=Markers&sv=H-
42%20-%20SMILEY'S%20FALLS. (June 2009).
NCDMF. 2008. Stock status, striped bass. North Carolina Division of Marine Fisheries.
http://www.ncfisheries.net/stocks/stribass.htm.
NCWRC 2008. Inland fishing regulations and information.
http://www.ncwildlife.org/pg02_Regs/2008_09_Inland_Regs.pdf
Nichols, P. R., and D. E. Louder. 1970. Upstream passage of anadromous fish through
navigation locks and use of the stream for nursery and spawning habitat, Cape
Fear River, North Carolina, 1962–1966. U.S. Fish and Wildlife Service, Circular
352.
Olney, J.E, J.D. Field, and J.C. McGovern. 1991. Striped bass egg mortality, production,
and female biomass in Virginia rivers, 1980-1989. Transactions of the American
Fisheries Society 120:354-367.
Patrick, W.S. 2006. Evaluation and mapping of Atlantic and Gulf Coast terminal dams: a
tool to assist recovery and rebuilding of diadromous fish populations. National
Oceanic and Atmospheric Administration, Draft Report.
Patrick, W. S., and M. L. Moser. 2001. Potential competition between hybrid striped bass
(Morone saxatilis x M. americana) and striped bass (M. saxatilis) in the Cape Fear
River estuary, North Carolina. Estuaries 24:425-429.
Poff, N. L., and D. D. Hart. 2002. How dams vary and why it matters for the emerging
science of dam removal. BioScience 52: 659-668.
Raney, E.C. 1952. The life history of the striped bass, Roccus saxatilis (Walbaum).
Bulletin. Bingham Oceanography Collection, Yale University 14: 5-97.
Raney, E. C., and D. P. Sylva, 1953. Racial investigations of striped bass, Roccus
saxatilis. Journal of Wildlife Management 17: 495-507.
57
Richards, R. A., and P. J. Rago, 1999. A case history of effective fishery management:
Chesapeake Bay striped bass. North American Journal of Fisheries Management
19: 356-375.
Ross, R. M., T. W. H. Backman, and R. M. Bennett. 1993. Evaluation of habitat
suitability index models for riverine life stages of American shad, with proposed
models for premigratory juveniles. U. S. Fish and Wildlife Service Biological
Report 14.
Rulifson, R. A. 1992. Striped bass egg abundance and viability at Scotland Neck,
Roanoke River, North Carolina, for 1991. East Carolina University, Greenville,
North Carolina.
Rulifson, R.A. 1994. Status of anadromous Alosa along the east coast of North America.
Tidewater Chapter, American Fisheries Society, Anadromous Alosa Symposium.
Rulifson, R. A., and M. J. Dadswell, 1995. Life history and population characteristics of
striped bass in Atlantic Canada. Transactions of the American Fisheries Society
124: 477-507.
Rulifson, R. A., and C. S. Manooch, 1990. Roanoke River water flow committee report
for 1990. National Oceanic and Atmospheric Administration. Beaufort, North
Carolina, 28516-97222
Rulifson, R. A., and K. A. Tull, 1999. Striped bass spawning in a tidal bore river: the
Shubenacadie estuary, Atlantic Canada. Transactions of the American Fisheries
Society 128: 613-624.
SAS Institute Inc. 2007. JMP® User's Guide. Cary, North Carolina: SAS Institute Inc
Setzler, E. M., W. R. Boynton, K. V. Wood, H. Zion, L. Lubbers, N. Mountford, P. Frere,
L. Tucker, and J. Mihursky, 1980. Synopsis of biological data on striped bass,
Morone saxatilis (Walbaum). National Oceanic and Atmospheric Administration
and National Marine Fisheries Service.
Shuman, John R., 1995. Environmental considerations for assessing dam removal
alternatives for river restoration. Regulated Rivers 11: 249-261.
58
Smith, L. W., E. Dittmer, M. Prevost, and D. Burt, 2000. Breaching of a small irrigation
dam in Oregon: a case history. North American Journal of Fisheries Management
20: 205-219.
Smith, M. C., and R. A. Rulifson. 2006. Habitat use of early Alosa spp. and striped bass
Morone saxatilis in the lower Tar River, North Carolina. Master‟s Thesis, East
Carolina University, Greeneville, North Carolina.
Sprankle, K. 2005. Interdam movements and passage attraction of American shad in the
lower Merrimack River main stem. North American Journal of Fisheries
Management 25: 1456–1466.
Stevenson, C.H. 1899. The shad fisheries of the Atlantic coast of the United States. In
G.M. Gowers. Report of the U.S. Commission of Fish and Fisheries, part 24. U.S.
Commission of Fish and Fisheries, Washington, D.C.
Stier, D.J., and J.H. Crance. 1985. Habitat suitability index models and instream flow
suitability curves: American shad. U.S. Fish and Wildlife Service Biological
Report. 82(10.88).
Talbot, G. B. 1966. Estuarine environmental requirements and limiting factors for striped
bass. Transactions of the American Fisheries Society 95: 37-49.
Thomas, C. D. 2002. Assessment of the striped bass spawning stock in Roanoke River,
North Carolina, 2002. North Carolina Wildlife Resources Commission Final
Report, Project F-22, Raleigh.
Thompson, W. B. 1852. Map of the Cape Fear and Deep Rivers from Fayetteville to
Hancock‟s Mill showing the position of the several locks and dams and canals
upon the line of the company‟s works (drawn by Thomas F. O‟Brien). Map on file
at the North Carolina Archives, Raleigh.
USGS (U.S. Geological Survey). 2007. Surface water data for the nation. USGS.
Available: http://waterdata.usgs.gov/nwis/sw. (March-June 2007).
USGS (U.S. Geological Survey). 2008. EDNA derived watersheds for major named
rivers. USGS. Available: http://edna.usgs.gov/watersheds/ws_chars.php. (October
8, 2008).
59
Walburg, C. H., and P. R. Nichols. 1967. Biology and management of the American shad
and status of the fisheries. Atlantic Coast of the United States. 1960. United States
Fish and Wildlife Service. Special Scientific Report - Fisheries No. 550.
Wallin, J., T. Reinert, and M. J. Van Den Avyle. 1994. Abundance and distribution of
striped bass eggs and larvae in the Savannah River Estuary - Implications for
channel dredging window, 1 March 1994 – 30 September 1994. Annual Report,
U.S. Army Corps of Engineers Savannah District, Savannah, Georgia. 87 pp.
Weaver, L. A., M. T. Fisher, B. T. Bosher, M. L. Claud, and L. J. Koth. 2003. Boshers
Dam vertical slot fishway: a useful tool to evaluate American shad recovery efforts
in the upper James River. Pages 339–348 in K. E. Limburg and J. R. Waldman,
editors. Biodiversity, status, and conservation of the world‟s shads. American
Fisheries Society, Symposium 35, Bethesda, Maryland.
Weiss-Glanz, L. S., J. G. Stanley, J. R. Moring, and D. Moran. 1986. Species profiles:
Life histories and environmental requirements of coastal fishes and invertebrates
(North Atlantic). United States Fish and Wildlife Service National Wetlands
Research Center, Biological Report 82.
Wingate, R. L., and D. H. Secor. 2007. Intercept telemetry of the Hudson River striped
bass resident contingent: migration and homing patterns. Transactions of the
American Fisheries Society 136:95–104.
Winslow, S. E. 1994. American shad fisheries of North Carolina with emphasis on the
Albemarle Sound area. Pages 72–80 in J. E. Cooper, R. T. Eades, R.J. Klauda, and
J. G. Loesch, editors. Anadromous Alosa symposium. American Fisheries Society,
Tidewater Chapter, Bethesda, Maryland.
Winslow, S. E., N. S. Sanderlin, G. W. Judy, J. H. Hawkins, B. F. Holland, Jr., C. A.
Fischer, and R. A. Rulifson. 1983. North Carolina anadromous fisheries
management program. North Carolina Department of Natural Resources and
Community Development, Division of Marine Fisheries, Anadromous Fish
Conservation Act, Completion Report AFCS-16.
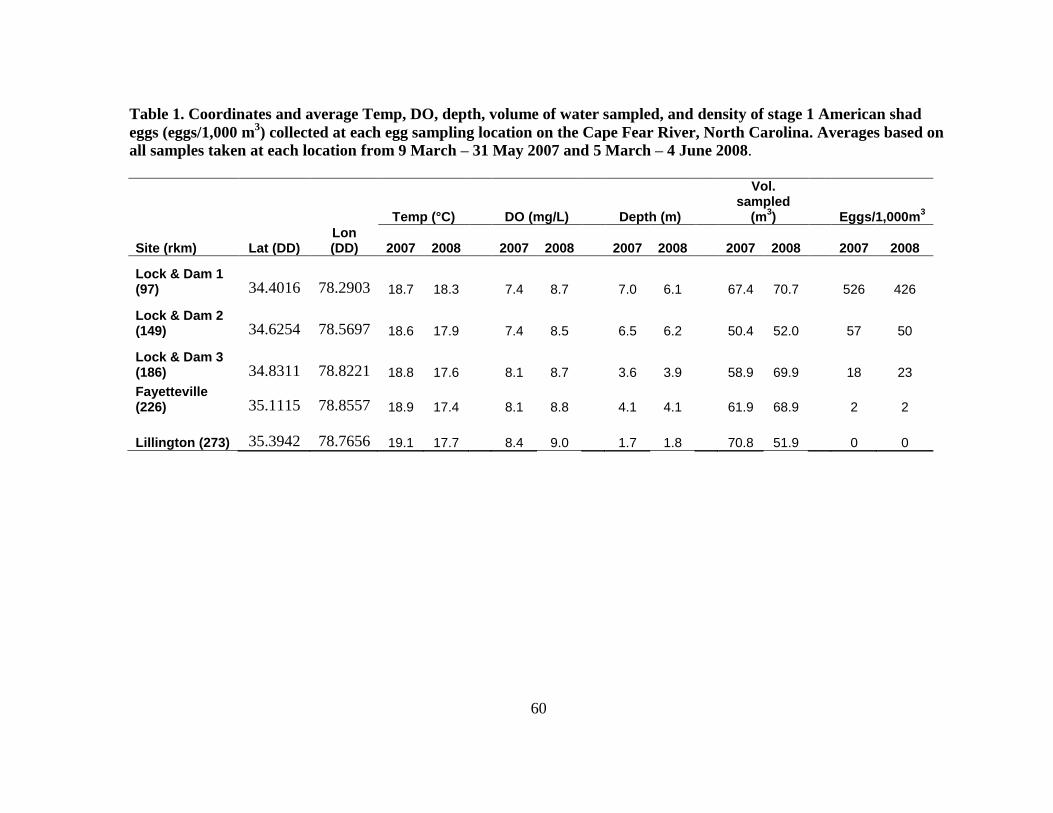
60
Table 1. Coordinates and average Temp, DO, depth, volume of water sampled, and density of stage 1 American shad
eggs (eggs/1,000 m3) collected at each egg sampling location on the Cape Fear River, North Carolina. Averages based on
all samples taken at each location from 9 March – 31 May 2007 and 5 March – 4 June 2008.
Temp (°C)
DO (mg/L)
Depth (m)
Vol. sampled
(m3)
Eggs/1,000m3
Site (rkm) Lat (DD) Lon (DD) 2007 2008
2007 2008
2007 2008
2007 2008
2007 2008
Lock & Dam 1 (97) 34.4016 78.2903 18.7 18.3
7.4 8.7
7.0 6.1
67.4 70.7
526 426
Lock & Dam 2 (149) 34.6254 78.5697 18.6 17.9
7.4 8.5
6.5 6.2
50.4 52.0
57 50
Lock & Dam 3 (186) 34.8311 78.8221 18.8 17.6
8.1 8.7
3.6 3.9
58.9 69.9
18 23
Fayetteville (226) 35.1115 78.8557 18.9 17.4
8.1 8.8
4.1 4.1
61.9 68.9
2 2
Lillington (273) 35.3942 78.7656 19.1 17.7
8.4 9.0
1.7 1.8
70.8 51.9
0 0
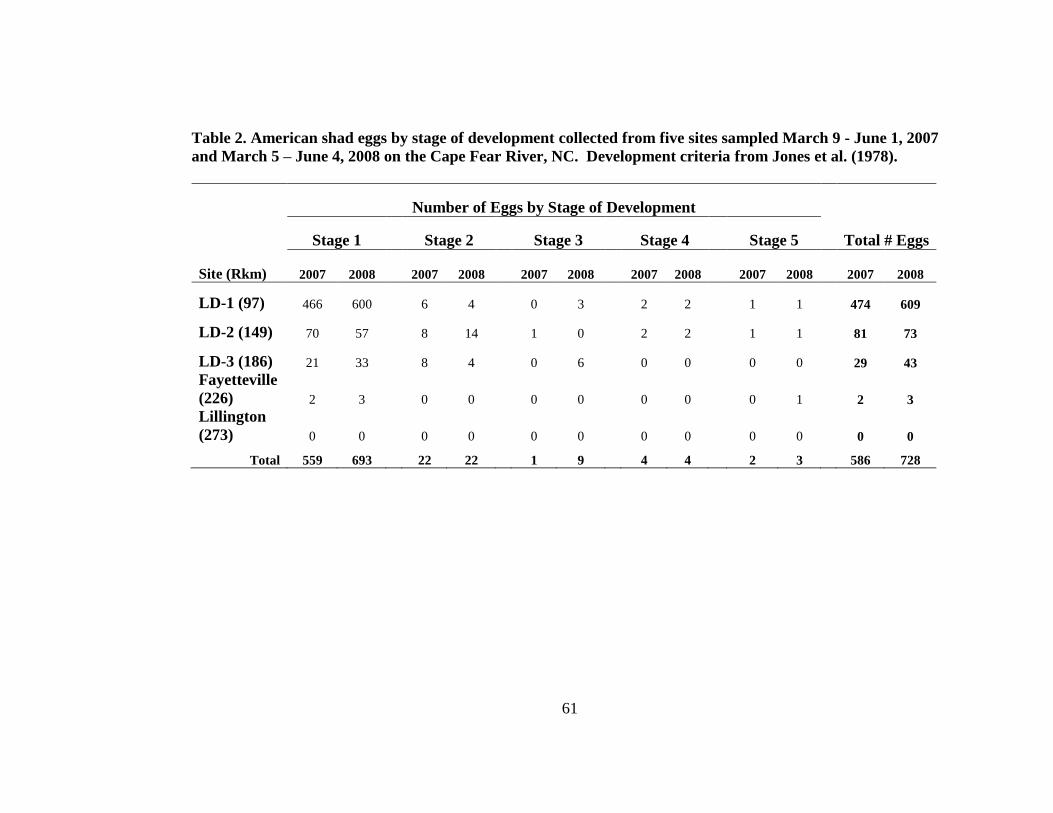
61
Table 2. American shad eggs by stage of development collected from five sites sampled March 9 - June 1, 2007
and March 5 – June 4, 2008 on the Cape Fear River, NC. Development criteria from Jones et al. (1978).
Number of Eggs by Stage of Development
Stage 1
Stage 2
Stage 3
Stage 4
Stage 5
Total # Eggs
Site (Rkm) 2007 2008
2007 2008
2007 2008
2007 2008
2007 2008
2007 2008
LD-1 (97) 466 600
6 4
0 3
2 2
1 1
474 609
LD-2 (149) 70 57
8 14
1 0
2 2
1 1
81 73
LD-3 (186) 21 33
8 4
0 6
0 0
0 0
29 43
Fayetteville
(226) 2 3
0 0
0 0
0 0
0 1
2 3
Lillington
(273) 0 0
0 0
0 0
0 0
0 0
0 0
Total 559 693
22 22
1 9
4 4
2 3
586 728
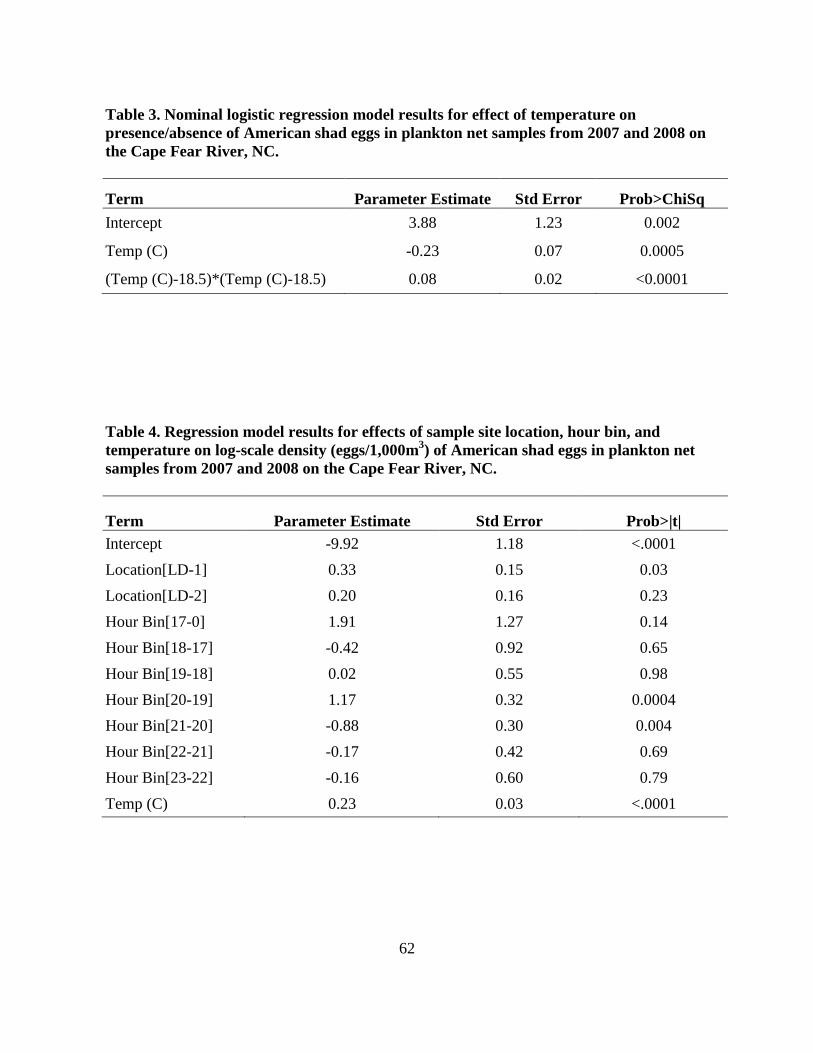
62
Table 3. Nominal logistic regression model results for effect of temperature on
presence/absence of American shad eggs in plankton net samples from 2007 and 2008 on
the Cape Fear River, NC.
Term Parameter Estimate Std Error Prob>ChiSq
Intercept 3.88 1.23 0.002
Temp (C) -0.23 0.07 0.0005
(Temp (C)-18.5)*(Temp (C)-18.5) 0.08 0.02 <0.0001
Table 4. Regression model results for effects of sample site location, hour bin, and
temperature on log-scale density (eggs/1,000m3) of American shad eggs in plankton net
samples from 2007 and 2008 on the Cape Fear River, NC.
Term Parameter Estimate Std Error Prob>|t|
Intercept -9.92 1.18 <.0001
Location[LD-1] 0.33 0.15 0.03
Location[LD-2] 0.20 0.16 0.23
Hour Bin[17-0] 1.91 1.27 0.14
Hour Bin[18-17] -0.42 0.92 0.65
Hour Bin[19-18] 0.02 0.55 0.98
Hour Bin[20-19] 1.17 0.32 0.0004
Hour Bin[21-20] -0.88 0.30 0.004
Hour Bin[22-21] -0.17 0.42 0.69
Hour Bin[23-22] -0.16 0.60 0.79
Temp (C) 0.23 0.03 <.0001
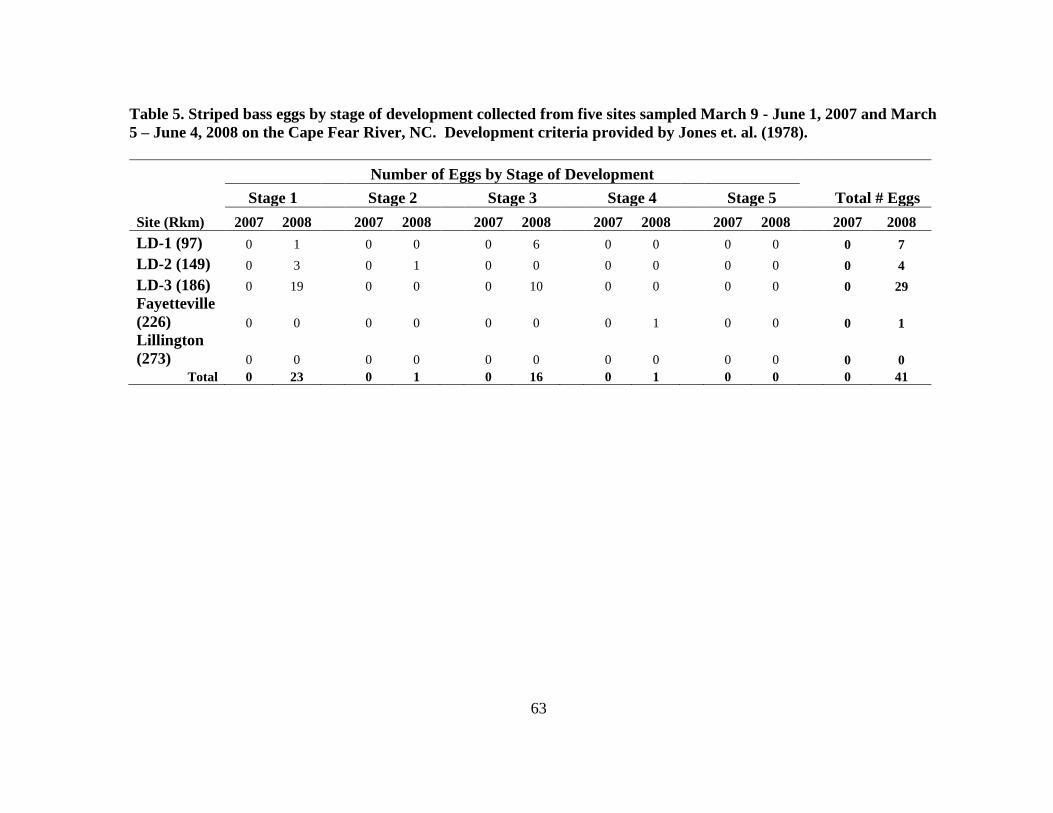
63
Table 5. Striped bass eggs by stage of development collected from five sites sampled March 9 - June 1, 2007 and March
5 – June 4, 2008 on the Cape Fear River, NC. Development criteria provided by Jones et. al. (1978).
Number of Eggs by Stage of Development
Stage 1 Stage 2 Stage 3 Stage 4 Stage 5 Total # Eggs
Site (Rkm) 2007 2008 2007 2008 2007 2008 2007 2008 2007 2008 2007 2008
LD-1 (97) 0 1 0 0 0 6 0 0 0 0 0 7
LD-2 (149) 0 3 0 1 0 0 0 0 0 0 0 4
LD-3 (186) 0 19 0 0 0 10 0 0 0 0 0 29
Fayetteville
(226) 0 0
0 0
0 0
0 1
0 0
0 1
Lillington
(273) 0 0
0 0
0 0
0 0
0 0
0 0
Total 0 23 0 1 0 16 0 1 0 0 0 41
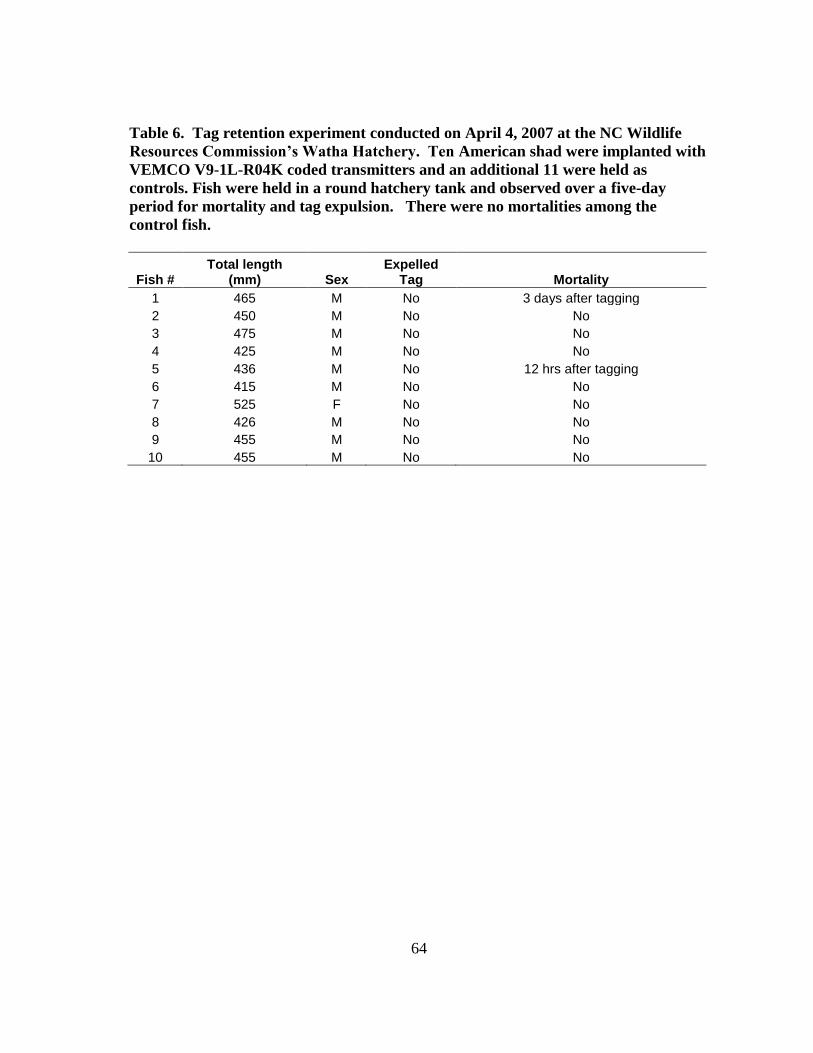
64
Table 6. Tag retention experiment conducted on April 4, 2007 at the NC Wildlife
Resources Commission’s Watha Hatchery. Ten American shad were implanted with
VEMCO V9-1L-R04K coded transmitters and an additional 11 were held as
controls. Fish were held in a round hatchery tank and observed over a five-day
period for mortality and tag expulsion. There were no mortalities among the
control fish.
Fish # Total length
(mm) Sex Expelled
Tag Mortality
1 465 M No 3 days after tagging
2 450 M No No
3 475 M No No
4 425 M No No
5 436 M No 12 hrs after tagging
6 415 M No No
7 525 F No No
8 426 M No No
9 455 M No No
10 455 M No No
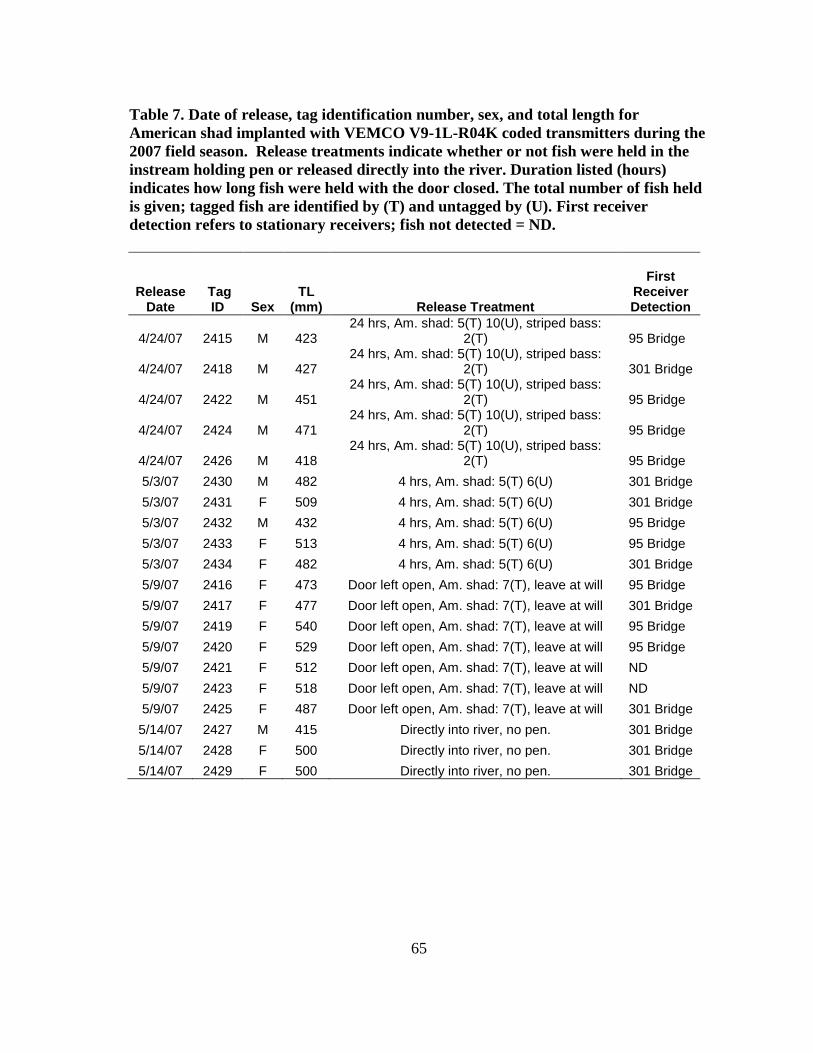
65
Table 7. Date of release, tag identification number, sex, and total length for
American shad implanted with VEMCO V9-1L-R04K coded transmitters during the
2007 field season. Release treatments indicate whether or not fish were held in the
instream holding pen or released directly into the river. Duration listed (hours)
indicates how long fish were held with the door closed. The total number of fish held
is given; tagged fish are identified by (T) and untagged by (U). First receiver
detection refers to stationary receivers; fish not detected = ND.
Release Date
Tag ID Sex
TL (mm) Release Treatment
First Receiver Detection
4/24/07 2415 M 423 24 hrs, Am. shad: 5(T) 10(U), striped bass:
2(T) 95 Bridge
4/24/07 2418 M 427 24 hrs, Am. shad: 5(T) 10(U), striped bass:
2(T) 301 Bridge
4/24/07 2422 M 451 24 hrs, Am. shad: 5(T) 10(U), striped bass:
2(T) 95 Bridge
4/24/07 2424 M 471 24 hrs, Am. shad: 5(T) 10(U), striped bass:
2(T) 95 Bridge
4/24/07 2426 M 418 24 hrs, Am. shad: 5(T) 10(U), striped bass:
2(T) 95 Bridge
5/3/07 2430 M 482 4 hrs, Am. shad: 5(T) 6(U) 301 Bridge
5/3/07 2431 F 509 4 hrs, Am. shad: 5(T) 6(U) 301 Bridge
5/3/07 2432 M 432 4 hrs, Am. shad: 5(T) 6(U) 95 Bridge
5/3/07 2433 F 513 4 hrs, Am. shad: 5(T) 6(U) 95 Bridge
5/3/07 2434 F 482 4 hrs, Am. shad: 5(T) 6(U) 301 Bridge
5/9/07 2416 F 473 Door left open, Am. shad: 7(T), leave at will 95 Bridge
5/9/07 2417 F 477 Door left open, Am. shad: 7(T), leave at will 301 Bridge
5/9/07 2419 F 540 Door left open, Am. shad: 7(T), leave at will 95 Bridge
5/9/07 2420 F 529 Door left open, Am. shad: 7(T), leave at will 95 Bridge
5/9/07 2421 F 512 Door left open, Am. shad: 7(T), leave at will ND
5/9/07 2423 F 518 Door left open, Am. shad: 7(T), leave at will ND
5/9/07 2425 F 487 Door left open, Am. shad: 7(T), leave at will 301 Bridge
5/14/07 2427 M 415 Directly into river, no pen. 301 Bridge
5/14/07 2428 F 500 Directly into river, no pen. 301 Bridge
5/14/07 2429 F 500 Directly into river, no pen. 301 Bridge
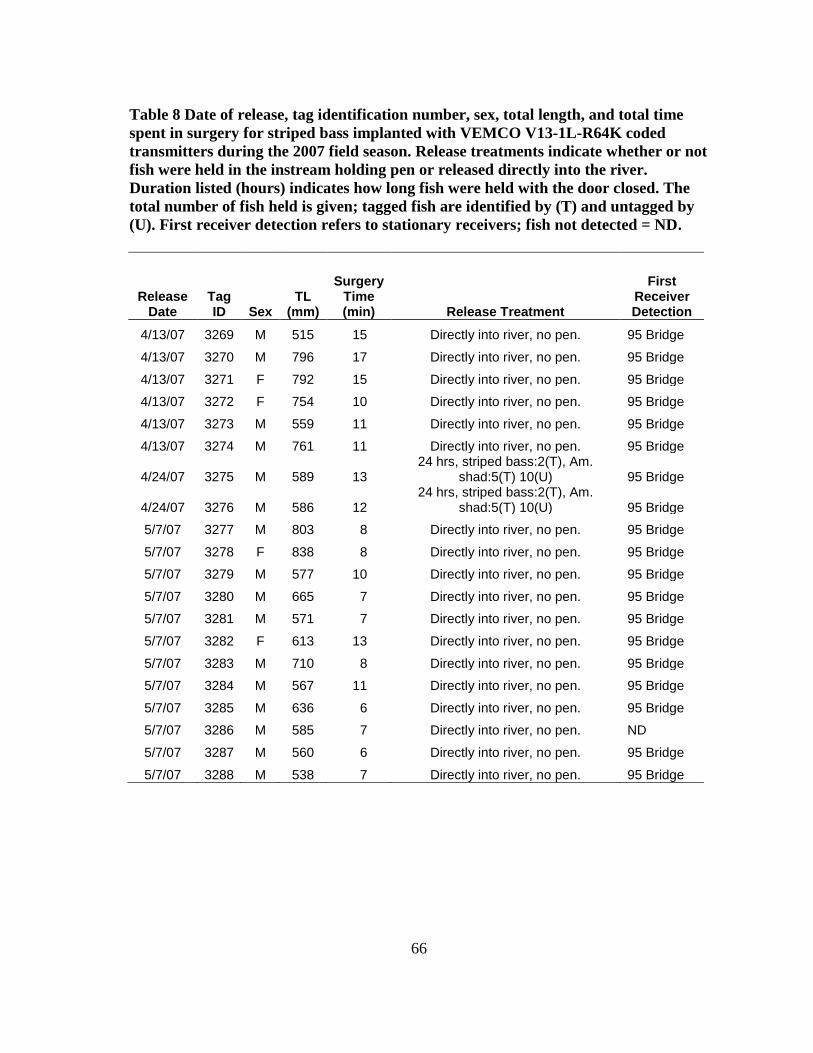
66
Table 8 Date of release, tag identification number, sex, total length, and total time
spent in surgery for striped bass implanted with VEMCO V13-1L-R64K coded
transmitters during the 2007 field season. Release treatments indicate whether or not
fish were held in the instream holding pen or released directly into the river.
Duration listed (hours) indicates how long fish were held with the door closed. The
total number of fish held is given; tagged fish are identified by (T) and untagged by
(U). First receiver detection refers to stationary receivers; fish not detected = ND.
Release Date
Tag ID Sex
TL (mm)
Surgery Time (min) Release Treatment
First Receiver Detection
4/13/07 3269 M 515 15 Directly into river, no pen. 95 Bridge
4/13/07 3270 M 796 17 Directly into river, no pen. 95 Bridge
4/13/07 3271 F 792 15 Directly into river, no pen. 95 Bridge
4/13/07 3272 F 754 10 Directly into river, no pen. 95 Bridge
4/13/07 3273 M 559 11 Directly into river, no pen. 95 Bridge
4/13/07 3274 M 761 11 Directly into river, no pen. 95 Bridge
4/24/07 3275 M 589 13 24 hrs, striped bass:2(T), Am.
shad:5(T) 10(U) 95 Bridge
4/24/07 3276 M 586 12 24 hrs, striped bass:2(T), Am.
shad:5(T) 10(U) 95 Bridge
5/7/07 3277 M 803 8 Directly into river, no pen. 95 Bridge
5/7/07 3278 F 838 8 Directly into river, no pen. 95 Bridge
5/7/07 3279 M 577 10 Directly into river, no pen. 95 Bridge
5/7/07 3280 M 665 7 Directly into river, no pen. 95 Bridge
5/7/07 3281 M 571 7 Directly into river, no pen. 95 Bridge
5/7/07 3282 F 613 13 Directly into river, no pen. 95 Bridge
5/7/07 3283 M 710 8 Directly into river, no pen. 95 Bridge
5/7/07 3284 M 567 11 Directly into river, no pen. 95 Bridge
5/7/07 3285 M 636 6 Directly into river, no pen. 95 Bridge
5/7/07 3286 M 585 7 Directly into river, no pen. ND
5/7/07 3287 M 560 6 Directly into river, no pen. 95 Bridge
5/7/07 3288 M 538 7 Directly into river, no pen. 95 Bridge
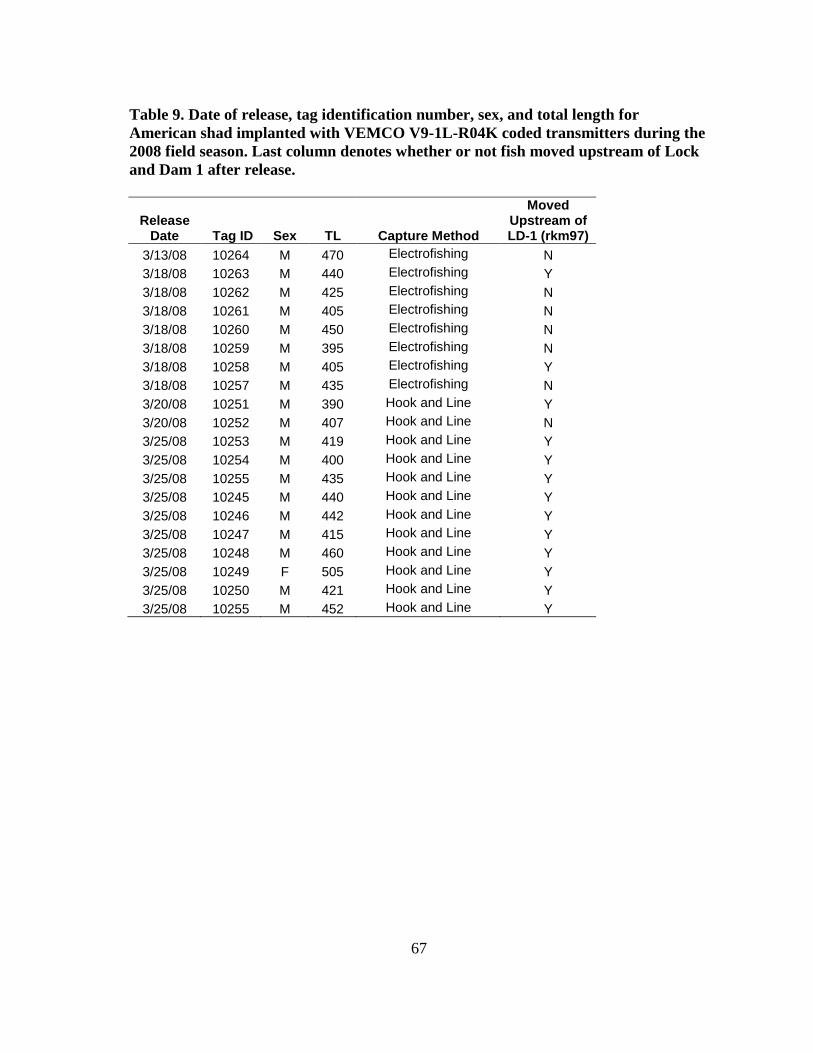
67
Table 9. Date of release, tag identification number, sex, and total length for
American shad implanted with VEMCO V9-1L-R04K coded transmitters during the
2008 field season. Last column denotes whether or not fish moved upstream of Lock
and Dam 1 after release.
Release Date Tag ID Sex TL Capture Method
Moved Upstream of LD-1 (rkm97)
3/13/08 10264 M 470 Electrofishing N
3/18/08 10263 M 440 Electrofishing Y
3/18/08 10262 M 425 Electrofishing N
3/18/08 10261 M 405 Electrofishing N
3/18/08 10260 M 450 Electrofishing N
3/18/08 10259 M 395 Electrofishing N
3/18/08 10258 M 405 Electrofishing Y
3/18/08 10257 M 435 Electrofishing N
3/20/08 10251 M 390 Hook and Line Y
3/20/08 10252 M 407 Hook and Line N
3/25/08 10253 M 419 Hook and Line Y
3/25/08 10254 M 400 Hook and Line Y
3/25/08 10255 M 435 Hook and Line Y
3/25/08 10245 M 440 Hook and Line Y
3/25/08 10246 M 442 Hook and Line Y
3/25/08 10247 M 415 Hook and Line Y
3/25/08 10248 M 460 Hook and Line Y
3/25/08 10249 F 505 Hook and Line Y
3/25/08 10250 M 421 Hook and Line Y
3/25/08 10255 M 452 Hook and Line Y
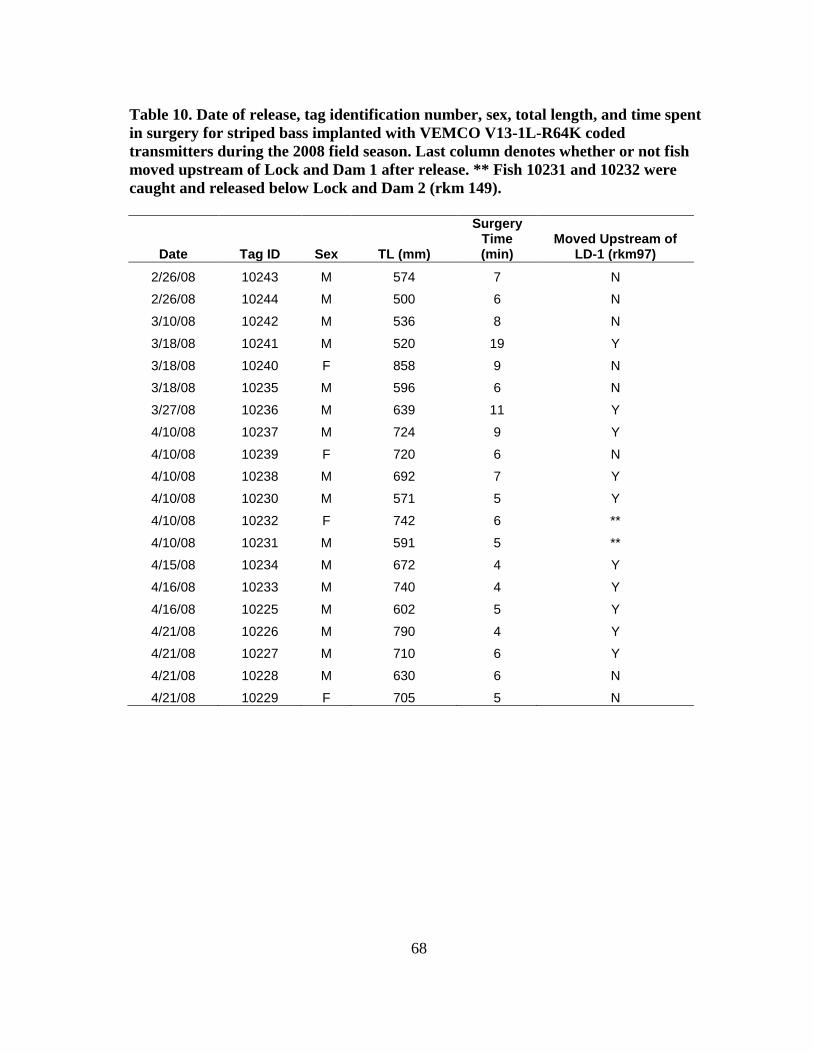
68
Table 10. Date of release, tag identification number, sex, total length, and time spent
in surgery for striped bass implanted with VEMCO V13-1L-R64K coded
transmitters during the 2008 field season. Last column denotes whether or not fish
moved upstream of Lock and Dam 1 after release. ** Fish 10231 and 10232 were
caught and released below Lock and Dam 2 (rkm 149).
Date Tag ID Sex TL (mm)
Surgery Time (min)
Moved Upstream of LD-1 (rkm97)
2/26/08 10243 M 574 7 N
2/26/08 10244 M 500 6 N
3/10/08 10242 M 536 8 N
3/18/08 10241 M 520 19 Y
3/18/08 10240 F 858 9 N
3/18/08 10235 M 596 6 N
3/27/08 10236 M 639 11 Y
4/10/08 10237 M 724 9 Y
4/10/08 10239 F 720 6 N
4/10/08 10238 M 692 7 Y
4/10/08 10230 M 571 5 Y
4/10/08 10232 F 742 6 **
4/10/08 10231 M 591 5 **
4/15/08 10234 M 672 4 Y
4/16/08 10233 M 740 4 Y
4/16/08 10225 M 602 5 Y
4/21/08 10226 M 790 4 Y
4/21/08 10227 M 710 6 Y
4/21/08 10228 M 630 6 N
4/21/08 10229 F 705 5 N
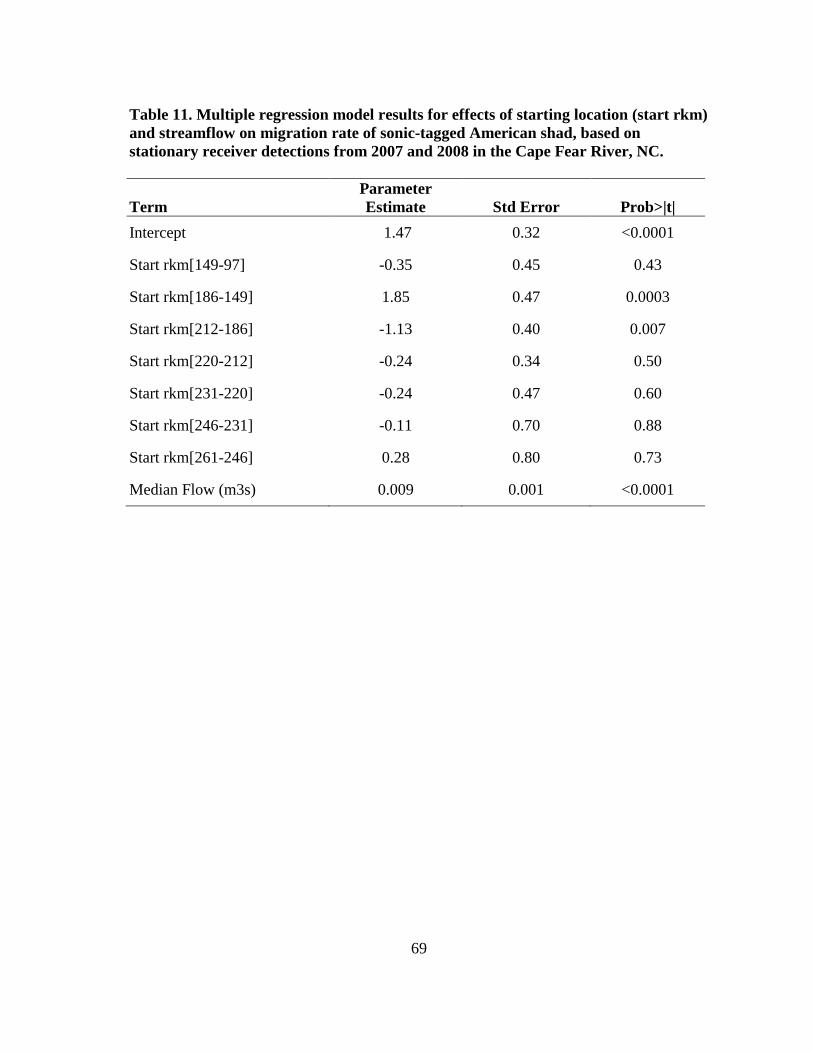
69
Table 11. Multiple regression model results for effects of starting location (start rkm)
and streamflow on migration rate of sonic-tagged American shad, based on
stationary receiver detections from 2007 and 2008 in the Cape Fear River, NC.
Term
Parameter
Estimate Std Error Prob>|t|
Intercept 1.47 0.32 <0.0001
Start rkm[149-97] -0.35 0.45 0.43
Start rkm[186-149] 1.85 0.47 0.0003
Start rkm[212-186] -1.13 0.40 0.007
Start rkm[220-212] -0.24 0.34 0.50
Start rkm[231-220] -0.24 0.47 0.60
Start rkm[246-231] -0.11 0.70 0.88
Start rkm[261-246] 0.28 0.80 0.73
Median Flow (m3s) 0.009 0.001 <0.0001
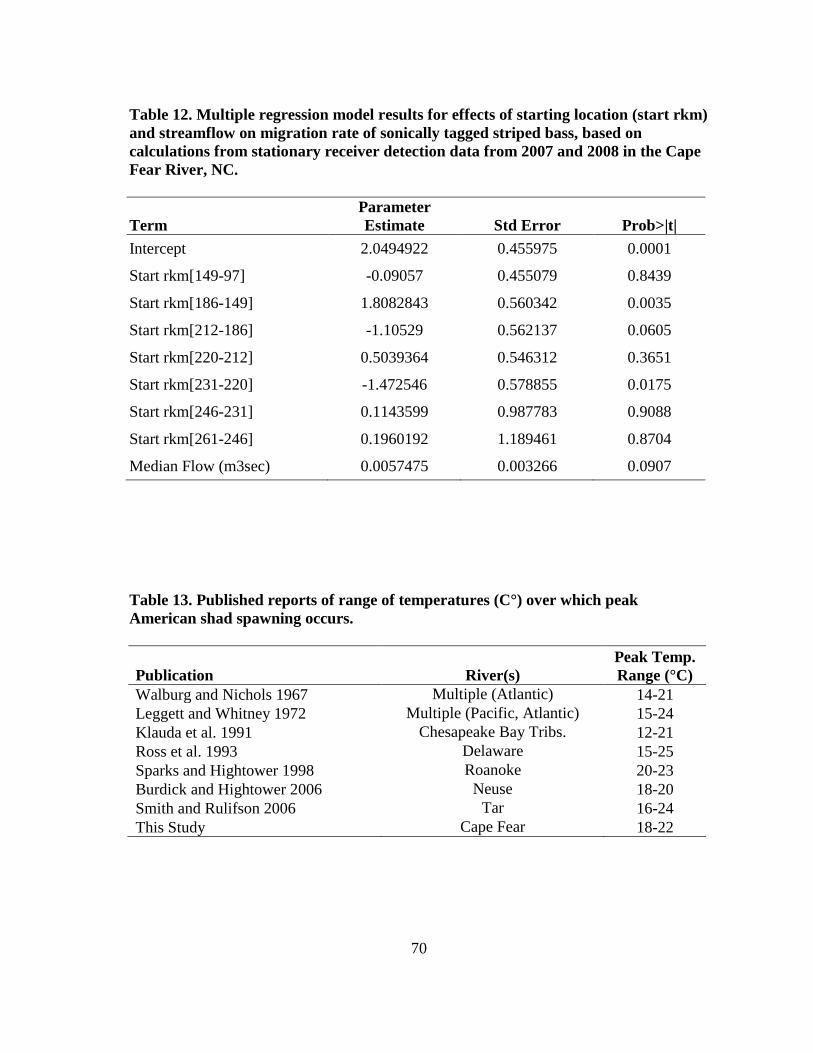
70
Table 12. Multiple regression model results for effects of starting location (start rkm)
and streamflow on migration rate of sonically tagged striped bass, based on
calculations from stationary receiver detection data from 2007 and 2008 in the Cape
Fear River, NC.
Term
Parameter
Estimate Std Error Prob>|t|
Intercept 2.0494922 0.455975 0.0001
Start rkm[149-97] -0.09057 0.455079 0.8439
Start rkm[186-149] 1.8082843 0.560342 0.0035
Start rkm[212-186] -1.10529 0.562137 0.0605
Start rkm[220-212] 0.5039364 0.546312 0.3651
Start rkm[231-220] -1.472546 0.578855 0.0175
Start rkm[246-231] 0.1143599 0.987783 0.9088
Start rkm[261-246] 0.1960192 1.189461 0.8704
Median Flow (m3sec) 0.0057475 0.003266 0.0907
Table 13. Published reports of range of temperatures (C°) over which peak
American shad spawning occurs.
Publication River(s)
Peak Temp.
Range (°C)
Walburg and Nichols 1967 Multiple (Atlantic) 14-21
Leggett and Whitney 1972 Multiple (Pacific, Atlantic) 15-24
Klauda et al. 1991 Chesapeake Bay Tribs. 12-21
Ross et al. 1993 Delaware 15-25
Sparks and Hightower 1998 Roanoke 20-23
Burdick and Hightower 2006 Neuse 18-20
Smith and Rulifson 2006 Tar 16-24
This Study Cape Fear 18-22
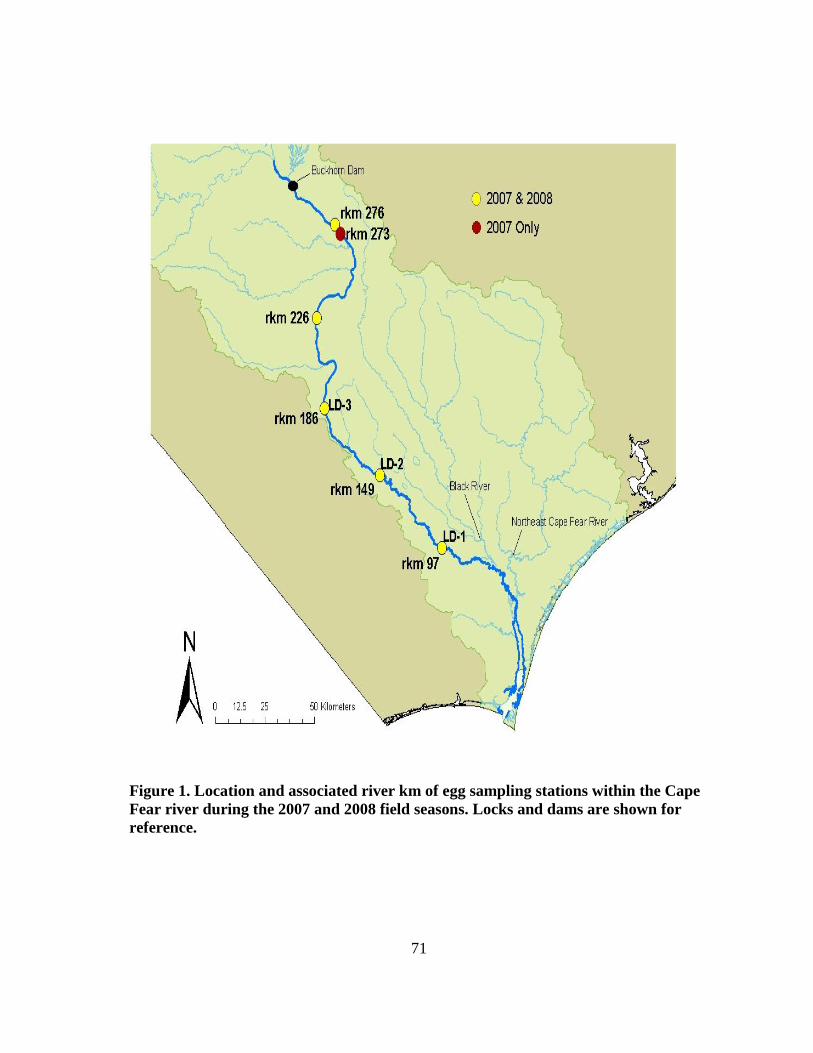
71
Figure 1. Location and associated river km of egg sampling stations within the Cape
Fear river during the 2007 and 2008 field seasons. Locks and dams are shown for
reference.
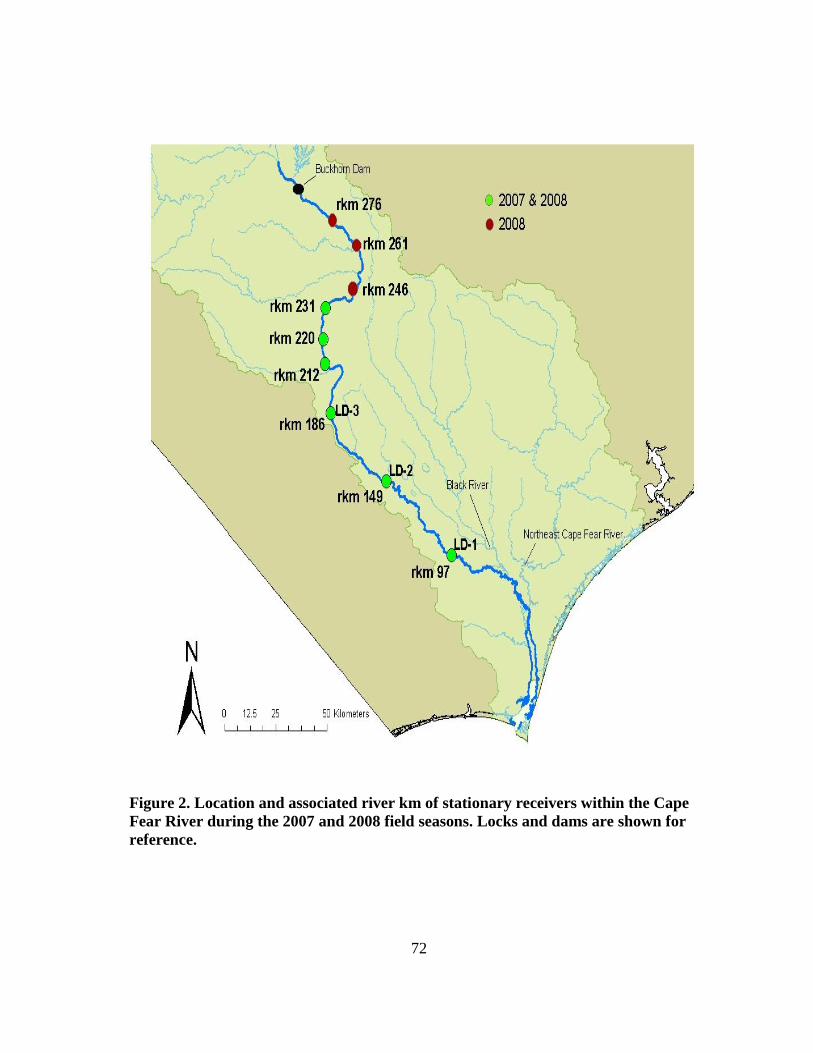
72
Figure 2. Location and associated river km of stationary receivers within the Cape
Fear River during the 2007 and 2008 field seasons. Locks and dams are shown for
reference.
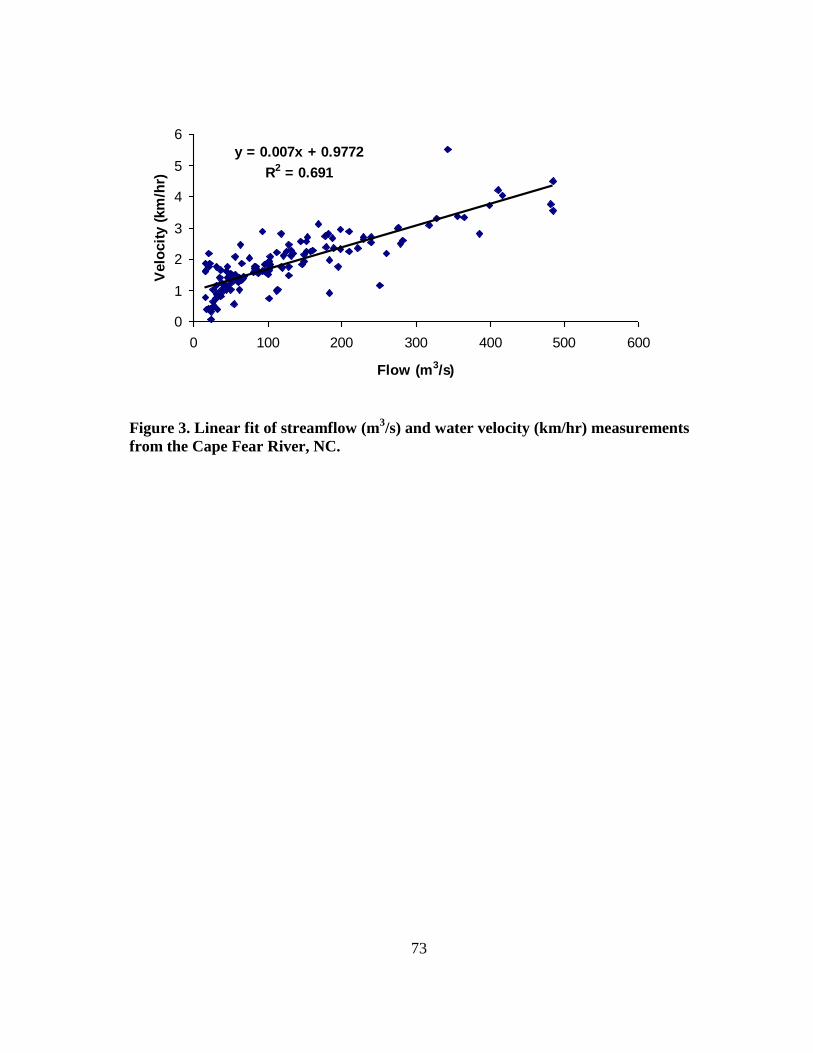
73
y = 0.007x + 0.9772
R2 = 0.691
0
1
2
3
4
5
6
0 100 200 300 400 500 600
Flow (m3/s)
Velo
cit
y (
km
/hr)
Figure 3. Linear fit of streamflow (m3/s) and water velocity (km/hr) measurements
from the Cape Fear River, NC.

74
0
100
200
300
400
500
600
700
800S
tre
am
flo
w (
m3/s
)2007
2008
0.00
2.00
4.00
6.00
8.00
10.00
12.00
1-Mar 15-Mar 29-Mar 12-Apr 26-Apr 10-May 24-MayDate
Pre
cip
ita
tio
n (
cm
)
Figure 4. Average daily streamflow (m3/s) and precipitation data from March 1 to
June 1, 2007 and 2008 from the USGS gauge at LD-1 on the Cape Fear River.
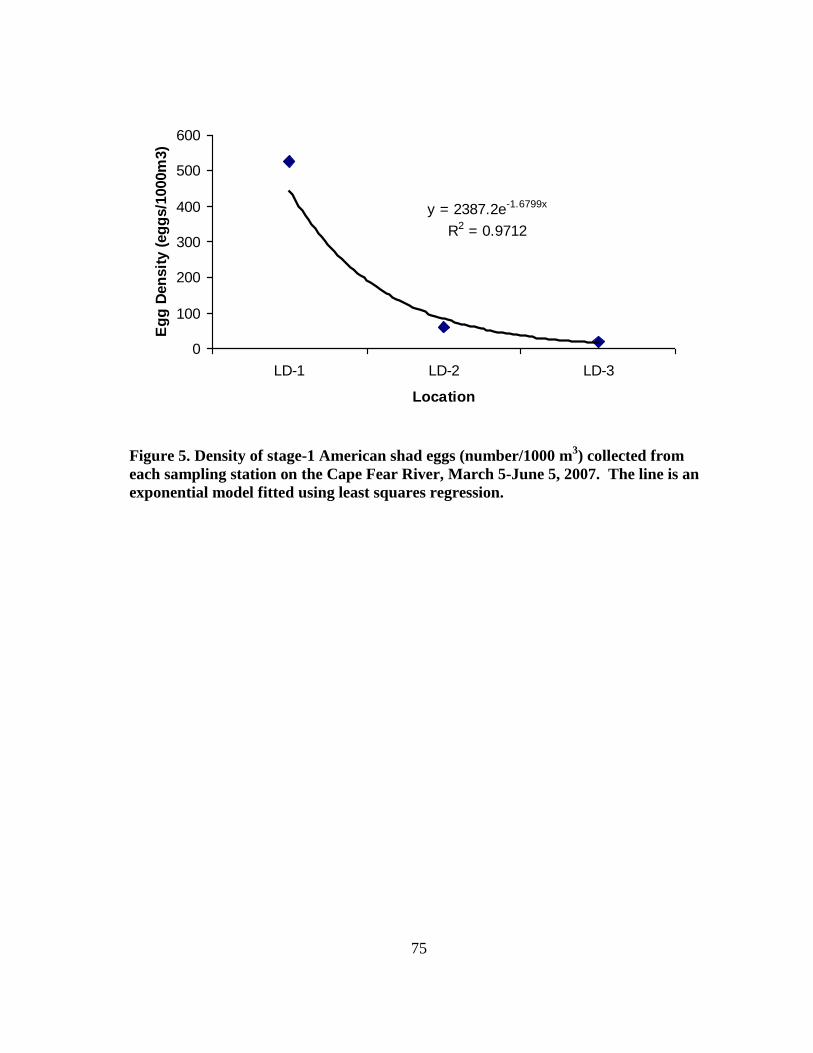
75
y = 2387.2e-1.6799x
R2 = 0.9712
0
100
200
300
400
500
600
LD-1 LD-2 LD-3
Location
Eg
g D
en
sit
y (
eg
gs/1
000m
3)
Figure 5. Density of stage-1 American shad eggs (number/1000 m3) collected from
each sampling station on the Cape Fear River, March 5-June 5, 2007. The line is an
exponential model fitted using least squares regression.
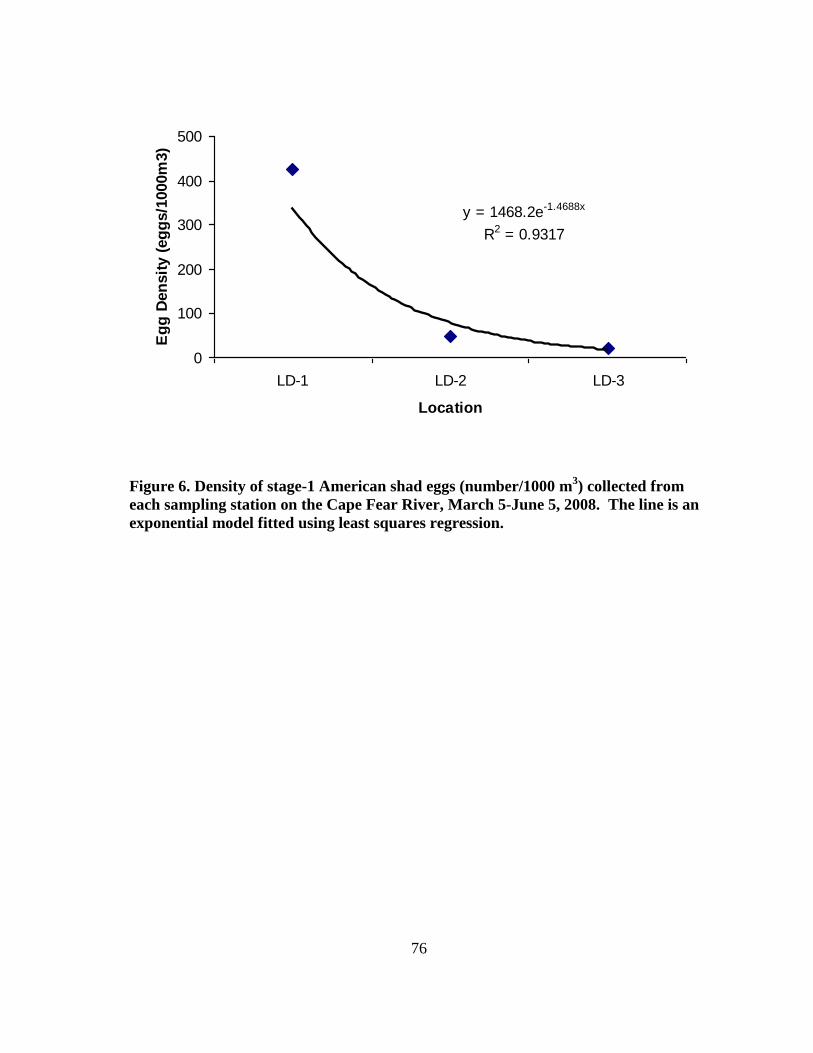
76
y = 1468.2e-1.4688x
R2 = 0.9317
0
100
200
300
400
500
LD-1 LD-2 LD-3
Location
Eg
g D
en
sit
y (
eg
gs/1
000m
3)
Figure 6. Density of stage-1 American shad eggs (number/1000 m3) collected from
each sampling station on the Cape Fear River, March 5-June 5, 2008. The line is an
exponential model fitted using least squares regression.
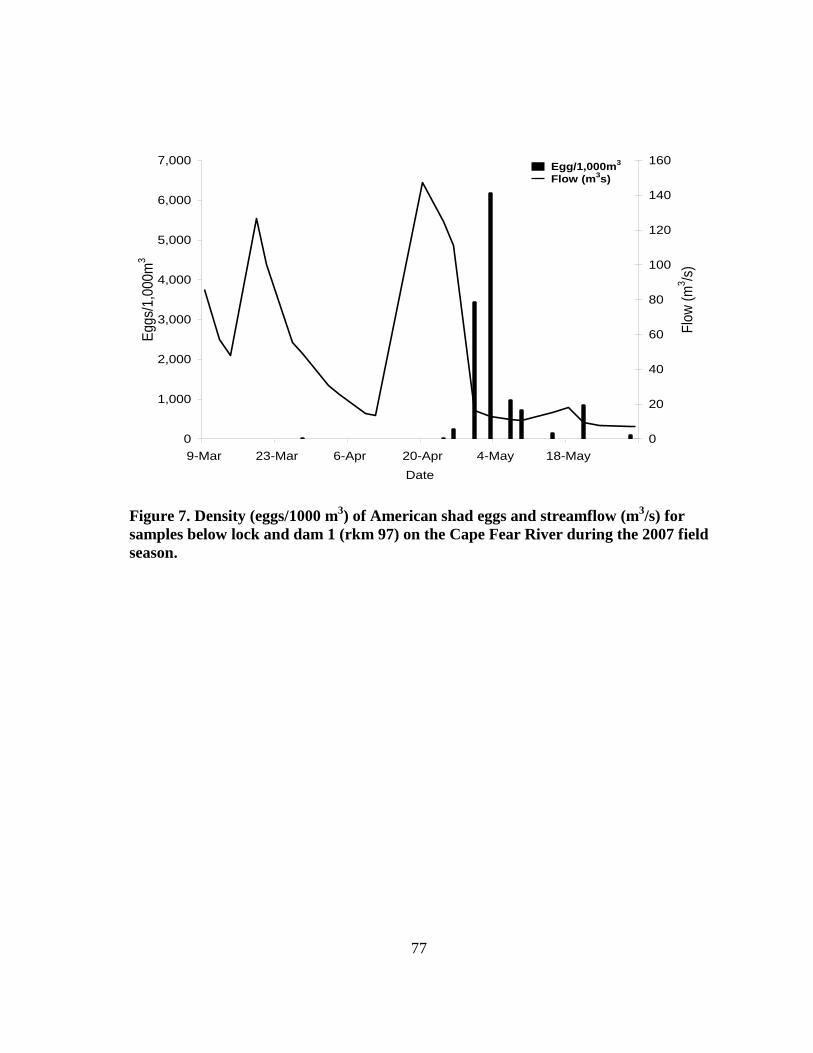
77
0
1,000
2,000
3,000
4,000
5,000
6,000
7,000
9-Mar 23-Mar 6-Apr 20-Apr 4-May 18-May
Date
Egg
s/1,0
00
m3
0
20
40
60
80
100
120
140
160
Flo
w (
m3/s
)
Flow (m3s)
Egg/1,000m3
Figure 7. Density (eggs/1000 m3) of American shad eggs and streamflow (m
3/s) for
samples below lock and dam 1 (rkm 97) on the Cape Fear River during the 2007 field
season.

78
0
1,000
2,000
3,000
4,000
5,000
6,000
5-Mar 19-Mar 2-Apr 16-Apr 30-Apr 14-May
Date
Egg
s/1,0
00
m3
0
50
100
150
200
250
Flo
w (
m3/s
)
Flow (m3s)
Egg/1,000m3
Figure 8. Density (eggs/1000 m3) of American shad eggs and streamflow (m
3/s) for
samples below lock and dam 1 (rkm 97) on the Cape Fear River during the 2008
field season.
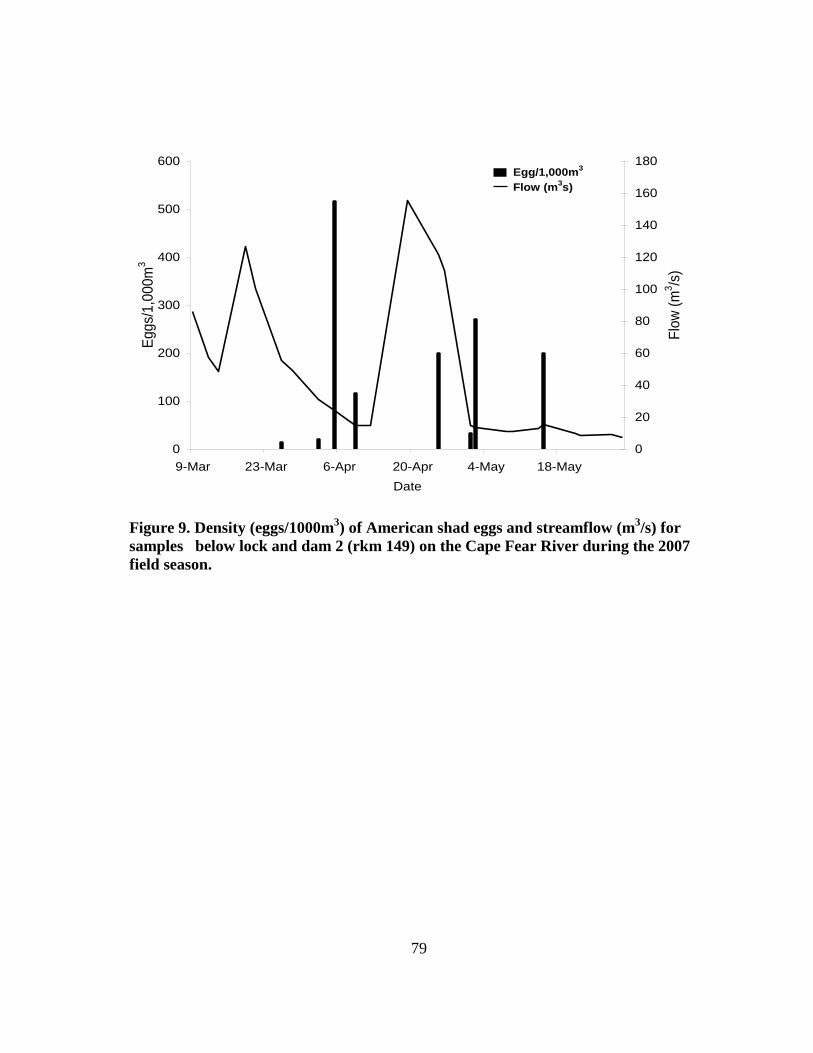
79
0
100
200
300
400
500
600
9-Mar 23-Mar 6-Apr 20-Apr 4-May 18-May
Date
Eggs/
1,0
00m
3
0
20
40
60
80
100
120
140
160
180
Flo
w (
m3/s
)
Flow (m3s)
Egg/1,000m3
Figure 9. Density (eggs/1000m3) of American shad eggs and streamflow (m
3/s) for
samples below lock and dam 2 (rkm 149) on the Cape Fear River during the 2007
field season.
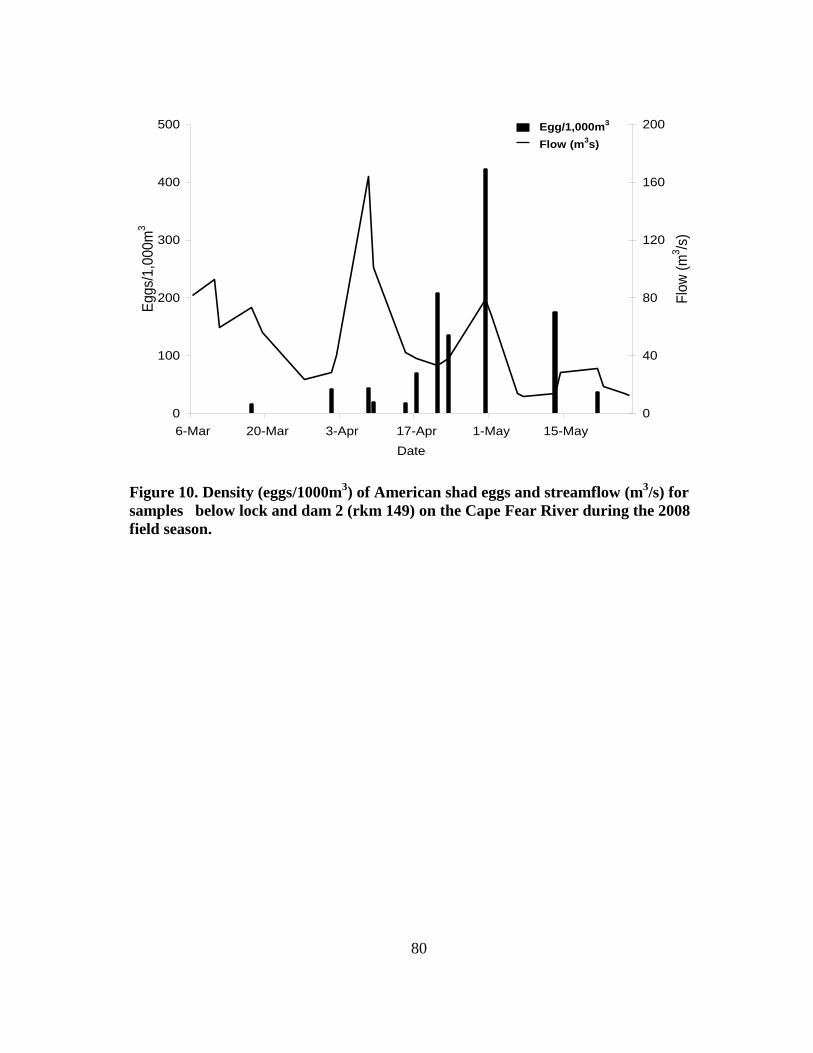
80
0
100
200
300
400
500
6-Mar 20-Mar 3-Apr 17-Apr 1-May 15-May
Date
Egg
s/1,0
00
m3
0
40
80
120
160
200
Flo
w (
m3/s
)
Flow (m3s)
Egg/1,000m3
Figure 10. Density (eggs/1000m3) of American shad eggs and streamflow (m
3/s) for
samples below lock and dam 2 (rkm 149) on the Cape Fear River during the 2008
field season.
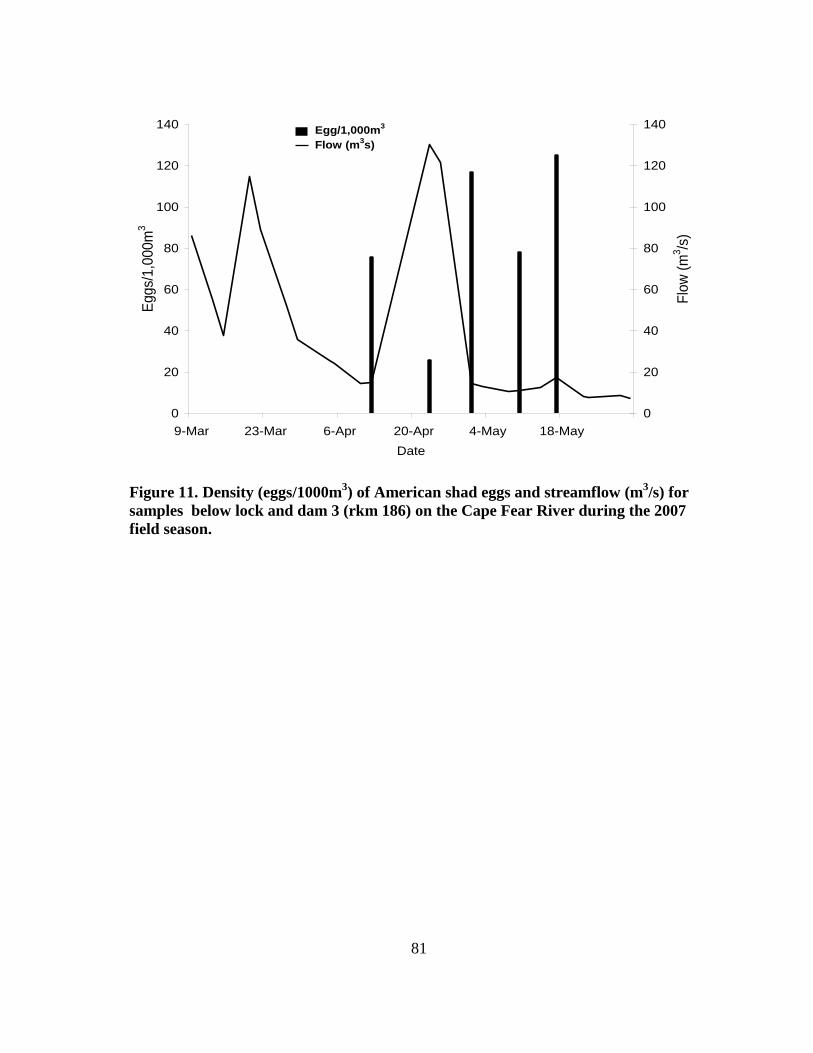
81
0
20
40
60
80
100
120
140
9-Mar 23-Mar 6-Apr 20-Apr 4-May 18-May
Date
Egg
s/1,0
00
m3
0
20
40
60
80
100
120
140
Flo
w (
m3/s
)
Flow (m3s)
Egg/1,000m3
Figure 11. Density (eggs/1000m3) of American shad eggs and streamflow (m
3/s) for
samples below lock and dam 3 (rkm 186) on the Cape Fear River during the 2007
field season.
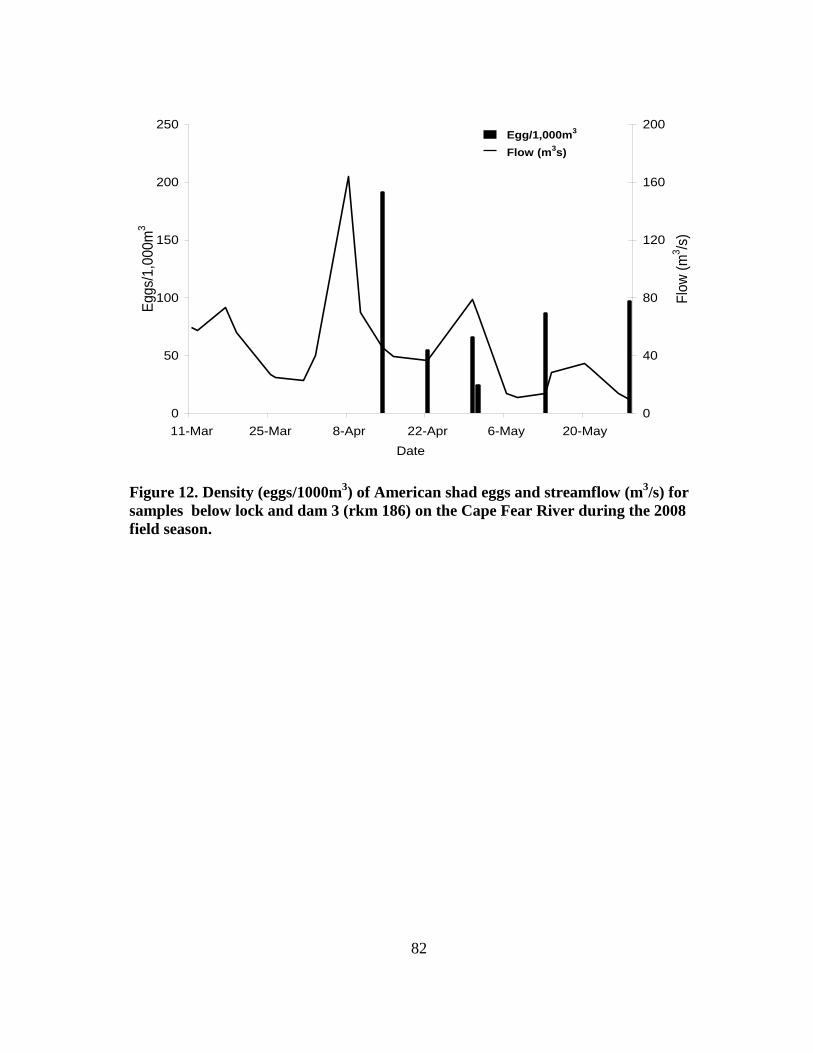
82
0
50
100
150
200
250
11-Mar 25-Mar 8-Apr 22-Apr 6-May 20-May
Date
Egg
s/1,0
00
m3
0
40
80
120
160
200
Flo
w (
m3/s
)
Flow (m3s)
Egg/1,000m3
Figure 12. Density (eggs/1000m3) of American shad eggs and streamflow (m
3/s) for
samples below lock and dam 3 (rkm 186) on the Cape Fear River during the 2008
field season.
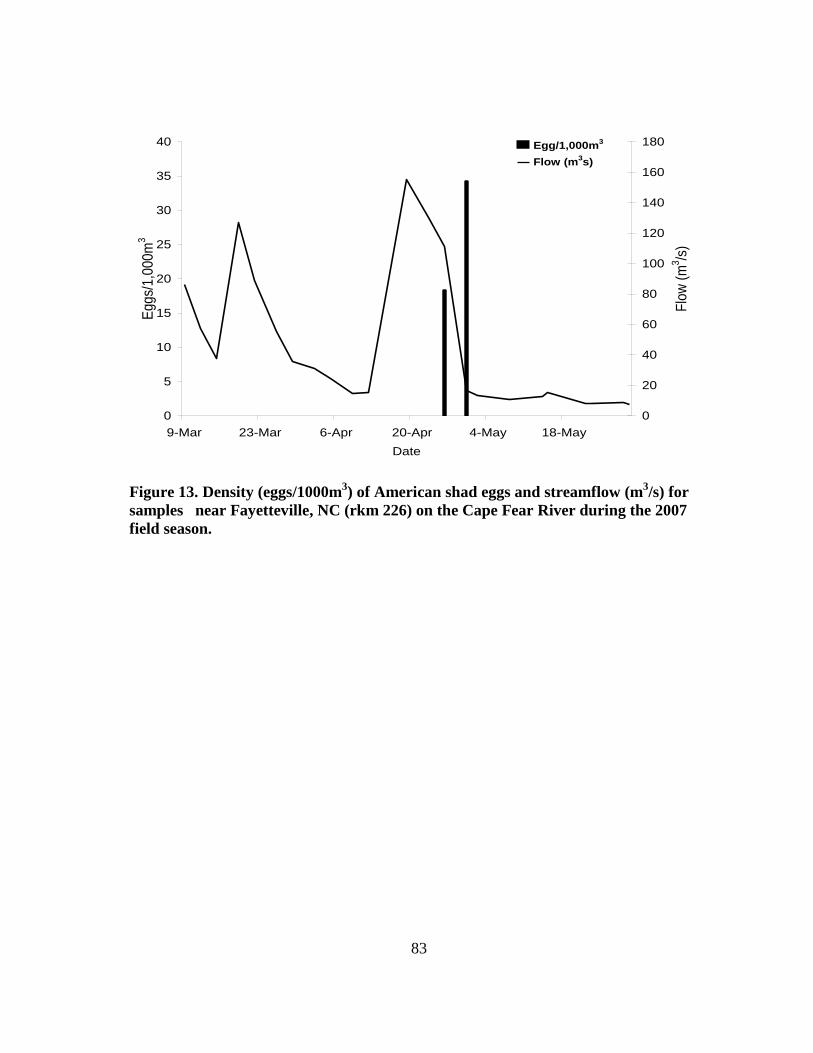
83
0
5
10
15
20
25
30
35
40
9-Mar 23-Mar 6-Apr 20-Apr 4-May 18-May
Date
Egg
s/1,0
00
m3
0
20
40
60
80
100
120
140
160
180
Flo
w (
m3/s
)
Flow (m3s)
Egg/1,000m3
Figure 13. Density (eggs/1000m3) of American shad eggs and streamflow (m
3/s) for
samples near Fayetteville, NC (rkm 226) on the Cape Fear River during the 2007
field season.
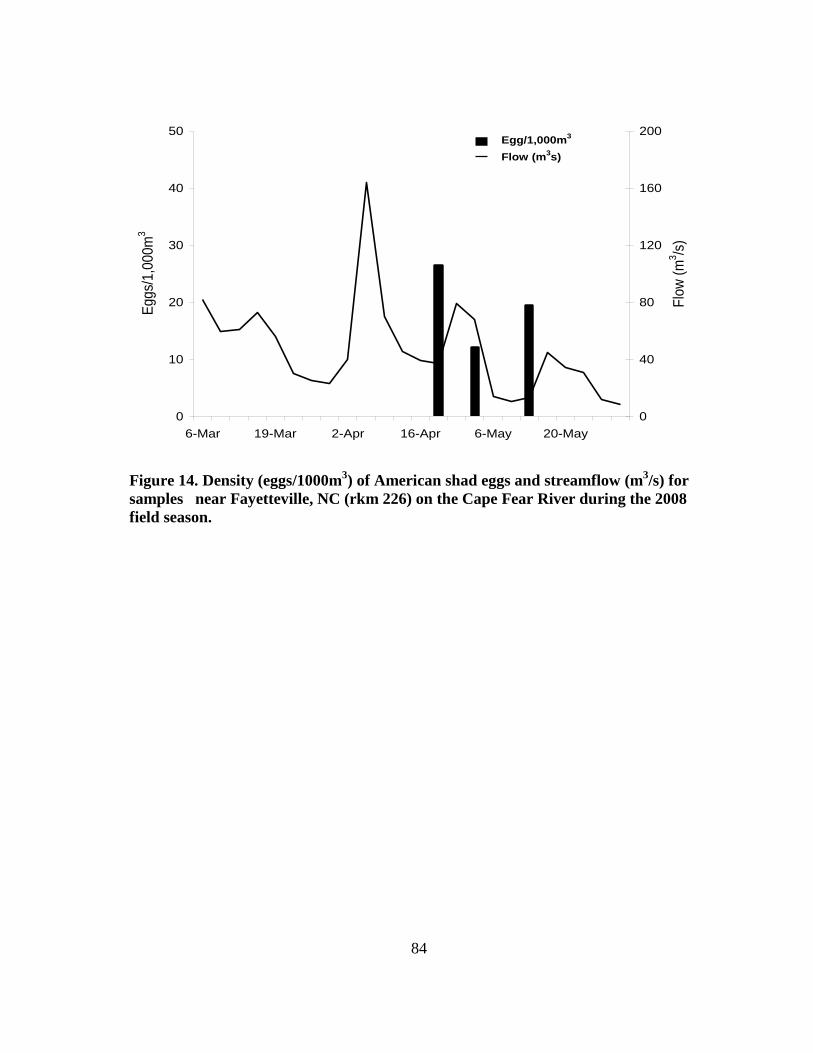
84
0
10
20
30
40
50
6-Mar 19-Mar 2-Apr 16-Apr 6-May 20-May
Eggs/
1,0
00m
3
0
40
80
120
160
200
Flo
w (
m3/s
)
Flow (m3s)
Egg/1,000m3
Figure 14. Density (eggs/1000m3) of American shad eggs and streamflow (m
3/s) for
samples near Fayetteville, NC (rkm 226) on the Cape Fear River during the 2008
field season.
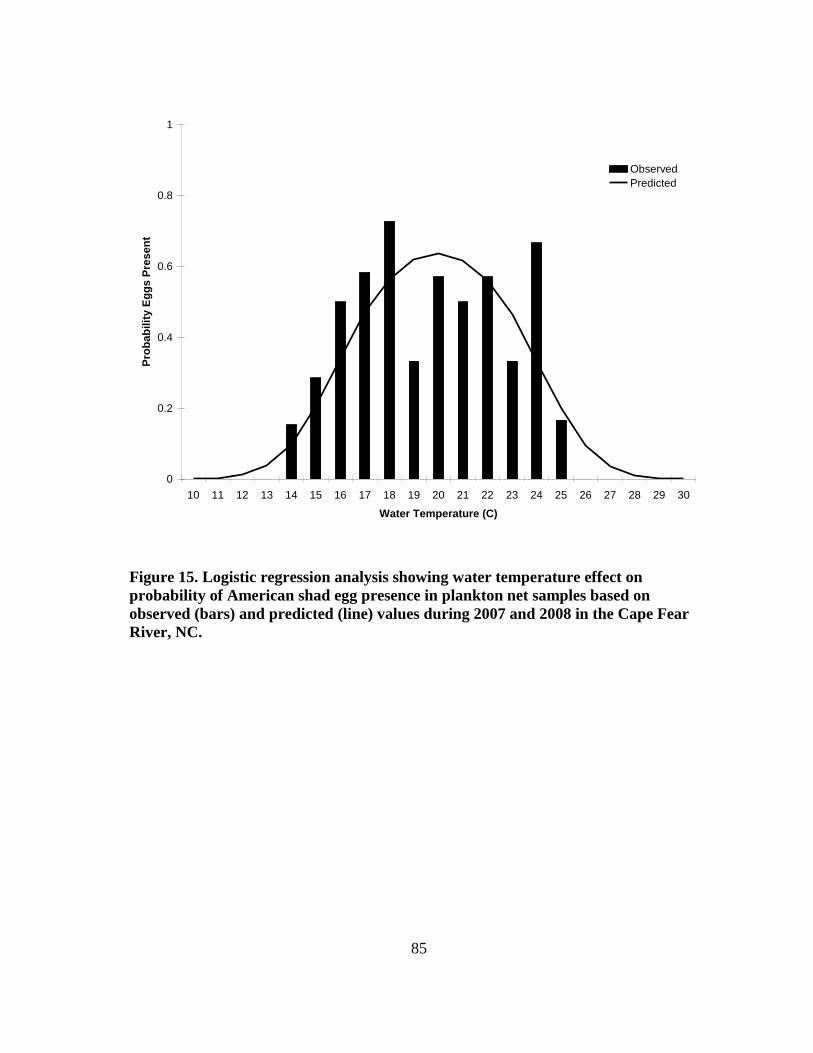
85
0
0.2
0.4
0.6
0.8
1
10 11 12 13 14 15 16 17 18 19 20 21 22 23 24 25 26 27 28 29 30
Water Temperature (C)
Pro
ba
bil
ity
Eg
gs
Pre
se
nt
Observed
Predicted
Figure 15. Logistic regression analysis showing water temperature effect on
probability of American shad egg presence in plankton net samples based on
observed (bars) and predicted (line) values during 2007 and 2008 in the Cape Fear
River, NC.

86
-7.50
-6.50
-5.50
-4.50
-3.50
97 149 186
Start rkmL
S M
ean
s
Figure 16. Estimated least square means of log transformed egg densities for the
three lock and dams, based on a multiple regression model incorporating location,
sampling time and water temperature.
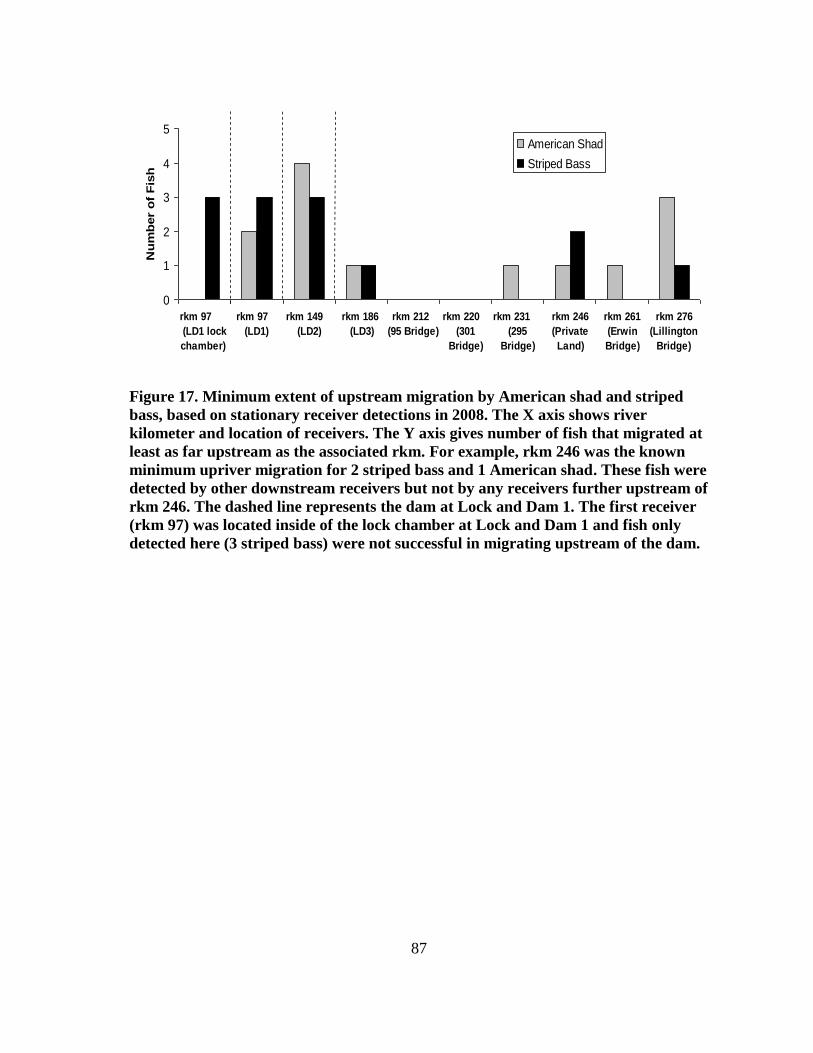
87
0
1
2
3
4
5
rkm 97
(LD1 lock
chamber)
rkm 97
(LD1)
rkm 149
(LD2)
rkm 186
(LD3)
rkm 212
(95 Bridge)
rkm 220
(301
Bridge)
rkm 231
(295
Bridge)
rkm 246
(Private
Land)
rkm 261
(Erwin
Bridge)
rkm 276
(Lillington
Bridge)
Nu
mb
er
of
Fis
hAmerican Shad
Striped Bass
Figure 17. Minimum extent of upstream migration by American shad and striped
bass, based on stationary receiver detections in 2008. The X axis shows river
kilometer and location of receivers. The Y axis gives number of fish that migrated at
least as far upstream as the associated rkm. For example, rkm 246 was the known
minimum upriver migration for 2 striped bass and 1 American shad. These fish were
detected by other downstream receivers but not by any receivers further upstream of
rkm 246. The dashed line represents the dam at Lock and Dam 1. The first receiver
(rkm 97) was located inside of the lock chamber at Lock and Dam 1 and fish only
detected here (3 striped bass) were not successful in migrating upstream of the dam.
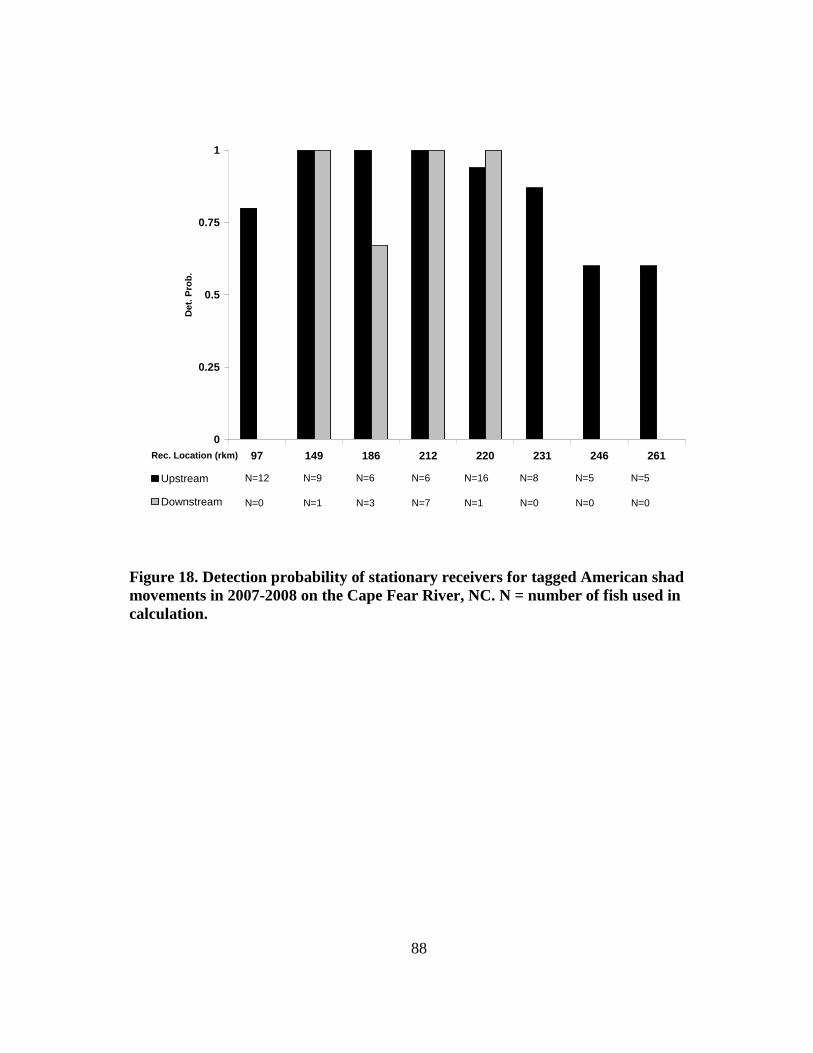
88
0
0.25
0.5
0.75
1
97 149 186 212 220 231 246 261Rec. Location (rkm)
Det.
Pro
b.
Upstream
Downstream
N=12 N=9 N=6 N=6 N=16 N=8 N=5 N=5
N=0 N=1 N=3 N=7 N=1 N=0 N=0 N=0
Figure 18. Detection probability of stationary receivers for tagged American shad
movements in 2007-2008 on the Cape Fear River, NC. N = number of fish used in
calculation.
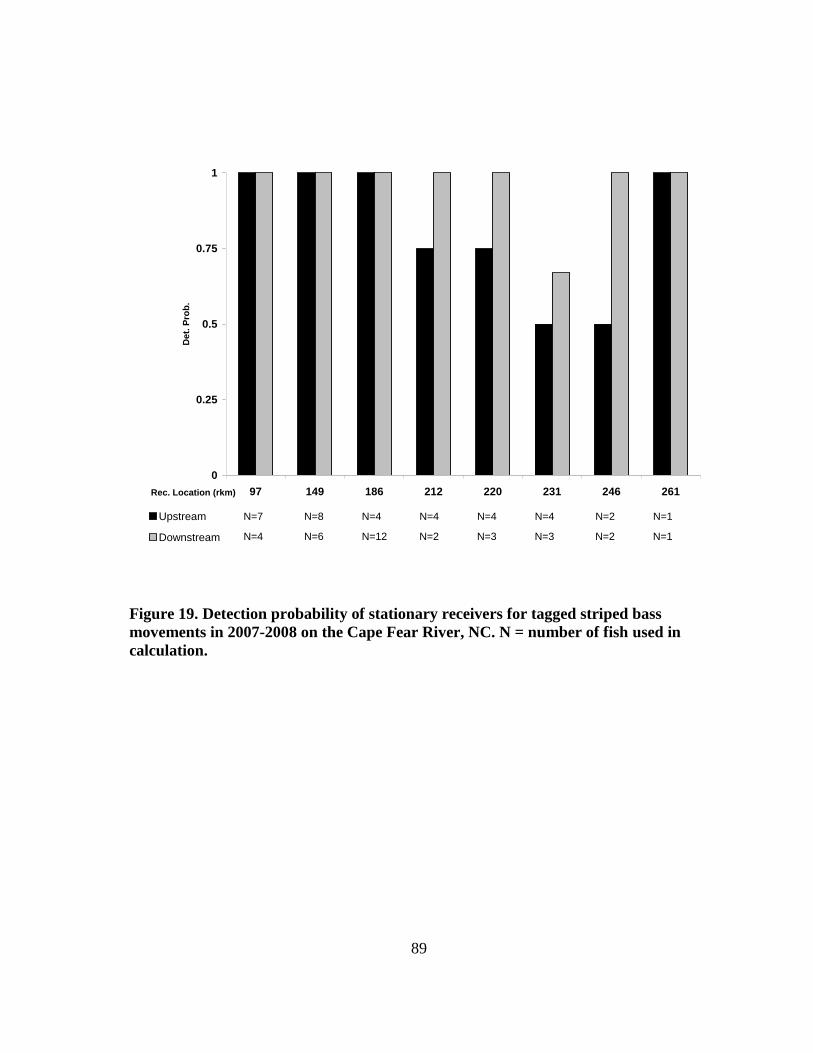
89
0
0.25
0.5
0.75
1
97 149 186 212 220 231 246 261Rec. Location (rkm)
Det.
Pro
b.
Upstream
Downstream
N=7 N=8 N=4 N=4 N=4 N=4 N=2 N=1
N=4 N=6 N=12 N=2 N=3 N=3 N=2 N=1
Figure 19. Detection probability of stationary receivers for tagged striped bass
movements in 2007-2008 on the Cape Fear River, NC. N = number of fish used in
calculation.
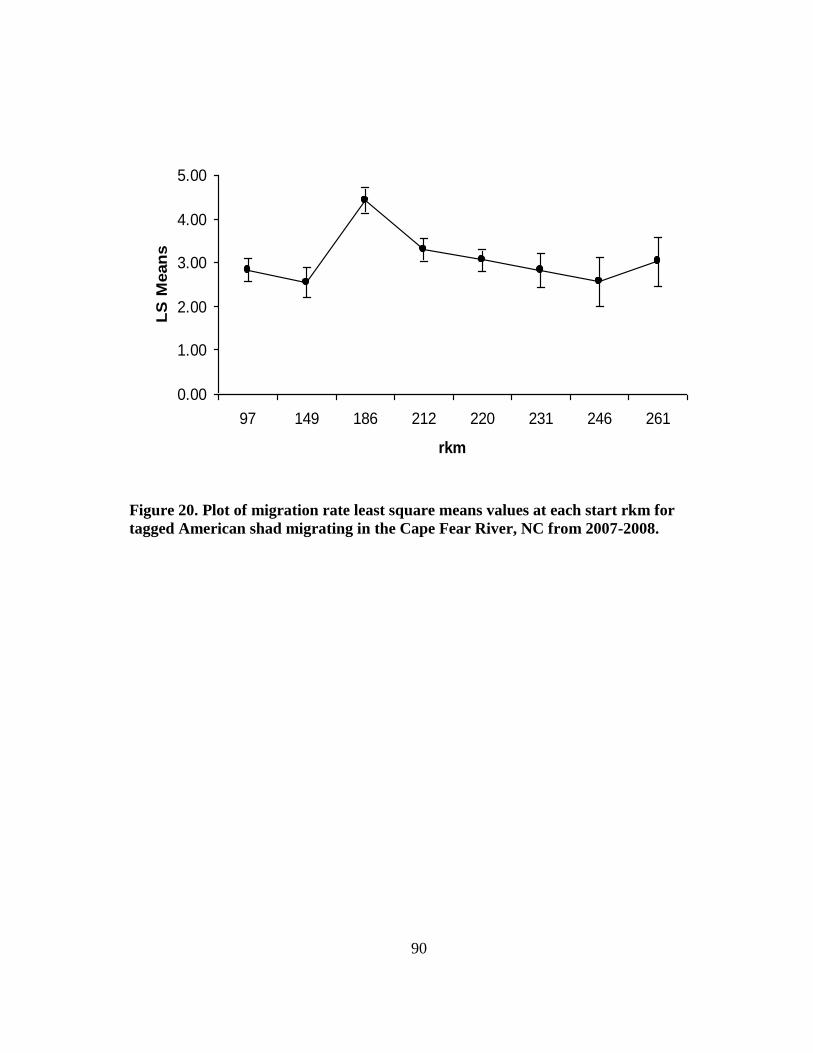
90
0.00
1.00
2.00
3.00
4.00
5.00
97 149 186 212 220 231 246 261
rkm
LS
Mean
s
Figure 20. Plot of migration rate least square means values at each start rkm for
tagged American shad migrating in the Cape Fear River, NC from 2007-2008.

91
0.00
0.50
1.00
1.50
2.00
2.50
97 149 186 212 220 231 246 261
rkm
LS
Mean
s
Figure 21. Plot of migration rate least square means values at each start rkm for
tagged striped bass migrating in the Cape Fear River, NC from 2007-2008.
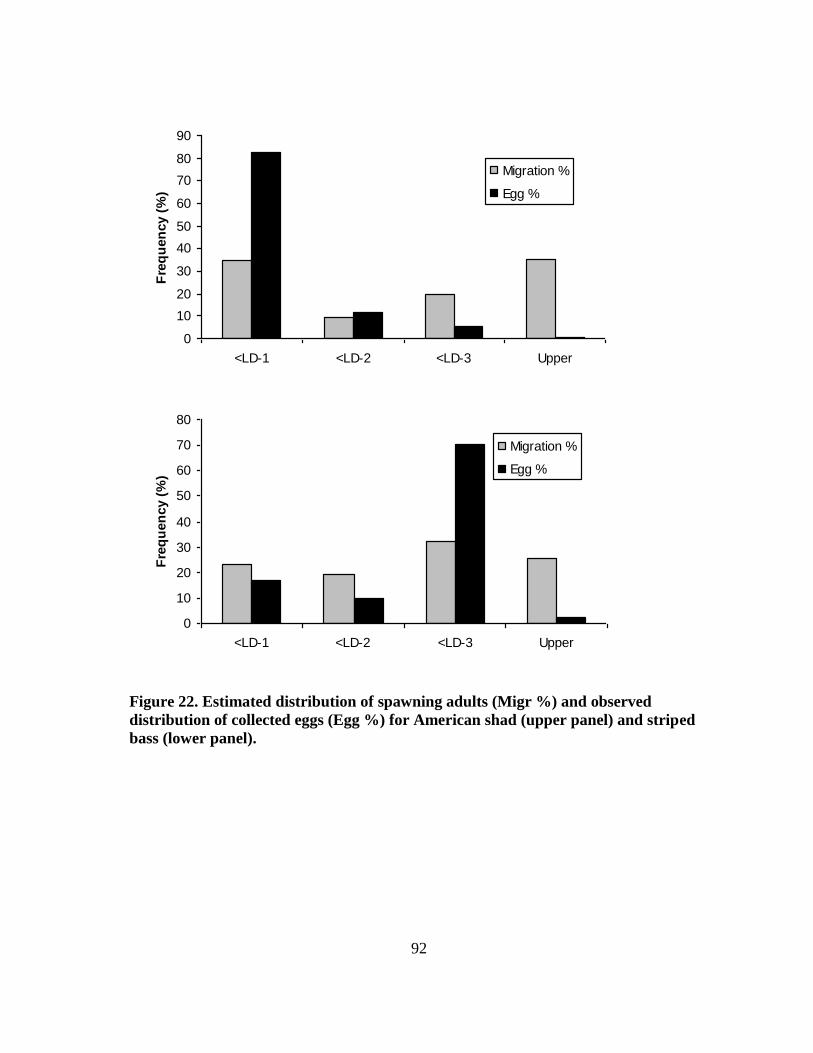
92
0
10
20
30
40
50
60
70
80
90
<LD-1 <LD-2 <LD-3 Upper
Fre
qu
en
cy (
%)
Migration %
Egg %
0
10
20
30
40
50
60
70
80
<LD-1 <LD-2 <LD-3 Upper
Fre
qu
en
cy (
%)
Migration %
Egg %
Figure 22. Estimated distribution of spawning adults (Migr %) and observed
distribution of collected eggs (Egg %) for American shad (upper panel) and striped
bass (lower panel).

93
APPENDICES
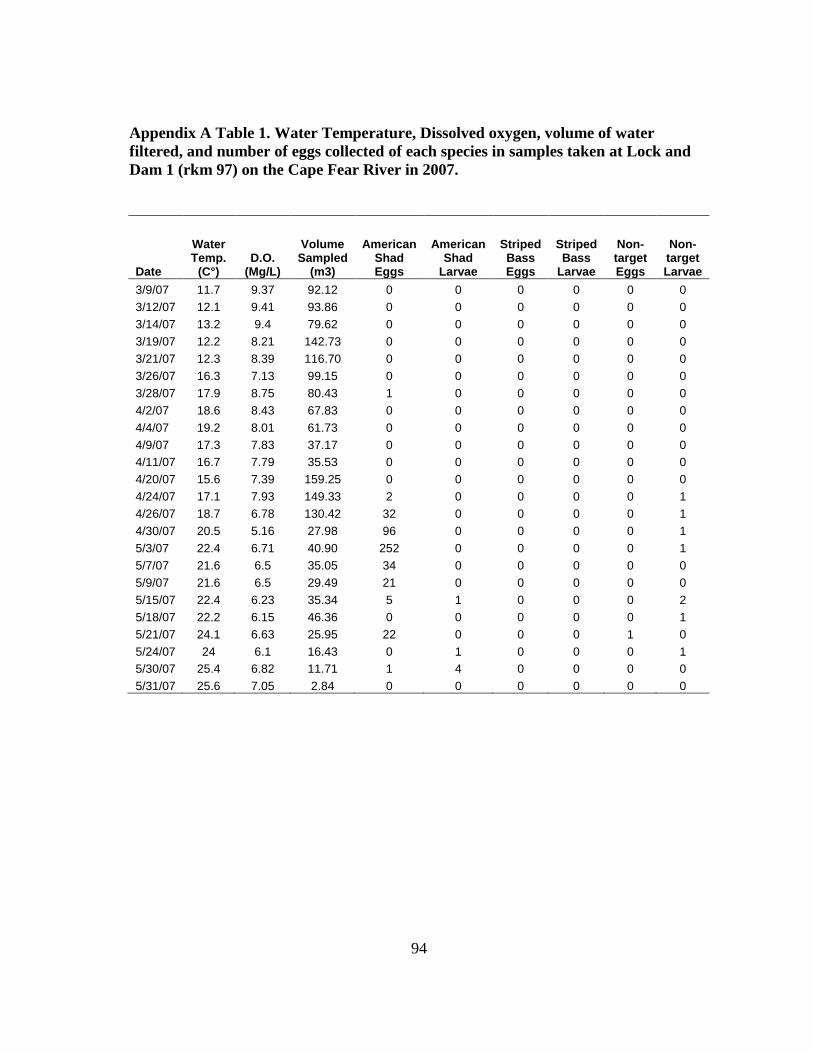
94
Appendix A Table 1. Water Temperature, Dissolved oxygen, volume of water
filtered, and number of eggs collected of each species in samples taken at Lock and
Dam 1 (rkm 97) on the Cape Fear River in 2007.
Date
Water Temp.
(C°) D.O.
(Mg/L)
Volume Sampled
(m3)
American Shad Eggs
American Shad
Larvae
Striped Bass Eggs
Striped Bass
Larvae
Non-target Eggs
Non-target Larvae
3/9/07 11.7 9.37 92.12 0 0 0 0 0 0
3/12/07 12.1 9.41 93.86 0 0 0 0 0 0
3/14/07 13.2 9.4 79.62 0 0 0 0 0 0
3/19/07 12.2 8.21 142.73 0 0 0 0 0 0
3/21/07 12.3 8.39 116.70 0 0 0 0 0 0
3/26/07 16.3 7.13 99.15 0 0 0 0 0 0
3/28/07 17.9 8.75 80.43 1 0 0 0 0 0
4/2/07 18.6 8.43 67.83 0 0 0 0 0 0
4/4/07 19.2 8.01 61.73 0 0 0 0 0 0
4/9/07 17.3 7.83 37.17 0 0 0 0 0 0
4/11/07 16.7 7.79 35.53 0 0 0 0 0 0
4/20/07 15.6 7.39 159.25 0 0 0 0 0 0
4/24/07 17.1 7.93 149.33 2 0 0 0 0 1
4/26/07 18.7 6.78 130.42 32 0 0 0 0 1
4/30/07 20.5 5.16 27.98 96 0 0 0 0 1
5/3/07 22.4 6.71 40.90 252 0 0 0 0 1
5/7/07 21.6 6.5 35.05 34 0 0 0 0 0
5/9/07 21.6 6.5 29.49 21 0 0 0 0 0
5/15/07 22.4 6.23 35.34 5 1 0 0 0 2
5/18/07 22.2 6.15 46.36 0 0 0 0 0 1
5/21/07 24.1 6.63 25.95 22 0 0 0 1 0
5/24/07 24 6.1 16.43 0 1 0 0 0 1
5/30/07 25.4 6.82 11.71 1 4 0 0 0 0
5/31/07 25.6 7.05 2.84 0 0 0 0 0 0
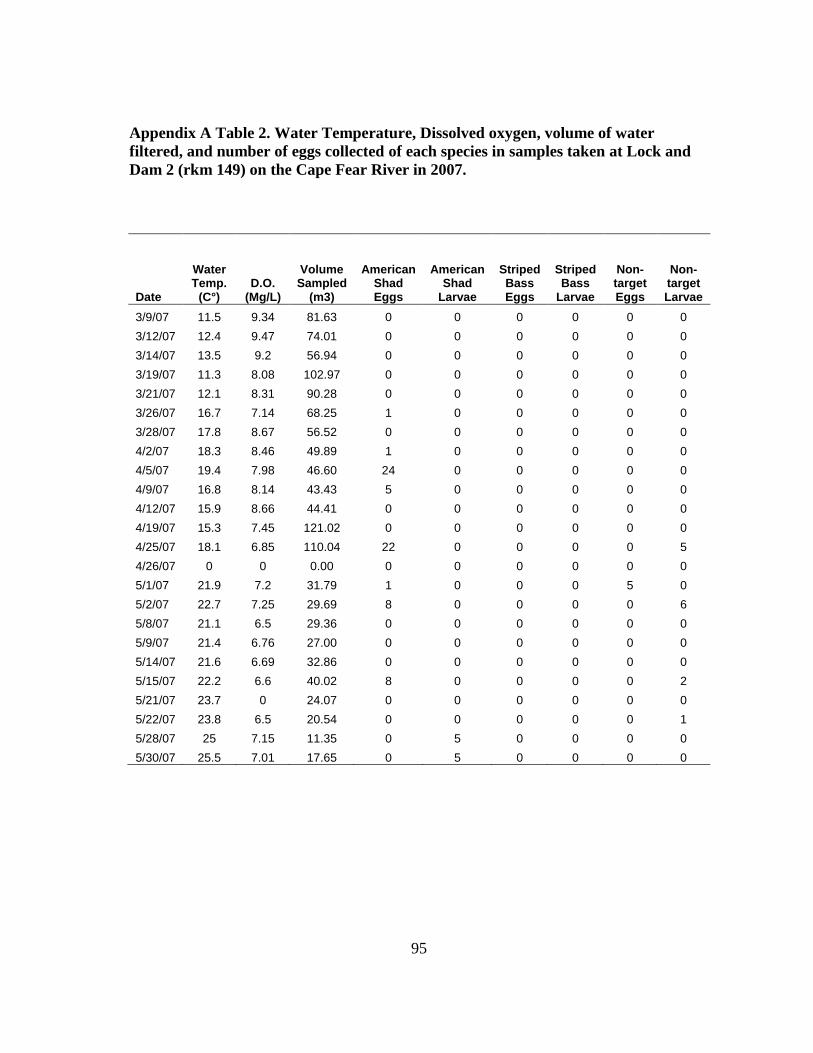
95
Appendix A Table 2. Water Temperature, Dissolved oxygen, volume of water
filtered, and number of eggs collected of each species in samples taken at Lock and
Dam 2 (rkm 149) on the Cape Fear River in 2007.
Date
Water Temp.
(C°) D.O.
(Mg/L)
Volume Sampled
(m3)
American Shad Eggs
American Shad
Larvae
Striped Bass Eggs
Striped Bass
Larvae
Non-target Eggs
Non-target Larvae
3/9/07 11.5 9.34 81.63 0 0 0 0 0 0
3/12/07 12.4 9.47 74.01 0 0 0 0 0 0
3/14/07 13.5 9.2 56.94 0 0 0 0 0 0
3/19/07 11.3 8.08 102.97 0 0 0 0 0 0
3/21/07 12.1 8.31 90.28 0 0 0 0 0 0
3/26/07 16.7 7.14 68.25 1 0 0 0 0 0
3/28/07 17.8 8.67 56.52 0 0 0 0 0 0
4/2/07 18.3 8.46 49.89 1 0 0 0 0 0
4/5/07 19.4 7.98 46.60 24 0 0 0 0 0
4/9/07 16.8 8.14 43.43 5 0 0 0 0 0
4/12/07 15.9 8.66 44.41 0 0 0 0 0 0
4/19/07 15.3 7.45 121.02 0 0 0 0 0 0
4/25/07 18.1 6.85 110.04 22 0 0 0 0 5
4/26/07 0 0 0.00 0 0 0 0 0 0
5/1/07 21.9 7.2 31.79 1 0 0 0 5 0
5/2/07 22.7 7.25 29.69 8 0 0 0 0 6
5/8/07 21.1 6.5 29.36 0 0 0 0 0 0
5/9/07 21.4 6.76 27.00 0 0 0 0 0 0
5/14/07 21.6 6.69 32.86 0 0 0 0 0 0
5/15/07 22.2 6.6 40.02 8 0 0 0 0 2
5/21/07 23.7 0 24.07 0 0 0 0 0 0
5/22/07 23.8 6.5 20.54 0 0 0 0 0 1
5/28/07 25 7.15 11.35 0 5 0 0 0 0
5/30/07 25.5 7.01 17.65 0 5 0 0 0 0
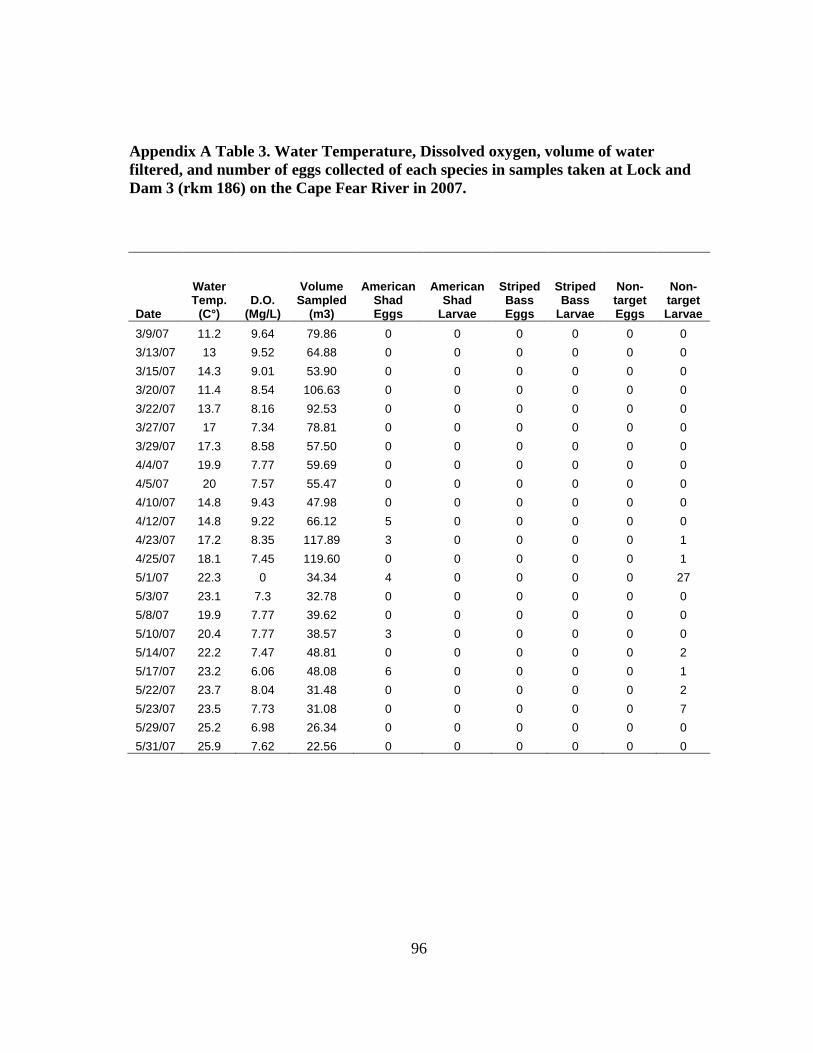
96
Appendix A Table 3. Water Temperature, Dissolved oxygen, volume of water
filtered, and number of eggs collected of each species in samples taken at Lock and
Dam 3 (rkm 186) on the Cape Fear River in 2007.
Date
Water Temp.
(C°) D.O.
(Mg/L)
Volume Sampled
(m3)
American Shad Eggs
American Shad
Larvae
Striped Bass Eggs
Striped Bass
Larvae
Non-target Eggs
Non-target Larvae
3/9/07 11.2 9.64 79.86 0 0 0 0 0 0
3/13/07 13 9.52 64.88 0 0 0 0 0 0
3/15/07 14.3 9.01 53.90 0 0 0 0 0 0
3/20/07 11.4 8.54 106.63 0 0 0 0 0 0
3/22/07 13.7 8.16 92.53 0 0 0 0 0 0
3/27/07 17 7.34 78.81 0 0 0 0 0 0
3/29/07 17.3 8.58 57.50 0 0 0 0 0 0
4/4/07 19.9 7.77 59.69 0 0 0 0 0 0
4/5/07 20 7.57 55.47 0 0 0 0 0 0
4/10/07 14.8 9.43 47.98 0 0 0 0 0 0
4/12/07 14.8 9.22 66.12 5 0 0 0 0 0
4/23/07 17.2 8.35 117.89 3 0 0 0 0 1
4/25/07 18.1 7.45 119.60 0 0 0 0 0 1
5/1/07 22.3 0 34.34 4 0 0 0 0 27
5/3/07 23.1 7.3 32.78 0 0 0 0 0 0
5/8/07 19.9 7.77 39.62 0 0 0 0 0 0
5/10/07 20.4 7.77 38.57 3 0 0 0 0 0
5/14/07 22.2 7.47 48.81 0 0 0 0 0 2
5/17/07 23.2 6.06 48.08 6 0 0 0 0 1
5/22/07 23.7 8.04 31.48 0 0 0 0 0 2
5/23/07 23.5 7.73 31.08 0 0 0 0 0 7
5/29/07 25.2 6.98 26.34 0 0 0 0 0 0
5/31/07 25.9 7.62 22.56 0 0 0 0 0 0

97
Appendix A Table 4. Water Temperature, Dissolved oxygen, volume of water
filtered, and number of eggs collected of each species for samples taken in
Fayetteville, NC (rkm 226) on the Cape Fear River in 2007.
Date
Water Temp.
(C°) D.O.
(Mg/L)
Volume Sampled
(m3)
American Shad Eggs
American Shad
Larvae
Striped Bass Eggs
Striped Bass
Larvae
Non-target Eggs
Non-target Larvae
3/9/07 11.1 9.8 86.46 0 0 0 0 0 0
3/12/07 12.4 9.41 81.58 0 0 0 0 0 0
3/15/07 15.5 8.75 55.77 0 0 0 0 0 0
3/19/07 10.7 8.65 94.96 0 0 0 0 0 0
3/22/07 13.5 8.2 106.58 0 0 0 0 0 0
3/26/07 16.7 7.38 173.34 0 0 0 0 0 0
3/29/07 17.7 8.16 69.26 0 0 0 0 0 0
4/2/07 18.7 8.15 67.34 0 0 0 0 0 0
4/5/07 20.1 7.75 54.16 0 0 0 0 0 0
4/9/07 13.9 9.12 41.45 0 0 0 0 0 0
4/12/07 15.9 8.84 48.20 0 0 0 0 0 0
4/19/07 14.7 8.82 131.74 0 0 0 0 2 0
4/23/07 17.2 7.76 129.89 0 0 0 0 0 0
4/26/07 19.5 6.89 54.81 1 0 0 0 0 3
4/30/07 22.5 6.41 29.25 1 0 0 0 0 0
5/2/07 24 6.7 33.26 0 0 0 0 0 0
5/8/07 19 7.57 25.98 0 0 0 0 0 0
5/10/07 22 7.45 32.00 0 0 0 0 0 0
5/14/07 23.8 6.36 40.54 0 0 0 0 0 1
5/15/07 21.9 6.62 45.51 0 0 0 0 0 7
5/22/07 23.9 8.35 20.51 0 0 0 0 0 0
5/23/07 24 8.23 36.27 0 0 0 0 0 0
5/29/07 27.1 8.57 13.91 0 0 0 0 0 0
5/30/07 27.2 9.53 11.96 0 0 0 0 0 0
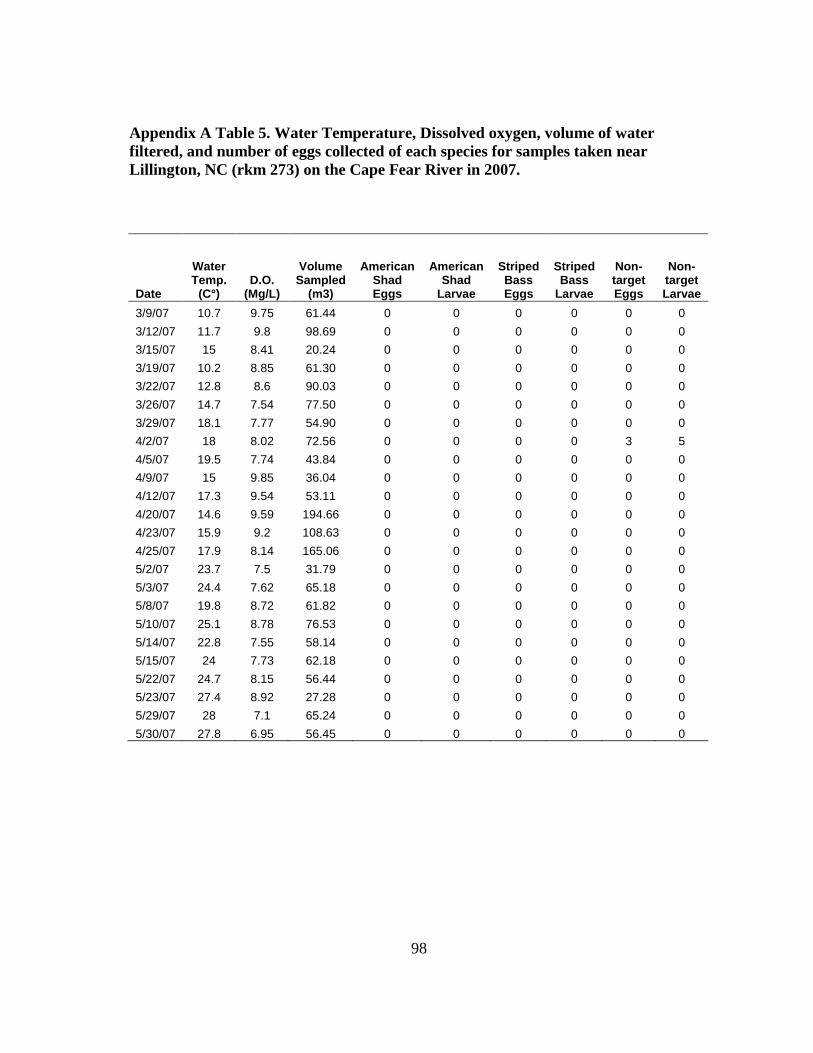
98
Appendix A Table 5. Water Temperature, Dissolved oxygen, volume of water
filtered, and number of eggs collected of each species for samples taken near
Lillington, NC (rkm 273) on the Cape Fear River in 2007.
Date
Water Temp.
(C°) D.O.
(Mg/L)
Volume Sampled
(m3)
American Shad Eggs
American Shad
Larvae
Striped Bass Eggs
Striped Bass
Larvae
Non-target Eggs
Non-target Larvae
3/9/07 10.7 9.75 61.44 0 0 0 0 0 0
3/12/07 11.7 9.8 98.69 0 0 0 0 0 0
3/15/07 15 8.41 20.24 0 0 0 0 0 0
3/19/07 10.2 8.85 61.30 0 0 0 0 0 0
3/22/07 12.8 8.6 90.03 0 0 0 0 0 0
3/26/07 14.7 7.54 77.50 0 0 0 0 0 0
3/29/07 18.1 7.77 54.90 0 0 0 0 0 0
4/2/07 18 8.02 72.56 0 0 0 0 3 5
4/5/07 19.5 7.74 43.84 0 0 0 0 0 0
4/9/07 15 9.85 36.04 0 0 0 0 0 0
4/12/07 17.3 9.54 53.11 0 0 0 0 0 0
4/20/07 14.6 9.59 194.66 0 0 0 0 0 0
4/23/07 15.9 9.2 108.63 0 0 0 0 0 0
4/25/07 17.9 8.14 165.06 0 0 0 0 0 0
5/2/07 23.7 7.5 31.79 0 0 0 0 0 0
5/3/07 24.4 7.62 65.18 0 0 0 0 0 0
5/8/07 19.8 8.72 61.82 0 0 0 0 0 0
5/10/07 25.1 8.78 76.53 0 0 0 0 0 0
5/14/07 22.8 7.55 58.14 0 0 0 0 0 0
5/15/07 24 7.73 62.18 0 0 0 0 0 0
5/22/07 24.7 8.15 56.44 0 0 0 0 0 0
5/23/07 27.4 8.92 27.28 0 0 0 0 0 0
5/29/07 28 7.1 65.24 0 0 0 0 0 0
5/30/07 27.8 6.95 56.45 0 0 0 0 0 0

99
Appendix A Table 6. Water Temperature, Dissolved oxygen, volume of water
filtered, and number of eggs collected of each species in samples taken at Lock and
Dam 1 (rkm 97) on the Cape Fear River in 2008.
Date
Water Temp.
(C°) D.O.
(Mg/L)
Volume Sampled
(m3)
American Shad Eggs
American Shad
Larvae
Striped Bass Eggs
Striped Bass
Larvae
Non-target Eggs
Non-target Larvae
3/5/08 13.2 11.57 87.13 0 0 0 0 0 0
3/10/08 13.3 9.78 131.96 0 0 0 0 0 0
3/13/08 12.7 11.17 95.63 0 0 0 0 0 0
3/18/08 14.2 10.92 88.36 0 0 0 0 0 0
3/20/08 14.5 9.64 101.80 0 0 0 0 0 0
3/24/08 14.9 9.19 73.87 0 0 0 0 0 0
3/25/08 14.3 9.47 36.27 0 0 0 0 0 0
3/27/08 14.8 9.10 64.22 0 0 0 0 0 0
4/1/08 15.5 9.38 68.50 0 0 0 0 0 0
4/3/08 15.8 9.05 110.00 0 0 0 0 0 0
4/7/08 15.9 7.12 125.02 0 0 0 0 0 1
4/9/08 15.4 8.09 132.25 0 0 0 0 0 0
4/15/08 18.0 8.88 97.01 4 0 0 0 0 0
4/17/08 17.1 9.27 95.06 0 0 0 0 0 0
4/21/08 17.9 9.59 76.39 1 0 0 0 0 0
4/23/08 18.7 9.33 90.98 4 0 0 0 0 0
4/30/08 20.5 8.29 31.91 159 0 0 1 0 0
5/1/08 20.6 8.00 105.89 0 0 6 1 0 3
5/7/08 21.2 7.26 43.81 0 0 0 0 2 2
5/8/08 21.6 7.06 36.67 9 0 0 0 1 0
5/12/08 22.4 6.52 30.63 5 0 0 0 0 0
5/12/08 22.3 6.58 39.20 9 0 0 0 0 1
5/12/08 22.3 6.54 33.75 0 0 0 0 0 1
5/12/08 22.3 6.56 36.74 0 0 0 0 0 0
5/15/08 22.1 7.71 75.16 90 0 1 1 4 0
5/19/08 22.1 8.10 73.27 80 0 0 0 3 2
5/19/08 22.0 8.11 74.92 53 0 0 0 1 0
5/19/08 21.9 8.09 81.02 17 0 0 0 0 0
5/19/08 21.9 8.00 68.60 1 0 0 0 0 0
5/23/08 22.6 7.73 50.52 0 0 0 0 0 0
5/27/08 23.8 7.80 34.25 139 3 0 0 0 1
5/29/08 24.0 7.25 28.10 29 3 0 0 0 0
6/4/08 26.1 7.08 13.75 0 0 0 0 0 0
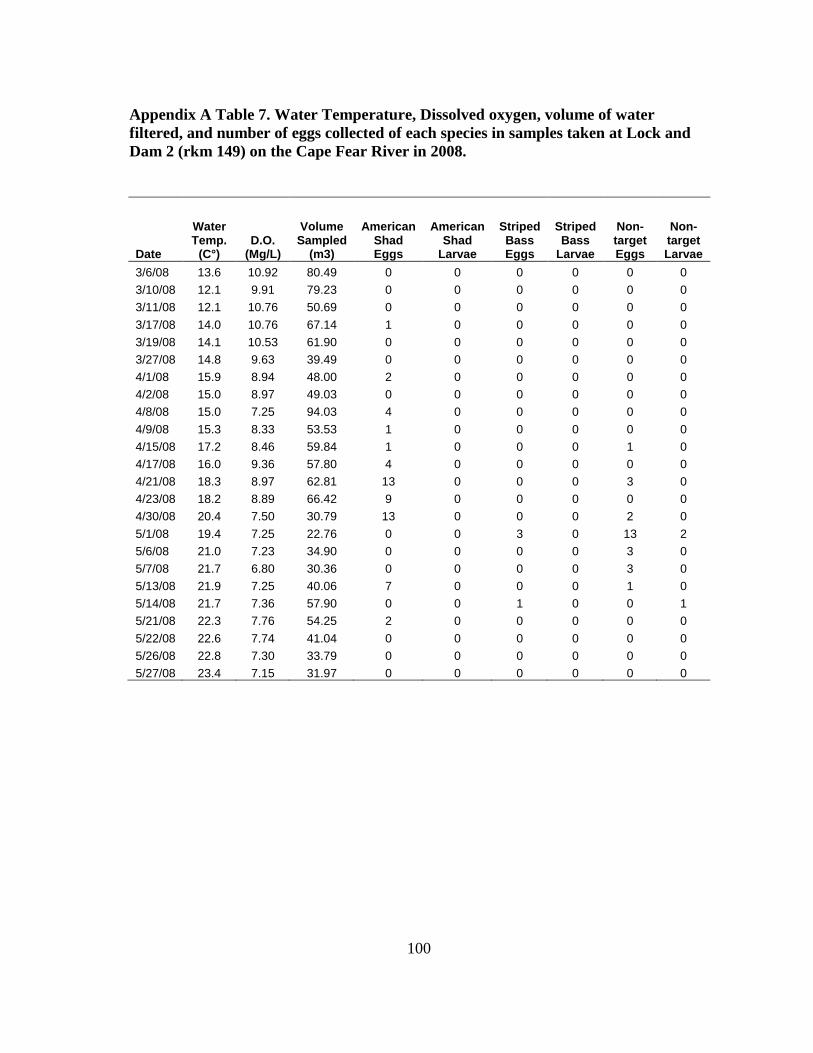
100
Appendix A Table 7. Water Temperature, Dissolved oxygen, volume of water
filtered, and number of eggs collected of each species in samples taken at Lock and
Dam 2 (rkm 149) on the Cape Fear River in 2008.
Date
Water Temp.
(C°) D.O.
(Mg/L)
Volume Sampled
(m3)
American Shad Eggs
American Shad
Larvae
Striped Bass Eggs
Striped Bass
Larvae
Non-target Eggs
Non-target Larvae
3/6/08 13.6 10.92 80.49 0 0 0 0 0 0
3/10/08 12.1 9.91 79.23 0 0 0 0 0 0
3/11/08 12.1 10.76 50.69 0 0 0 0 0 0
3/17/08 14.0 10.76 67.14 1 0 0 0 0 0
3/19/08 14.1 10.53 61.90 0 0 0 0 0 0
3/27/08 14.8 9.63 39.49 0 0 0 0 0 0
4/1/08 15.9 8.94 48.00 2 0 0 0 0 0
4/2/08 15.0 8.97 49.03 0 0 0 0 0 0
4/8/08 15.0 7.25 94.03 4 0 0 0 0 0
4/9/08 15.3 8.33 53.53 1 0 0 0 0 0
4/15/08 17.2 8.46 59.84 1 0 0 0 1 0
4/17/08 16.0 9.36 57.80 4 0 0 0 0 0
4/21/08 18.3 8.97 62.81 13 0 0 0 3 0
4/23/08 18.2 8.89 66.42 9 0 0 0 0 0
4/30/08 20.4 7.50 30.79 13 0 0 0 2 0
5/1/08 19.4 7.25 22.76 0 0 3 0 13 2
5/6/08 21.0 7.23 34.90 0 0 0 0 3 0
5/7/08 21.7 6.80 30.36 0 0 0 0 3 0
5/13/08 21.9 7.25 40.06 7 0 0 0 1 0
5/14/08 21.7 7.36 57.90 0 0 1 0 0 1
5/21/08 22.3 7.76 54.25 2 0 0 0 0 0
5/22/08 22.6 7.74 41.04 0 0 0 0 0 0
5/26/08 22.8 7.30 33.79 0 0 0 0 0 0
5/27/08 23.4 7.15 31.97 0 0 0 0 0 0
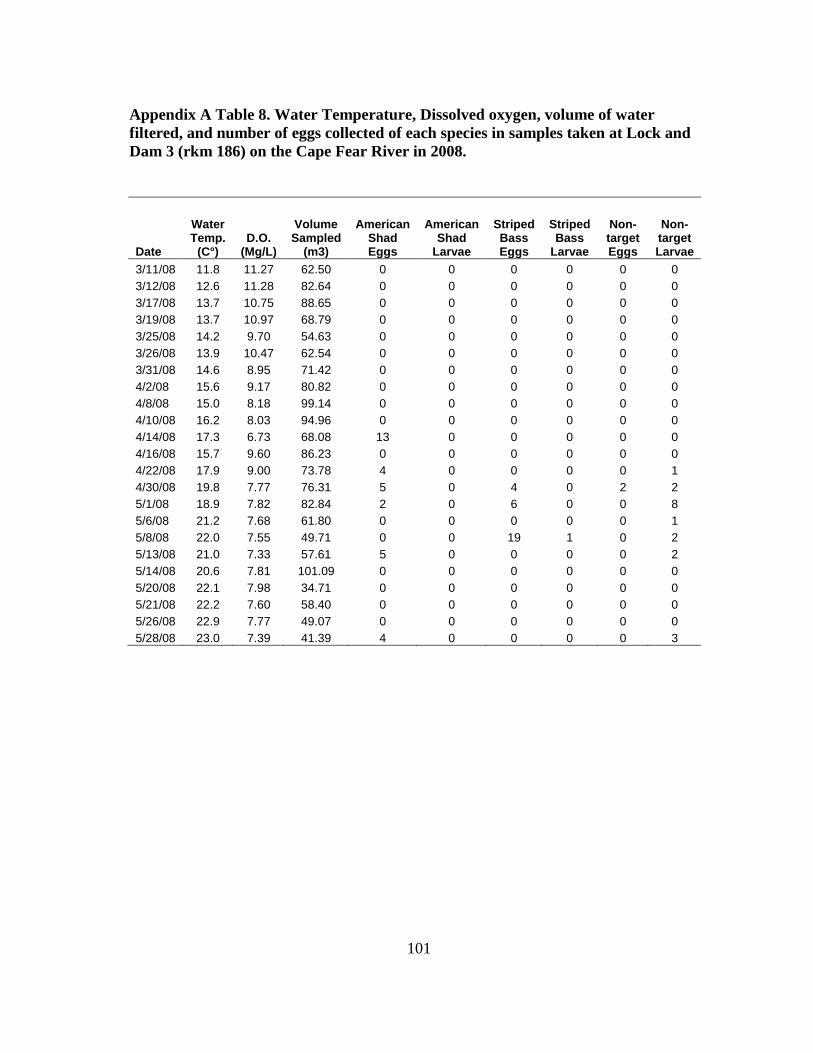
101
Appendix A Table 8. Water Temperature, Dissolved oxygen, volume of water
filtered, and number of eggs collected of each species in samples taken at Lock and
Dam 3 (rkm 186) on the Cape Fear River in 2008.
Date
Water Temp.
(C°) D.O.
(Mg/L)
Volume Sampled
(m3)
American Shad Eggs
American Shad
Larvae
Striped Bass Eggs
Striped Bass
Larvae
Non-target Eggs
Non-target Larvae
3/11/08 11.8 11.27 62.50 0 0 0 0 0 0
3/12/08 12.6 11.28 82.64 0 0 0 0 0 0
3/17/08 13.7 10.75 88.65 0 0 0 0 0 0
3/19/08 13.7 10.97 68.79 0 0 0 0 0 0
3/25/08 14.2 9.70 54.63 0 0 0 0 0 0
3/26/08 13.9 10.47 62.54 0 0 0 0 0 0
3/31/08 14.6 8.95 71.42 0 0 0 0 0 0
4/2/08 15.6 9.17 80.82 0 0 0 0 0 0
4/8/08 15.0 8.18 99.14 0 0 0 0 0 0
4/10/08 16.2 8.03 94.96 0 0 0 0 0 0
4/14/08 17.3 6.73 68.08 13 0 0 0 0 0
4/16/08 15.7 9.60 86.23 0 0 0 0 0 0
4/22/08 17.9 9.00 73.78 4 0 0 0 0 1
4/30/08 19.8 7.77 76.31 5 0 4 0 2 2
5/1/08 18.9 7.82 82.84 2 0 6 0 0 8
5/6/08 21.2 7.68 61.80 0 0 0 0 0 1
5/8/08 22.0 7.55 49.71 0 0 19 1 0 2
5/13/08 21.0 7.33 57.61 5 0 0 0 0 2
5/14/08 20.6 7.81 101.09 0 0 0 0 0 0
5/20/08 22.1 7.98 34.71 0 0 0 0 0 0
5/21/08 22.2 7.60 58.40 0 0 0 0 0 0
5/26/08 22.9 7.77 49.07 0 0 0 0 0 0
5/28/08 23.0 7.39 41.39 4 0 0 0 0 3
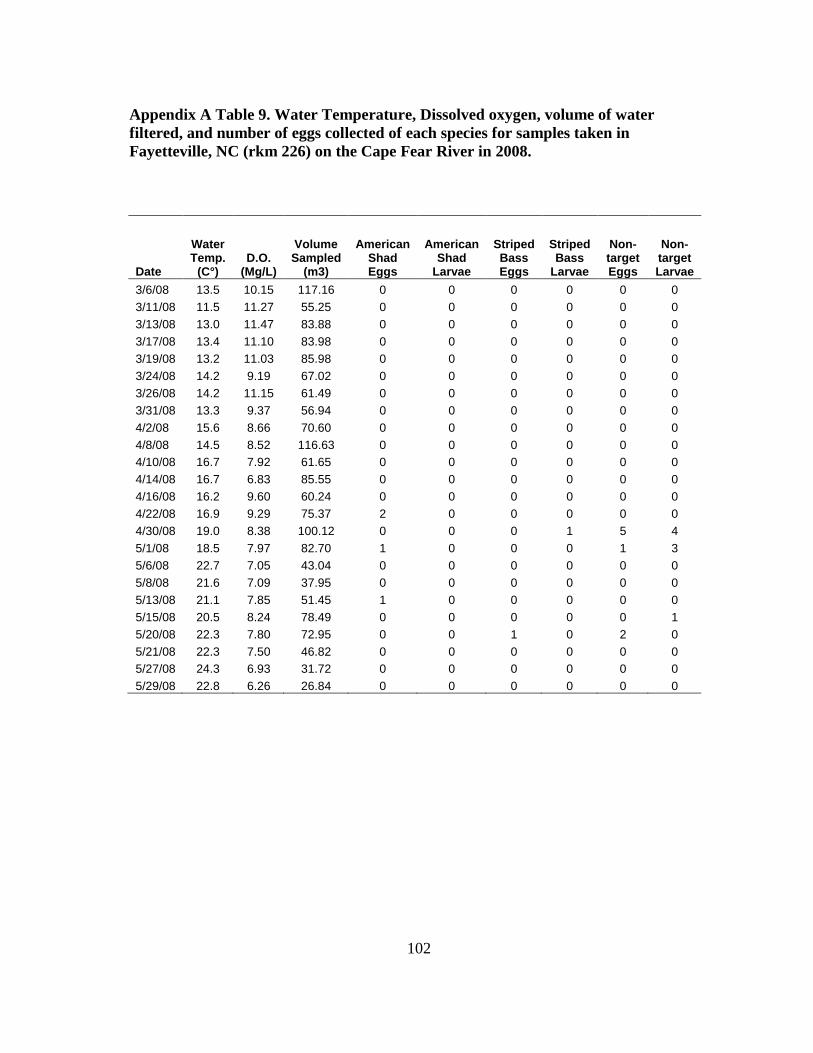
102
Appendix A Table 9. Water Temperature, Dissolved oxygen, volume of water
filtered, and number of eggs collected of each species for samples taken in
Fayetteville, NC (rkm 226) on the Cape Fear River in 2008.
Date
Water Temp.
(C°) D.O.
(Mg/L)
Volume Sampled
(m3)
American Shad Eggs
American Shad
Larvae
Striped Bass Eggs
Striped Bass
Larvae
Non-target Eggs
Non-target Larvae
3/6/08 13.5 10.15 117.16 0 0 0 0 0 0
3/11/08 11.5 11.27 55.25 0 0 0 0 0 0
3/13/08 13.0 11.47 83.88 0 0 0 0 0 0
3/17/08 13.4 11.10 83.98 0 0 0 0 0 0
3/19/08 13.2 11.03 85.98 0 0 0 0 0 0
3/24/08 14.2 9.19 67.02 0 0 0 0 0 0
3/26/08 14.2 11.15 61.49 0 0 0 0 0 0
3/31/08 13.3 9.37 56.94 0 0 0 0 0 0
4/2/08 15.6 8.66 70.60 0 0 0 0 0 0
4/8/08 14.5 8.52 116.63 0 0 0 0 0 0
4/10/08 16.7 7.92 61.65 0 0 0 0 0 0
4/14/08 16.7 6.83 85.55 0 0 0 0 0 0
4/16/08 16.2 9.60 60.24 0 0 0 0 0 0
4/22/08 16.9 9.29 75.37 2 0 0 0 0 0
4/30/08 19.0 8.38 100.12 0 0 0 1 5 4
5/1/08 18.5 7.97 82.70 1 0 0 0 1 3
5/6/08 22.7 7.05 43.04 0 0 0 0 0 0
5/8/08 21.6 7.09 37.95 0 0 0 0 0 0
5/13/08 21.1 7.85 51.45 1 0 0 0 0 0
5/15/08 20.5 8.24 78.49 0 0 0 0 0 1
5/20/08 22.3 7.80 72.95 0 0 1 0 2 0
5/21/08 22.3 7.50 46.82 0 0 0 0 0 0
5/27/08 24.3 6.93 31.72 0 0 0 0 0 0
5/29/08 22.8 6.26 26.84 0 0 0 0 0 0
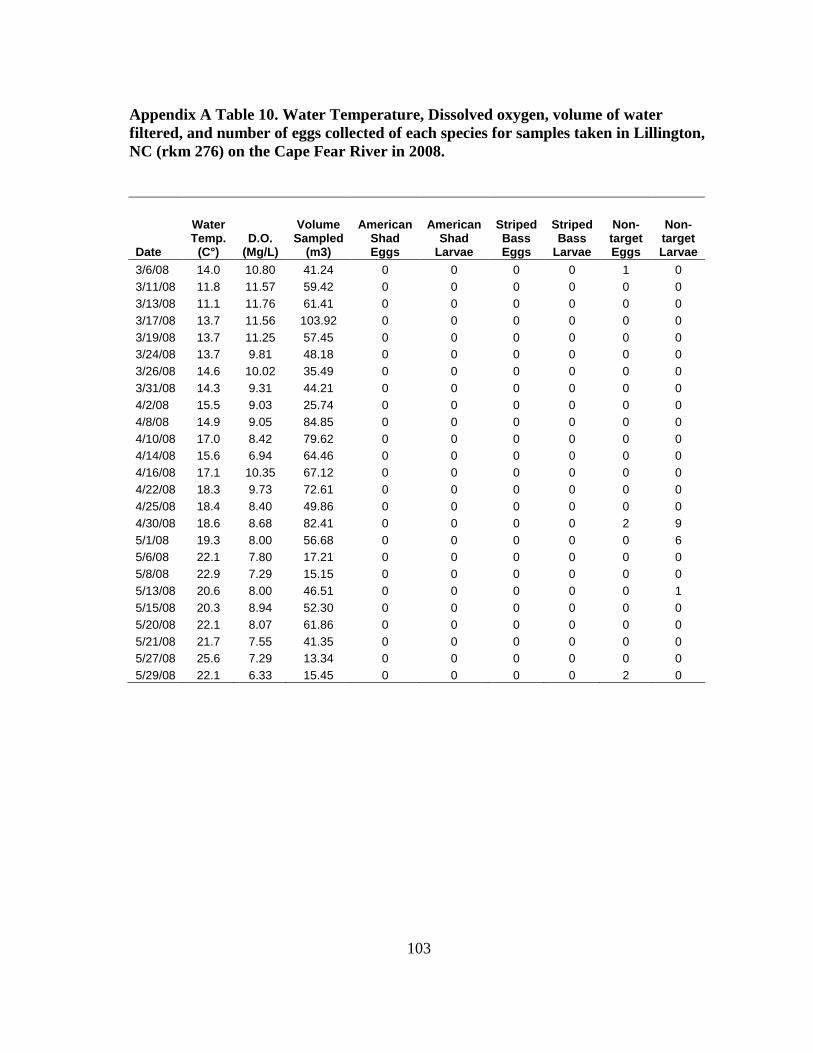
103
Appendix A Table 10. Water Temperature, Dissolved oxygen, volume of water
filtered, and number of eggs collected of each species for samples taken in Lillington,
NC (rkm 276) on the Cape Fear River in 2008.
Date
Water Temp.
(C°) D.O.
(Mg/L)
Volume Sampled
(m3)
American Shad Eggs
American Shad
Larvae
Striped Bass Eggs
Striped Bass
Larvae
Non-target Eggs
Non-target Larvae
3/6/08 14.0 10.80 41.24 0 0 0 0 1 0
3/11/08 11.8 11.57 59.42 0 0 0 0 0 0
3/13/08 11.1 11.76 61.41 0 0 0 0 0 0
3/17/08 13.7 11.56 103.92 0 0 0 0 0 0
3/19/08 13.7 11.25 57.45 0 0 0 0 0 0
3/24/08 13.7 9.81 48.18 0 0 0 0 0 0
3/26/08 14.6 10.02 35.49 0 0 0 0 0 0
3/31/08 14.3 9.31 44.21 0 0 0 0 0 0
4/2/08 15.5 9.03 25.74 0 0 0 0 0 0
4/8/08 14.9 9.05 84.85 0 0 0 0 0 0
4/10/08 17.0 8.42 79.62 0 0 0 0 0 0
4/14/08 15.6 6.94 64.46 0 0 0 0 0 0
4/16/08 17.1 10.35 67.12 0 0 0 0 0 0
4/22/08 18.3 9.73 72.61 0 0 0 0 0 0
4/25/08 18.4 8.40 49.86 0 0 0 0 0 0
4/30/08 18.6 8.68 82.41 0 0 0 0 2 9
5/1/08 19.3 8.00 56.68 0 0 0 0 0 6
5/6/08 22.1 7.80 17.21 0 0 0 0 0 0
5/8/08 22.9 7.29 15.15 0 0 0 0 0 0
5/13/08 20.6 8.00 46.51 0 0 0 0 0 1
5/15/08 20.3 8.94 52.30 0 0 0 0 0 0
5/20/08 22.1 8.07 61.86 0 0 0 0 0 0
5/21/08 21.7 7.55 41.35 0 0 0 0 0 0
5/27/08 25.6 7.29 13.34 0 0 0 0 0 0
5/29/08 22.1 6.33 15.45 0 0 0 0 2 0

104
90
120
150
180
210
240
270
300
24-Apr 1-May 8-May 15-May 22-May 29-May 5-Jun 12-Jun
Date
rkm
2415
2418
2422
2424
2426
Appendix B Figure 1. Movement of tagged American shad, released on April 24,
2007 at river km 219 in the Cape Fear River, NC. Locations are based on results of
both stationary receivers and manual tracking. Legend numbers correspond to tag
numbers of individual fish.
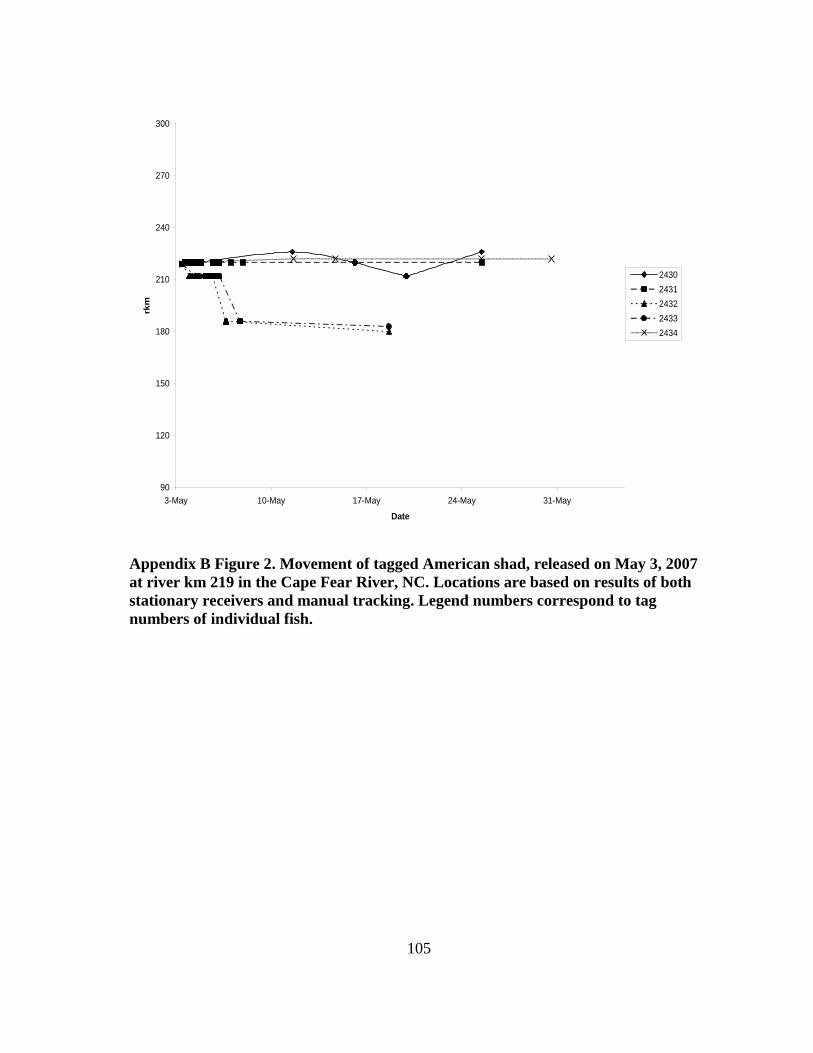
105
90
120
150
180
210
240
270
300
3-May 10-May 17-May 24-May 31-May
Date
rkm
2430
2431
2432
2433
2434
Appendix B Figure 2. Movement of tagged American shad, released on May 3, 2007
at river km 219 in the Cape Fear River, NC. Locations are based on results of both
stationary receivers and manual tracking. Legend numbers correspond to tag
numbers of individual fish.
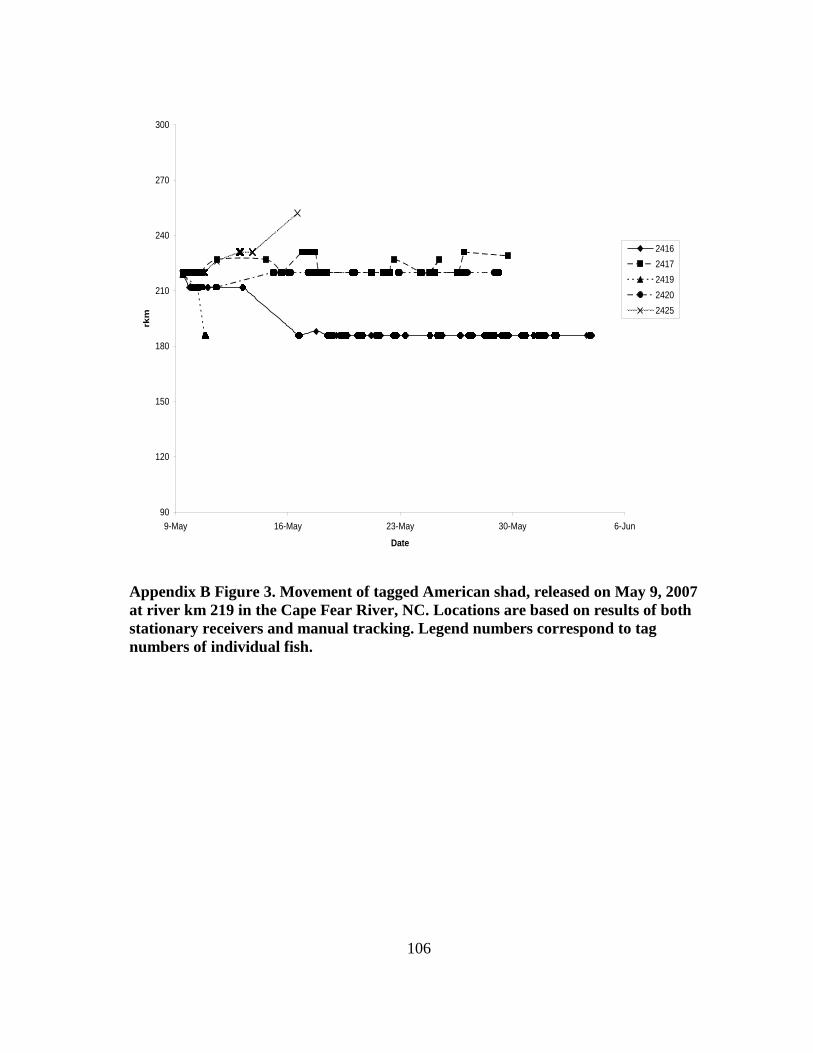
106
90
120
150
180
210
240
270
300
9-May 16-May 23-May 30-May 6-Jun
Date
rkm
2416
2417
2419
2420
2425
Appendix B Figure 3. Movement of tagged American shad, released on May 9, 2007
at river km 219 in the Cape Fear River, NC. Locations are based on results of both
stationary receivers and manual tracking. Legend numbers correspond to tag
numbers of individual fish.
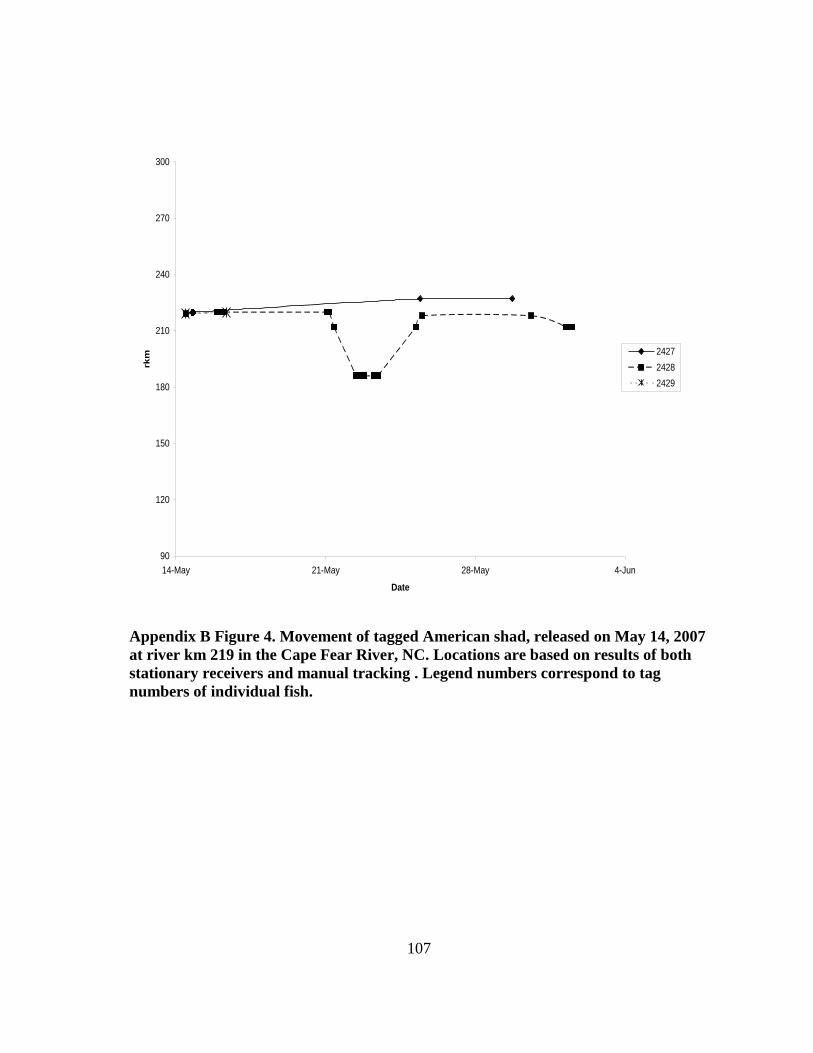
107
90
120
150
180
210
240
270
300
14-May 21-May 28-May 4-Jun
Date
rkm
2427
2428
2429
Appendix B Figure 4. Movement of tagged American shad, released on May 14, 2007
at river km 219 in the Cape Fear River, NC. Locations are based on results of both
stationary receivers and manual tracking . Legend numbers correspond to tag
numbers of individual fish.
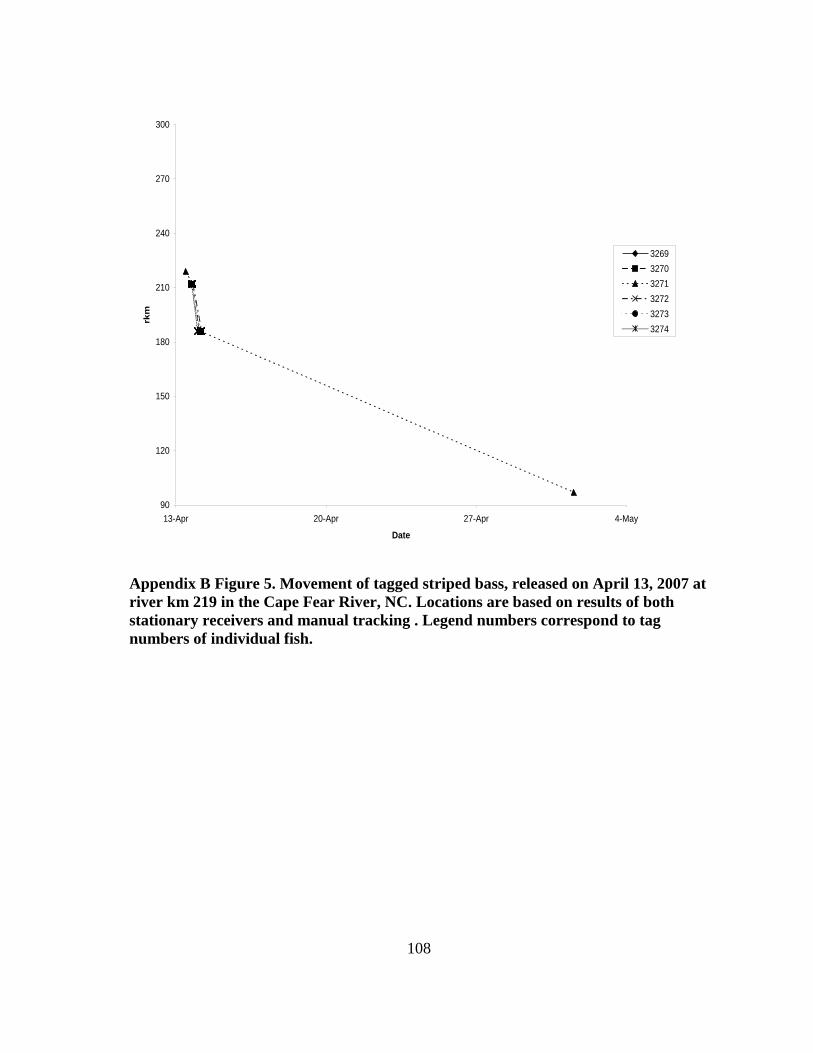
108
90
120
150
180
210
240
270
300
13-Apr 20-Apr 27-Apr 4-May
Date
rkm
3269
3270
3271
3272
3273
3274
Appendix B Figure 5. Movement of tagged striped bass, released on April 13, 2007 at
river km 219 in the Cape Fear River, NC. Locations are based on results of both
stationary receivers and manual tracking . Legend numbers correspond to tag
numbers of individual fish.
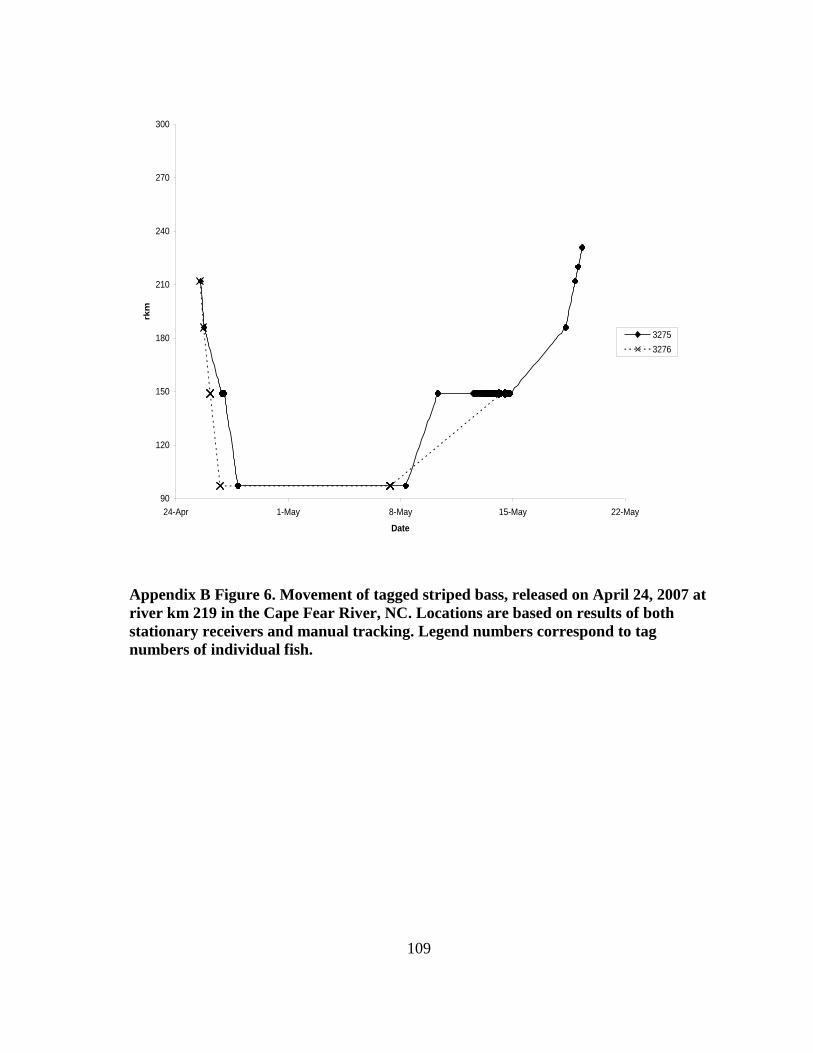
109
90
120
150
180
210
240
270
300
24-Apr 1-May 8-May 15-May 22-May
Date
rkm
3275
3276
Appendix B Figure 6. Movement of tagged striped bass, released on April 24, 2007 at
river km 219 in the Cape Fear River, NC. Locations are based on results of both
stationary receivers and manual tracking. Legend numbers correspond to tag
numbers of individual fish.
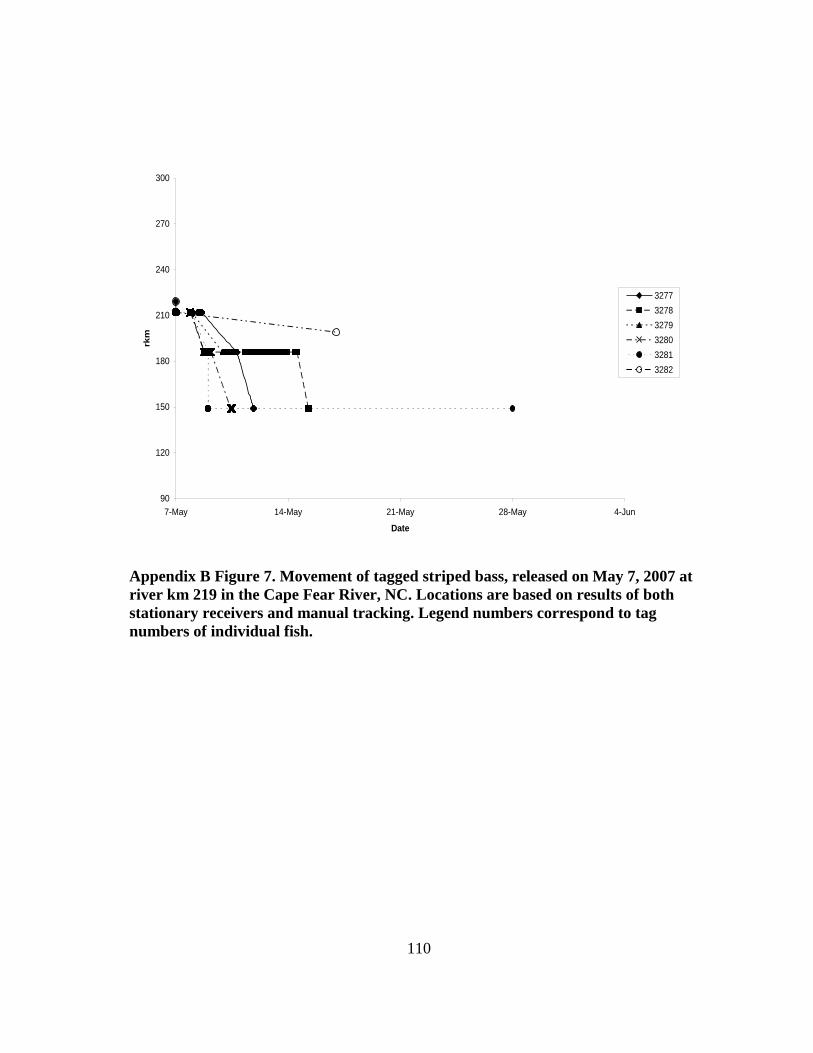
110
90
120
150
180
210
240
270
300
7-May 14-May 21-May 28-May 4-Jun
Date
rkm
3277
3278
3279
3280
3281
3282
Appendix B Figure 7. Movement of tagged striped bass, released on May 7, 2007 at
river km 219 in the Cape Fear River, NC. Locations are based on results of both
stationary receivers and manual tracking. Legend numbers correspond to tag
numbers of individual fish.
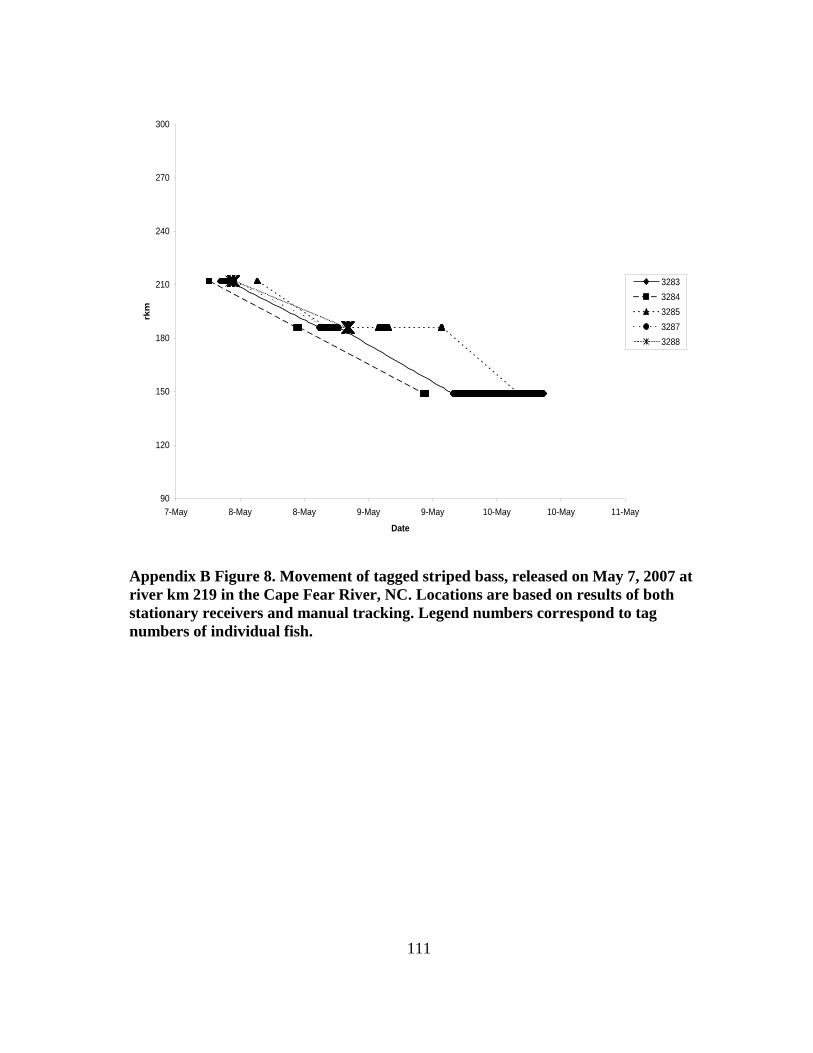
111
90
120
150
180
210
240
270
300
7-May 8-May 8-May 9-May 9-May 10-May 10-May 11-May
Date
rkm
3283
3284
3285
3287
3288
Appendix B Figure 8. Movement of tagged striped bass, released on May 7, 2007 at
river km 219 in the Cape Fear River, NC. Locations are based on results of both
stationary receivers and manual tracking. Legend numbers correspond to tag
numbers of individual fish.
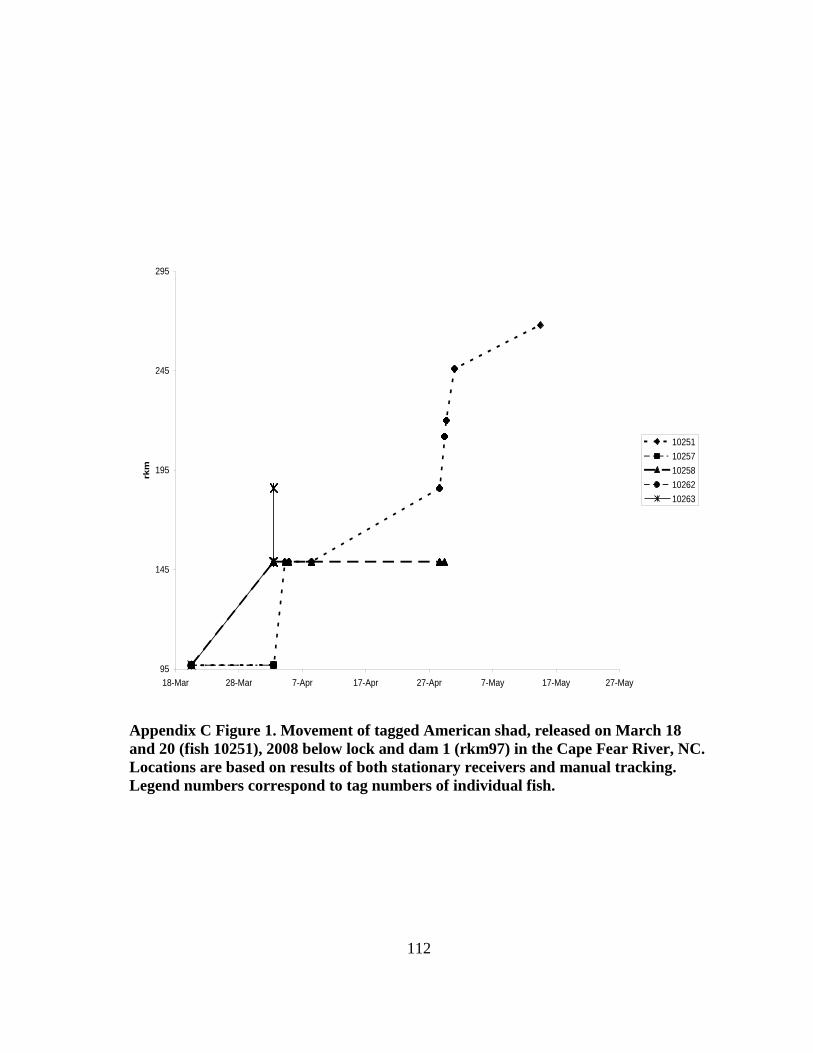
112
95
145
195
245
295
18-Mar 28-Mar 7-Apr 17-Apr 27-Apr 7-May 17-May 27-May
rkm
10251
10257
10258
10262
10263
Appendix C Figure 1. Movement of tagged American shad, released on March 18
and 20 (fish 10251), 2008 below lock and dam 1 (rkm97) in the Cape Fear River, NC.
Locations are based on results of both stationary receivers and manual tracking.
Legend numbers correspond to tag numbers of individual fish.

113
95
145
195
245
295
25-Mar 4-Apr 14-Apr 24-Apr 4-May 14-May 24-May
10245
10246
10247
10248
10249
Appendix C Figure 2. Movement of tagged American shad, caught and released
inside the lock chamber at lock and dam 1 (rkm97) on March 25, 2008 in the Cape
Fear River, NC. Locations are based on results of both stationary receivers and
manual tracking. Legend numbers correspond to tag numbers of individual fish.
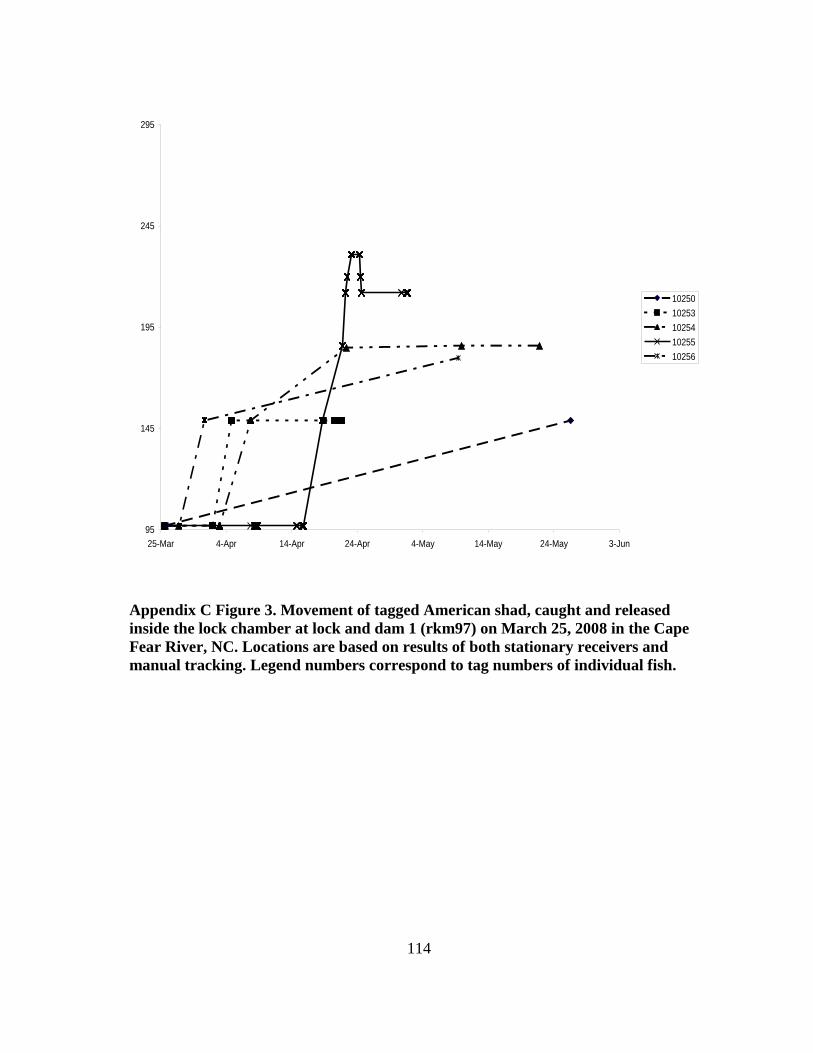
114
95
145
195
245
295
25-Mar 4-Apr 14-Apr 24-Apr 4-May 14-May 24-May 3-Jun
10250
10253
10254
10255
10256
Appendix C Figure 3. Movement of tagged American shad, caught and released
inside the lock chamber at lock and dam 1 (rkm97) on March 25, 2008 in the Cape
Fear River, NC. Locations are based on results of both stationary receivers and
manual tracking. Legend numbers correspond to tag numbers of individual fish.
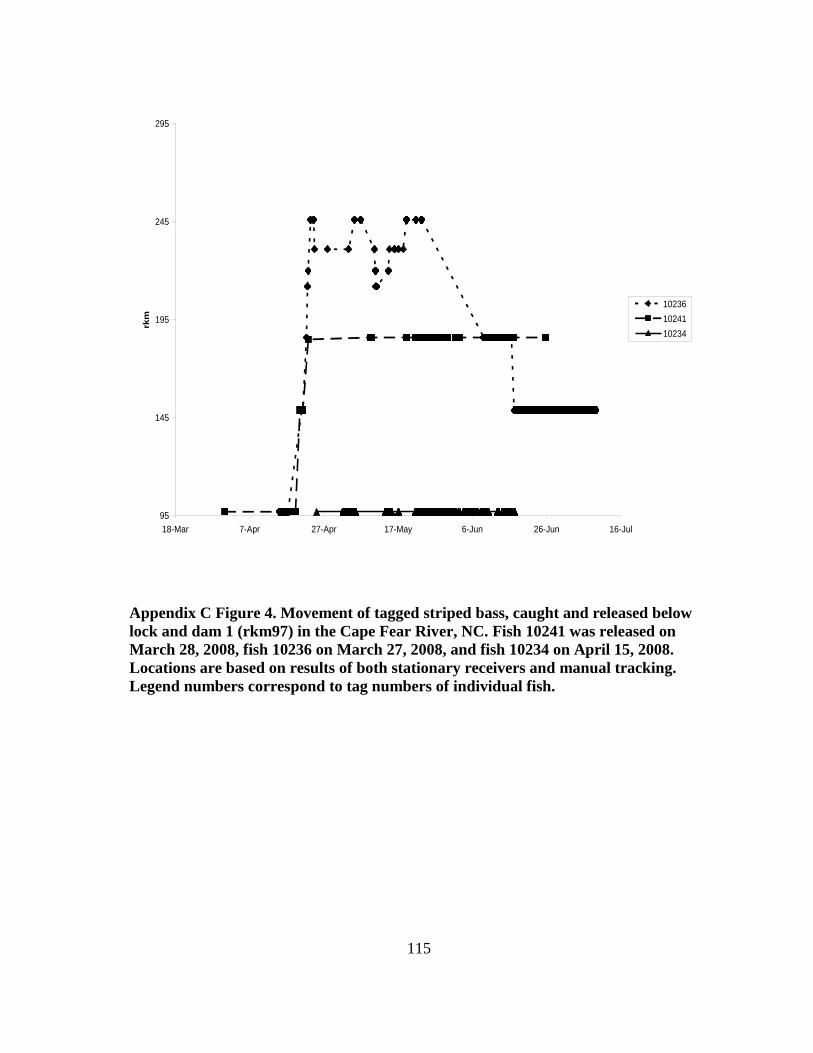
115
95
145
195
245
295
18-Mar 7-Apr 27-Apr 17-May 6-Jun 26-Jun 16-Jul
rkm
10236
10241
10234
Appendix C Figure 4. Movement of tagged striped bass, caught and released below
lock and dam 1 (rkm97) in the Cape Fear River, NC. Fish 10241 was released on
March 28, 2008, fish 10236 on March 27, 2008, and fish 10234 on April 15, 2008.
Locations are based on results of both stationary receivers and manual tracking.
Legend numbers correspond to tag numbers of individual fish.

116
95
145
195
245
295
10-Apr 20-Apr 30-Apr 10-May 20-May 30-May 9-Jun 19-Jun 29-Jun 9-Jul
rkm
10230
10231
10232
10237
10238
10239
Appendix C Figure 5. Movement of tagged striped bass, caught and released below
lock and dam 1 (rkm97) on April 15, 2008 in the Cape Fear River, NC. Locations are
based on results of both stationary receivers and manual tracking. Legend numbers
correspond to tag numbers of individual fish.
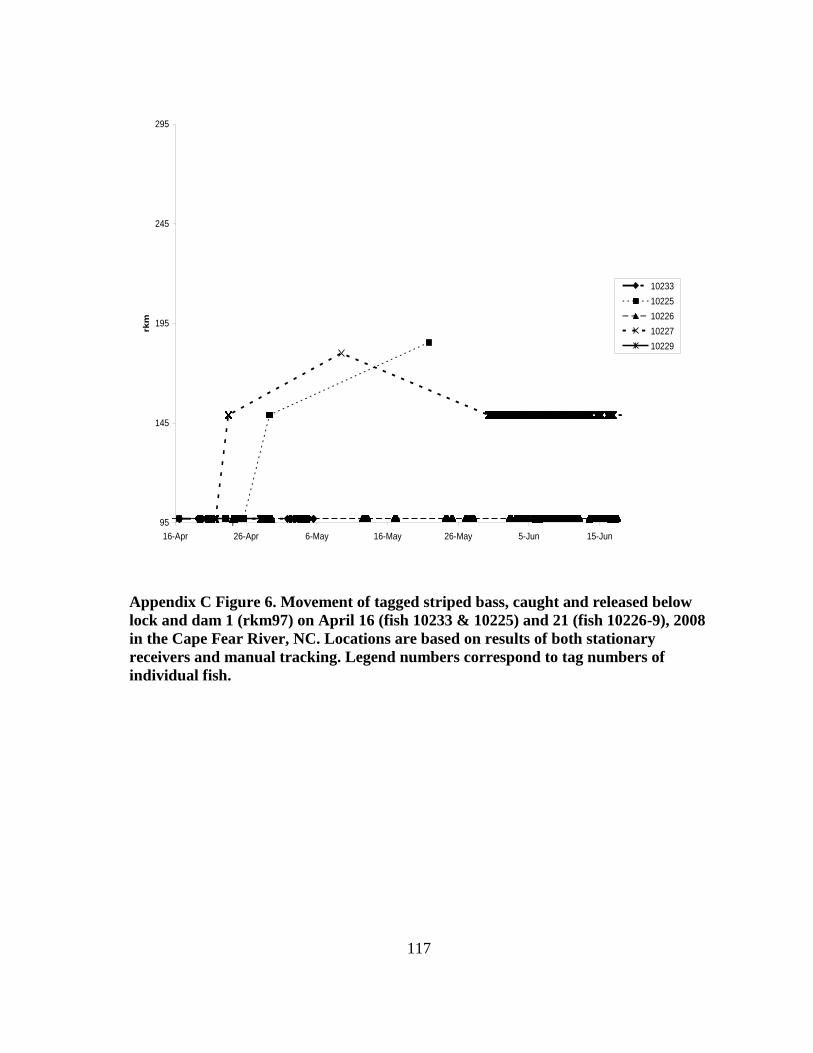
117
95
145
195
245
295
16-Apr 26-Apr 6-May 16-May 26-May 5-Jun 15-Jun
rkm
10233
10225
10226
10227
10229
Appendix C Figure 6. Movement of tagged striped bass, caught and released below
lock and dam 1 (rkm97) on April 16 (fish 10233 & 10225) and 21 (fish 10226-9), 2008
in the Cape Fear River, NC. Locations are based on results of both stationary
receivers and manual tracking. Legend numbers correspond to tag numbers of
individual fish.