spatio-temporal heterogeneity of riparian soil morphology
TRANSCRIPT
HESSD10 4337ndash4367 2013
Spatio-temporalheterogeneity of
riparian soilmorphology
B Fournier et al
Title Page
Abstract Introduction
Conclusions References
Tables Figures
J I
J I
Back Close
Full Screen Esc
Printer-friendly Version
Interactive Discussion
Discussion
Paper
|D
iscussionP
aper|
Discussion
Paper
|D
iscussionP
aper|
Hydrol Earth Syst Sci Discuss 10 4337ndash4367 2013wwwhydrol-earth-syst-sci-discussnet1043372013doi105194hessd-10-4337-2013copy Author(s) 2013 CC Attribution 30 License
EGU Journal Logos (RGB)
Advances in Geosciences
Open A
ccess
Natural Hazards and Earth System
Sciences
Open A
ccess
Annales Geophysicae
Open A
ccess
Nonlinear Processes in Geophysics
Open A
ccess
Atmospheric Chemistry
and Physics
Open A
ccess
Atmospheric Chemistry
and Physics
Open A
ccess
Discussions
Atmospheric Measurement
Techniques
Open A
ccess
Atmospheric Measurement
Techniques
Open A
ccess
Discussions
Biogeosciences
Open A
ccess
Open A
ccess
BiogeosciencesDiscussions
Climate of the Past
Open A
ccess
Open A
ccess
Climate of the Past
Discussions
Earth System Dynamics
Open A
ccess
Open A
ccess
Earth System Dynamics
Discussions
GeoscientificInstrumentation
Methods andData Systems
Open A
ccess
GeoscientificInstrumentation
Methods andData Systems
Open A
ccess
Discussions
GeoscientificModel Development
Open A
ccess
Open A
ccess
GeoscientificModel Development
Discussions
Hydrology and Earth System
Sciences
Open A
ccess
Hydrology and Earth System
Sciences
Open A
ccess
Discussions
Ocean Science
Open A
ccess
Open A
ccess
Ocean ScienceDiscussions
Solid Earth
Open A
ccess
Open A
ccess
Solid EarthDiscussions
The Cryosphere
Open A
ccess
Open A
ccessThe Cryosphere
Discussions
Natural Hazards and Earth System
Sciences
Open A
ccess
Discussions
This discussion paper ishas been under review for the journal Hydrology and Earth SystemSciences (HESS) Please refer to the corresponding final paper in HESS if available
Spatio-temporal heterogeneity of ripariansoil morphology in a restored floodplain
B Fournier123 C Guenat23 G Bullinger-Weber4 and E A D Mitchell1
1Laboratory of Soil Biology University of Neuchatel Rue Emile-Argand 112000 Neuchatel Switzerland2WSL Swiss Federal Institute for Forest Snow and Landscape Research Research UnitCommunity Ecology Site Lausanne station 21015 Lausanne Switzerland3Ecole Polytechnique Federale de Lausanne (EPFL) School of Architecture Civil andEnvironmental Engineering (ENAC) Laboratory of Ecological Systems (ECOS) station 21015 Lausanne Switzerland4Biogeosciences Laboratory Institute of Geology and Paleontology University of Lausanne1015 Lausanne SwitzerlandThese two authors contributed equally to this paper
Received 28 January 2013 ndash Accepted 18 March 2013 ndash Published 5 April 2013
Correspondence to B Fournier (bertrandfournieruninech)
Published by Copernicus Publications on behalf of the European Geosciences Union
4337
HESSD10 4337ndash4367 2013
Spatio-temporalheterogeneity of
riparian soilmorphology
B Fournier et al
Title Page
Abstract Introduction
Conclusions References
Tables Figures
J I
J I
Back Close
Full Screen Esc
Printer-friendly Version
Interactive Discussion
Discussion
Paper
|D
iscussionP
aper|
Discussion
Paper
|D
iscussionP
aper|
Abstract
Floodplains have been intensively altered in industrialized countries but are now in-creasingly being restored and it is therefore important to assess the effect of theserestoration projects on the aquatic and terrestrial components of ecosystems Soils area functionally crucial component of terrestrial ecosystems but are generally overlooked5
in floodplain restoration assessmentWe studied the spatio-temporal heterogeneity of soil morphology in a restored
(riverbed widening) river reach along River Thur (Switzerland) using three criteria (soildiversity dynamism and typicality) and their associated indicators We hypothesizedthat these criteria would correctly discriminate the post-restoration changes in soil10
morphology within the study site and that these changes correspond to patterns ofvascular plant diversity
Soil diversity and dynamism increased five years after the restoration but typicalsoils of braided rivers were still missing Soil typicality and dynamism correlated to veg-etation changes These results suggest a limited success of the project in agreement15
with evaluations carried out at the same site using other more resource demandingmethods (eg soil fauna fish ecosystem functioning)
Soil morphology provides structural and functional information on floodplain ecosys-tems and allows predicting broad changes in plant diversity The spatio-temporal het-erogeneity of soil morphology represents a cost-efficient ecological indicator that could20
easily be integrated into rapid assessment protocols of floodplain and river restorationprojects
1 Introduction
Floodplains fulfil ecological economic and social functions such as biodiversity reser-voirs supply of natural resources and flood regulation (Malmqvist and Rundle 2002)25
and are increasingly appreciated for their aesthetic value and for recreational uses
4338
HESSD10 4337ndash4367 2013
Spatio-temporalheterogeneity of
riparian soilmorphology
B Fournier et al
Title Page
Abstract Introduction
Conclusions References
Tables Figures
J I
J I
Back Close
Full Screen Esc
Printer-friendly Version
Interactive Discussion
Discussion
Paper
|D
iscussionP
aper|
Discussion
Paper
|D
iscussionP
aper|
(Nassauer et al 2001) However floodplains are also one of the most threatenedecosystems worldwide (Malmqvist and Rundle 2002 Tockner and Stanford 2002)
In the last decades the primary goal of floodplain management has shifted fromcontrolling rivers to restoring their biodiversity ecological quality and related functionsand services (Malmqvist and Rundle 2002 Tockner and Stanford 2002) As a result5
the number of river restoration projects aiming at increasing ecosystem goods andservices such as protection against flood biodiversity and drinking water is strongly in-creasing worldwide (Nakamura et al 2006 2009 Palmer and Bernhardt 2006 Palmeret al 2005 Wohl et al 2005) Assessing the outcome of these projects is essentialfor adaptive management evaluation of project efficiency optimization of future pro-10
grams and gaining public acceptance (Woolsey et al 2007) However restorationprojects often lack post-restoration monitoring using standardized evaluation methods(with well-defined criteria and indicators) which would increase their cost-efficiency(Palmer et al 2007 Sudduth et al 2007 Bernhardt et al 2005 2007) This lack ofmonitoring is mainly due to lack of funding beyond the practical restoration project15
Rapid yet informative cost-effective monitoring tools are extremely precious existingmethods consider hydrology physical and biological structures and the landscape con-text (Rohde et al 2004) but only include general elements with respect to soils
Soils play a central role in critical ecosystem processes (eg decomposition wa-ter filtering) and are among the main drivers of community assembly (Gobat 201020
Wardle 2002) For example soil conditions strongly determine vegetation dynamics(Caylor et al 2005) and plant productivity and diversity (Naiman et al 2005) In turnthe vegetation influences soil properties such as organic matter content (Quideau et al2001) Through their morphology soils also provide information on ecosystem struc-ture and record past and present fluvial dynamics (Gerrard 1992 Daniels 200325
Bullinger-Weber and Gobat 2006) This information may be especially useful whena site has been ditched drained and stripped of its vegetation (Cole and Kentula2011) Soil morphology is influenced by different factors that are related to important
4339
HESSD10 4337ndash4367 2013
Spatio-temporalheterogeneity of
riparian soilmorphology
B Fournier et al
Title Page
Abstract Introduction
Conclusions References
Tables Figures
J I
J I
Back Close
Full Screen Esc
Printer-friendly Version
Interactive Discussion
Discussion
Paper
|D
iscussionP
aper|
Discussion
Paper
|D
iscussionP
aper|
processes occurring in floodplain ecosystems such as erosionsedimentation flood dy-namics soil biota activity or pedogenesis
Soils are simpler to monitor than vegetation and hydrology In contrast to biologicalsurveys that are dependent on speciesrsquo developmental stages (eg vernal species oradult stages) or population fluctuations (eg seasonal migration and effects of excep-5
tional climatic event) soil morphology can be assessed in any season and in a singlefield campaign However in order to use soils in monitoring programs it is necessaryto understand how they change over time (Cole and Kentula 2011) To date most re-search on the impact of river restoration on floodplain soil have focused on processessuch as organic matter accumulation and decomposition (Sifneos et al 2010 Stein10
et al 2009 Bush 2008) litter decomposition (Ballantine and Schneider 2009) ordenitrification (Orr et al 2007 Sutton-Grier et al 2010) There is thus a need to in-tegrate soil physical chemical and biological factors and processes (Heneghan et al2008) and soil temporal dynamics (Ballantine and Schneider 2009) into the planningand assessment of river restoration projects15
Here we explore the possible use of riparian soil morphology as indicators of flood-plain dynamics by studying the spatio-temporal heterogeneity of soil morphology ina restored river reach along River Thur (Switzerland) Our main aim was to assess thepost-restoration changes in soil morphology as well as the variations of the main as-pects of soil morphology along the river lateral gradient We considered three criteria20
(and associated indicators) designed to cover these main aspects (1) soil diversity(2) soil dynamism and (3) soil typicality We hypothesised that these three criteriawould reflect changes in vascular plant diversity and vegetation type
4340
HESSD10 4337ndash4367 2013
Spatio-temporalheterogeneity of
riparian soilmorphology
B Fournier et al
Title Page
Abstract Introduction
Conclusions References
Tables Figures
J I
J I
Back Close
Full Screen Esc
Printer-friendly Version
Interactive Discussion
Discussion
Paper
|D
iscussionP
aper|
Discussion
Paper
|D
iscussionP
aper|
2 Methods
21 Study site
The Thur River restoration is among the biggest river widening projects in Switzerlandto date and includes post-restoration monitoring and evaluations of several stretches(Schneider 2011) We selected a study site along the Thur River near ldquoSchaffaulirdquo5
The site lies at 365 m asl Annual precipitation is about 1000 mmyrminus1 and the aver-age annual temperature is 79 C Restoration of the site was conducted in two stepsFollowing a major flood in 1995 the bed protection structures were removed In 2002the riverbed was widened along a 15 km stretch from 50 to 110 m by embankmentsremoval and the new bank stabilized by planting willows (Salix viminalis) The project10
aimed to improve flood protection to maintain drinkable water resources and to en-hance the ecological quality of the river
We distinguished three well-differentiated situations within the study site basedon field observations (topography and vegetation) available information on the siterestoration river maps and illustrations from the early 19th century historical data on15
Swiss lowland braided rivers (Moor 1958 Imboden 1976 Gallandat et al 1993 Baer1976 Roulier 1998) and the literature on braided river soils (AFES 2008 Guenatet al 2003 IUSS Working Group 2006) The first situation corresponds to open habi-tats with poorly developed soils closest to the river Restoration had the highest impacton this zone Further from the river lays an alluvial forest growing on deeper soils20
This forest was present before restoration and restoration had only a limited impact onthis area Finally we used an un-restored section of the same site located directly up-stream from the restored one as a control that was not or only marginally impacted bythe restoration We expected the criteria and indicators of soil morphology presentedbelow to show clear differences among these three areas revealing how the restoration25
affected the functioning of this riparian zone
4341
HESSD10 4337ndash4367 2013
Spatio-temporalheterogeneity of
riparian soilmorphology
B Fournier et al
Title Page
Abstract Introduction
Conclusions References
Tables Figures
J I
J I
Back Close
Full Screen Esc
Printer-friendly Version
Interactive Discussion
Discussion
Paper
|D
iscussionP
aper|
Discussion
Paper
|D
iscussionP
aper|
22 Data acquisition
Soil surveys were carried out in summer 2007 along five transects corresponding totopographical surveys over time each starting at the main river bed and ending about65 m further where no more floodplain soils were encountered Three transects wereselected in the restored area with a sampling point every 15 m in the most variable part5
(up to a distance of about 15 m from the river) and then every 3 m resulting in a total of73 sampling points Two transects were selected within the control area with a samplingpoint every 3 m resulting in 22 sampling points The precise location elevation anddistance to the river of each sampling point were recorded
Soils were surveyed by describing the morphology of profiles and horizons from10
auger borings (12 m length) Different variables were used to describe soil profilesand topsoils Profile characterization was based on profile depth (cm) number ofsandy loamy clay or humic horizons total number of horizons volumetric percentageof coarse elements () presence type (reduction or oxidation) and intensity of hydro-morphic features depth of the first horizon with hydromorphic features (cm) Topsoil15
descriptions were based on horizon thickness (cm) texture root density soil struc-ture type volumetric proportion of coarse elements and organic matter () presencetype (reduction or oxidation) and intensity of hydromorphic features macroscopic plantremains biological activity features
23 Soil characteristics and typology20
In order to describe changes in soil profiles and topsoils we constructed site-specifictypologies (Table 1) Two typologies (profile and topsoil) were generated using the com-plete linkage algorithm which preserves small clusters of observations (Everitt et al2001) and thus prevents groups composed by few points (ie rare soil types) to beincluded in larger groups Clusters validity was evaluated using silhouette width ndash25
a distance-based method that assesses the quality of each cluster ndash (Rousseeuw1987) Positive values indicate correct classifications and negative un-correct ones
4342
HESSD10 4337ndash4367 2013
Spatio-temporalheterogeneity of
riparian soilmorphology
B Fournier et al
Title Page
Abstract Introduction
Conclusions References
Tables Figures
J I
J I
Back Close
Full Screen Esc
Printer-friendly Version
Interactive Discussion
Discussion
Paper
|D
iscussionP
aper|
Discussion
Paper
|D
iscussionP
aper|
respectively The calculations of the indicators were based on the resulting soil groupsTo facilitate comparisons among studies we indicated the correspondence betweenour classification of soil profiles and two standard soil taxonomy references (AFES2008 IUSS Working Group WRB 2006)
24 Soil criteria and indicators5
For each criterion and indicator derived from the soil typologies we defined the range ofpossible values an application domain (soil profiles andor horizons) and the rationalefor its use (Table 2)
241 Soil diversity
Tools for measuring pedodiversity increasingly attract the attention of soil scientists10
(Toomanian and Esfandiarpoor 2010 Saldana and Ibanez 2004 2007 Ibanez et al1998 Ibanez et al 1995) Information on richness diversity and evenness of soil typesmay be useful for evaluating restoration projects especially given the mosaic of soilsthat can be observed in floodplains Soil morphology spatio-temporal heterogeneitywas first estimated by comparing pedodiversity indices among the forest the open15
area closed to the river (restored) and the control managed pasture (non-restored) tocharacterize the distributions of profile and topsoil groups We used five measures ofalpha diversity according to Hill (1973) richness (N0) Shannon and Simpson diversity(N1 and N2) and evenness (N1N0 and N2N0 respectively) We used soil types assurrogate of species for the calculations of these metrics20
242 Soil dynamism
Soil dynamism is defined here as the successions through time of sedimentation andorerosion processes related to the fluvial regime In natural floodplains the fluvial dy-namic creates through floods and in situ pedogenesis between flood events a mosaic
4343
HESSD10 4337ndash4367 2013
Spatio-temporalheterogeneity of
riparian soilmorphology
B Fournier et al
Title Page
Abstract Introduction
Conclusions References
Tables Figures
J I
J I
Back Close
Full Screen Esc
Printer-friendly Version
Interactive Discussion
Discussion
Paper
|D
iscussionP
aper|
Discussion
Paper
|D
iscussionP
aper|
of soil morphologies Therefore efficient river restoration should lead to recreating ormaintaining such a mosaic of soils
Practically we plotted the total number of horizons per meter (Hm) against distanceto river to get a 2-D picture of the erosionsedimentation processes along the lat-eral gradient The soil dynamism criterion was assessed by comparing the resulting5
patterns (1) along the river lateral gradient and (2) between the restored (open habi-tats+ floodplain forest) and control areas
Elevation deltas (ie the surface elevation variation of a given point measuredthrough time) were calculated using cross-section topographical surveys Negative andpositive deltas are due respectively to net erosion and deposition processes Cross10
sections data covering a period ranging from 1996 to 2002 (before restoration) andfrom 2002 to 2007 (after restoration) were used to assess elevation variations throughtime and flood events Seven classes of distance to the river (10 m sections) wereused to characterize the lateral gradient Average elevation deltas before and afterthe restoration and their associated standard deviations were first calculated for each15
distance class Finally two five-year floods (HQ5) showing similar discharges beforeand after the restoration were selected based on hydrological surveys of the localauthorities (Canton Thurgau) and on the available cross-section data The elevationvalues just before and after each of these two floods were used to characterize theerosionsedimentation patterns for each distance class20
243 Soil typicality criterion
Typical floodplain soils are mainly characterised by their limited evolution and the im-pact of water saturation on their morphology and functioning They all show varying fre-quency and duration of waterlogging An efficient restoration should allow the completerange of typical floodplain soils to develop at a site This potential range of soils de-25
pends on the fluvial dynamic and is therefore context-specific For example hydromor-phic features and clay-rich soils generally increase in frequency in lower river reaches
4344
HESSD10 4337ndash4367 2013
Spatio-temporalheterogeneity of
riparian soilmorphology
B Fournier et al
Title Page
Abstract Introduction
Conclusions References
Tables Figures
J I
J I
Back Close
Full Screen Esc
Printer-friendly Version
Interactive Discussion
Discussion
Paper
|D
iscussionP
aper|
Discussion
Paper
|D
iscussionP
aper|
We compared the frequency of soil groups among the different areas of the site bothfor the entire profiles and for the topsoil horizons
25 Vegetation survey
Vegetation surveys were conducted seven times between April 2008 and 2009 usingthe Braun-Blanquet method (1964) in 41 plots (4 m radius circles) distributed through-5
out the restored and reference areas Among these plots 26 were selected for theirspatial correspondence with the soil survey 22 in the restored area and 4 in the con-trol The different sampling sessions were pooled together in order to have a site Xspecies matrix representing an entire year
We calculated vascular plant species biodiversity for the three areas (open habi-10
tats+ floodplain forest) using the same set of metrics as for pedodiversity We thenassessed whether the changes in soil morphology observed in Fig 1 corresponded tovegetation types and thus whether soil morphology was a good predictor of succes-sional patterns of vegetation
3 Results15
31 Soil typology
The cluster analysis revealed eight groups of profiles (silhouette width=042) andseven groups of topsoils (average silhouette width=044) Most soils could be clas-sified as Fluvisols and to a lesser extent Stagnosols or Gleysols according to the WRBclassification or FLUVIOSOL REDOXISOL or REDUCTISOL according to the AFES20
classification The average of each variable within each group are given in Table 1
4345
HESSD10 4337ndash4367 2013
Spatio-temporalheterogeneity of
riparian soilmorphology
B Fournier et al
Title Page
Abstract Introduction
Conclusions References
Tables Figures
J I
J I
Back Close
Full Screen Esc
Printer-friendly Version
Interactive Discussion
Discussion
Paper
|D
iscussionP
aper|
Discussion
Paper
|D
iscussionP
aper|
32 Soil diversity
Profile and topsoil diversity and richness were highest in the open habitats of the re-stored area and lowest in the floodplain forest (Table 3) The control area had interme-diate values More soil groups (both topsoil and profile) were present and soil variabilitywas higher close to the river Evenness of soil groups differed between soil profiles and5
topsoils Evenness of profile groups was maximal in the forest and minimal close to theriver while the evenness of horizon groups was maximal in the non-restored pasture(control) and minimal in the forest
33 Soil dynamism
Soil dynamism as assessed by the variation of the total number of horizons per me-10
ter (Hm) along transects differed significantly between the restored and control areas(KruskalndashWallis Rank Sum Tests p=0003 and p lt 0001 for Hm values and standarddeviation respectively) and between the open and forest habitats in the restored sec-tion The pattern was flat in the control area (Fig 1) Indeed the control area was onlyrarely influenced by fluvial dynamics and as a result soils were well developed and15
homogenous all along the lateral gradient By contrast in the restored area (Fig 1)the pattern was highly variable Five different sectors could be distinguished along theriver-upland gradient Between 0 and 5 m Hm was null Erosion processes were domi-nant and soil development could not occur Between 5 and 20 m Hm values increasedslightly Sedimentation could occur with some accumulations of organic matter Be-20
tween 20 and 35 m Hm values showed a high variation Erosion sedimentation andsoil development (ie accumulation of organic matter soil layer differentiation in situpedogenesis) alternated Between 35 and 50 m Hm values were more stable Erosiondecreased and soil development increased Further Hm values stabilized at about twohorizons per meter25
The average sedimentation and erosion rates were higher between 1996 and 2002than for the period after restoration (Fig 2) Indeed the average negative elevation
4346
HESSD10 4337ndash4367 2013
Spatio-temporalheterogeneity of
riparian soilmorphology
B Fournier et al
Title Page
Abstract Introduction
Conclusions References
Tables Figures
J I
J I
Back Close
Full Screen Esc
Printer-friendly Version
Interactive Discussion
Discussion
Paper
|D
iscussionP
aper|
Discussion
Paper
|D
iscussionP
aper|
delta before the restoration was minus054 m and only minus021 m after The same trend wasfound for the average positive delta (before=022 m and after=016 m)
The effect of a similar five-year flood differed significantly before and after the restora-tion (Fig 3 KruskalndashWallis Rank Sum Test p=0002) and between the control and re-stored (ie open habitats+ forest) areas after the restoration (p=002) Along the river5
lateral gradient the patterns were conspicuously different before and after the restora-tion Before the restoration erosion forces concentrated on the first thirty meters fromthe river Further away erosion forces were weaker and sedimentation started to oc-cur After restoration the pattern was more regular Sedimentation processes weredominant but erosion occurred marginally10
34 Soil typicality
Soil group abundances were compared among the open habitats the alluvial forest andthe control for the entire profiles and topsoil horizons (Table 4) In the open habitatsrestoration led to the creation of thin and coarse soils (profile types 4 and 5 Table 1)that correspond to the initial stages of soil development under high fluvial dynamism15
The transition between (1) the open and forest areas (profile groups 2 and 3) and(2) the more stable forest and control pasture (profile group 1) was marked by the pres-ence of soil with low coarse material content which are little impacted by erosion andsedimentation processes and moderately influenced by water table fluctuations Suchsoils are not typical of active floodplains along natural braided rivers but are rather20
an indication of human activity (ie embanking and associated reworking of soil andsediments) A single profile was characterized by the presence of a reduced horizon(profile type 8) indicating quasi-permanent waterlogging a situation typically encoun-tered along the lateral branches of braided rivers where water discharge is low
Observed patterns in topsoil groups confirmed those of profile groups (Table 4) Hu-25
mified organic matter deeply incorporated to the soil was characteristic of the forestand pasture areas (topsoil type 1) whereas organic matter was mainly composed bycoarse residues in the open restored area (topsoil types 4 and 7) Topsoils with coarse
4347
HESSD10 4337ndash4367 2013
Spatio-temporalheterogeneity of
riparian soilmorphology
B Fournier et al
Title Page
Abstract Introduction
Conclusions References
Tables Figures
J I
J I
Back Close
Full Screen Esc
Printer-friendly Version
Interactive Discussion
Discussion
Paper
|D
iscussionP
aper|
Discussion
Paper
|D
iscussionP
aper|
material lacking organic matter occurred close to the river (topsoil types 2 and 3)Topsoils showing hydromorphic features (group 7) remained marginal since they ac-counted for 3 of the investigated topsoils
35 Vegetation
In total 100 species were identified at the Thur River site These species were or-5
ganized into five well-differentiated vegetation successional stages along the lateralgradient (1) the closest to the river no vegetation or only isolated plants (2) patchesof pioneer vegetation and (3) a thicket dominated by Phalaris arundinacea (4) willowbushes dominated by Salix viminalis (5) a deciduous forest dominated by Fraxinusexcelsior far from the river The control (un-restored) area was a managed pasture10
dominated by Arrhenatherum elatius It was thus not meaningful to include it in thesuccession and compare it with the other habitats We rather focused on the succes-sion of plant communities along the river lateral gradient
Plant species diversity and evenness were higher in the forest whereas the openhabitats and forest had similar values of species diversity The increase in plant species15
evenness paralleled the one in soil evenness but this was not the case for richnessand diversity Vegetation successional stages corresponded to those in soil dynamismThe notable exception was the Phalaris thickets vs willow bushes where differences invegetation did not match those observed in soil This is most likely due to the fact thatthe willow bushes were planted during the restoration and are not part of the natural20
successionVegetation was expected to respond to the composition of profile groups As ex-
pected the typicality criterion was successful in predicting the broad vegetation typeswithin the site (Fig 5) Pioneer vegetation appeared with the first stages of soil develop-ment (profile 5) whereas when soils were too poorly developed (profile 4) no vegetation25
was present Vegetation colonization in the most dynamic part of the gradient (profile4) was associated to organic matter accumulation (topsoil 4) Data from topsoils suchas organic matter content and origin are therefore complementary to those provided
4348
HESSD10 4337ndash4367 2013
Spatio-temporalheterogeneity of
riparian soilmorphology
B Fournier et al
Title Page
Abstract Introduction
Conclusions References
Tables Figures
J I
J I
Back Close
Full Screen Esc
Printer-friendly Version
Interactive Discussion
Discussion
Paper
|D
iscussionP
aper|
Discussion
Paper
|D
iscussionP
aper|
from profile morphology Alluvial forests (Fraxinion) mainly occurred on stable moistsoils (profiles 2 and 7) Potential surfaces of suitable hydromorphic soils for the typicalvegetation of braided river lateral branches such as Typha minima and Inula Helveticafor which reintroduction plans exist in Switzerland (Keel and Floss 2004 Floss andKeel 2004) were only limited in our study area (ie only one sampling point for profile5
type 8)
4 Discussion
The restoration of River Thur globally increased soil diversity and improved dynamismand typicality It changed the fluvial dynamics leading to changes in soil morphology(eg intensity of erosionsedimentation processes coarse material and organic matter10
content) and soil functioning (eg loss of hydromorphy) The most striking changesoccurred within the first 30 m from the river Post-restoration fluvial dynamics createddiverse and dynamic patterns of soils close to the river Habitats located further awayfrom the river were less frequently exposed to floods and therefore less influencedby the restored fluvial dynamic However restoration had not yet succeeded in creat-15
ing significant surfaces of hydromorphic soils typical of braided river lateral branches(AFES 2008 Guenat et al 2003 IUSS Working Group 2006)
Given the known importance of soil type in determining vascular plant communi-ties (Gobat 2010) we hypothesized that a relatively simple study of soil morphologywould provide an indirect source of information on the potential vegetation and plant20
diversity of a site This was not the case for diversity and richness most likely due tothe influence of factors such as soil chemistry water and nutrient availability surfaceconnectivity biotic interactions and species reservoir However changes in the even-ness of soil groups and in soil dynamism and typicality paralleled those observed forvegetation in agreement with our hypotheses Indeed the Hm index reflected the num-25
ber of vegetation successional stages Soils typical of floodplain lateral channels werestrongly under-represented and the vegetation associated with such conditions was
4349
HESSD10 4337ndash4367 2013
Spatio-temporalheterogeneity of
riparian soilmorphology
B Fournier et al
Title Page
Abstract Introduction
Conclusions References
Tables Figures
J I
J I
Back Close
Full Screen Esc
Printer-friendly Version
Interactive Discussion
Discussion
Paper
|D
iscussionP
aper|
Discussion
Paper
|D
iscussionP
aper|
not yet able to colonize the site The dynamism and typicality of soil morphology asdescribed here can thus allow predicting major changes in potential vegetation ndash andother organisms responding either directly to changes in soil type or to the changesin vegetation ndash resulting from restoration project The increased diversity of soil typesand the dramatic changes of dynamism suggest a positive impact of restoration but5
the lack of typical hydromorphic soils could have been improved by integrating soil mor-phology in early project planning Thus five years after river widening the indicators ofsoil morphology suggest that this restoration project was a partial success in restoringsoil habitat and vegetation
Previous evaluations of the same site but based on different methods criteria and10
indicators reached similar conclusions Woolsey et al (2007) found that fish assem-blage structure and composition were similar in embanked and restored reaches andconcluded that the restoration of River Thur failed to meet the objectives lsquonear natu-ral abundance and diversity of fauna Weber et al (2009) showed that hydro-physicalhabitat diversity had been improved by the widening but that the current geomorpholog-15
ical complexity was still considerably impaired in the restored reach in comparison withhistorical near-natural shoreline Rohde et al (2004) used GIS methods based on land-scape indexes and vegetation and concluded that the widening improved the degree ofvegetation naturalness but in a limited way as compared to other restoration projectsAlthough the methods used were fundamentally different the results we obtained us-20
ing soil morphology were in agreement with these other evaluations The indicators weused also allowed investigating complementary aspects of floodplain restoration thediversity criterion proved to be complementary to vegetation surveys the dynamismcriterion discriminated precisely the zones that were differently impacted by the fluvialdynamic and the typicality criterion allowed characterizing the changes among these25
zonesIn the context of river restoration indicators should be easily measured be sensi-
tive to stresses on the system demonstrate predictable responses to stresses and beintegrative (Palmer et al 2005) Our results show that soil morphology criterion and
4350
HESSD10 4337ndash4367 2013
Spatio-temporalheterogeneity of
riparian soilmorphology
B Fournier et al
Title Page
Abstract Introduction
Conclusions References
Tables Figures
J I
J I
Back Close
Full Screen Esc
Printer-friendly Version
Interactive Discussion
Discussion
Paper
|D
iscussionP
aper|
Discussion
Paper
|D
iscussionP
aper|
indicators fit these requirements Soils may respond slowly to perturbations such asriverbed widening but in our case clear changes in soil morphology were already ob-served five years after restoration Furthermore soil indicators provide two differentand complementary levels of information (ie soil unitsprofile topsoil) Neverthelessthe time between the restoration and the integration of the changes into soil morphol-5
ogy depends on the fluvial regime Successive floods (including HQ5 HQ10 or HQ20)have to occur to potentially modify the soil morphology Erosional and depositional pro-cesses should be frequent ideally corresponding to the ldquomedium-energy non cohesivefloodplainsrdquo river category of Nanson and Croke (1992) with braided meandering andanastomosing channels10
We studied the relatively short-term effects of floodplain restoration According toBallantine and Schneider (2009) as soil development is a relatively slow process whichonly appears to accelerate later in the successional recovery sequence the role ofdifferent soil successional phases in determining long-term trajectories of ecosystemdevelopment should be considered in restoration design research and monitoring It15
would therefore be useful to assess the longer-term trends of soil development at thestudy site and other comparable restored floodplains
5 Conclusions
Our results show that soil morphology responded fast and clearly to river restorationand that typicality and dynamism correlated to vegetation changes Analysis of soil20
morphology has the potential to improve the quality and accuracy of rapid assessmentprotocols (Sifneos et al 2010 Stein et al 2009)
Despite the known importance of soils in terrestrial ecology soil morphology hasbeen under-used for the assessment of floodplain restoration success The number ofriver restoration projects is increasing rapidly but there is still no general agreement on25
evaluation methods The analysis of soil morphology offers many advantages (ease of
4351
HESSD10 4337ndash4367 2013
Spatio-temporalheterogeneity of
riparian soilmorphology
B Fournier et al
Title Page
Abstract Introduction
Conclusions References
Tables Figures
J I
J I
Back Close
Full Screen Esc
Printer-friendly Version
Interactive Discussion
Discussion
Paper
|D
iscussionP
aper|
Discussion
Paper
|D
iscussionP
aper|
use quick and cost-effective) that make it a promising approach for the river restorationevaluatorrsquos tool kit
Acknowledgements The authors kindly acknowledge the ETH-Domain Competence CenterEnvironment and Sustainability (CCES) project RECORD for funding Karin Grin for fieldworkand Ralph Thielen for helping in the data collection5
References
AFES Referentiel pedologique 2008 Collection Savoir-Faire Editions Quae Versailles Paris2008
Baer O Geographie de la Suisse Editions Delta Vevey 1976Baize D and Girard M-C Referentiel pedologique 2008 Collection Savoir-Faire Editions10
Quae Versailles Paris 2008Ballantine K and Schneider R Fifty-five years of soil development in restored freshwater
depressional wetlands Ecol Appl 19 1467ndash1480 doi10189007-05881 2009Bernhardt E S Palmer M A Allan J D Alexander G Barnas K Brooks S Carr J Clay-
ton S Dahm C Follstad-Shah J Galat D Gloss S Goodwin P Hart D Hassett B15
Jenkinson R Katz S Kondolf G M Lake P S Lave R Meyer J L OrsquoDonnell T KPagano L Powell B and Sudduth E Ecology synthesizing US river restoration effortsScience 308 636ndash637 doi101126science1109769 2005
Bernhardt E S Sudduth E B Palmer M A Allan J D Meyer J L Alexander GFollastad-Shah J Hassett B Jenkinson R Lave R Rumps J and Pagano L Restor-20
ing rivers one reach at a time results from a survey of US river restoration practitionersRestor Ecol 15 482ndash493 2007
Braun-Blanquet J Pflanzensoziologie Grundzuge der Vegetationskunde Springer Vienna1964
Bullinger-Weber G and Gobat J M Identification of facies models in alluvial soil25
formation the case of a Swiss alpine floodplain Geomorphology 74 181ndash195doi101016jgeomorph200507016 2006
Bush J K Soil Nitrogen and Carbon after Twenty Years of Riparian Forest Development SoilSci Soc Am J 72 815ndash822 doi102136sssaj20070120 2008
4352
HESSD10 4337ndash4367 2013
Spatio-temporalheterogeneity of
riparian soilmorphology
B Fournier et al
Title Page
Abstract Introduction
Conclusions References
Tables Figures
J I
J I
Back Close
Full Screen Esc
Printer-friendly Version
Interactive Discussion
Discussion
Paper
|D
iscussionP
aper|
Discussion
Paper
|D
iscussionP
aper|
Caylor K K Manfreda S and Rodriguez-Iturbe I On the coupled geomorphologi-cal and ecohydrological organization of river basins Adv Water Resour 28 69ndash86doi101016jadvwatres200408013 2005
Cole C and Kentula M Monitoring and assessment ndash what to measure and why in Wet-lands edited by LePage B A Springer Netherlands 137ndash152 20115
Daniels J M Floodplain aggradation and pedogenesis in a semiarid environment Geomor-phology 56 225ndash242 doi101016S0169-555X(03)00153-3 2003
Everitt B Landau S and Leese M Cluster analysis Hodder Arnold London 237 pp 2001Floss I and Keel A Aktionsplan Kleiner Rohrkolben (Typha minima Hoppe) Arten-
schutzmassnahmen fur gefahrdete Farn- und Blutenpflanzen im Kanton Zurich Fachstelle10
Naturschutz Kanton Zurich Zurich 2004Gallandat J D Gobat J-M and Roulier C Cartographie des zones alluviales drsquoimportance
nationale rapport et annexes Cahiers de lrsquoenvironnement No 199 Office federal delrsquoenvironnement des forets et du paysage (OFEFP) Berne 1993
Gerrard A J Soil Geomorphology Springer 199215
Gobat J M The Living Soil Fundamentals of Soil Science and Soil Biology Science Publish-ers Enfield 2010
Guenat C Bureau F and Charnet F Genese diversite et fonctionnement des sols sous ladependance drsquoun cours drsquoeau ecologie fonctions et gestion in Forets riveraines des coursdrsquoeau IDF Paris 200320
Heneghan L Miller S P Baer S Callaham M A Montgomery J Pavao-Zuckerman MRhoades C C and Richardson S Integrating soil ecological knowledge into restorationmanagement Restor Ecol 16 608ndash617 doi101111j1526-100X200800477x 2008
Hill M O Diversity and evenness a unifying notation and its consequences Ecology 54427ndash432 doi1023071934352 197325
Ibanez J J De-Albs S Bermudez F F and Garcıa-Alvarez A Pedodiversity concepts andmeasures Catena 24 215ndash232 doi1010160341-8162(95)00028-Q 1995
Ibanez J J De-Alba S Lobo A and Zucarello V Pedodiversity and global soil pat-terns at coarse scales (with discussion) Geoderma 83 171ndash192 doi101016S0016-7061(97)00147-X 199830
Imboden C Eaux vivantes edited by LSPN Departement federal de lrsquoInterieur Bale 1976IUSS Working Group World reference base for soil resources in World Soil Resources Re-
port 103 FAO Rome 128 pp 2006
4353
HESSD10 4337ndash4367 2013
Spatio-temporalheterogeneity of
riparian soilmorphology
B Fournier et al
Title Page
Abstract Introduction
Conclusions References
Tables Figures
J I
J I
Back Close
Full Screen Esc
Printer-friendly Version
Interactive Discussion
Discussion
Paper
|D
iscussionP
aper|
Discussion
Paper
|D
iscussionP
aper|
IUSS Working Group WRB World Reference Base for Soil Resources 2006 a Framework forInternational Classification Correlation and Communication Food and Agriculture Organi-zation of the United Nations Rome 2006
Keel A and Floss I Aktionsplan Schweizer Alant (Inula helvetica Weber) Artenschutzmass-nahmen fur gefahrdete Farn- und Blutenpflanzen im Kanton Zurich Fachstelle Naturschutz5
Kanton Zurich Zurich 2004Malmqvist B and Rundle S Threats to the running water ecosystems of the world Environ
Conserv 29 134ndash153 doi101017S0376892902000097 2002Moor M Pflanzengesellschaften schweizerischer Flussauen Mit Sch Anst Forstl Ver-
suchsw 34 221ndash360 195810
Naiman R Bechtold J Drake D Latterell J OrsquoKeefe T and Balian E Origins patternsand importance of heterogeneity in riparian systems in Ecosystem function in heteroge-neous landscapes Springer-Verlag New York 279ndash309 2005
Nakamura K Amano K and Tockner K River restoration European perspectives andlessons for Japan Ecol Civ Eng 8 201ndash214 200615
Nakamura K Tockner K and Amano K River and wetland restoration lessons from JapanBioscience 56 419ndash429 doi1016410006-3568(2006)056[0419rawrlf]20co2 2009
Nanson G C and Croke J C A genetic classification of floodplains Geomorphology 4459ndash486 doi1010160169-555X(92)90039-Q 1992
Nassauer J I Kosek S E and Corry R C Meeting public expectations with eco-20
logical inovation in riparian landscapes J Am Water Resour Assoc 37 1439ndash1443doi101111j1752-16882001tb03650x 2001
Orr C H Stanley E H Wilson K A and Finlay J C Effects of Restoration and Reflood-ing on Soil Denitrification in a Leveed Midwestern Floodplain Ecol Appl 17 2365ndash2376doi10189006-21131 200725
Palmer MA and Bernhardt E S Hydroecology and river restoration Ripe for research andsynthesis Water Resour Res 42 W03S07 doi1010292005WR004354 2006
Palmer MA Bernhardt E S Allan J D Lake P S Alexander G Brooks S Carr JClayton S Dahm C N Shah J F Galat D L Loss S G Goodwin P Hart D DHassett B Jenkinson R Kondolf G M Lave R Meyer J L OrsquoDonnell T K Pagano L30
and Sudduth E Standards for ecologically successful river restoration J Appl Ecol 42208ndash217 2005
4354
HESSD10 4337ndash4367 2013
Spatio-temporalheterogeneity of
riparian soilmorphology
B Fournier et al
Title Page
Abstract Introduction
Conclusions References
Tables Figures
J I
J I
Back Close
Full Screen Esc
Printer-friendly Version
Interactive Discussion
Discussion
Paper
|D
iscussionP
aper|
Discussion
Paper
|D
iscussionP
aper|
Palmer MA Allan J D Meyer J and Bernhardt E S River Restoration in the Twenty-First Century Data and Experiential Knowledge to Inform Future Efforts Restor Ecol 15472ndash481 2007
Orr C H Stanley E H Wilson K A and Finlay J C Effects of Restoration and Refloodingon Soil Denitrification in a Leveed Midwestern Floodplain Ecological Applications 17 2365ndash5
2376 doi10189006-21131 2007Quideau S A Chadwick O A Benesi A Graham R C and Anderson M A A direct link
between forest vegetation type and soil organic matter composition Geoderma 104 41ndash60doi101016S0016-7061(01)00055-6 2001
Rohde S River Restoration Potential and Limitations to Re-Establish Riparian Landscapes10
Assessment amp Planning PhD thesis Swiss Federal Institute of Technology Zurich Zurich133 pp 2004
Rohde S Kienast F and Burgi M Assessing the restoration success of river wideningsa landscape approach Environ Manage 34 574ndash589 2004
Roulier C Typologie et dynamique de la vegetation des zones alluviales de Suisse Geob-15
otanica Helvetica 72 138 pp 1998Rousseeuw P Silhouettes a graphical aid to the interpretation and validation of cluster anal-
ysis J Comput Appl Math 20 53ndash65 1987Saldana A and Ibanez J J Pedodiversity analysis at large scales an example of
three fluvial terraces of the Henares River (central Spain) Geomorphology 62 123ndash13820
doi101016jgeomorph200402007 2004Saldana A and Ibanez J J Pedodiversity connectance and spatial variabil-
ity of soil properties what is the relationship Ecol Model 208 342ndash352doi101016jecolmodel200706006 2007
Saxton K E Rawls W J Romberger J S and Papendick R I Estimating generalized25
soil-water characteristics from texture Soil Sci Soc Am J 50 1031ndash1036 1986Schneider P Vogt T Schirmer M Doetsch J Linde N Pasquale N Perona P and
Cirpka O A Towards improved instrumentation for assessing river-groundwater interactionsin a restored river corridor Hydrol Earth Syst Sci 15 2531ndash2549 doi105194hess-15-2531-2011 201130
Sifneos J Herlihy A Jacobs A and Kentula M Calibration of the Delaware Rapid Assess-ment Protocol to a comprehensive measure of wetland condition Wetlands 30 1011ndash1022doi101007s13157-010-0093-z 2010
4355
HESSD10 4337ndash4367 2013
Spatio-temporalheterogeneity of
riparian soilmorphology
B Fournier et al
Title Page
Abstract Introduction
Conclusions References
Tables Figures
J I
J I
Back Close
Full Screen Esc
Printer-friendly Version
Interactive Discussion
Discussion
Paper
|D
iscussionP
aper|
Discussion
Paper
|D
iscussionP
aper|
Stein E D Fetscher A E Clark R P Wiskind A Grenier J L Sutula M Collins J Nand Grosso C Validation of a wetland rapid assessment method use of Eparsquos level 1-2-3framework for method testing and refinement Wetlands 29 648ndash665 doi10167207-23912009
Sudduth E B Meyer J L and Bernhardt E S Stream restoration practices in the south-5
eastern United States Restor Ecol 15 573ndash583 2007Sutton-Grier A E Kenney M A and Richardson C J Examining the relationship be-
tween ecosystem structure and function using structural equation modelling a case studyexamining denitrification potential in restored wetland soils Ecol Model 221 761ndash768doi101016jecolmodel200911015 201010
Tockner K and Stanford J A Riverine flood plains present state and future trends EnvironConserv 29 308ndash330 2002
Toomanian N and Esfandiarpoor I Challenges of pedodiversity in soil science Eurasian SoilSci 43 1486ndash1502 doi101134s1064229310130089 2010
Wardle D A Communities and Ecosystems Linking the Aboveground and Belowground Com-15
ponents Princeton University Press Princeton NJ 2002Weber C Schager E and Peter A Habitat diversity and fish assemblage structure in
local river widenings a case study on a swiss river River Res Appl 25 687ndash701doi101002rra1176 2009
Wohl E Angermeier P L Bledsoe B Kondolf G M MacDonnell L Merritt D M20
Palmer M A Poff N L and Tarboton D River restoration Water Resour Res 41 1ndash12 2005
Woolsey S Capelli F Gonser T Hoehn E Hostmann M Junker B Paetzold ARoulier C Schweizer S Tiegs S D Tockner K Weber C and Peter A A strategyto assess river restoration success Freshwater Biol 52 752ndash769 200725
4356
HESSD10 4337ndash4367 2013
Spatio-temporalheterogeneity of
riparian soilmorphology
B Fournier et al
Title Page
Abstract Introduction
Conclusions References
Tables Figures
J I
J I
Back Close
Full Screen Esc
Printer-friendly Version
Interactive Discussion
Discussion
Paper
|D
iscussionP
aper|
Discussion
Paper
|D
iscussionP
aper|
Table 1a Description of eight soil groups and number of ldquoindividualsrdquo (n) resulting from a clus-ter analysis based on a simplified set of variables for profiles (1a) and five groups of topsoilhorizons (1b) Soil taxonomy is based on AFES (2008) and correspondences to the FAO Worldreference base for soil resources (IUSS Working Group 2006) are given Depth is the meandepth of a particular group of profiles (cm) Texture is based on the US texture triangle (Saxtonet al 1986) For the profiles texture is described using the total number of loam sandy loamand sandy horizons within each group of profile and the average number of horizons per pro-file The volumetric percentage of coarse material (blocks pebbles and gravels) of the coars-est horizon within the profile is indicated under coarse material Proportion of blocks pebblesand gravels are given for each group in percentage of total volume Topsoil thickness (1b) isgiven in cm Hydromorphic features represent the average depth (in cm) at which hydromor-phic features were first observed The intensity of the hydromorphic features is given using asemi-quantitative scale (absence weak moderate and high) The organic matter OM content(null low medium and high) and type (no humified and coarse residuals) are given
Taxonomy Number of Horizons Hydromorphy
Soil AFES 2008 WRB 2006 Depth Loam Sandy Sand Average Coarse Hydromorphic Intensity ofprofile [cm] loam per material features hydromorphy
profile []
Group 1 REDOXISOLS fluviques Gleyic Fluvisols 111 7 47 0 2ndash4 03 15 Moderate(11) carbonates CalcaricGroup FLUVIOSOLS typiques Fluvisols 95 0 91 2 1ndash4 12 No No2 (25) carbonates CalcaricGroup FLUVIOSOLS Fluvisols 120 1 10 0 3 65 50 Weak to moderate3 (2) typiques Calcaric with
redoxiques redoximorphiccarbonates features
Group FLUVIOSOLS bruts Regosols 08 0 1 31 0 87 No No4 (32) carbonates CalcaricGroup FLUVIOSOLS bruts Regosols 20 0 42 5 1ndash2 45 No No5 (22) carbonates CalcaricGroup FLUVIOSOLS Fluvisols 69 0 36 2 3 56 25 weak6 (9) typiques Calcaric with
redoxiques redoximorphiccarbonates features
Group FLUVIOSOLS Fluvisols 104 0 33 0 2 11 50 Weak to moderate7 (8) typiques Calcaric with
redoxiques redoximorphiccarbonates features
Group REDUCTISOLS fulviques Gleysols 30 0 2 0 1 7 15 High8 (1) carbonates Calcaric
4357
HESSD10 4337ndash4367 2013
Spatio-temporalheterogeneity of
riparian soilmorphology
B Fournier et al
Title Page
Abstract Introduction
Conclusions References
Tables Figures
J I
J I
Back Close
Full Screen Esc
Printer-friendly Version
Interactive Discussion
Discussion
Paper
|D
iscussionP
aper|
Discussion
Paper
|D
iscussionP
aper|
Table 1b
Topsoil Thickness Organic matter Organic matter Texture (US Blocks Pebbles Gravel Hydromorphiclayer [cm] content type triangle) [] [] [] features
Group 1 (27) 8 low-medium humified Sandy loam 0 0 0 absentGroup 2 (21) 0 null no Sand 06 68 29 absentGroup 3 (10) 0 null no Sand 09 33 55 absentGroup 4 (36) 9 medium-low coarse Sandy loam 0 0 5 absent
residualsGroup 5 (13) 95 medium-low coarse Sandy loam 0 0 1 absent
residuals+humified
Group 6 (1) 5 medium humified Sandy loam 0 0 0 heterogenousirondistribution
Group 7 (2) 15 medium coarse residuals Loamy sand 0 0 1 related toroots spots
4358
HESSD10 4337ndash4367 2013
Spatio-temporalheterogeneity of
riparian soilmorphology
B Fournier et al
Title Page
Abstract Introduction
Conclusions References
Tables Figures
J I
J I
Back Close
Full Screen Esc
Printer-friendly Version
Interactive Discussion
Discussion
Paper
|D
iscussionP
aper|
Discussion
Paper
|D
iscussionP
aper|
Table 2 Criteria and indicators of the soil morphology method for floodplain restoration successassessment
Criterion Indicators Range Application Reference Rationaledomain
Div
ersi
ty Shannon 0 ndashgtn Soil profile Hill (1973) Indicator of soiltopsoilindex Topsoil habitat diversityRichness 0 ndashgtnmax Soil profile Indicator of soiltopsoil
Topsoil habitat diversity
Typi
calit
y
Frequency of Expressed Soil profile AFES (2008) Indicator of soil typicaltypical soil in of natural floodplainsprofile groupsFrequency of Idem Topsoil AFES (2008) Indicator of recenttypical topsoil changes characteristicgroups of natural floodplains
Dyn
amis
m
Total number 0 ndashgtn Soil profile Bullinger-Weber Indicator of morphologicalof horizons per et al (2007) changes due to fluvialmeter (Hm) dynamicsElevation minusnndashgtn Topography Indicator of rate ofvariation through erosionsedimentationtime (∆)
4359
HESSD10 4337ndash4367 2013
Spatio-temporalheterogeneity of
riparian soilmorphology
B Fournier et al
Title Page
Abstract Introduction
Conclusions References
Tables Figures
J I
J I
Back Close
Full Screen Esc
Printer-friendly Version
Interactive Discussion
Discussion
Paper
|D
iscussionP
aper|
Discussion
Paper
|D
iscussionP
aper|
Table 3 Soil diversity and richness calculated at the Thur site
N0 N1 N2 E1 E2 J
Profile Open habitats 7 428 347 061 050 075Forest 2 197 195 097 097 098Pasture 4 295 260 074 065 078
Topsoil Open habitats 6 450 378 075 063 084Forest 4 259 203 065 051 069Pasture 3 261 233 087 078 087
4360
HESSD10 4337ndash4367 2013
Spatio-temporalheterogeneity of
riparian soilmorphology
B Fournier et al
Title Page
Abstract Introduction
Conclusions References
Tables Figures
J I
J I
Back Close
Full Screen Esc
Printer-friendly Version
Interactive Discussion
Discussion
Paper
|D
iscussionP
aper|
Discussion
Paper
|D
iscussionP
aper|
Table 4 Relative abundance () of profile and topsoil groups for the restored and referenceareas
Soil profilegroup 1 group 2 group 3 group 4 group 5 group 6 group 7 group 8
Open habitats 13 118 ndash 421 289 105 39 13Forest ndash 583 ndash ndash ndash ndash 417 ndashPasture 455 409 91 ndash ndash 45 ndash ndash
Topsoil layergroup 1 group 2 group 3 group 4 group 5 group 6 group 7
Open habitats 79 276 132 395 92 ndash 26Forest 583 ndash ndash 83 250 83 ndashPasture 636 ndash ndash 227 136 ndash ndash
4361
HESSD10 4337ndash4367 2013
Spatio-temporalheterogeneity of
riparian soilmorphology
B Fournier et al
Title Page
Abstract Introduction
Conclusions References
Tables Figures
J I
J I
Back Close
Full Screen Esc
Printer-friendly Version
Interactive Discussion
Discussion
Paper
|D
iscussionP
aper|
Discussion
Paper
|D
iscussionP
aper|
Table 5 Averages of plant species biodiversity metrics for the open and forest habitats of theRiver Thur site
N0 N1 N2 E1 E2 J
Open habitats 1788 439 287 025 017 048Forest 1671 675 488 041 030 067
4362
HESSD10 4337ndash4367 2013
Spatio-temporalheterogeneity of
riparian soilmorphology
B Fournier et al
Title Page
Abstract Introduction
Conclusions References
Tables Figures
J I
J I
Back Close
Full Screen Esc
Printer-friendly Version
Interactive Discussion
Discussion
Paper
|D
iscussionP
aper|
Discussion
Paper
|D
iscussionP
aper|
0
5
10
15
20
0 10 20 30 40 50 60 70H
m
Distance to the river (m)
b) Control area
0
5
10
15
20
0 10 20 30 40 50 60 70
Hm
Distance to the river (m)
a) Restored area
Fig 1 Number of horizons per meter (Hm) versus lateral distance to the river (m) for therestored (a) and the reference areas (b)
4363
HESSD10 4337ndash4367 2013
Spatio-temporalheterogeneity of
riparian soilmorphology
B Fournier et al
Title Page
Abstract Introduction
Conclusions References
Tables Figures
J I
J I
Back Close
Full Screen Esc
Printer-friendly Version
Interactive Discussion
Discussion
Paper
|D
iscussionP
aper|
Discussion
Paper
|D
iscussionP
aper|
-2
-1
0
1
2
10 20 30 40 50 60 gt60
Elev
atio
n de
lta (m
)
Distance to the river (m)
a) Sedimentation Erosion before the restoration
RestoredUn-restored
RestoredUn-restored-2
-1
0
1
2
10 20 30 40 50 60 gt60
Elev
atio
n de
lta (m
)
Distance to the river (m)
b) Sedimentation Erosion after the restoration
Fig 2 Average elevation deltas (m) and their associated standard deviations before (a periodranging from 1996 to 2002) and after the restoration (b period ranging from 2002 to 2007) inthe restored and in the reference (un-restored) areas Calculations are based on cross sectionsdata for seven classes of distance to the river (10 m sections) Positive deltas (+) correspondto sedimentation process and negative deltas (minus) to erosion process
4364
HESSD10 4337ndash4367 2013
Spatio-temporalheterogeneity of
riparian soilmorphology
B Fournier et al
Title Page
Abstract Introduction
Conclusions References
Tables Figures
J I
J I
Back Close
Full Screen Esc
Printer-friendly Version
Interactive Discussion
Discussion
Paper
|D
iscussionP
aper|
Discussion
Paper
|D
iscussionP
aper|
-2
-1
0
1
10 20 30 40 50 60 gt60
Elev
atio
n de
lta (m
)Distance to the river (m)
b) Q5 flood effect after restoration
RestoredUn-restored
-2
-1
0
1
10 20 30 40 50 60 gt60
Elev
atio
n de
lta (m
)
Distance to the river (m)
a) Q5 flood effect before restoration
RestoredUn-restored
Fig 3 Effects of a single flood with a similar discharge (Q5 five-year flood) on elevation deltas(m) in the restored and in the reference area before (a) and after restoration (b) Calculationsare based on cross sections data for seven classes of distance to the river (10 m sections)Positive deltas (+) correspond to sedimentation process and negative deltas (minus) to erosionprocess
4365
HESSD10 4337ndash4367 2013
Spatio-temporalheterogeneity of
riparian soilmorphology
B Fournier et al
Title Page
Abstract Introduction
Conclusions References
Tables Figures
J I
J I
Back Close
Full Screen Esc
Printer-friendly Version
Interactive Discussion
Discussion
Paper
|D
iscussionP
aper|
Discussion
Paper
|D
iscussionP
aper|
0
5
10
15
20
0 10 20 30 40 50 60 70
Hm
Distance to the river (m)
No vegetation Sparse vegetation
and thicket
Thicket Willow
bushes
Forest
Sp
ars
e
ve
ge
tati
on
Fig 4 Vegetation successional stages versus soil dynamism (Hm) in the restored area (0ndash65 mfrom the river)
4366
HESSD10 4337ndash4367 2013
Spatio-temporalheterogeneity of
riparian soilmorphology
B Fournier et al
Title Page
Abstract Introduction
Conclusions References
Tables Figures
J I
J I
Back Close
Full Screen Esc
Printer-friendly Version
Interactive Discussion
Discussion
Paper
|D
iscussionP
aper|
Discussion
Paper
|D
iscussionP
aper|
100
80
60
40
20
0
0-15 15-35 35-45 45-55 55-65
Group4
Group5
Group6
Group2
Group7
Group8
Group1
No
vegetation
Willow
bushes
Thicket ForestSparse
vegetation
+ Thicket
Fig 5 Vegetation successional stages versus frequency of soil profile groups in the restoredarea Soil groups are given according to their succession along the river lateral gradient Soilprofile group 3 was only observed in the control area
4367
HESSD10 4337ndash4367 2013
Spatio-temporalheterogeneity of
riparian soilmorphology
B Fournier et al
Title Page
Abstract Introduction
Conclusions References
Tables Figures
J I
J I
Back Close
Full Screen Esc
Printer-friendly Version
Interactive Discussion
Discussion
Paper
|D
iscussionP
aper|
Discussion
Paper
|D
iscussionP
aper|
material lacking organic matter occurred close to the river (topsoil types 2 and 3)Topsoils showing hydromorphic features (group 7) remained marginal since they ac-counted for 3 of the investigated topsoils
35 Vegetation
In total 100 species were identified at the Thur River site These species were or-5
ganized into five well-differentiated vegetation successional stages along the lateralgradient (1) the closest to the river no vegetation or only isolated plants (2) patchesof pioneer vegetation and (3) a thicket dominated by Phalaris arundinacea (4) willowbushes dominated by Salix viminalis (5) a deciduous forest dominated by Fraxinusexcelsior far from the river The control (un-restored) area was a managed pasture10
dominated by Arrhenatherum elatius It was thus not meaningful to include it in thesuccession and compare it with the other habitats We rather focused on the succes-sion of plant communities along the river lateral gradient
Plant species diversity and evenness were higher in the forest whereas the openhabitats and forest had similar values of species diversity The increase in plant species15
evenness paralleled the one in soil evenness but this was not the case for richnessand diversity Vegetation successional stages corresponded to those in soil dynamismThe notable exception was the Phalaris thickets vs willow bushes where differences invegetation did not match those observed in soil This is most likely due to the fact thatthe willow bushes were planted during the restoration and are not part of the natural20
successionVegetation was expected to respond to the composition of profile groups As ex-
pected the typicality criterion was successful in predicting the broad vegetation typeswithin the site (Fig 5) Pioneer vegetation appeared with the first stages of soil develop-ment (profile 5) whereas when soils were too poorly developed (profile 4) no vegetation25
was present Vegetation colonization in the most dynamic part of the gradient (profile4) was associated to organic matter accumulation (topsoil 4) Data from topsoils suchas organic matter content and origin are therefore complementary to those provided
4348
HESSD10 4337ndash4367 2013
Spatio-temporalheterogeneity of
riparian soilmorphology
B Fournier et al
Title Page
Abstract Introduction
Conclusions References
Tables Figures
J I
J I
Back Close
Full Screen Esc
Printer-friendly Version
Interactive Discussion
Discussion
Paper
|D
iscussionP
aper|
Discussion
Paper
|D
iscussionP
aper|
from profile morphology Alluvial forests (Fraxinion) mainly occurred on stable moistsoils (profiles 2 and 7) Potential surfaces of suitable hydromorphic soils for the typicalvegetation of braided river lateral branches such as Typha minima and Inula Helveticafor which reintroduction plans exist in Switzerland (Keel and Floss 2004 Floss andKeel 2004) were only limited in our study area (ie only one sampling point for profile5
type 8)
4 Discussion
The restoration of River Thur globally increased soil diversity and improved dynamismand typicality It changed the fluvial dynamics leading to changes in soil morphology(eg intensity of erosionsedimentation processes coarse material and organic matter10
content) and soil functioning (eg loss of hydromorphy) The most striking changesoccurred within the first 30 m from the river Post-restoration fluvial dynamics createddiverse and dynamic patterns of soils close to the river Habitats located further awayfrom the river were less frequently exposed to floods and therefore less influencedby the restored fluvial dynamic However restoration had not yet succeeded in creat-15
ing significant surfaces of hydromorphic soils typical of braided river lateral branches(AFES 2008 Guenat et al 2003 IUSS Working Group 2006)
Given the known importance of soil type in determining vascular plant communi-ties (Gobat 2010) we hypothesized that a relatively simple study of soil morphologywould provide an indirect source of information on the potential vegetation and plant20
diversity of a site This was not the case for diversity and richness most likely due tothe influence of factors such as soil chemistry water and nutrient availability surfaceconnectivity biotic interactions and species reservoir However changes in the even-ness of soil groups and in soil dynamism and typicality paralleled those observed forvegetation in agreement with our hypotheses Indeed the Hm index reflected the num-25
ber of vegetation successional stages Soils typical of floodplain lateral channels werestrongly under-represented and the vegetation associated with such conditions was
4349
HESSD10 4337ndash4367 2013
Spatio-temporalheterogeneity of
riparian soilmorphology
B Fournier et al
Title Page
Abstract Introduction
Conclusions References
Tables Figures
J I
J I
Back Close
Full Screen Esc
Printer-friendly Version
Interactive Discussion
Discussion
Paper
|D
iscussionP
aper|
Discussion
Paper
|D
iscussionP
aper|
not yet able to colonize the site The dynamism and typicality of soil morphology asdescribed here can thus allow predicting major changes in potential vegetation ndash andother organisms responding either directly to changes in soil type or to the changesin vegetation ndash resulting from restoration project The increased diversity of soil typesand the dramatic changes of dynamism suggest a positive impact of restoration but5
the lack of typical hydromorphic soils could have been improved by integrating soil mor-phology in early project planning Thus five years after river widening the indicators ofsoil morphology suggest that this restoration project was a partial success in restoringsoil habitat and vegetation
Previous evaluations of the same site but based on different methods criteria and10
indicators reached similar conclusions Woolsey et al (2007) found that fish assem-blage structure and composition were similar in embanked and restored reaches andconcluded that the restoration of River Thur failed to meet the objectives lsquonear natu-ral abundance and diversity of fauna Weber et al (2009) showed that hydro-physicalhabitat diversity had been improved by the widening but that the current geomorpholog-15
ical complexity was still considerably impaired in the restored reach in comparison withhistorical near-natural shoreline Rohde et al (2004) used GIS methods based on land-scape indexes and vegetation and concluded that the widening improved the degree ofvegetation naturalness but in a limited way as compared to other restoration projectsAlthough the methods used were fundamentally different the results we obtained us-20
ing soil morphology were in agreement with these other evaluations The indicators weused also allowed investigating complementary aspects of floodplain restoration thediversity criterion proved to be complementary to vegetation surveys the dynamismcriterion discriminated precisely the zones that were differently impacted by the fluvialdynamic and the typicality criterion allowed characterizing the changes among these25
zonesIn the context of river restoration indicators should be easily measured be sensi-
tive to stresses on the system demonstrate predictable responses to stresses and beintegrative (Palmer et al 2005) Our results show that soil morphology criterion and
4350
HESSD10 4337ndash4367 2013
Spatio-temporalheterogeneity of
riparian soilmorphology
B Fournier et al
Title Page
Abstract Introduction
Conclusions References
Tables Figures
J I
J I
Back Close
Full Screen Esc
Printer-friendly Version
Interactive Discussion
Discussion
Paper
|D
iscussionP
aper|
Discussion
Paper
|D
iscussionP
aper|
indicators fit these requirements Soils may respond slowly to perturbations such asriverbed widening but in our case clear changes in soil morphology were already ob-served five years after restoration Furthermore soil indicators provide two differentand complementary levels of information (ie soil unitsprofile topsoil) Neverthelessthe time between the restoration and the integration of the changes into soil morphol-5
ogy depends on the fluvial regime Successive floods (including HQ5 HQ10 or HQ20)have to occur to potentially modify the soil morphology Erosional and depositional pro-cesses should be frequent ideally corresponding to the ldquomedium-energy non cohesivefloodplainsrdquo river category of Nanson and Croke (1992) with braided meandering andanastomosing channels10
We studied the relatively short-term effects of floodplain restoration According toBallantine and Schneider (2009) as soil development is a relatively slow process whichonly appears to accelerate later in the successional recovery sequence the role ofdifferent soil successional phases in determining long-term trajectories of ecosystemdevelopment should be considered in restoration design research and monitoring It15
would therefore be useful to assess the longer-term trends of soil development at thestudy site and other comparable restored floodplains
5 Conclusions
Our results show that soil morphology responded fast and clearly to river restorationand that typicality and dynamism correlated to vegetation changes Analysis of soil20
morphology has the potential to improve the quality and accuracy of rapid assessmentprotocols (Sifneos et al 2010 Stein et al 2009)
Despite the known importance of soils in terrestrial ecology soil morphology hasbeen under-used for the assessment of floodplain restoration success The number ofriver restoration projects is increasing rapidly but there is still no general agreement on25
evaluation methods The analysis of soil morphology offers many advantages (ease of
4351
HESSD10 4337ndash4367 2013
Spatio-temporalheterogeneity of
riparian soilmorphology
B Fournier et al
Title Page
Abstract Introduction
Conclusions References
Tables Figures
J I
J I
Back Close
Full Screen Esc
Printer-friendly Version
Interactive Discussion
Discussion
Paper
|D
iscussionP
aper|
Discussion
Paper
|D
iscussionP
aper|
use quick and cost-effective) that make it a promising approach for the river restorationevaluatorrsquos tool kit
Acknowledgements The authors kindly acknowledge the ETH-Domain Competence CenterEnvironment and Sustainability (CCES) project RECORD for funding Karin Grin for fieldworkand Ralph Thielen for helping in the data collection5
References
AFES Referentiel pedologique 2008 Collection Savoir-Faire Editions Quae Versailles Paris2008
Baer O Geographie de la Suisse Editions Delta Vevey 1976Baize D and Girard M-C Referentiel pedologique 2008 Collection Savoir-Faire Editions10
Quae Versailles Paris 2008Ballantine K and Schneider R Fifty-five years of soil development in restored freshwater
depressional wetlands Ecol Appl 19 1467ndash1480 doi10189007-05881 2009Bernhardt E S Palmer M A Allan J D Alexander G Barnas K Brooks S Carr J Clay-
ton S Dahm C Follstad-Shah J Galat D Gloss S Goodwin P Hart D Hassett B15
Jenkinson R Katz S Kondolf G M Lake P S Lave R Meyer J L OrsquoDonnell T KPagano L Powell B and Sudduth E Ecology synthesizing US river restoration effortsScience 308 636ndash637 doi101126science1109769 2005
Bernhardt E S Sudduth E B Palmer M A Allan J D Meyer J L Alexander GFollastad-Shah J Hassett B Jenkinson R Lave R Rumps J and Pagano L Restor-20
ing rivers one reach at a time results from a survey of US river restoration practitionersRestor Ecol 15 482ndash493 2007
Braun-Blanquet J Pflanzensoziologie Grundzuge der Vegetationskunde Springer Vienna1964
Bullinger-Weber G and Gobat J M Identification of facies models in alluvial soil25
formation the case of a Swiss alpine floodplain Geomorphology 74 181ndash195doi101016jgeomorph200507016 2006
Bush J K Soil Nitrogen and Carbon after Twenty Years of Riparian Forest Development SoilSci Soc Am J 72 815ndash822 doi102136sssaj20070120 2008
4352
HESSD10 4337ndash4367 2013
Spatio-temporalheterogeneity of
riparian soilmorphology
B Fournier et al
Title Page
Abstract Introduction
Conclusions References
Tables Figures
J I
J I
Back Close
Full Screen Esc
Printer-friendly Version
Interactive Discussion
Discussion
Paper
|D
iscussionP
aper|
Discussion
Paper
|D
iscussionP
aper|
Caylor K K Manfreda S and Rodriguez-Iturbe I On the coupled geomorphologi-cal and ecohydrological organization of river basins Adv Water Resour 28 69ndash86doi101016jadvwatres200408013 2005
Cole C and Kentula M Monitoring and assessment ndash what to measure and why in Wet-lands edited by LePage B A Springer Netherlands 137ndash152 20115
Daniels J M Floodplain aggradation and pedogenesis in a semiarid environment Geomor-phology 56 225ndash242 doi101016S0169-555X(03)00153-3 2003
Everitt B Landau S and Leese M Cluster analysis Hodder Arnold London 237 pp 2001Floss I and Keel A Aktionsplan Kleiner Rohrkolben (Typha minima Hoppe) Arten-
schutzmassnahmen fur gefahrdete Farn- und Blutenpflanzen im Kanton Zurich Fachstelle10
Naturschutz Kanton Zurich Zurich 2004Gallandat J D Gobat J-M and Roulier C Cartographie des zones alluviales drsquoimportance
nationale rapport et annexes Cahiers de lrsquoenvironnement No 199 Office federal delrsquoenvironnement des forets et du paysage (OFEFP) Berne 1993
Gerrard A J Soil Geomorphology Springer 199215
Gobat J M The Living Soil Fundamentals of Soil Science and Soil Biology Science Publish-ers Enfield 2010
Guenat C Bureau F and Charnet F Genese diversite et fonctionnement des sols sous ladependance drsquoun cours drsquoeau ecologie fonctions et gestion in Forets riveraines des coursdrsquoeau IDF Paris 200320
Heneghan L Miller S P Baer S Callaham M A Montgomery J Pavao-Zuckerman MRhoades C C and Richardson S Integrating soil ecological knowledge into restorationmanagement Restor Ecol 16 608ndash617 doi101111j1526-100X200800477x 2008
Hill M O Diversity and evenness a unifying notation and its consequences Ecology 54427ndash432 doi1023071934352 197325
Ibanez J J De-Albs S Bermudez F F and Garcıa-Alvarez A Pedodiversity concepts andmeasures Catena 24 215ndash232 doi1010160341-8162(95)00028-Q 1995
Ibanez J J De-Alba S Lobo A and Zucarello V Pedodiversity and global soil pat-terns at coarse scales (with discussion) Geoderma 83 171ndash192 doi101016S0016-7061(97)00147-X 199830
Imboden C Eaux vivantes edited by LSPN Departement federal de lrsquoInterieur Bale 1976IUSS Working Group World reference base for soil resources in World Soil Resources Re-
port 103 FAO Rome 128 pp 2006
4353
HESSD10 4337ndash4367 2013
Spatio-temporalheterogeneity of
riparian soilmorphology
B Fournier et al
Title Page
Abstract Introduction
Conclusions References
Tables Figures
J I
J I
Back Close
Full Screen Esc
Printer-friendly Version
Interactive Discussion
Discussion
Paper
|D
iscussionP
aper|
Discussion
Paper
|D
iscussionP
aper|
IUSS Working Group WRB World Reference Base for Soil Resources 2006 a Framework forInternational Classification Correlation and Communication Food and Agriculture Organi-zation of the United Nations Rome 2006
Keel A and Floss I Aktionsplan Schweizer Alant (Inula helvetica Weber) Artenschutzmass-nahmen fur gefahrdete Farn- und Blutenpflanzen im Kanton Zurich Fachstelle Naturschutz5
Kanton Zurich Zurich 2004Malmqvist B and Rundle S Threats to the running water ecosystems of the world Environ
Conserv 29 134ndash153 doi101017S0376892902000097 2002Moor M Pflanzengesellschaften schweizerischer Flussauen Mit Sch Anst Forstl Ver-
suchsw 34 221ndash360 195810
Naiman R Bechtold J Drake D Latterell J OrsquoKeefe T and Balian E Origins patternsand importance of heterogeneity in riparian systems in Ecosystem function in heteroge-neous landscapes Springer-Verlag New York 279ndash309 2005
Nakamura K Amano K and Tockner K River restoration European perspectives andlessons for Japan Ecol Civ Eng 8 201ndash214 200615
Nakamura K Tockner K and Amano K River and wetland restoration lessons from JapanBioscience 56 419ndash429 doi1016410006-3568(2006)056[0419rawrlf]20co2 2009
Nanson G C and Croke J C A genetic classification of floodplains Geomorphology 4459ndash486 doi1010160169-555X(92)90039-Q 1992
Nassauer J I Kosek S E and Corry R C Meeting public expectations with eco-20
logical inovation in riparian landscapes J Am Water Resour Assoc 37 1439ndash1443doi101111j1752-16882001tb03650x 2001
Orr C H Stanley E H Wilson K A and Finlay J C Effects of Restoration and Reflood-ing on Soil Denitrification in a Leveed Midwestern Floodplain Ecol Appl 17 2365ndash2376doi10189006-21131 200725
Palmer MA and Bernhardt E S Hydroecology and river restoration Ripe for research andsynthesis Water Resour Res 42 W03S07 doi1010292005WR004354 2006
Palmer MA Bernhardt E S Allan J D Lake P S Alexander G Brooks S Carr JClayton S Dahm C N Shah J F Galat D L Loss S G Goodwin P Hart D DHassett B Jenkinson R Kondolf G M Lave R Meyer J L OrsquoDonnell T K Pagano L30
and Sudduth E Standards for ecologically successful river restoration J Appl Ecol 42208ndash217 2005
4354
HESSD10 4337ndash4367 2013
Spatio-temporalheterogeneity of
riparian soilmorphology
B Fournier et al
Title Page
Abstract Introduction
Conclusions References
Tables Figures
J I
J I
Back Close
Full Screen Esc
Printer-friendly Version
Interactive Discussion
Discussion
Paper
|D
iscussionP
aper|
Discussion
Paper
|D
iscussionP
aper|
Palmer MA Allan J D Meyer J and Bernhardt E S River Restoration in the Twenty-First Century Data and Experiential Knowledge to Inform Future Efforts Restor Ecol 15472ndash481 2007
Orr C H Stanley E H Wilson K A and Finlay J C Effects of Restoration and Refloodingon Soil Denitrification in a Leveed Midwestern Floodplain Ecological Applications 17 2365ndash5
2376 doi10189006-21131 2007Quideau S A Chadwick O A Benesi A Graham R C and Anderson M A A direct link
between forest vegetation type and soil organic matter composition Geoderma 104 41ndash60doi101016S0016-7061(01)00055-6 2001
Rohde S River Restoration Potential and Limitations to Re-Establish Riparian Landscapes10
Assessment amp Planning PhD thesis Swiss Federal Institute of Technology Zurich Zurich133 pp 2004
Rohde S Kienast F and Burgi M Assessing the restoration success of river wideningsa landscape approach Environ Manage 34 574ndash589 2004
Roulier C Typologie et dynamique de la vegetation des zones alluviales de Suisse Geob-15
otanica Helvetica 72 138 pp 1998Rousseeuw P Silhouettes a graphical aid to the interpretation and validation of cluster anal-
ysis J Comput Appl Math 20 53ndash65 1987Saldana A and Ibanez J J Pedodiversity analysis at large scales an example of
three fluvial terraces of the Henares River (central Spain) Geomorphology 62 123ndash13820
doi101016jgeomorph200402007 2004Saldana A and Ibanez J J Pedodiversity connectance and spatial variabil-
ity of soil properties what is the relationship Ecol Model 208 342ndash352doi101016jecolmodel200706006 2007
Saxton K E Rawls W J Romberger J S and Papendick R I Estimating generalized25
soil-water characteristics from texture Soil Sci Soc Am J 50 1031ndash1036 1986Schneider P Vogt T Schirmer M Doetsch J Linde N Pasquale N Perona P and
Cirpka O A Towards improved instrumentation for assessing river-groundwater interactionsin a restored river corridor Hydrol Earth Syst Sci 15 2531ndash2549 doi105194hess-15-2531-2011 201130
Sifneos J Herlihy A Jacobs A and Kentula M Calibration of the Delaware Rapid Assess-ment Protocol to a comprehensive measure of wetland condition Wetlands 30 1011ndash1022doi101007s13157-010-0093-z 2010
4355
HESSD10 4337ndash4367 2013
Spatio-temporalheterogeneity of
riparian soilmorphology
B Fournier et al
Title Page
Abstract Introduction
Conclusions References
Tables Figures
J I
J I
Back Close
Full Screen Esc
Printer-friendly Version
Interactive Discussion
Discussion
Paper
|D
iscussionP
aper|
Discussion
Paper
|D
iscussionP
aper|
Stein E D Fetscher A E Clark R P Wiskind A Grenier J L Sutula M Collins J Nand Grosso C Validation of a wetland rapid assessment method use of Eparsquos level 1-2-3framework for method testing and refinement Wetlands 29 648ndash665 doi10167207-23912009
Sudduth E B Meyer J L and Bernhardt E S Stream restoration practices in the south-5
eastern United States Restor Ecol 15 573ndash583 2007Sutton-Grier A E Kenney M A and Richardson C J Examining the relationship be-
tween ecosystem structure and function using structural equation modelling a case studyexamining denitrification potential in restored wetland soils Ecol Model 221 761ndash768doi101016jecolmodel200911015 201010
Tockner K and Stanford J A Riverine flood plains present state and future trends EnvironConserv 29 308ndash330 2002
Toomanian N and Esfandiarpoor I Challenges of pedodiversity in soil science Eurasian SoilSci 43 1486ndash1502 doi101134s1064229310130089 2010
Wardle D A Communities and Ecosystems Linking the Aboveground and Belowground Com-15
ponents Princeton University Press Princeton NJ 2002Weber C Schager E and Peter A Habitat diversity and fish assemblage structure in
local river widenings a case study on a swiss river River Res Appl 25 687ndash701doi101002rra1176 2009
Wohl E Angermeier P L Bledsoe B Kondolf G M MacDonnell L Merritt D M20
Palmer M A Poff N L and Tarboton D River restoration Water Resour Res 41 1ndash12 2005
Woolsey S Capelli F Gonser T Hoehn E Hostmann M Junker B Paetzold ARoulier C Schweizer S Tiegs S D Tockner K Weber C and Peter A A strategyto assess river restoration success Freshwater Biol 52 752ndash769 200725
4356
HESSD10 4337ndash4367 2013
Spatio-temporalheterogeneity of
riparian soilmorphology
B Fournier et al
Title Page
Abstract Introduction
Conclusions References
Tables Figures
J I
J I
Back Close
Full Screen Esc
Printer-friendly Version
Interactive Discussion
Discussion
Paper
|D
iscussionP
aper|
Discussion
Paper
|D
iscussionP
aper|
Table 1a Description of eight soil groups and number of ldquoindividualsrdquo (n) resulting from a clus-ter analysis based on a simplified set of variables for profiles (1a) and five groups of topsoilhorizons (1b) Soil taxonomy is based on AFES (2008) and correspondences to the FAO Worldreference base for soil resources (IUSS Working Group 2006) are given Depth is the meandepth of a particular group of profiles (cm) Texture is based on the US texture triangle (Saxtonet al 1986) For the profiles texture is described using the total number of loam sandy loamand sandy horizons within each group of profile and the average number of horizons per pro-file The volumetric percentage of coarse material (blocks pebbles and gravels) of the coars-est horizon within the profile is indicated under coarse material Proportion of blocks pebblesand gravels are given for each group in percentage of total volume Topsoil thickness (1b) isgiven in cm Hydromorphic features represent the average depth (in cm) at which hydromor-phic features were first observed The intensity of the hydromorphic features is given using asemi-quantitative scale (absence weak moderate and high) The organic matter OM content(null low medium and high) and type (no humified and coarse residuals) are given
Taxonomy Number of Horizons Hydromorphy
Soil AFES 2008 WRB 2006 Depth Loam Sandy Sand Average Coarse Hydromorphic Intensity ofprofile [cm] loam per material features hydromorphy
profile []
Group 1 REDOXISOLS fluviques Gleyic Fluvisols 111 7 47 0 2ndash4 03 15 Moderate(11) carbonates CalcaricGroup FLUVIOSOLS typiques Fluvisols 95 0 91 2 1ndash4 12 No No2 (25) carbonates CalcaricGroup FLUVIOSOLS Fluvisols 120 1 10 0 3 65 50 Weak to moderate3 (2) typiques Calcaric with
redoxiques redoximorphiccarbonates features
Group FLUVIOSOLS bruts Regosols 08 0 1 31 0 87 No No4 (32) carbonates CalcaricGroup FLUVIOSOLS bruts Regosols 20 0 42 5 1ndash2 45 No No5 (22) carbonates CalcaricGroup FLUVIOSOLS Fluvisols 69 0 36 2 3 56 25 weak6 (9) typiques Calcaric with
redoxiques redoximorphiccarbonates features
Group FLUVIOSOLS Fluvisols 104 0 33 0 2 11 50 Weak to moderate7 (8) typiques Calcaric with
redoxiques redoximorphiccarbonates features
Group REDUCTISOLS fulviques Gleysols 30 0 2 0 1 7 15 High8 (1) carbonates Calcaric
4357
HESSD10 4337ndash4367 2013
Spatio-temporalheterogeneity of
riparian soilmorphology
B Fournier et al
Title Page
Abstract Introduction
Conclusions References
Tables Figures
J I
J I
Back Close
Full Screen Esc
Printer-friendly Version
Interactive Discussion
Discussion
Paper
|D
iscussionP
aper|
Discussion
Paper
|D
iscussionP
aper|
Table 1b
Topsoil Thickness Organic matter Organic matter Texture (US Blocks Pebbles Gravel Hydromorphiclayer [cm] content type triangle) [] [] [] features
Group 1 (27) 8 low-medium humified Sandy loam 0 0 0 absentGroup 2 (21) 0 null no Sand 06 68 29 absentGroup 3 (10) 0 null no Sand 09 33 55 absentGroup 4 (36) 9 medium-low coarse Sandy loam 0 0 5 absent
residualsGroup 5 (13) 95 medium-low coarse Sandy loam 0 0 1 absent
residuals+humified
Group 6 (1) 5 medium humified Sandy loam 0 0 0 heterogenousirondistribution
Group 7 (2) 15 medium coarse residuals Loamy sand 0 0 1 related toroots spots
4358
HESSD10 4337ndash4367 2013
Spatio-temporalheterogeneity of
riparian soilmorphology
B Fournier et al
Title Page
Abstract Introduction
Conclusions References
Tables Figures
J I
J I
Back Close
Full Screen Esc
Printer-friendly Version
Interactive Discussion
Discussion
Paper
|D
iscussionP
aper|
Discussion
Paper
|D
iscussionP
aper|
Table 2 Criteria and indicators of the soil morphology method for floodplain restoration successassessment
Criterion Indicators Range Application Reference Rationaledomain
Div
ersi
ty Shannon 0 ndashgtn Soil profile Hill (1973) Indicator of soiltopsoilindex Topsoil habitat diversityRichness 0 ndashgtnmax Soil profile Indicator of soiltopsoil
Topsoil habitat diversity
Typi
calit
y
Frequency of Expressed Soil profile AFES (2008) Indicator of soil typicaltypical soil in of natural floodplainsprofile groupsFrequency of Idem Topsoil AFES (2008) Indicator of recenttypical topsoil changes characteristicgroups of natural floodplains
Dyn
amis
m
Total number 0 ndashgtn Soil profile Bullinger-Weber Indicator of morphologicalof horizons per et al (2007) changes due to fluvialmeter (Hm) dynamicsElevation minusnndashgtn Topography Indicator of rate ofvariation through erosionsedimentationtime (∆)
4359
HESSD10 4337ndash4367 2013
Spatio-temporalheterogeneity of
riparian soilmorphology
B Fournier et al
Title Page
Abstract Introduction
Conclusions References
Tables Figures
J I
J I
Back Close
Full Screen Esc
Printer-friendly Version
Interactive Discussion
Discussion
Paper
|D
iscussionP
aper|
Discussion
Paper
|D
iscussionP
aper|
Table 3 Soil diversity and richness calculated at the Thur site
N0 N1 N2 E1 E2 J
Profile Open habitats 7 428 347 061 050 075Forest 2 197 195 097 097 098Pasture 4 295 260 074 065 078
Topsoil Open habitats 6 450 378 075 063 084Forest 4 259 203 065 051 069Pasture 3 261 233 087 078 087
4360
HESSD10 4337ndash4367 2013
Spatio-temporalheterogeneity of
riparian soilmorphology
B Fournier et al
Title Page
Abstract Introduction
Conclusions References
Tables Figures
J I
J I
Back Close
Full Screen Esc
Printer-friendly Version
Interactive Discussion
Discussion
Paper
|D
iscussionP
aper|
Discussion
Paper
|D
iscussionP
aper|
Table 4 Relative abundance () of profile and topsoil groups for the restored and referenceareas
Soil profilegroup 1 group 2 group 3 group 4 group 5 group 6 group 7 group 8
Open habitats 13 118 ndash 421 289 105 39 13Forest ndash 583 ndash ndash ndash ndash 417 ndashPasture 455 409 91 ndash ndash 45 ndash ndash
Topsoil layergroup 1 group 2 group 3 group 4 group 5 group 6 group 7
Open habitats 79 276 132 395 92 ndash 26Forest 583 ndash ndash 83 250 83 ndashPasture 636 ndash ndash 227 136 ndash ndash
4361
HESSD10 4337ndash4367 2013
Spatio-temporalheterogeneity of
riparian soilmorphology
B Fournier et al
Title Page
Abstract Introduction
Conclusions References
Tables Figures
J I
J I
Back Close
Full Screen Esc
Printer-friendly Version
Interactive Discussion
Discussion
Paper
|D
iscussionP
aper|
Discussion
Paper
|D
iscussionP
aper|
Table 5 Averages of plant species biodiversity metrics for the open and forest habitats of theRiver Thur site
N0 N1 N2 E1 E2 J
Open habitats 1788 439 287 025 017 048Forest 1671 675 488 041 030 067
4362
HESSD10 4337ndash4367 2013
Spatio-temporalheterogeneity of
riparian soilmorphology
B Fournier et al
Title Page
Abstract Introduction
Conclusions References
Tables Figures
J I
J I
Back Close
Full Screen Esc
Printer-friendly Version
Interactive Discussion
Discussion
Paper
|D
iscussionP
aper|
Discussion
Paper
|D
iscussionP
aper|
0
5
10
15
20
0 10 20 30 40 50 60 70H
m
Distance to the river (m)
b) Control area
0
5
10
15
20
0 10 20 30 40 50 60 70
Hm
Distance to the river (m)
a) Restored area
Fig 1 Number of horizons per meter (Hm) versus lateral distance to the river (m) for therestored (a) and the reference areas (b)
4363
HESSD10 4337ndash4367 2013
Spatio-temporalheterogeneity of
riparian soilmorphology
B Fournier et al
Title Page
Abstract Introduction
Conclusions References
Tables Figures
J I
J I
Back Close
Full Screen Esc
Printer-friendly Version
Interactive Discussion
Discussion
Paper
|D
iscussionP
aper|
Discussion
Paper
|D
iscussionP
aper|
-2
-1
0
1
2
10 20 30 40 50 60 gt60
Elev
atio
n de
lta (m
)
Distance to the river (m)
a) Sedimentation Erosion before the restoration
RestoredUn-restored
RestoredUn-restored-2
-1
0
1
2
10 20 30 40 50 60 gt60
Elev
atio
n de
lta (m
)
Distance to the river (m)
b) Sedimentation Erosion after the restoration
Fig 2 Average elevation deltas (m) and their associated standard deviations before (a periodranging from 1996 to 2002) and after the restoration (b period ranging from 2002 to 2007) inthe restored and in the reference (un-restored) areas Calculations are based on cross sectionsdata for seven classes of distance to the river (10 m sections) Positive deltas (+) correspondto sedimentation process and negative deltas (minus) to erosion process
4364
HESSD10 4337ndash4367 2013
Spatio-temporalheterogeneity of
riparian soilmorphology
B Fournier et al
Title Page
Abstract Introduction
Conclusions References
Tables Figures
J I
J I
Back Close
Full Screen Esc
Printer-friendly Version
Interactive Discussion
Discussion
Paper
|D
iscussionP
aper|
Discussion
Paper
|D
iscussionP
aper|
-2
-1
0
1
10 20 30 40 50 60 gt60
Elev
atio
n de
lta (m
)Distance to the river (m)
b) Q5 flood effect after restoration
RestoredUn-restored
-2
-1
0
1
10 20 30 40 50 60 gt60
Elev
atio
n de
lta (m
)
Distance to the river (m)
a) Q5 flood effect before restoration
RestoredUn-restored
Fig 3 Effects of a single flood with a similar discharge (Q5 five-year flood) on elevation deltas(m) in the restored and in the reference area before (a) and after restoration (b) Calculationsare based on cross sections data for seven classes of distance to the river (10 m sections)Positive deltas (+) correspond to sedimentation process and negative deltas (minus) to erosionprocess
4365
HESSD10 4337ndash4367 2013
Spatio-temporalheterogeneity of
riparian soilmorphology
B Fournier et al
Title Page
Abstract Introduction
Conclusions References
Tables Figures
J I
J I
Back Close
Full Screen Esc
Printer-friendly Version
Interactive Discussion
Discussion
Paper
|D
iscussionP
aper|
Discussion
Paper
|D
iscussionP
aper|
0
5
10
15
20
0 10 20 30 40 50 60 70
Hm
Distance to the river (m)
No vegetation Sparse vegetation
and thicket
Thicket Willow
bushes
Forest
Sp
ars
e
ve
ge
tati
on
Fig 4 Vegetation successional stages versus soil dynamism (Hm) in the restored area (0ndash65 mfrom the river)
4366
HESSD10 4337ndash4367 2013
Spatio-temporalheterogeneity of
riparian soilmorphology
B Fournier et al
Title Page
Abstract Introduction
Conclusions References
Tables Figures
J I
J I
Back Close
Full Screen Esc
Printer-friendly Version
Interactive Discussion
Discussion
Paper
|D
iscussionP
aper|
Discussion
Paper
|D
iscussionP
aper|
100
80
60
40
20
0
0-15 15-35 35-45 45-55 55-65
Group4
Group5
Group6
Group2
Group7
Group8
Group1
No
vegetation
Willow
bushes
Thicket ForestSparse
vegetation
+ Thicket
Fig 5 Vegetation successional stages versus frequency of soil profile groups in the restoredarea Soil groups are given according to their succession along the river lateral gradient Soilprofile group 3 was only observed in the control area
4367

HESSD10 4337ndash4367 2013
Spatio-temporalheterogeneity of
riparian soilmorphology
B Fournier et al
Title Page
Abstract Introduction
Conclusions References
Tables Figures
J I
J I
Back Close
Full Screen Esc
Printer-friendly Version
Interactive Discussion
Discussion
Paper
|D
iscussionP
aper|
Discussion
Paper
|D
iscussionP
aper|
from profile morphology Alluvial forests (Fraxinion) mainly occurred on stable moistsoils (profiles 2 and 7) Potential surfaces of suitable hydromorphic soils for the typicalvegetation of braided river lateral branches such as Typha minima and Inula Helveticafor which reintroduction plans exist in Switzerland (Keel and Floss 2004 Floss andKeel 2004) were only limited in our study area (ie only one sampling point for profile5
type 8)
4 Discussion
The restoration of River Thur globally increased soil diversity and improved dynamismand typicality It changed the fluvial dynamics leading to changes in soil morphology(eg intensity of erosionsedimentation processes coarse material and organic matter10
content) and soil functioning (eg loss of hydromorphy) The most striking changesoccurred within the first 30 m from the river Post-restoration fluvial dynamics createddiverse and dynamic patterns of soils close to the river Habitats located further awayfrom the river were less frequently exposed to floods and therefore less influencedby the restored fluvial dynamic However restoration had not yet succeeded in creat-15
ing significant surfaces of hydromorphic soils typical of braided river lateral branches(AFES 2008 Guenat et al 2003 IUSS Working Group 2006)
Given the known importance of soil type in determining vascular plant communi-ties (Gobat 2010) we hypothesized that a relatively simple study of soil morphologywould provide an indirect source of information on the potential vegetation and plant20
diversity of a site This was not the case for diversity and richness most likely due tothe influence of factors such as soil chemistry water and nutrient availability surfaceconnectivity biotic interactions and species reservoir However changes in the even-ness of soil groups and in soil dynamism and typicality paralleled those observed forvegetation in agreement with our hypotheses Indeed the Hm index reflected the num-25
ber of vegetation successional stages Soils typical of floodplain lateral channels werestrongly under-represented and the vegetation associated with such conditions was
4349
HESSD10 4337ndash4367 2013
Spatio-temporalheterogeneity of
riparian soilmorphology
B Fournier et al
Title Page
Abstract Introduction
Conclusions References
Tables Figures
J I
J I
Back Close
Full Screen Esc
Printer-friendly Version
Interactive Discussion
Discussion
Paper
|D
iscussionP
aper|
Discussion
Paper
|D
iscussionP
aper|
not yet able to colonize the site The dynamism and typicality of soil morphology asdescribed here can thus allow predicting major changes in potential vegetation ndash andother organisms responding either directly to changes in soil type or to the changesin vegetation ndash resulting from restoration project The increased diversity of soil typesand the dramatic changes of dynamism suggest a positive impact of restoration but5
the lack of typical hydromorphic soils could have been improved by integrating soil mor-phology in early project planning Thus five years after river widening the indicators ofsoil morphology suggest that this restoration project was a partial success in restoringsoil habitat and vegetation
Previous evaluations of the same site but based on different methods criteria and10
indicators reached similar conclusions Woolsey et al (2007) found that fish assem-blage structure and composition were similar in embanked and restored reaches andconcluded that the restoration of River Thur failed to meet the objectives lsquonear natu-ral abundance and diversity of fauna Weber et al (2009) showed that hydro-physicalhabitat diversity had been improved by the widening but that the current geomorpholog-15
ical complexity was still considerably impaired in the restored reach in comparison withhistorical near-natural shoreline Rohde et al (2004) used GIS methods based on land-scape indexes and vegetation and concluded that the widening improved the degree ofvegetation naturalness but in a limited way as compared to other restoration projectsAlthough the methods used were fundamentally different the results we obtained us-20
ing soil morphology were in agreement with these other evaluations The indicators weused also allowed investigating complementary aspects of floodplain restoration thediversity criterion proved to be complementary to vegetation surveys the dynamismcriterion discriminated precisely the zones that were differently impacted by the fluvialdynamic and the typicality criterion allowed characterizing the changes among these25
zonesIn the context of river restoration indicators should be easily measured be sensi-
tive to stresses on the system demonstrate predictable responses to stresses and beintegrative (Palmer et al 2005) Our results show that soil morphology criterion and
4350
HESSD10 4337ndash4367 2013
Spatio-temporalheterogeneity of
riparian soilmorphology
B Fournier et al
Title Page
Abstract Introduction
Conclusions References
Tables Figures
J I
J I
Back Close
Full Screen Esc
Printer-friendly Version
Interactive Discussion
Discussion
Paper
|D
iscussionP
aper|
Discussion
Paper
|D
iscussionP
aper|
indicators fit these requirements Soils may respond slowly to perturbations such asriverbed widening but in our case clear changes in soil morphology were already ob-served five years after restoration Furthermore soil indicators provide two differentand complementary levels of information (ie soil unitsprofile topsoil) Neverthelessthe time between the restoration and the integration of the changes into soil morphol-5
ogy depends on the fluvial regime Successive floods (including HQ5 HQ10 or HQ20)have to occur to potentially modify the soil morphology Erosional and depositional pro-cesses should be frequent ideally corresponding to the ldquomedium-energy non cohesivefloodplainsrdquo river category of Nanson and Croke (1992) with braided meandering andanastomosing channels10
We studied the relatively short-term effects of floodplain restoration According toBallantine and Schneider (2009) as soil development is a relatively slow process whichonly appears to accelerate later in the successional recovery sequence the role ofdifferent soil successional phases in determining long-term trajectories of ecosystemdevelopment should be considered in restoration design research and monitoring It15
would therefore be useful to assess the longer-term trends of soil development at thestudy site and other comparable restored floodplains
5 Conclusions
Our results show that soil morphology responded fast and clearly to river restorationand that typicality and dynamism correlated to vegetation changes Analysis of soil20
morphology has the potential to improve the quality and accuracy of rapid assessmentprotocols (Sifneos et al 2010 Stein et al 2009)
Despite the known importance of soils in terrestrial ecology soil morphology hasbeen under-used for the assessment of floodplain restoration success The number ofriver restoration projects is increasing rapidly but there is still no general agreement on25
evaluation methods The analysis of soil morphology offers many advantages (ease of
4351
HESSD10 4337ndash4367 2013
Spatio-temporalheterogeneity of
riparian soilmorphology
B Fournier et al
Title Page
Abstract Introduction
Conclusions References
Tables Figures
J I
J I
Back Close
Full Screen Esc
Printer-friendly Version
Interactive Discussion
Discussion
Paper
|D
iscussionP
aper|
Discussion
Paper
|D
iscussionP
aper|
use quick and cost-effective) that make it a promising approach for the river restorationevaluatorrsquos tool kit
Acknowledgements The authors kindly acknowledge the ETH-Domain Competence CenterEnvironment and Sustainability (CCES) project RECORD for funding Karin Grin for fieldworkand Ralph Thielen for helping in the data collection5
References
AFES Referentiel pedologique 2008 Collection Savoir-Faire Editions Quae Versailles Paris2008
Baer O Geographie de la Suisse Editions Delta Vevey 1976Baize D and Girard M-C Referentiel pedologique 2008 Collection Savoir-Faire Editions10
Quae Versailles Paris 2008Ballantine K and Schneider R Fifty-five years of soil development in restored freshwater
depressional wetlands Ecol Appl 19 1467ndash1480 doi10189007-05881 2009Bernhardt E S Palmer M A Allan J D Alexander G Barnas K Brooks S Carr J Clay-
ton S Dahm C Follstad-Shah J Galat D Gloss S Goodwin P Hart D Hassett B15
Jenkinson R Katz S Kondolf G M Lake P S Lave R Meyer J L OrsquoDonnell T KPagano L Powell B and Sudduth E Ecology synthesizing US river restoration effortsScience 308 636ndash637 doi101126science1109769 2005
Bernhardt E S Sudduth E B Palmer M A Allan J D Meyer J L Alexander GFollastad-Shah J Hassett B Jenkinson R Lave R Rumps J and Pagano L Restor-20
ing rivers one reach at a time results from a survey of US river restoration practitionersRestor Ecol 15 482ndash493 2007
Braun-Blanquet J Pflanzensoziologie Grundzuge der Vegetationskunde Springer Vienna1964
Bullinger-Weber G and Gobat J M Identification of facies models in alluvial soil25
formation the case of a Swiss alpine floodplain Geomorphology 74 181ndash195doi101016jgeomorph200507016 2006
Bush J K Soil Nitrogen and Carbon after Twenty Years of Riparian Forest Development SoilSci Soc Am J 72 815ndash822 doi102136sssaj20070120 2008
4352
HESSD10 4337ndash4367 2013
Spatio-temporalheterogeneity of
riparian soilmorphology
B Fournier et al
Title Page
Abstract Introduction
Conclusions References
Tables Figures
J I
J I
Back Close
Full Screen Esc
Printer-friendly Version
Interactive Discussion
Discussion
Paper
|D
iscussionP
aper|
Discussion
Paper
|D
iscussionP
aper|
Caylor K K Manfreda S and Rodriguez-Iturbe I On the coupled geomorphologi-cal and ecohydrological organization of river basins Adv Water Resour 28 69ndash86doi101016jadvwatres200408013 2005
Cole C and Kentula M Monitoring and assessment ndash what to measure and why in Wet-lands edited by LePage B A Springer Netherlands 137ndash152 20115
Daniels J M Floodplain aggradation and pedogenesis in a semiarid environment Geomor-phology 56 225ndash242 doi101016S0169-555X(03)00153-3 2003
Everitt B Landau S and Leese M Cluster analysis Hodder Arnold London 237 pp 2001Floss I and Keel A Aktionsplan Kleiner Rohrkolben (Typha minima Hoppe) Arten-
schutzmassnahmen fur gefahrdete Farn- und Blutenpflanzen im Kanton Zurich Fachstelle10
Naturschutz Kanton Zurich Zurich 2004Gallandat J D Gobat J-M and Roulier C Cartographie des zones alluviales drsquoimportance
nationale rapport et annexes Cahiers de lrsquoenvironnement No 199 Office federal delrsquoenvironnement des forets et du paysage (OFEFP) Berne 1993
Gerrard A J Soil Geomorphology Springer 199215
Gobat J M The Living Soil Fundamentals of Soil Science and Soil Biology Science Publish-ers Enfield 2010
Guenat C Bureau F and Charnet F Genese diversite et fonctionnement des sols sous ladependance drsquoun cours drsquoeau ecologie fonctions et gestion in Forets riveraines des coursdrsquoeau IDF Paris 200320
Heneghan L Miller S P Baer S Callaham M A Montgomery J Pavao-Zuckerman MRhoades C C and Richardson S Integrating soil ecological knowledge into restorationmanagement Restor Ecol 16 608ndash617 doi101111j1526-100X200800477x 2008
Hill M O Diversity and evenness a unifying notation and its consequences Ecology 54427ndash432 doi1023071934352 197325
Ibanez J J De-Albs S Bermudez F F and Garcıa-Alvarez A Pedodiversity concepts andmeasures Catena 24 215ndash232 doi1010160341-8162(95)00028-Q 1995
Ibanez J J De-Alba S Lobo A and Zucarello V Pedodiversity and global soil pat-terns at coarse scales (with discussion) Geoderma 83 171ndash192 doi101016S0016-7061(97)00147-X 199830
Imboden C Eaux vivantes edited by LSPN Departement federal de lrsquoInterieur Bale 1976IUSS Working Group World reference base for soil resources in World Soil Resources Re-
port 103 FAO Rome 128 pp 2006
4353
HESSD10 4337ndash4367 2013
Spatio-temporalheterogeneity of
riparian soilmorphology
B Fournier et al
Title Page
Abstract Introduction
Conclusions References
Tables Figures
J I
J I
Back Close
Full Screen Esc
Printer-friendly Version
Interactive Discussion
Discussion
Paper
|D
iscussionP
aper|
Discussion
Paper
|D
iscussionP
aper|
IUSS Working Group WRB World Reference Base for Soil Resources 2006 a Framework forInternational Classification Correlation and Communication Food and Agriculture Organi-zation of the United Nations Rome 2006
Keel A and Floss I Aktionsplan Schweizer Alant (Inula helvetica Weber) Artenschutzmass-nahmen fur gefahrdete Farn- und Blutenpflanzen im Kanton Zurich Fachstelle Naturschutz5
Kanton Zurich Zurich 2004Malmqvist B and Rundle S Threats to the running water ecosystems of the world Environ
Conserv 29 134ndash153 doi101017S0376892902000097 2002Moor M Pflanzengesellschaften schweizerischer Flussauen Mit Sch Anst Forstl Ver-
suchsw 34 221ndash360 195810
Naiman R Bechtold J Drake D Latterell J OrsquoKeefe T and Balian E Origins patternsand importance of heterogeneity in riparian systems in Ecosystem function in heteroge-neous landscapes Springer-Verlag New York 279ndash309 2005
Nakamura K Amano K and Tockner K River restoration European perspectives andlessons for Japan Ecol Civ Eng 8 201ndash214 200615
Nakamura K Tockner K and Amano K River and wetland restoration lessons from JapanBioscience 56 419ndash429 doi1016410006-3568(2006)056[0419rawrlf]20co2 2009
Nanson G C and Croke J C A genetic classification of floodplains Geomorphology 4459ndash486 doi1010160169-555X(92)90039-Q 1992
Nassauer J I Kosek S E and Corry R C Meeting public expectations with eco-20
logical inovation in riparian landscapes J Am Water Resour Assoc 37 1439ndash1443doi101111j1752-16882001tb03650x 2001
Orr C H Stanley E H Wilson K A and Finlay J C Effects of Restoration and Reflood-ing on Soil Denitrification in a Leveed Midwestern Floodplain Ecol Appl 17 2365ndash2376doi10189006-21131 200725
Palmer MA and Bernhardt E S Hydroecology and river restoration Ripe for research andsynthesis Water Resour Res 42 W03S07 doi1010292005WR004354 2006
Palmer MA Bernhardt E S Allan J D Lake P S Alexander G Brooks S Carr JClayton S Dahm C N Shah J F Galat D L Loss S G Goodwin P Hart D DHassett B Jenkinson R Kondolf G M Lave R Meyer J L OrsquoDonnell T K Pagano L30
and Sudduth E Standards for ecologically successful river restoration J Appl Ecol 42208ndash217 2005
4354
HESSD10 4337ndash4367 2013
Spatio-temporalheterogeneity of
riparian soilmorphology
B Fournier et al
Title Page
Abstract Introduction
Conclusions References
Tables Figures
J I
J I
Back Close
Full Screen Esc
Printer-friendly Version
Interactive Discussion
Discussion
Paper
|D
iscussionP
aper|
Discussion
Paper
|D
iscussionP
aper|
Palmer MA Allan J D Meyer J and Bernhardt E S River Restoration in the Twenty-First Century Data and Experiential Knowledge to Inform Future Efforts Restor Ecol 15472ndash481 2007
Orr C H Stanley E H Wilson K A and Finlay J C Effects of Restoration and Refloodingon Soil Denitrification in a Leveed Midwestern Floodplain Ecological Applications 17 2365ndash5
2376 doi10189006-21131 2007Quideau S A Chadwick O A Benesi A Graham R C and Anderson M A A direct link
between forest vegetation type and soil organic matter composition Geoderma 104 41ndash60doi101016S0016-7061(01)00055-6 2001
Rohde S River Restoration Potential and Limitations to Re-Establish Riparian Landscapes10
Assessment amp Planning PhD thesis Swiss Federal Institute of Technology Zurich Zurich133 pp 2004
Rohde S Kienast F and Burgi M Assessing the restoration success of river wideningsa landscape approach Environ Manage 34 574ndash589 2004
Roulier C Typologie et dynamique de la vegetation des zones alluviales de Suisse Geob-15
otanica Helvetica 72 138 pp 1998Rousseeuw P Silhouettes a graphical aid to the interpretation and validation of cluster anal-
ysis J Comput Appl Math 20 53ndash65 1987Saldana A and Ibanez J J Pedodiversity analysis at large scales an example of
three fluvial terraces of the Henares River (central Spain) Geomorphology 62 123ndash13820
doi101016jgeomorph200402007 2004Saldana A and Ibanez J J Pedodiversity connectance and spatial variabil-
ity of soil properties what is the relationship Ecol Model 208 342ndash352doi101016jecolmodel200706006 2007
Saxton K E Rawls W J Romberger J S and Papendick R I Estimating generalized25
soil-water characteristics from texture Soil Sci Soc Am J 50 1031ndash1036 1986Schneider P Vogt T Schirmer M Doetsch J Linde N Pasquale N Perona P and
Cirpka O A Towards improved instrumentation for assessing river-groundwater interactionsin a restored river corridor Hydrol Earth Syst Sci 15 2531ndash2549 doi105194hess-15-2531-2011 201130
Sifneos J Herlihy A Jacobs A and Kentula M Calibration of the Delaware Rapid Assess-ment Protocol to a comprehensive measure of wetland condition Wetlands 30 1011ndash1022doi101007s13157-010-0093-z 2010
4355
HESSD10 4337ndash4367 2013
Spatio-temporalheterogeneity of
riparian soilmorphology
B Fournier et al
Title Page
Abstract Introduction
Conclusions References
Tables Figures
J I
J I
Back Close
Full Screen Esc
Printer-friendly Version
Interactive Discussion
Discussion
Paper
|D
iscussionP
aper|
Discussion
Paper
|D
iscussionP
aper|
Stein E D Fetscher A E Clark R P Wiskind A Grenier J L Sutula M Collins J Nand Grosso C Validation of a wetland rapid assessment method use of Eparsquos level 1-2-3framework for method testing and refinement Wetlands 29 648ndash665 doi10167207-23912009
Sudduth E B Meyer J L and Bernhardt E S Stream restoration practices in the south-5
eastern United States Restor Ecol 15 573ndash583 2007Sutton-Grier A E Kenney M A and Richardson C J Examining the relationship be-
tween ecosystem structure and function using structural equation modelling a case studyexamining denitrification potential in restored wetland soils Ecol Model 221 761ndash768doi101016jecolmodel200911015 201010
Tockner K and Stanford J A Riverine flood plains present state and future trends EnvironConserv 29 308ndash330 2002
Toomanian N and Esfandiarpoor I Challenges of pedodiversity in soil science Eurasian SoilSci 43 1486ndash1502 doi101134s1064229310130089 2010
Wardle D A Communities and Ecosystems Linking the Aboveground and Belowground Com-15
ponents Princeton University Press Princeton NJ 2002Weber C Schager E and Peter A Habitat diversity and fish assemblage structure in
local river widenings a case study on a swiss river River Res Appl 25 687ndash701doi101002rra1176 2009
Wohl E Angermeier P L Bledsoe B Kondolf G M MacDonnell L Merritt D M20
Palmer M A Poff N L and Tarboton D River restoration Water Resour Res 41 1ndash12 2005
Woolsey S Capelli F Gonser T Hoehn E Hostmann M Junker B Paetzold ARoulier C Schweizer S Tiegs S D Tockner K Weber C and Peter A A strategyto assess river restoration success Freshwater Biol 52 752ndash769 200725
4356
HESSD10 4337ndash4367 2013
Spatio-temporalheterogeneity of
riparian soilmorphology
B Fournier et al
Title Page
Abstract Introduction
Conclusions References
Tables Figures
J I
J I
Back Close
Full Screen Esc
Printer-friendly Version
Interactive Discussion
Discussion
Paper
|D
iscussionP
aper|
Discussion
Paper
|D
iscussionP
aper|
Table 1a Description of eight soil groups and number of ldquoindividualsrdquo (n) resulting from a clus-ter analysis based on a simplified set of variables for profiles (1a) and five groups of topsoilhorizons (1b) Soil taxonomy is based on AFES (2008) and correspondences to the FAO Worldreference base for soil resources (IUSS Working Group 2006) are given Depth is the meandepth of a particular group of profiles (cm) Texture is based on the US texture triangle (Saxtonet al 1986) For the profiles texture is described using the total number of loam sandy loamand sandy horizons within each group of profile and the average number of horizons per pro-file The volumetric percentage of coarse material (blocks pebbles and gravels) of the coars-est horizon within the profile is indicated under coarse material Proportion of blocks pebblesand gravels are given for each group in percentage of total volume Topsoil thickness (1b) isgiven in cm Hydromorphic features represent the average depth (in cm) at which hydromor-phic features were first observed The intensity of the hydromorphic features is given using asemi-quantitative scale (absence weak moderate and high) The organic matter OM content(null low medium and high) and type (no humified and coarse residuals) are given
Taxonomy Number of Horizons Hydromorphy
Soil AFES 2008 WRB 2006 Depth Loam Sandy Sand Average Coarse Hydromorphic Intensity ofprofile [cm] loam per material features hydromorphy
profile []
Group 1 REDOXISOLS fluviques Gleyic Fluvisols 111 7 47 0 2ndash4 03 15 Moderate(11) carbonates CalcaricGroup FLUVIOSOLS typiques Fluvisols 95 0 91 2 1ndash4 12 No No2 (25) carbonates CalcaricGroup FLUVIOSOLS Fluvisols 120 1 10 0 3 65 50 Weak to moderate3 (2) typiques Calcaric with
redoxiques redoximorphiccarbonates features
Group FLUVIOSOLS bruts Regosols 08 0 1 31 0 87 No No4 (32) carbonates CalcaricGroup FLUVIOSOLS bruts Regosols 20 0 42 5 1ndash2 45 No No5 (22) carbonates CalcaricGroup FLUVIOSOLS Fluvisols 69 0 36 2 3 56 25 weak6 (9) typiques Calcaric with
redoxiques redoximorphiccarbonates features
Group FLUVIOSOLS Fluvisols 104 0 33 0 2 11 50 Weak to moderate7 (8) typiques Calcaric with
redoxiques redoximorphiccarbonates features
Group REDUCTISOLS fulviques Gleysols 30 0 2 0 1 7 15 High8 (1) carbonates Calcaric
4357
HESSD10 4337ndash4367 2013
Spatio-temporalheterogeneity of
riparian soilmorphology
B Fournier et al
Title Page
Abstract Introduction
Conclusions References
Tables Figures
J I
J I
Back Close
Full Screen Esc
Printer-friendly Version
Interactive Discussion
Discussion
Paper
|D
iscussionP
aper|
Discussion
Paper
|D
iscussionP
aper|
Table 1b
Topsoil Thickness Organic matter Organic matter Texture (US Blocks Pebbles Gravel Hydromorphiclayer [cm] content type triangle) [] [] [] features
Group 1 (27) 8 low-medium humified Sandy loam 0 0 0 absentGroup 2 (21) 0 null no Sand 06 68 29 absentGroup 3 (10) 0 null no Sand 09 33 55 absentGroup 4 (36) 9 medium-low coarse Sandy loam 0 0 5 absent
residualsGroup 5 (13) 95 medium-low coarse Sandy loam 0 0 1 absent
residuals+humified
Group 6 (1) 5 medium humified Sandy loam 0 0 0 heterogenousirondistribution
Group 7 (2) 15 medium coarse residuals Loamy sand 0 0 1 related toroots spots
4358
HESSD10 4337ndash4367 2013
Spatio-temporalheterogeneity of
riparian soilmorphology
B Fournier et al
Title Page
Abstract Introduction
Conclusions References
Tables Figures
J I
J I
Back Close
Full Screen Esc
Printer-friendly Version
Interactive Discussion
Discussion
Paper
|D
iscussionP
aper|
Discussion
Paper
|D
iscussionP
aper|
Table 2 Criteria and indicators of the soil morphology method for floodplain restoration successassessment
Criterion Indicators Range Application Reference Rationaledomain
Div
ersi
ty Shannon 0 ndashgtn Soil profile Hill (1973) Indicator of soiltopsoilindex Topsoil habitat diversityRichness 0 ndashgtnmax Soil profile Indicator of soiltopsoil
Topsoil habitat diversity
Typi
calit
y
Frequency of Expressed Soil profile AFES (2008) Indicator of soil typicaltypical soil in of natural floodplainsprofile groupsFrequency of Idem Topsoil AFES (2008) Indicator of recenttypical topsoil changes characteristicgroups of natural floodplains
Dyn
amis
m
Total number 0 ndashgtn Soil profile Bullinger-Weber Indicator of morphologicalof horizons per et al (2007) changes due to fluvialmeter (Hm) dynamicsElevation minusnndashgtn Topography Indicator of rate ofvariation through erosionsedimentationtime (∆)
4359
HESSD10 4337ndash4367 2013
Spatio-temporalheterogeneity of
riparian soilmorphology
B Fournier et al
Title Page
Abstract Introduction
Conclusions References
Tables Figures
J I
J I
Back Close
Full Screen Esc
Printer-friendly Version
Interactive Discussion
Discussion
Paper
|D
iscussionP
aper|
Discussion
Paper
|D
iscussionP
aper|
Table 3 Soil diversity and richness calculated at the Thur site
N0 N1 N2 E1 E2 J
Profile Open habitats 7 428 347 061 050 075Forest 2 197 195 097 097 098Pasture 4 295 260 074 065 078
Topsoil Open habitats 6 450 378 075 063 084Forest 4 259 203 065 051 069Pasture 3 261 233 087 078 087
4360
HESSD10 4337ndash4367 2013
Spatio-temporalheterogeneity of
riparian soilmorphology
B Fournier et al
Title Page
Abstract Introduction
Conclusions References
Tables Figures
J I
J I
Back Close
Full Screen Esc
Printer-friendly Version
Interactive Discussion
Discussion
Paper
|D
iscussionP
aper|
Discussion
Paper
|D
iscussionP
aper|
Table 4 Relative abundance () of profile and topsoil groups for the restored and referenceareas
Soil profilegroup 1 group 2 group 3 group 4 group 5 group 6 group 7 group 8
Open habitats 13 118 ndash 421 289 105 39 13Forest ndash 583 ndash ndash ndash ndash 417 ndashPasture 455 409 91 ndash ndash 45 ndash ndash
Topsoil layergroup 1 group 2 group 3 group 4 group 5 group 6 group 7
Open habitats 79 276 132 395 92 ndash 26Forest 583 ndash ndash 83 250 83 ndashPasture 636 ndash ndash 227 136 ndash ndash
4361
HESSD10 4337ndash4367 2013
Spatio-temporalheterogeneity of
riparian soilmorphology
B Fournier et al
Title Page
Abstract Introduction
Conclusions References
Tables Figures
J I
J I
Back Close
Full Screen Esc
Printer-friendly Version
Interactive Discussion
Discussion
Paper
|D
iscussionP
aper|
Discussion
Paper
|D
iscussionP
aper|
Table 5 Averages of plant species biodiversity metrics for the open and forest habitats of theRiver Thur site
N0 N1 N2 E1 E2 J
Open habitats 1788 439 287 025 017 048Forest 1671 675 488 041 030 067
4362
HESSD10 4337ndash4367 2013
Spatio-temporalheterogeneity of
riparian soilmorphology
B Fournier et al
Title Page
Abstract Introduction
Conclusions References
Tables Figures
J I
J I
Back Close
Full Screen Esc
Printer-friendly Version
Interactive Discussion
Discussion
Paper
|D
iscussionP
aper|
Discussion
Paper
|D
iscussionP
aper|
0
5
10
15
20
0 10 20 30 40 50 60 70H
m
Distance to the river (m)
b) Control area
0
5
10
15
20
0 10 20 30 40 50 60 70
Hm
Distance to the river (m)
a) Restored area
Fig 1 Number of horizons per meter (Hm) versus lateral distance to the river (m) for therestored (a) and the reference areas (b)
4363
HESSD10 4337ndash4367 2013
Spatio-temporalheterogeneity of
riparian soilmorphology
B Fournier et al
Title Page
Abstract Introduction
Conclusions References
Tables Figures
J I
J I
Back Close
Full Screen Esc
Printer-friendly Version
Interactive Discussion
Discussion
Paper
|D
iscussionP
aper|
Discussion
Paper
|D
iscussionP
aper|
-2
-1
0
1
2
10 20 30 40 50 60 gt60
Elev
atio
n de
lta (m
)
Distance to the river (m)
a) Sedimentation Erosion before the restoration
RestoredUn-restored
RestoredUn-restored-2
-1
0
1
2
10 20 30 40 50 60 gt60
Elev
atio
n de
lta (m
)
Distance to the river (m)
b) Sedimentation Erosion after the restoration
Fig 2 Average elevation deltas (m) and their associated standard deviations before (a periodranging from 1996 to 2002) and after the restoration (b period ranging from 2002 to 2007) inthe restored and in the reference (un-restored) areas Calculations are based on cross sectionsdata for seven classes of distance to the river (10 m sections) Positive deltas (+) correspondto sedimentation process and negative deltas (minus) to erosion process
4364
HESSD10 4337ndash4367 2013
Spatio-temporalheterogeneity of
riparian soilmorphology
B Fournier et al
Title Page
Abstract Introduction
Conclusions References
Tables Figures
J I
J I
Back Close
Full Screen Esc
Printer-friendly Version
Interactive Discussion
Discussion
Paper
|D
iscussionP
aper|
Discussion
Paper
|D
iscussionP
aper|
-2
-1
0
1
10 20 30 40 50 60 gt60
Elev
atio
n de
lta (m
)Distance to the river (m)
b) Q5 flood effect after restoration
RestoredUn-restored
-2
-1
0
1
10 20 30 40 50 60 gt60
Elev
atio
n de
lta (m
)
Distance to the river (m)
a) Q5 flood effect before restoration
RestoredUn-restored
Fig 3 Effects of a single flood with a similar discharge (Q5 five-year flood) on elevation deltas(m) in the restored and in the reference area before (a) and after restoration (b) Calculationsare based on cross sections data for seven classes of distance to the river (10 m sections)Positive deltas (+) correspond to sedimentation process and negative deltas (minus) to erosionprocess
4365
HESSD10 4337ndash4367 2013
Spatio-temporalheterogeneity of
riparian soilmorphology
B Fournier et al
Title Page
Abstract Introduction
Conclusions References
Tables Figures
J I
J I
Back Close
Full Screen Esc
Printer-friendly Version
Interactive Discussion
Discussion
Paper
|D
iscussionP
aper|
Discussion
Paper
|D
iscussionP
aper|
0
5
10
15
20
0 10 20 30 40 50 60 70
Hm
Distance to the river (m)
No vegetation Sparse vegetation
and thicket
Thicket Willow
bushes
Forest
Sp
ars
e
ve
ge
tati
on
Fig 4 Vegetation successional stages versus soil dynamism (Hm) in the restored area (0ndash65 mfrom the river)
4366
HESSD10 4337ndash4367 2013
Spatio-temporalheterogeneity of
riparian soilmorphology
B Fournier et al
Title Page
Abstract Introduction
Conclusions References
Tables Figures
J I
J I
Back Close
Full Screen Esc
Printer-friendly Version
Interactive Discussion
Discussion
Paper
|D
iscussionP
aper|
Discussion
Paper
|D
iscussionP
aper|
100
80
60
40
20
0
0-15 15-35 35-45 45-55 55-65
Group4
Group5
Group6
Group2
Group7
Group8
Group1
No
vegetation
Willow
bushes
Thicket ForestSparse
vegetation
+ Thicket
Fig 5 Vegetation successional stages versus frequency of soil profile groups in the restoredarea Soil groups are given according to their succession along the river lateral gradient Soilprofile group 3 was only observed in the control area
4367
HESSD10 4337ndash4367 2013
Spatio-temporalheterogeneity of
riparian soilmorphology
B Fournier et al
Title Page
Abstract Introduction
Conclusions References
Tables Figures
J I
J I
Back Close
Full Screen Esc
Printer-friendly Version
Interactive Discussion
Discussion
Paper
|D
iscussionP
aper|
Discussion
Paper
|D
iscussionP
aper|
Stein E D Fetscher A E Clark R P Wiskind A Grenier J L Sutula M Collins J Nand Grosso C Validation of a wetland rapid assessment method use of Eparsquos level 1-2-3framework for method testing and refinement Wetlands 29 648ndash665 doi10167207-23912009
Sudduth E B Meyer J L and Bernhardt E S Stream restoration practices in the south-5
eastern United States Restor Ecol 15 573ndash583 2007Sutton-Grier A E Kenney M A and Richardson C J Examining the relationship be-
tween ecosystem structure and function using structural equation modelling a case studyexamining denitrification potential in restored wetland soils Ecol Model 221 761ndash768doi101016jecolmodel200911015 201010
Tockner K and Stanford J A Riverine flood plains present state and future trends EnvironConserv 29 308ndash330 2002
Toomanian N and Esfandiarpoor I Challenges of pedodiversity in soil science Eurasian SoilSci 43 1486ndash1502 doi101134s1064229310130089 2010
Wardle D A Communities and Ecosystems Linking the Aboveground and Belowground Com-15
ponents Princeton University Press Princeton NJ 2002Weber C Schager E and Peter A Habitat diversity and fish assemblage structure in
local river widenings a case study on a swiss river River Res Appl 25 687ndash701doi101002rra1176 2009
Wohl E Angermeier P L Bledsoe B Kondolf G M MacDonnell L Merritt D M20
Palmer M A Poff N L and Tarboton D River restoration Water Resour Res 41 1ndash12 2005
Woolsey S Capelli F Gonser T Hoehn E Hostmann M Junker B Paetzold ARoulier C Schweizer S Tiegs S D Tockner K Weber C and Peter A A strategyto assess river restoration success Freshwater Biol 52 752ndash769 200725
4356
HESSD10 4337ndash4367 2013
Spatio-temporalheterogeneity of
riparian soilmorphology
B Fournier et al
Title Page
Abstract Introduction
Conclusions References
Tables Figures
J I
J I
Back Close
Full Screen Esc
Printer-friendly Version
Interactive Discussion
Discussion
Paper
|D
iscussionP
aper|
Discussion
Paper
|D
iscussionP
aper|
Table 1a Description of eight soil groups and number of ldquoindividualsrdquo (n) resulting from a clus-ter analysis based on a simplified set of variables for profiles (1a) and five groups of topsoilhorizons (1b) Soil taxonomy is based on AFES (2008) and correspondences to the FAO Worldreference base for soil resources (IUSS Working Group 2006) are given Depth is the meandepth of a particular group of profiles (cm) Texture is based on the US texture triangle (Saxtonet al 1986) For the profiles texture is described using the total number of loam sandy loamand sandy horizons within each group of profile and the average number of horizons per pro-file The volumetric percentage of coarse material (blocks pebbles and gravels) of the coars-est horizon within the profile is indicated under coarse material Proportion of blocks pebblesand gravels are given for each group in percentage of total volume Topsoil thickness (1b) isgiven in cm Hydromorphic features represent the average depth (in cm) at which hydromor-phic features were first observed The intensity of the hydromorphic features is given using asemi-quantitative scale (absence weak moderate and high) The organic matter OM content(null low medium and high) and type (no humified and coarse residuals) are given
Taxonomy Number of Horizons Hydromorphy
Soil AFES 2008 WRB 2006 Depth Loam Sandy Sand Average Coarse Hydromorphic Intensity ofprofile [cm] loam per material features hydromorphy
profile []
Group 1 REDOXISOLS fluviques Gleyic Fluvisols 111 7 47 0 2ndash4 03 15 Moderate(11) carbonates CalcaricGroup FLUVIOSOLS typiques Fluvisols 95 0 91 2 1ndash4 12 No No2 (25) carbonates CalcaricGroup FLUVIOSOLS Fluvisols 120 1 10 0 3 65 50 Weak to moderate3 (2) typiques Calcaric with
redoxiques redoximorphiccarbonates features
Group FLUVIOSOLS bruts Regosols 08 0 1 31 0 87 No No4 (32) carbonates CalcaricGroup FLUVIOSOLS bruts Regosols 20 0 42 5 1ndash2 45 No No5 (22) carbonates CalcaricGroup FLUVIOSOLS Fluvisols 69 0 36 2 3 56 25 weak6 (9) typiques Calcaric with
redoxiques redoximorphiccarbonates features
Group FLUVIOSOLS Fluvisols 104 0 33 0 2 11 50 Weak to moderate7 (8) typiques Calcaric with
redoxiques redoximorphiccarbonates features
Group REDUCTISOLS fulviques Gleysols 30 0 2 0 1 7 15 High8 (1) carbonates Calcaric
4357
HESSD10 4337ndash4367 2013
Spatio-temporalheterogeneity of
riparian soilmorphology
B Fournier et al
Title Page
Abstract Introduction
Conclusions References
Tables Figures
J I
J I
Back Close
Full Screen Esc
Printer-friendly Version
Interactive Discussion
Discussion
Paper
|D
iscussionP
aper|
Discussion
Paper
|D
iscussionP
aper|
Table 1b
Topsoil Thickness Organic matter Organic matter Texture (US Blocks Pebbles Gravel Hydromorphiclayer [cm] content type triangle) [] [] [] features
Group 1 (27) 8 low-medium humified Sandy loam 0 0 0 absentGroup 2 (21) 0 null no Sand 06 68 29 absentGroup 3 (10) 0 null no Sand 09 33 55 absentGroup 4 (36) 9 medium-low coarse Sandy loam 0 0 5 absent
residualsGroup 5 (13) 95 medium-low coarse Sandy loam 0 0 1 absent
residuals+humified
Group 6 (1) 5 medium humified Sandy loam 0 0 0 heterogenousirondistribution
Group 7 (2) 15 medium coarse residuals Loamy sand 0 0 1 related toroots spots
4358
HESSD10 4337ndash4367 2013
Spatio-temporalheterogeneity of
riparian soilmorphology
B Fournier et al
Title Page
Abstract Introduction
Conclusions References
Tables Figures
J I
J I
Back Close
Full Screen Esc
Printer-friendly Version
Interactive Discussion
Discussion
Paper
|D
iscussionP
aper|
Discussion
Paper
|D
iscussionP
aper|
Table 2 Criteria and indicators of the soil morphology method for floodplain restoration successassessment
Criterion Indicators Range Application Reference Rationaledomain
Div
ersi
ty Shannon 0 ndashgtn Soil profile Hill (1973) Indicator of soiltopsoilindex Topsoil habitat diversityRichness 0 ndashgtnmax Soil profile Indicator of soiltopsoil
Topsoil habitat diversity
Typi
calit
y
Frequency of Expressed Soil profile AFES (2008) Indicator of soil typicaltypical soil in of natural floodplainsprofile groupsFrequency of Idem Topsoil AFES (2008) Indicator of recenttypical topsoil changes characteristicgroups of natural floodplains
Dyn
amis
m
Total number 0 ndashgtn Soil profile Bullinger-Weber Indicator of morphologicalof horizons per et al (2007) changes due to fluvialmeter (Hm) dynamicsElevation minusnndashgtn Topography Indicator of rate ofvariation through erosionsedimentationtime (∆)
4359
HESSD10 4337ndash4367 2013
Spatio-temporalheterogeneity of
riparian soilmorphology
B Fournier et al
Title Page
Abstract Introduction
Conclusions References
Tables Figures
J I
J I
Back Close
Full Screen Esc
Printer-friendly Version
Interactive Discussion
Discussion
Paper
|D
iscussionP
aper|
Discussion
Paper
|D
iscussionP
aper|
Table 3 Soil diversity and richness calculated at the Thur site
N0 N1 N2 E1 E2 J
Profile Open habitats 7 428 347 061 050 075Forest 2 197 195 097 097 098Pasture 4 295 260 074 065 078
Topsoil Open habitats 6 450 378 075 063 084Forest 4 259 203 065 051 069Pasture 3 261 233 087 078 087
4360
HESSD10 4337ndash4367 2013
Spatio-temporalheterogeneity of
riparian soilmorphology
B Fournier et al
Title Page
Abstract Introduction
Conclusions References
Tables Figures
J I
J I
Back Close
Full Screen Esc
Printer-friendly Version
Interactive Discussion
Discussion
Paper
|D
iscussionP
aper|
Discussion
Paper
|D
iscussionP
aper|
Table 4 Relative abundance () of profile and topsoil groups for the restored and referenceareas
Soil profilegroup 1 group 2 group 3 group 4 group 5 group 6 group 7 group 8
Open habitats 13 118 ndash 421 289 105 39 13Forest ndash 583 ndash ndash ndash ndash 417 ndashPasture 455 409 91 ndash ndash 45 ndash ndash
Topsoil layergroup 1 group 2 group 3 group 4 group 5 group 6 group 7
Open habitats 79 276 132 395 92 ndash 26Forest 583 ndash ndash 83 250 83 ndashPasture 636 ndash ndash 227 136 ndash ndash
4361
HESSD10 4337ndash4367 2013
Spatio-temporalheterogeneity of
riparian soilmorphology
B Fournier et al
Title Page
Abstract Introduction
Conclusions References
Tables Figures
J I
J I
Back Close
Full Screen Esc
Printer-friendly Version
Interactive Discussion
Discussion
Paper
|D
iscussionP
aper|
Discussion
Paper
|D
iscussionP
aper|
Table 5 Averages of plant species biodiversity metrics for the open and forest habitats of theRiver Thur site
N0 N1 N2 E1 E2 J
Open habitats 1788 439 287 025 017 048Forest 1671 675 488 041 030 067
4362
HESSD10 4337ndash4367 2013
Spatio-temporalheterogeneity of
riparian soilmorphology
B Fournier et al
Title Page
Abstract Introduction
Conclusions References
Tables Figures
J I
J I
Back Close
Full Screen Esc
Printer-friendly Version
Interactive Discussion
Discussion
Paper
|D
iscussionP
aper|
Discussion
Paper
|D
iscussionP
aper|
0
5
10
15
20
0 10 20 30 40 50 60 70H
m
Distance to the river (m)
b) Control area
0
5
10
15
20
0 10 20 30 40 50 60 70
Hm
Distance to the river (m)
a) Restored area
Fig 1 Number of horizons per meter (Hm) versus lateral distance to the river (m) for therestored (a) and the reference areas (b)
4363
HESSD10 4337ndash4367 2013
Spatio-temporalheterogeneity of
riparian soilmorphology
B Fournier et al
Title Page
Abstract Introduction
Conclusions References
Tables Figures
J I
J I
Back Close
Full Screen Esc
Printer-friendly Version
Interactive Discussion
Discussion
Paper
|D
iscussionP
aper|
Discussion
Paper
|D
iscussionP
aper|
-2
-1
0
1
2
10 20 30 40 50 60 gt60
Elev
atio
n de
lta (m
)
Distance to the river (m)
a) Sedimentation Erosion before the restoration
RestoredUn-restored
RestoredUn-restored-2
-1
0
1
2
10 20 30 40 50 60 gt60
Elev
atio
n de
lta (m
)
Distance to the river (m)
b) Sedimentation Erosion after the restoration
Fig 2 Average elevation deltas (m) and their associated standard deviations before (a periodranging from 1996 to 2002) and after the restoration (b period ranging from 2002 to 2007) inthe restored and in the reference (un-restored) areas Calculations are based on cross sectionsdata for seven classes of distance to the river (10 m sections) Positive deltas (+) correspondto sedimentation process and negative deltas (minus) to erosion process
4364
HESSD10 4337ndash4367 2013
Spatio-temporalheterogeneity of
riparian soilmorphology
B Fournier et al
Title Page
Abstract Introduction
Conclusions References
Tables Figures
J I
J I
Back Close
Full Screen Esc
Printer-friendly Version
Interactive Discussion
Discussion
Paper
|D
iscussionP
aper|
Discussion
Paper
|D
iscussionP
aper|
-2
-1
0
1
10 20 30 40 50 60 gt60
Elev
atio
n de
lta (m
)Distance to the river (m)
b) Q5 flood effect after restoration
RestoredUn-restored
-2
-1
0
1
10 20 30 40 50 60 gt60
Elev
atio
n de
lta (m
)
Distance to the river (m)
a) Q5 flood effect before restoration
RestoredUn-restored
Fig 3 Effects of a single flood with a similar discharge (Q5 five-year flood) on elevation deltas(m) in the restored and in the reference area before (a) and after restoration (b) Calculationsare based on cross sections data for seven classes of distance to the river (10 m sections)Positive deltas (+) correspond to sedimentation process and negative deltas (minus) to erosionprocess
4365
HESSD10 4337ndash4367 2013
Spatio-temporalheterogeneity of
riparian soilmorphology
B Fournier et al
Title Page
Abstract Introduction
Conclusions References
Tables Figures
J I
J I
Back Close
Full Screen Esc
Printer-friendly Version
Interactive Discussion
Discussion
Paper
|D
iscussionP
aper|
Discussion
Paper
|D
iscussionP
aper|
0
5
10
15
20
0 10 20 30 40 50 60 70
Hm
Distance to the river (m)
No vegetation Sparse vegetation
and thicket
Thicket Willow
bushes
Forest
Sp
ars
e
ve
ge
tati
on
Fig 4 Vegetation successional stages versus soil dynamism (Hm) in the restored area (0ndash65 mfrom the river)
4366
HESSD10 4337ndash4367 2013
Spatio-temporalheterogeneity of
riparian soilmorphology
B Fournier et al
Title Page
Abstract Introduction
Conclusions References
Tables Figures
J I
J I
Back Close
Full Screen Esc
Printer-friendly Version
Interactive Discussion
Discussion
Paper
|D
iscussionP
aper|
Discussion
Paper
|D
iscussionP
aper|
100
80
60
40
20
0
0-15 15-35 35-45 45-55 55-65
Group4
Group5
Group6
Group2
Group7
Group8
Group1
No
vegetation
Willow
bushes
Thicket ForestSparse
vegetation
+ Thicket
Fig 5 Vegetation successional stages versus frequency of soil profile groups in the restoredarea Soil groups are given according to their succession along the river lateral gradient Soilprofile group 3 was only observed in the control area
4367
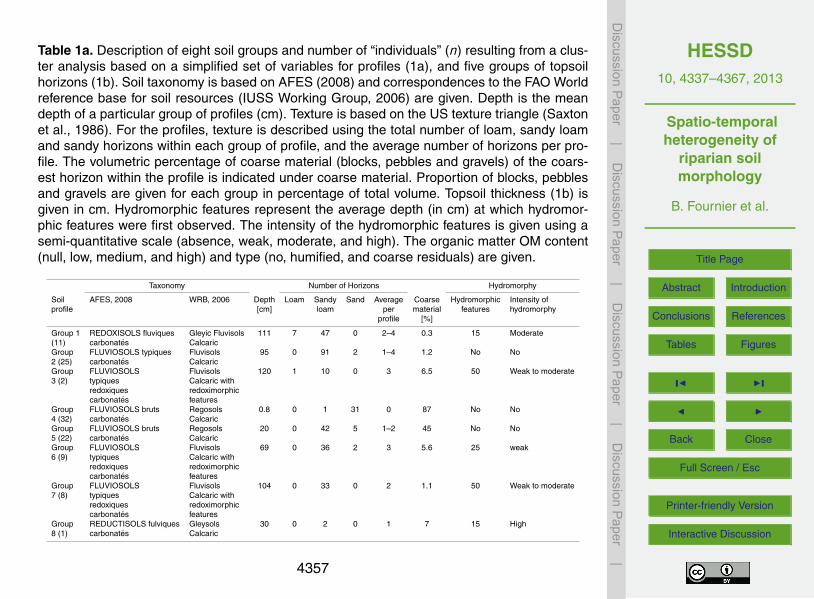
HESSD10 4337ndash4367 2013
Spatio-temporalheterogeneity of
riparian soilmorphology
B Fournier et al
Title Page
Abstract Introduction
Conclusions References
Tables Figures
J I
J I
Back Close
Full Screen Esc
Printer-friendly Version
Interactive Discussion
Discussion
Paper
|D
iscussionP
aper|
Discussion
Paper
|D
iscussionP
aper|
Table 1a Description of eight soil groups and number of ldquoindividualsrdquo (n) resulting from a clus-ter analysis based on a simplified set of variables for profiles (1a) and five groups of topsoilhorizons (1b) Soil taxonomy is based on AFES (2008) and correspondences to the FAO Worldreference base for soil resources (IUSS Working Group 2006) are given Depth is the meandepth of a particular group of profiles (cm) Texture is based on the US texture triangle (Saxtonet al 1986) For the profiles texture is described using the total number of loam sandy loamand sandy horizons within each group of profile and the average number of horizons per pro-file The volumetric percentage of coarse material (blocks pebbles and gravels) of the coars-est horizon within the profile is indicated under coarse material Proportion of blocks pebblesand gravels are given for each group in percentage of total volume Topsoil thickness (1b) isgiven in cm Hydromorphic features represent the average depth (in cm) at which hydromor-phic features were first observed The intensity of the hydromorphic features is given using asemi-quantitative scale (absence weak moderate and high) The organic matter OM content(null low medium and high) and type (no humified and coarse residuals) are given
Taxonomy Number of Horizons Hydromorphy
Soil AFES 2008 WRB 2006 Depth Loam Sandy Sand Average Coarse Hydromorphic Intensity ofprofile [cm] loam per material features hydromorphy
profile []
Group 1 REDOXISOLS fluviques Gleyic Fluvisols 111 7 47 0 2ndash4 03 15 Moderate(11) carbonates CalcaricGroup FLUVIOSOLS typiques Fluvisols 95 0 91 2 1ndash4 12 No No2 (25) carbonates CalcaricGroup FLUVIOSOLS Fluvisols 120 1 10 0 3 65 50 Weak to moderate3 (2) typiques Calcaric with
redoxiques redoximorphiccarbonates features
Group FLUVIOSOLS bruts Regosols 08 0 1 31 0 87 No No4 (32) carbonates CalcaricGroup FLUVIOSOLS bruts Regosols 20 0 42 5 1ndash2 45 No No5 (22) carbonates CalcaricGroup FLUVIOSOLS Fluvisols 69 0 36 2 3 56 25 weak6 (9) typiques Calcaric with
redoxiques redoximorphiccarbonates features
Group FLUVIOSOLS Fluvisols 104 0 33 0 2 11 50 Weak to moderate7 (8) typiques Calcaric with
redoxiques redoximorphiccarbonates features
Group REDUCTISOLS fulviques Gleysols 30 0 2 0 1 7 15 High8 (1) carbonates Calcaric
4357
HESSD10 4337ndash4367 2013
Spatio-temporalheterogeneity of
riparian soilmorphology
B Fournier et al
Title Page
Abstract Introduction
Conclusions References
Tables Figures
J I
J I
Back Close
Full Screen Esc
Printer-friendly Version
Interactive Discussion
Discussion
Paper
|D
iscussionP
aper|
Discussion
Paper
|D
iscussionP
aper|
Table 1b
Topsoil Thickness Organic matter Organic matter Texture (US Blocks Pebbles Gravel Hydromorphiclayer [cm] content type triangle) [] [] [] features
Group 1 (27) 8 low-medium humified Sandy loam 0 0 0 absentGroup 2 (21) 0 null no Sand 06 68 29 absentGroup 3 (10) 0 null no Sand 09 33 55 absentGroup 4 (36) 9 medium-low coarse Sandy loam 0 0 5 absent
residualsGroup 5 (13) 95 medium-low coarse Sandy loam 0 0 1 absent
residuals+humified
Group 6 (1) 5 medium humified Sandy loam 0 0 0 heterogenousirondistribution
Group 7 (2) 15 medium coarse residuals Loamy sand 0 0 1 related toroots spots
4358
HESSD10 4337ndash4367 2013
Spatio-temporalheterogeneity of
riparian soilmorphology
B Fournier et al
Title Page
Abstract Introduction
Conclusions References
Tables Figures
J I
J I
Back Close
Full Screen Esc
Printer-friendly Version
Interactive Discussion
Discussion
Paper
|D
iscussionP
aper|
Discussion
Paper
|D
iscussionP
aper|
Table 2 Criteria and indicators of the soil morphology method for floodplain restoration successassessment
Criterion Indicators Range Application Reference Rationaledomain
Div
ersi
ty Shannon 0 ndashgtn Soil profile Hill (1973) Indicator of soiltopsoilindex Topsoil habitat diversityRichness 0 ndashgtnmax Soil profile Indicator of soiltopsoil
Topsoil habitat diversity
Typi
calit
y
Frequency of Expressed Soil profile AFES (2008) Indicator of soil typicaltypical soil in of natural floodplainsprofile groupsFrequency of Idem Topsoil AFES (2008) Indicator of recenttypical topsoil changes characteristicgroups of natural floodplains
Dyn
amis
m
Total number 0 ndashgtn Soil profile Bullinger-Weber Indicator of morphologicalof horizons per et al (2007) changes due to fluvialmeter (Hm) dynamicsElevation minusnndashgtn Topography Indicator of rate ofvariation through erosionsedimentationtime (∆)
4359
HESSD10 4337ndash4367 2013
Spatio-temporalheterogeneity of
riparian soilmorphology
B Fournier et al
Title Page
Abstract Introduction
Conclusions References
Tables Figures
J I
J I
Back Close
Full Screen Esc
Printer-friendly Version
Interactive Discussion
Discussion
Paper
|D
iscussionP
aper|
Discussion
Paper
|D
iscussionP
aper|
Table 3 Soil diversity and richness calculated at the Thur site
N0 N1 N2 E1 E2 J
Profile Open habitats 7 428 347 061 050 075Forest 2 197 195 097 097 098Pasture 4 295 260 074 065 078
Topsoil Open habitats 6 450 378 075 063 084Forest 4 259 203 065 051 069Pasture 3 261 233 087 078 087
4360
HESSD10 4337ndash4367 2013
Spatio-temporalheterogeneity of
riparian soilmorphology
B Fournier et al
Title Page
Abstract Introduction
Conclusions References
Tables Figures
J I
J I
Back Close
Full Screen Esc
Printer-friendly Version
Interactive Discussion
Discussion
Paper
|D
iscussionP
aper|
Discussion
Paper
|D
iscussionP
aper|
Table 4 Relative abundance () of profile and topsoil groups for the restored and referenceareas
Soil profilegroup 1 group 2 group 3 group 4 group 5 group 6 group 7 group 8
Open habitats 13 118 ndash 421 289 105 39 13Forest ndash 583 ndash ndash ndash ndash 417 ndashPasture 455 409 91 ndash ndash 45 ndash ndash
Topsoil layergroup 1 group 2 group 3 group 4 group 5 group 6 group 7
Open habitats 79 276 132 395 92 ndash 26Forest 583 ndash ndash 83 250 83 ndashPasture 636 ndash ndash 227 136 ndash ndash
4361
HESSD10 4337ndash4367 2013
Spatio-temporalheterogeneity of
riparian soilmorphology
B Fournier et al
Title Page
Abstract Introduction
Conclusions References
Tables Figures
J I
J I
Back Close
Full Screen Esc
Printer-friendly Version
Interactive Discussion
Discussion
Paper
|D
iscussionP
aper|
Discussion
Paper
|D
iscussionP
aper|
Table 5 Averages of plant species biodiversity metrics for the open and forest habitats of theRiver Thur site
N0 N1 N2 E1 E2 J
Open habitats 1788 439 287 025 017 048Forest 1671 675 488 041 030 067
4362
HESSD10 4337ndash4367 2013
Spatio-temporalheterogeneity of
riparian soilmorphology
B Fournier et al
Title Page
Abstract Introduction
Conclusions References
Tables Figures
J I
J I
Back Close
Full Screen Esc
Printer-friendly Version
Interactive Discussion
Discussion
Paper
|D
iscussionP
aper|
Discussion
Paper
|D
iscussionP
aper|
0
5
10
15
20
0 10 20 30 40 50 60 70H
m
Distance to the river (m)
b) Control area
0
5
10
15
20
0 10 20 30 40 50 60 70
Hm
Distance to the river (m)
a) Restored area
Fig 1 Number of horizons per meter (Hm) versus lateral distance to the river (m) for therestored (a) and the reference areas (b)
4363
HESSD10 4337ndash4367 2013
Spatio-temporalheterogeneity of
riparian soilmorphology
B Fournier et al
Title Page
Abstract Introduction
Conclusions References
Tables Figures
J I
J I
Back Close
Full Screen Esc
Printer-friendly Version
Interactive Discussion
Discussion
Paper
|D
iscussionP
aper|
Discussion
Paper
|D
iscussionP
aper|
-2
-1
0
1
2
10 20 30 40 50 60 gt60
Elev
atio
n de
lta (m
)
Distance to the river (m)
a) Sedimentation Erosion before the restoration
RestoredUn-restored
RestoredUn-restored-2
-1
0
1
2
10 20 30 40 50 60 gt60
Elev
atio
n de
lta (m
)
Distance to the river (m)
b) Sedimentation Erosion after the restoration
Fig 2 Average elevation deltas (m) and their associated standard deviations before (a periodranging from 1996 to 2002) and after the restoration (b period ranging from 2002 to 2007) inthe restored and in the reference (un-restored) areas Calculations are based on cross sectionsdata for seven classes of distance to the river (10 m sections) Positive deltas (+) correspondto sedimentation process and negative deltas (minus) to erosion process
4364
HESSD10 4337ndash4367 2013
Spatio-temporalheterogeneity of
riparian soilmorphology
B Fournier et al
Title Page
Abstract Introduction
Conclusions References
Tables Figures
J I
J I
Back Close
Full Screen Esc
Printer-friendly Version
Interactive Discussion
Discussion
Paper
|D
iscussionP
aper|
Discussion
Paper
|D
iscussionP
aper|
-2
-1
0
1
10 20 30 40 50 60 gt60
Elev
atio
n de
lta (m
)Distance to the river (m)
b) Q5 flood effect after restoration
RestoredUn-restored
-2
-1
0
1
10 20 30 40 50 60 gt60
Elev
atio
n de
lta (m
)
Distance to the river (m)
a) Q5 flood effect before restoration
RestoredUn-restored
Fig 3 Effects of a single flood with a similar discharge (Q5 five-year flood) on elevation deltas(m) in the restored and in the reference area before (a) and after restoration (b) Calculationsare based on cross sections data for seven classes of distance to the river (10 m sections)Positive deltas (+) correspond to sedimentation process and negative deltas (minus) to erosionprocess
4365
HESSD10 4337ndash4367 2013
Spatio-temporalheterogeneity of
riparian soilmorphology
B Fournier et al
Title Page
Abstract Introduction
Conclusions References
Tables Figures
J I
J I
Back Close
Full Screen Esc
Printer-friendly Version
Interactive Discussion
Discussion
Paper
|D
iscussionP
aper|
Discussion
Paper
|D
iscussionP
aper|
0
5
10
15
20
0 10 20 30 40 50 60 70
Hm
Distance to the river (m)
No vegetation Sparse vegetation
and thicket
Thicket Willow
bushes
Forest
Sp
ars
e
ve
ge
tati
on
Fig 4 Vegetation successional stages versus soil dynamism (Hm) in the restored area (0ndash65 mfrom the river)
4366
HESSD10 4337ndash4367 2013
Spatio-temporalheterogeneity of
riparian soilmorphology
B Fournier et al
Title Page
Abstract Introduction
Conclusions References
Tables Figures
J I
J I
Back Close
Full Screen Esc
Printer-friendly Version
Interactive Discussion
Discussion
Paper
|D
iscussionP
aper|
Discussion
Paper
|D
iscussionP
aper|
100
80
60
40
20
0
0-15 15-35 35-45 45-55 55-65
Group4
Group5
Group6
Group2
Group7
Group8
Group1
No
vegetation
Willow
bushes
Thicket ForestSparse
vegetation
+ Thicket
Fig 5 Vegetation successional stages versus frequency of soil profile groups in the restoredarea Soil groups are given according to their succession along the river lateral gradient Soilprofile group 3 was only observed in the control area
4367
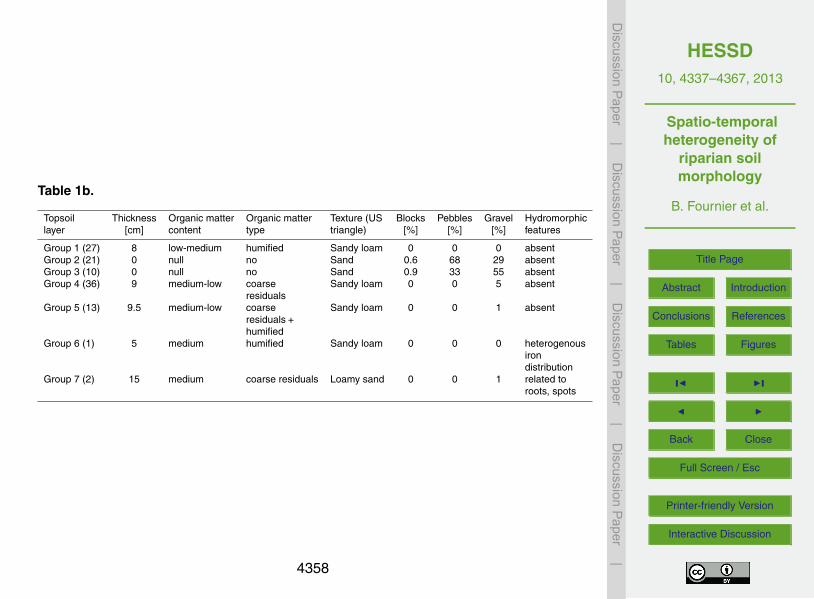
HESSD10 4337ndash4367 2013
Spatio-temporalheterogeneity of
riparian soilmorphology
B Fournier et al
Title Page
Abstract Introduction
Conclusions References
Tables Figures
J I
J I
Back Close
Full Screen Esc
Printer-friendly Version
Interactive Discussion
Discussion
Paper
|D
iscussionP
aper|
Discussion
Paper
|D
iscussionP
aper|
Table 1b
Topsoil Thickness Organic matter Organic matter Texture (US Blocks Pebbles Gravel Hydromorphiclayer [cm] content type triangle) [] [] [] features
Group 1 (27) 8 low-medium humified Sandy loam 0 0 0 absentGroup 2 (21) 0 null no Sand 06 68 29 absentGroup 3 (10) 0 null no Sand 09 33 55 absentGroup 4 (36) 9 medium-low coarse Sandy loam 0 0 5 absent
residualsGroup 5 (13) 95 medium-low coarse Sandy loam 0 0 1 absent
residuals+humified
Group 6 (1) 5 medium humified Sandy loam 0 0 0 heterogenousirondistribution
Group 7 (2) 15 medium coarse residuals Loamy sand 0 0 1 related toroots spots
4358
HESSD10 4337ndash4367 2013
Spatio-temporalheterogeneity of
riparian soilmorphology
B Fournier et al
Title Page
Abstract Introduction
Conclusions References
Tables Figures
J I
J I
Back Close
Full Screen Esc
Printer-friendly Version
Interactive Discussion
Discussion
Paper
|D
iscussionP
aper|
Discussion
Paper
|D
iscussionP
aper|
Table 2 Criteria and indicators of the soil morphology method for floodplain restoration successassessment
Criterion Indicators Range Application Reference Rationaledomain
Div
ersi
ty Shannon 0 ndashgtn Soil profile Hill (1973) Indicator of soiltopsoilindex Topsoil habitat diversityRichness 0 ndashgtnmax Soil profile Indicator of soiltopsoil
Topsoil habitat diversity
Typi
calit
y
Frequency of Expressed Soil profile AFES (2008) Indicator of soil typicaltypical soil in of natural floodplainsprofile groupsFrequency of Idem Topsoil AFES (2008) Indicator of recenttypical topsoil changes characteristicgroups of natural floodplains
Dyn
amis
m
Total number 0 ndashgtn Soil profile Bullinger-Weber Indicator of morphologicalof horizons per et al (2007) changes due to fluvialmeter (Hm) dynamicsElevation minusnndashgtn Topography Indicator of rate ofvariation through erosionsedimentationtime (∆)
4359
HESSD10 4337ndash4367 2013
Spatio-temporalheterogeneity of
riparian soilmorphology
B Fournier et al
Title Page
Abstract Introduction
Conclusions References
Tables Figures
J I
J I
Back Close
Full Screen Esc
Printer-friendly Version
Interactive Discussion
Discussion
Paper
|D
iscussionP
aper|
Discussion
Paper
|D
iscussionP
aper|
Table 3 Soil diversity and richness calculated at the Thur site
N0 N1 N2 E1 E2 J
Profile Open habitats 7 428 347 061 050 075Forest 2 197 195 097 097 098Pasture 4 295 260 074 065 078
Topsoil Open habitats 6 450 378 075 063 084Forest 4 259 203 065 051 069Pasture 3 261 233 087 078 087
4360
HESSD10 4337ndash4367 2013
Spatio-temporalheterogeneity of
riparian soilmorphology
B Fournier et al
Title Page
Abstract Introduction
Conclusions References
Tables Figures
J I
J I
Back Close
Full Screen Esc
Printer-friendly Version
Interactive Discussion
Discussion
Paper
|D
iscussionP
aper|
Discussion
Paper
|D
iscussionP
aper|
Table 4 Relative abundance () of profile and topsoil groups for the restored and referenceareas
Soil profilegroup 1 group 2 group 3 group 4 group 5 group 6 group 7 group 8
Open habitats 13 118 ndash 421 289 105 39 13Forest ndash 583 ndash ndash ndash ndash 417 ndashPasture 455 409 91 ndash ndash 45 ndash ndash
Topsoil layergroup 1 group 2 group 3 group 4 group 5 group 6 group 7
Open habitats 79 276 132 395 92 ndash 26Forest 583 ndash ndash 83 250 83 ndashPasture 636 ndash ndash 227 136 ndash ndash
4361
HESSD10 4337ndash4367 2013
Spatio-temporalheterogeneity of
riparian soilmorphology
B Fournier et al
Title Page
Abstract Introduction
Conclusions References
Tables Figures
J I
J I
Back Close
Full Screen Esc
Printer-friendly Version
Interactive Discussion
Discussion
Paper
|D
iscussionP
aper|
Discussion
Paper
|D
iscussionP
aper|
Table 5 Averages of plant species biodiversity metrics for the open and forest habitats of theRiver Thur site
N0 N1 N2 E1 E2 J
Open habitats 1788 439 287 025 017 048Forest 1671 675 488 041 030 067
4362
HESSD10 4337ndash4367 2013
Spatio-temporalheterogeneity of
riparian soilmorphology
B Fournier et al
Title Page
Abstract Introduction
Conclusions References
Tables Figures
J I
J I
Back Close
Full Screen Esc
Printer-friendly Version
Interactive Discussion
Discussion
Paper
|D
iscussionP
aper|
Discussion
Paper
|D
iscussionP
aper|
0
5
10
15
20
0 10 20 30 40 50 60 70H
m
Distance to the river (m)
b) Control area
0
5
10
15
20
0 10 20 30 40 50 60 70
Hm
Distance to the river (m)
a) Restored area
Fig 1 Number of horizons per meter (Hm) versus lateral distance to the river (m) for therestored (a) and the reference areas (b)
4363
HESSD10 4337ndash4367 2013
Spatio-temporalheterogeneity of
riparian soilmorphology
B Fournier et al
Title Page
Abstract Introduction
Conclusions References
Tables Figures
J I
J I
Back Close
Full Screen Esc
Printer-friendly Version
Interactive Discussion
Discussion
Paper
|D
iscussionP
aper|
Discussion
Paper
|D
iscussionP
aper|
-2
-1
0
1
2
10 20 30 40 50 60 gt60
Elev
atio
n de
lta (m
)
Distance to the river (m)
a) Sedimentation Erosion before the restoration
RestoredUn-restored
RestoredUn-restored-2
-1
0
1
2
10 20 30 40 50 60 gt60
Elev
atio
n de
lta (m
)
Distance to the river (m)
b) Sedimentation Erosion after the restoration
Fig 2 Average elevation deltas (m) and their associated standard deviations before (a periodranging from 1996 to 2002) and after the restoration (b period ranging from 2002 to 2007) inthe restored and in the reference (un-restored) areas Calculations are based on cross sectionsdata for seven classes of distance to the river (10 m sections) Positive deltas (+) correspondto sedimentation process and negative deltas (minus) to erosion process
4364
HESSD10 4337ndash4367 2013
Spatio-temporalheterogeneity of
riparian soilmorphology
B Fournier et al
Title Page
Abstract Introduction
Conclusions References
Tables Figures
J I
J I
Back Close
Full Screen Esc
Printer-friendly Version
Interactive Discussion
Discussion
Paper
|D
iscussionP
aper|
Discussion
Paper
|D
iscussionP
aper|
-2
-1
0
1
10 20 30 40 50 60 gt60
Elev
atio
n de
lta (m
)Distance to the river (m)
b) Q5 flood effect after restoration
RestoredUn-restored
-2
-1
0
1
10 20 30 40 50 60 gt60
Elev
atio
n de
lta (m
)
Distance to the river (m)
a) Q5 flood effect before restoration
RestoredUn-restored
Fig 3 Effects of a single flood with a similar discharge (Q5 five-year flood) on elevation deltas(m) in the restored and in the reference area before (a) and after restoration (b) Calculationsare based on cross sections data for seven classes of distance to the river (10 m sections)Positive deltas (+) correspond to sedimentation process and negative deltas (minus) to erosionprocess
4365
HESSD10 4337ndash4367 2013
Spatio-temporalheterogeneity of
riparian soilmorphology
B Fournier et al
Title Page
Abstract Introduction
Conclusions References
Tables Figures
J I
J I
Back Close
Full Screen Esc
Printer-friendly Version
Interactive Discussion
Discussion
Paper
|D
iscussionP
aper|
Discussion
Paper
|D
iscussionP
aper|
0
5
10
15
20
0 10 20 30 40 50 60 70
Hm
Distance to the river (m)
No vegetation Sparse vegetation
and thicket
Thicket Willow
bushes
Forest
Sp
ars
e
ve
ge
tati
on
Fig 4 Vegetation successional stages versus soil dynamism (Hm) in the restored area (0ndash65 mfrom the river)
4366
HESSD10 4337ndash4367 2013
Spatio-temporalheterogeneity of
riparian soilmorphology
B Fournier et al
Title Page
Abstract Introduction
Conclusions References
Tables Figures
J I
J I
Back Close
Full Screen Esc
Printer-friendly Version
Interactive Discussion
Discussion
Paper
|D
iscussionP
aper|
Discussion
Paper
|D
iscussionP
aper|
100
80
60
40
20
0
0-15 15-35 35-45 45-55 55-65
Group4
Group5
Group6
Group2
Group7
Group8
Group1
No
vegetation
Willow
bushes
Thicket ForestSparse
vegetation
+ Thicket
Fig 5 Vegetation successional stages versus frequency of soil profile groups in the restoredarea Soil groups are given according to their succession along the river lateral gradient Soilprofile group 3 was only observed in the control area
4367
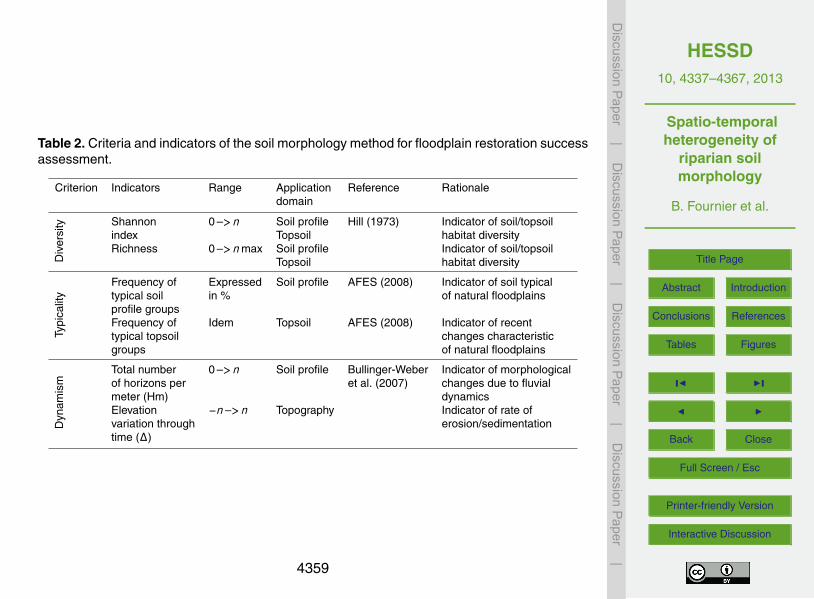
HESSD10 4337ndash4367 2013
Spatio-temporalheterogeneity of
riparian soilmorphology
B Fournier et al
Title Page
Abstract Introduction
Conclusions References
Tables Figures
J I
J I
Back Close
Full Screen Esc
Printer-friendly Version
Interactive Discussion
Discussion
Paper
|D
iscussionP
aper|
Discussion
Paper
|D
iscussionP
aper|
Table 2 Criteria and indicators of the soil morphology method for floodplain restoration successassessment
Criterion Indicators Range Application Reference Rationaledomain
Div
ersi
ty Shannon 0 ndashgtn Soil profile Hill (1973) Indicator of soiltopsoilindex Topsoil habitat diversityRichness 0 ndashgtnmax Soil profile Indicator of soiltopsoil
Topsoil habitat diversity
Typi
calit
y
Frequency of Expressed Soil profile AFES (2008) Indicator of soil typicaltypical soil in of natural floodplainsprofile groupsFrequency of Idem Topsoil AFES (2008) Indicator of recenttypical topsoil changes characteristicgroups of natural floodplains
Dyn
amis
m
Total number 0 ndashgtn Soil profile Bullinger-Weber Indicator of morphologicalof horizons per et al (2007) changes due to fluvialmeter (Hm) dynamicsElevation minusnndashgtn Topography Indicator of rate ofvariation through erosionsedimentationtime (∆)
4359
HESSD10 4337ndash4367 2013
Spatio-temporalheterogeneity of
riparian soilmorphology
B Fournier et al
Title Page
Abstract Introduction
Conclusions References
Tables Figures
J I
J I
Back Close
Full Screen Esc
Printer-friendly Version
Interactive Discussion
Discussion
Paper
|D
iscussionP
aper|
Discussion
Paper
|D
iscussionP
aper|
Table 3 Soil diversity and richness calculated at the Thur site
N0 N1 N2 E1 E2 J
Profile Open habitats 7 428 347 061 050 075Forest 2 197 195 097 097 098Pasture 4 295 260 074 065 078
Topsoil Open habitats 6 450 378 075 063 084Forest 4 259 203 065 051 069Pasture 3 261 233 087 078 087
4360
HESSD10 4337ndash4367 2013
Spatio-temporalheterogeneity of
riparian soilmorphology
B Fournier et al
Title Page
Abstract Introduction
Conclusions References
Tables Figures
J I
J I
Back Close
Full Screen Esc
Printer-friendly Version
Interactive Discussion
Discussion
Paper
|D
iscussionP
aper|
Discussion
Paper
|D
iscussionP
aper|
Table 4 Relative abundance () of profile and topsoil groups for the restored and referenceareas
Soil profilegroup 1 group 2 group 3 group 4 group 5 group 6 group 7 group 8
Open habitats 13 118 ndash 421 289 105 39 13Forest ndash 583 ndash ndash ndash ndash 417 ndashPasture 455 409 91 ndash ndash 45 ndash ndash
Topsoil layergroup 1 group 2 group 3 group 4 group 5 group 6 group 7
Open habitats 79 276 132 395 92 ndash 26Forest 583 ndash ndash 83 250 83 ndashPasture 636 ndash ndash 227 136 ndash ndash
4361
HESSD10 4337ndash4367 2013
Spatio-temporalheterogeneity of
riparian soilmorphology
B Fournier et al
Title Page
Abstract Introduction
Conclusions References
Tables Figures
J I
J I
Back Close
Full Screen Esc
Printer-friendly Version
Interactive Discussion
Discussion
Paper
|D
iscussionP
aper|
Discussion
Paper
|D
iscussionP
aper|
Table 5 Averages of plant species biodiversity metrics for the open and forest habitats of theRiver Thur site
N0 N1 N2 E1 E2 J
Open habitats 1788 439 287 025 017 048Forest 1671 675 488 041 030 067
4362
HESSD10 4337ndash4367 2013
Spatio-temporalheterogeneity of
riparian soilmorphology
B Fournier et al
Title Page
Abstract Introduction
Conclusions References
Tables Figures
J I
J I
Back Close
Full Screen Esc
Printer-friendly Version
Interactive Discussion
Discussion
Paper
|D
iscussionP
aper|
Discussion
Paper
|D
iscussionP
aper|
0
5
10
15
20
0 10 20 30 40 50 60 70H
m
Distance to the river (m)
b) Control area
0
5
10
15
20
0 10 20 30 40 50 60 70
Hm
Distance to the river (m)
a) Restored area
Fig 1 Number of horizons per meter (Hm) versus lateral distance to the river (m) for therestored (a) and the reference areas (b)
4363
HESSD10 4337ndash4367 2013
Spatio-temporalheterogeneity of
riparian soilmorphology
B Fournier et al
Title Page
Abstract Introduction
Conclusions References
Tables Figures
J I
J I
Back Close
Full Screen Esc
Printer-friendly Version
Interactive Discussion
Discussion
Paper
|D
iscussionP
aper|
Discussion
Paper
|D
iscussionP
aper|
-2
-1
0
1
2
10 20 30 40 50 60 gt60
Elev
atio
n de
lta (m
)
Distance to the river (m)
a) Sedimentation Erosion before the restoration
RestoredUn-restored
RestoredUn-restored-2
-1
0
1
2
10 20 30 40 50 60 gt60
Elev
atio
n de
lta (m
)
Distance to the river (m)
b) Sedimentation Erosion after the restoration
Fig 2 Average elevation deltas (m) and their associated standard deviations before (a periodranging from 1996 to 2002) and after the restoration (b period ranging from 2002 to 2007) inthe restored and in the reference (un-restored) areas Calculations are based on cross sectionsdata for seven classes of distance to the river (10 m sections) Positive deltas (+) correspondto sedimentation process and negative deltas (minus) to erosion process
4364
HESSD10 4337ndash4367 2013
Spatio-temporalheterogeneity of
riparian soilmorphology
B Fournier et al
Title Page
Abstract Introduction
Conclusions References
Tables Figures
J I
J I
Back Close
Full Screen Esc
Printer-friendly Version
Interactive Discussion
Discussion
Paper
|D
iscussionP
aper|
Discussion
Paper
|D
iscussionP
aper|
-2
-1
0
1
10 20 30 40 50 60 gt60
Elev
atio
n de
lta (m
)Distance to the river (m)
b) Q5 flood effect after restoration
RestoredUn-restored
-2
-1
0
1
10 20 30 40 50 60 gt60
Elev
atio
n de
lta (m
)
Distance to the river (m)
a) Q5 flood effect before restoration
RestoredUn-restored
Fig 3 Effects of a single flood with a similar discharge (Q5 five-year flood) on elevation deltas(m) in the restored and in the reference area before (a) and after restoration (b) Calculationsare based on cross sections data for seven classes of distance to the river (10 m sections)Positive deltas (+) correspond to sedimentation process and negative deltas (minus) to erosionprocess
4365
HESSD10 4337ndash4367 2013
Spatio-temporalheterogeneity of
riparian soilmorphology
B Fournier et al
Title Page
Abstract Introduction
Conclusions References
Tables Figures
J I
J I
Back Close
Full Screen Esc
Printer-friendly Version
Interactive Discussion
Discussion
Paper
|D
iscussionP
aper|
Discussion
Paper
|D
iscussionP
aper|
0
5
10
15
20
0 10 20 30 40 50 60 70
Hm
Distance to the river (m)
No vegetation Sparse vegetation
and thicket
Thicket Willow
bushes
Forest
Sp
ars
e
ve
ge
tati
on
Fig 4 Vegetation successional stages versus soil dynamism (Hm) in the restored area (0ndash65 mfrom the river)
4366
HESSD10 4337ndash4367 2013
Spatio-temporalheterogeneity of
riparian soilmorphology
B Fournier et al
Title Page
Abstract Introduction
Conclusions References
Tables Figures
J I
J I
Back Close
Full Screen Esc
Printer-friendly Version
Interactive Discussion
Discussion
Paper
|D
iscussionP
aper|
Discussion
Paper
|D
iscussionP
aper|
100
80
60
40
20
0
0-15 15-35 35-45 45-55 55-65
Group4
Group5
Group6
Group2
Group7
Group8
Group1
No
vegetation
Willow
bushes
Thicket ForestSparse
vegetation
+ Thicket
Fig 5 Vegetation successional stages versus frequency of soil profile groups in the restoredarea Soil groups are given according to their succession along the river lateral gradient Soilprofile group 3 was only observed in the control area
4367
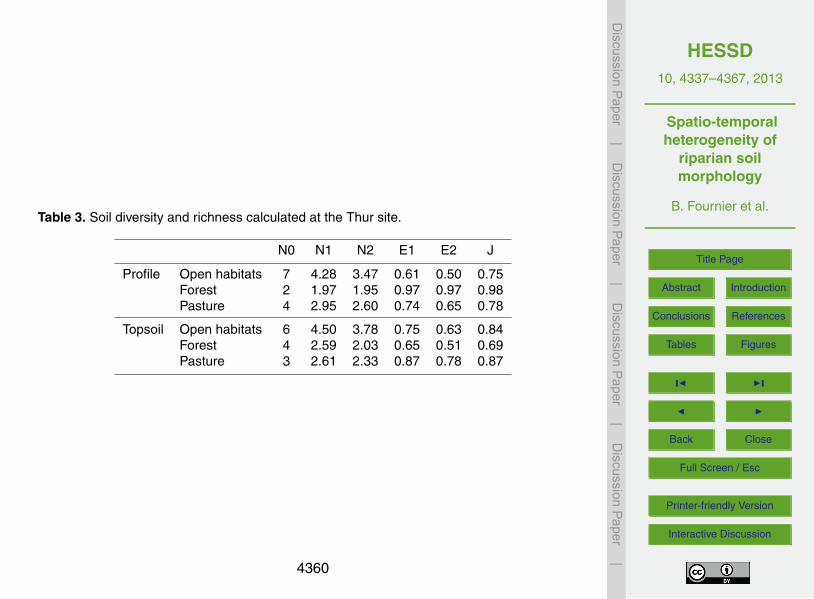
HESSD10 4337ndash4367 2013
Spatio-temporalheterogeneity of
riparian soilmorphology
B Fournier et al
Title Page
Abstract Introduction
Conclusions References
Tables Figures
J I
J I
Back Close
Full Screen Esc
Printer-friendly Version
Interactive Discussion
Discussion
Paper
|D
iscussionP
aper|
Discussion
Paper
|D
iscussionP
aper|
Table 3 Soil diversity and richness calculated at the Thur site
N0 N1 N2 E1 E2 J
Profile Open habitats 7 428 347 061 050 075Forest 2 197 195 097 097 098Pasture 4 295 260 074 065 078
Topsoil Open habitats 6 450 378 075 063 084Forest 4 259 203 065 051 069Pasture 3 261 233 087 078 087
4360
HESSD10 4337ndash4367 2013
Spatio-temporalheterogeneity of
riparian soilmorphology
B Fournier et al
Title Page
Abstract Introduction
Conclusions References
Tables Figures
J I
J I
Back Close
Full Screen Esc
Printer-friendly Version
Interactive Discussion
Discussion
Paper
|D
iscussionP
aper|
Discussion
Paper
|D
iscussionP
aper|
Table 4 Relative abundance () of profile and topsoil groups for the restored and referenceareas
Soil profilegroup 1 group 2 group 3 group 4 group 5 group 6 group 7 group 8
Open habitats 13 118 ndash 421 289 105 39 13Forest ndash 583 ndash ndash ndash ndash 417 ndashPasture 455 409 91 ndash ndash 45 ndash ndash
Topsoil layergroup 1 group 2 group 3 group 4 group 5 group 6 group 7
Open habitats 79 276 132 395 92 ndash 26Forest 583 ndash ndash 83 250 83 ndashPasture 636 ndash ndash 227 136 ndash ndash
4361
HESSD10 4337ndash4367 2013
Spatio-temporalheterogeneity of
riparian soilmorphology
B Fournier et al
Title Page
Abstract Introduction
Conclusions References
Tables Figures
J I
J I
Back Close
Full Screen Esc
Printer-friendly Version
Interactive Discussion
Discussion
Paper
|D
iscussionP
aper|
Discussion
Paper
|D
iscussionP
aper|
Table 5 Averages of plant species biodiversity metrics for the open and forest habitats of theRiver Thur site
N0 N1 N2 E1 E2 J
Open habitats 1788 439 287 025 017 048Forest 1671 675 488 041 030 067
4362
HESSD10 4337ndash4367 2013
Spatio-temporalheterogeneity of
riparian soilmorphology
B Fournier et al
Title Page
Abstract Introduction
Conclusions References
Tables Figures
J I
J I
Back Close
Full Screen Esc
Printer-friendly Version
Interactive Discussion
Discussion
Paper
|D
iscussionP
aper|
Discussion
Paper
|D
iscussionP
aper|
0
5
10
15
20
0 10 20 30 40 50 60 70H
m
Distance to the river (m)
b) Control area
0
5
10
15
20
0 10 20 30 40 50 60 70
Hm
Distance to the river (m)
a) Restored area
Fig 1 Number of horizons per meter (Hm) versus lateral distance to the river (m) for therestored (a) and the reference areas (b)
4363
HESSD10 4337ndash4367 2013
Spatio-temporalheterogeneity of
riparian soilmorphology
B Fournier et al
Title Page
Abstract Introduction
Conclusions References
Tables Figures
J I
J I
Back Close
Full Screen Esc
Printer-friendly Version
Interactive Discussion
Discussion
Paper
|D
iscussionP
aper|
Discussion
Paper
|D
iscussionP
aper|
-2
-1
0
1
2
10 20 30 40 50 60 gt60
Elev
atio
n de
lta (m
)
Distance to the river (m)
a) Sedimentation Erosion before the restoration
RestoredUn-restored
RestoredUn-restored-2
-1
0
1
2
10 20 30 40 50 60 gt60
Elev
atio
n de
lta (m
)
Distance to the river (m)
b) Sedimentation Erosion after the restoration
Fig 2 Average elevation deltas (m) and their associated standard deviations before (a periodranging from 1996 to 2002) and after the restoration (b period ranging from 2002 to 2007) inthe restored and in the reference (un-restored) areas Calculations are based on cross sectionsdata for seven classes of distance to the river (10 m sections) Positive deltas (+) correspondto sedimentation process and negative deltas (minus) to erosion process
4364
HESSD10 4337ndash4367 2013
Spatio-temporalheterogeneity of
riparian soilmorphology
B Fournier et al
Title Page
Abstract Introduction
Conclusions References
Tables Figures
J I
J I
Back Close
Full Screen Esc
Printer-friendly Version
Interactive Discussion
Discussion
Paper
|D
iscussionP
aper|
Discussion
Paper
|D
iscussionP
aper|
-2
-1
0
1
10 20 30 40 50 60 gt60
Elev
atio
n de
lta (m
)Distance to the river (m)
b) Q5 flood effect after restoration
RestoredUn-restored
-2
-1
0
1
10 20 30 40 50 60 gt60
Elev
atio
n de
lta (m
)
Distance to the river (m)
a) Q5 flood effect before restoration
RestoredUn-restored
Fig 3 Effects of a single flood with a similar discharge (Q5 five-year flood) on elevation deltas(m) in the restored and in the reference area before (a) and after restoration (b) Calculationsare based on cross sections data for seven classes of distance to the river (10 m sections)Positive deltas (+) correspond to sedimentation process and negative deltas (minus) to erosionprocess
4365
HESSD10 4337ndash4367 2013
Spatio-temporalheterogeneity of
riparian soilmorphology
B Fournier et al
Title Page
Abstract Introduction
Conclusions References
Tables Figures
J I
J I
Back Close
Full Screen Esc
Printer-friendly Version
Interactive Discussion
Discussion
Paper
|D
iscussionP
aper|
Discussion
Paper
|D
iscussionP
aper|
0
5
10
15
20
0 10 20 30 40 50 60 70
Hm
Distance to the river (m)
No vegetation Sparse vegetation
and thicket
Thicket Willow
bushes
Forest
Sp
ars
e
ve
ge
tati
on
Fig 4 Vegetation successional stages versus soil dynamism (Hm) in the restored area (0ndash65 mfrom the river)
4366
HESSD10 4337ndash4367 2013
Spatio-temporalheterogeneity of
riparian soilmorphology
B Fournier et al
Title Page
Abstract Introduction
Conclusions References
Tables Figures
J I
J I
Back Close
Full Screen Esc
Printer-friendly Version
Interactive Discussion
Discussion
Paper
|D
iscussionP
aper|
Discussion
Paper
|D
iscussionP
aper|
100
80
60
40
20
0
0-15 15-35 35-45 45-55 55-65
Group4
Group5
Group6
Group2
Group7
Group8
Group1
No
vegetation
Willow
bushes
Thicket ForestSparse
vegetation
+ Thicket
Fig 5 Vegetation successional stages versus frequency of soil profile groups in the restoredarea Soil groups are given according to their succession along the river lateral gradient Soilprofile group 3 was only observed in the control area
4367
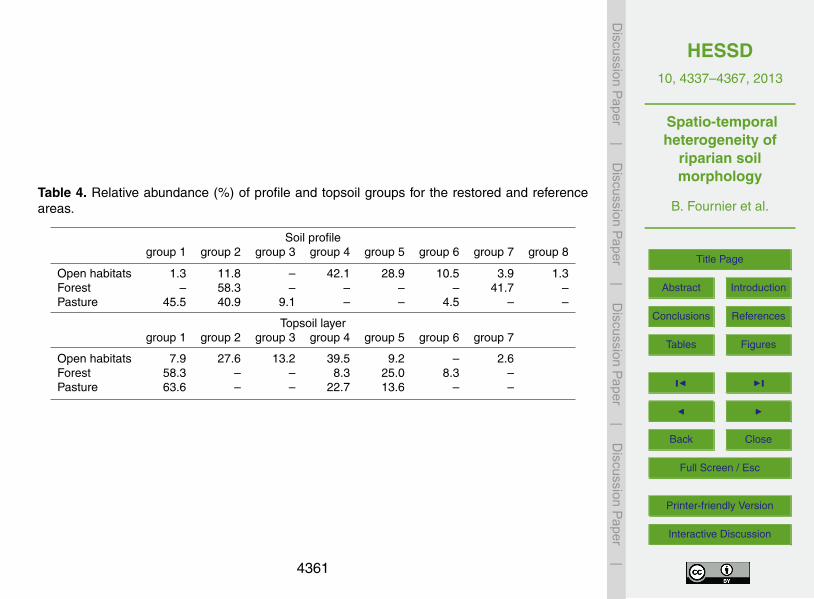
HESSD10 4337ndash4367 2013
Spatio-temporalheterogeneity of
riparian soilmorphology
B Fournier et al
Title Page
Abstract Introduction
Conclusions References
Tables Figures
J I
J I
Back Close
Full Screen Esc
Printer-friendly Version
Interactive Discussion
Discussion
Paper
|D
iscussionP
aper|
Discussion
Paper
|D
iscussionP
aper|
Table 4 Relative abundance () of profile and topsoil groups for the restored and referenceareas
Soil profilegroup 1 group 2 group 3 group 4 group 5 group 6 group 7 group 8
Open habitats 13 118 ndash 421 289 105 39 13Forest ndash 583 ndash ndash ndash ndash 417 ndashPasture 455 409 91 ndash ndash 45 ndash ndash
Topsoil layergroup 1 group 2 group 3 group 4 group 5 group 6 group 7
Open habitats 79 276 132 395 92 ndash 26Forest 583 ndash ndash 83 250 83 ndashPasture 636 ndash ndash 227 136 ndash ndash
4361
HESSD10 4337ndash4367 2013
Spatio-temporalheterogeneity of
riparian soilmorphology
B Fournier et al
Title Page
Abstract Introduction
Conclusions References
Tables Figures
J I
J I
Back Close
Full Screen Esc
Printer-friendly Version
Interactive Discussion
Discussion
Paper
|D
iscussionP
aper|
Discussion
Paper
|D
iscussionP
aper|
Table 5 Averages of plant species biodiversity metrics for the open and forest habitats of theRiver Thur site
N0 N1 N2 E1 E2 J
Open habitats 1788 439 287 025 017 048Forest 1671 675 488 041 030 067
4362
HESSD10 4337ndash4367 2013
Spatio-temporalheterogeneity of
riparian soilmorphology
B Fournier et al
Title Page
Abstract Introduction
Conclusions References
Tables Figures
J I
J I
Back Close
Full Screen Esc
Printer-friendly Version
Interactive Discussion
Discussion
Paper
|D
iscussionP
aper|
Discussion
Paper
|D
iscussionP
aper|
0
5
10
15
20
0 10 20 30 40 50 60 70H
m
Distance to the river (m)
b) Control area
0
5
10
15
20
0 10 20 30 40 50 60 70
Hm
Distance to the river (m)
a) Restored area
Fig 1 Number of horizons per meter (Hm) versus lateral distance to the river (m) for therestored (a) and the reference areas (b)
4363
HESSD10 4337ndash4367 2013
Spatio-temporalheterogeneity of
riparian soilmorphology
B Fournier et al
Title Page
Abstract Introduction
Conclusions References
Tables Figures
J I
J I
Back Close
Full Screen Esc
Printer-friendly Version
Interactive Discussion
Discussion
Paper
|D
iscussionP
aper|
Discussion
Paper
|D
iscussionP
aper|
-2
-1
0
1
2
10 20 30 40 50 60 gt60
Elev
atio
n de
lta (m
)
Distance to the river (m)
a) Sedimentation Erosion before the restoration
RestoredUn-restored
RestoredUn-restored-2
-1
0
1
2
10 20 30 40 50 60 gt60
Elev
atio
n de
lta (m
)
Distance to the river (m)
b) Sedimentation Erosion after the restoration
Fig 2 Average elevation deltas (m) and their associated standard deviations before (a periodranging from 1996 to 2002) and after the restoration (b period ranging from 2002 to 2007) inthe restored and in the reference (un-restored) areas Calculations are based on cross sectionsdata for seven classes of distance to the river (10 m sections) Positive deltas (+) correspondto sedimentation process and negative deltas (minus) to erosion process
4364
HESSD10 4337ndash4367 2013
Spatio-temporalheterogeneity of
riparian soilmorphology
B Fournier et al
Title Page
Abstract Introduction
Conclusions References
Tables Figures
J I
J I
Back Close
Full Screen Esc
Printer-friendly Version
Interactive Discussion
Discussion
Paper
|D
iscussionP
aper|
Discussion
Paper
|D
iscussionP
aper|
-2
-1
0
1
10 20 30 40 50 60 gt60
Elev
atio
n de
lta (m
)Distance to the river (m)
b) Q5 flood effect after restoration
RestoredUn-restored
-2
-1
0
1
10 20 30 40 50 60 gt60
Elev
atio
n de
lta (m
)
Distance to the river (m)
a) Q5 flood effect before restoration
RestoredUn-restored
Fig 3 Effects of a single flood with a similar discharge (Q5 five-year flood) on elevation deltas(m) in the restored and in the reference area before (a) and after restoration (b) Calculationsare based on cross sections data for seven classes of distance to the river (10 m sections)Positive deltas (+) correspond to sedimentation process and negative deltas (minus) to erosionprocess
4365
HESSD10 4337ndash4367 2013
Spatio-temporalheterogeneity of
riparian soilmorphology
B Fournier et al
Title Page
Abstract Introduction
Conclusions References
Tables Figures
J I
J I
Back Close
Full Screen Esc
Printer-friendly Version
Interactive Discussion
Discussion
Paper
|D
iscussionP
aper|
Discussion
Paper
|D
iscussionP
aper|
0
5
10
15
20
0 10 20 30 40 50 60 70
Hm
Distance to the river (m)
No vegetation Sparse vegetation
and thicket
Thicket Willow
bushes
Forest
Sp
ars
e
ve
ge
tati
on
Fig 4 Vegetation successional stages versus soil dynamism (Hm) in the restored area (0ndash65 mfrom the river)
4366
HESSD10 4337ndash4367 2013
Spatio-temporalheterogeneity of
riparian soilmorphology
B Fournier et al
Title Page
Abstract Introduction
Conclusions References
Tables Figures
J I
J I
Back Close
Full Screen Esc
Printer-friendly Version
Interactive Discussion
Discussion
Paper
|D
iscussionP
aper|
Discussion
Paper
|D
iscussionP
aper|
100
80
60
40
20
0
0-15 15-35 35-45 45-55 55-65
Group4
Group5
Group6
Group2
Group7
Group8
Group1
No
vegetation
Willow
bushes
Thicket ForestSparse
vegetation
+ Thicket
Fig 5 Vegetation successional stages versus frequency of soil profile groups in the restoredarea Soil groups are given according to their succession along the river lateral gradient Soilprofile group 3 was only observed in the control area
4367
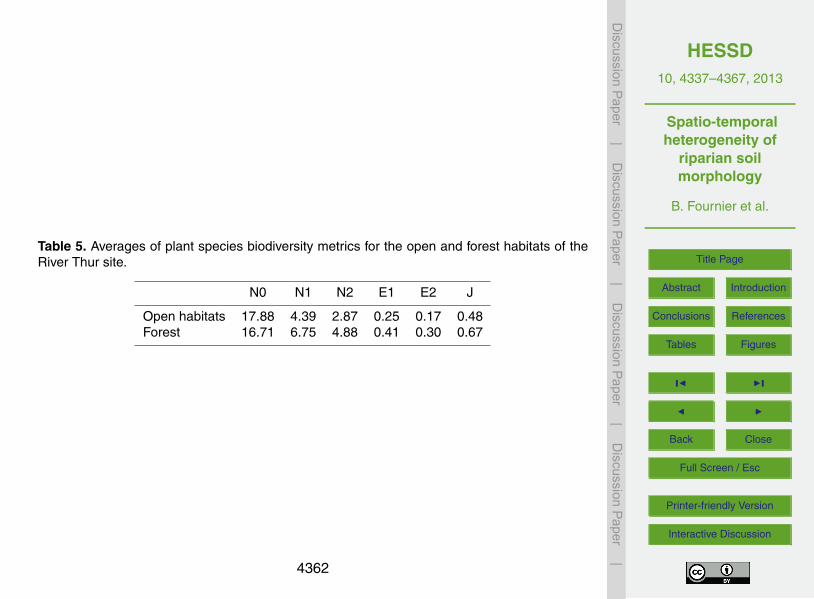
HESSD10 4337ndash4367 2013
Spatio-temporalheterogeneity of
riparian soilmorphology
B Fournier et al
Title Page
Abstract Introduction
Conclusions References
Tables Figures
J I
J I
Back Close
Full Screen Esc
Printer-friendly Version
Interactive Discussion
Discussion
Paper
|D
iscussionP
aper|
Discussion
Paper
|D
iscussionP
aper|
Table 5 Averages of plant species biodiversity metrics for the open and forest habitats of theRiver Thur site
N0 N1 N2 E1 E2 J
Open habitats 1788 439 287 025 017 048Forest 1671 675 488 041 030 067
4362
HESSD10 4337ndash4367 2013
Spatio-temporalheterogeneity of
riparian soilmorphology
B Fournier et al
Title Page
Abstract Introduction
Conclusions References
Tables Figures
J I
J I
Back Close
Full Screen Esc
Printer-friendly Version
Interactive Discussion
Discussion
Paper
|D
iscussionP
aper|
Discussion
Paper
|D
iscussionP
aper|
0
5
10
15
20
0 10 20 30 40 50 60 70H
m
Distance to the river (m)
b) Control area
0
5
10
15
20
0 10 20 30 40 50 60 70
Hm
Distance to the river (m)
a) Restored area
Fig 1 Number of horizons per meter (Hm) versus lateral distance to the river (m) for therestored (a) and the reference areas (b)
4363
HESSD10 4337ndash4367 2013
Spatio-temporalheterogeneity of
riparian soilmorphology
B Fournier et al
Title Page
Abstract Introduction
Conclusions References
Tables Figures
J I
J I
Back Close
Full Screen Esc
Printer-friendly Version
Interactive Discussion
Discussion
Paper
|D
iscussionP
aper|
Discussion
Paper
|D
iscussionP
aper|
-2
-1
0
1
2
10 20 30 40 50 60 gt60
Elev
atio
n de
lta (m
)
Distance to the river (m)
a) Sedimentation Erosion before the restoration
RestoredUn-restored
RestoredUn-restored-2
-1
0
1
2
10 20 30 40 50 60 gt60
Elev
atio
n de
lta (m
)
Distance to the river (m)
b) Sedimentation Erosion after the restoration
Fig 2 Average elevation deltas (m) and their associated standard deviations before (a periodranging from 1996 to 2002) and after the restoration (b period ranging from 2002 to 2007) inthe restored and in the reference (un-restored) areas Calculations are based on cross sectionsdata for seven classes of distance to the river (10 m sections) Positive deltas (+) correspondto sedimentation process and negative deltas (minus) to erosion process
4364
HESSD10 4337ndash4367 2013
Spatio-temporalheterogeneity of
riparian soilmorphology
B Fournier et al
Title Page
Abstract Introduction
Conclusions References
Tables Figures
J I
J I
Back Close
Full Screen Esc
Printer-friendly Version
Interactive Discussion
Discussion
Paper
|D
iscussionP
aper|
Discussion
Paper
|D
iscussionP
aper|
-2
-1
0
1
10 20 30 40 50 60 gt60
Elev
atio
n de
lta (m
)Distance to the river (m)
b) Q5 flood effect after restoration
RestoredUn-restored
-2
-1
0
1
10 20 30 40 50 60 gt60
Elev
atio
n de
lta (m
)
Distance to the river (m)
a) Q5 flood effect before restoration
RestoredUn-restored
Fig 3 Effects of a single flood with a similar discharge (Q5 five-year flood) on elevation deltas(m) in the restored and in the reference area before (a) and after restoration (b) Calculationsare based on cross sections data for seven classes of distance to the river (10 m sections)Positive deltas (+) correspond to sedimentation process and negative deltas (minus) to erosionprocess
4365
HESSD10 4337ndash4367 2013
Spatio-temporalheterogeneity of
riparian soilmorphology
B Fournier et al
Title Page
Abstract Introduction
Conclusions References
Tables Figures
J I
J I
Back Close
Full Screen Esc
Printer-friendly Version
Interactive Discussion
Discussion
Paper
|D
iscussionP
aper|
Discussion
Paper
|D
iscussionP
aper|
0
5
10
15
20
0 10 20 30 40 50 60 70
Hm
Distance to the river (m)
No vegetation Sparse vegetation
and thicket
Thicket Willow
bushes
Forest
Sp
ars
e
ve
ge
tati
on
Fig 4 Vegetation successional stages versus soil dynamism (Hm) in the restored area (0ndash65 mfrom the river)
4366
HESSD10 4337ndash4367 2013
Spatio-temporalheterogeneity of
riparian soilmorphology
B Fournier et al
Title Page
Abstract Introduction
Conclusions References
Tables Figures
J I
J I
Back Close
Full Screen Esc
Printer-friendly Version
Interactive Discussion
Discussion
Paper
|D
iscussionP
aper|
Discussion
Paper
|D
iscussionP
aper|
100
80
60
40
20
0
0-15 15-35 35-45 45-55 55-65
Group4
Group5
Group6
Group2
Group7
Group8
Group1
No
vegetation
Willow
bushes
Thicket ForestSparse
vegetation
+ Thicket
Fig 5 Vegetation successional stages versus frequency of soil profile groups in the restoredarea Soil groups are given according to their succession along the river lateral gradient Soilprofile group 3 was only observed in the control area
4367
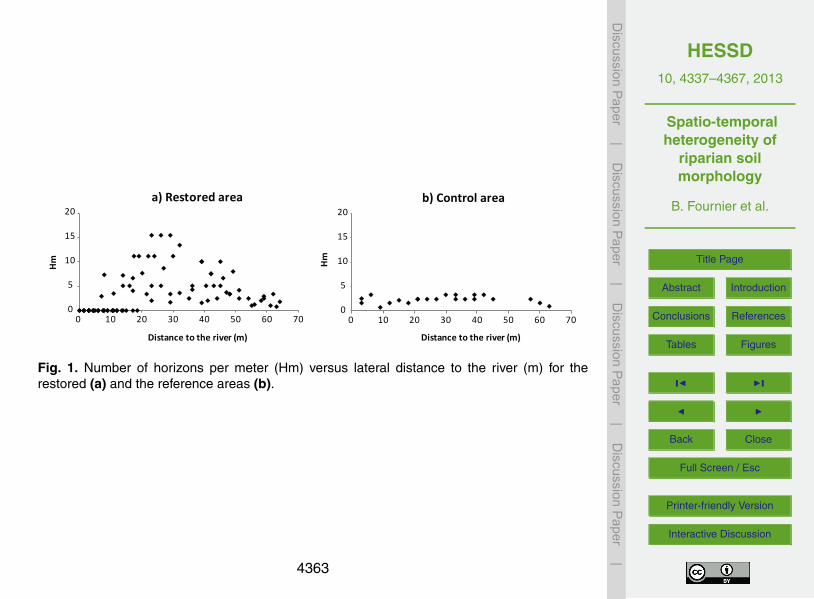
HESSD10 4337ndash4367 2013
Spatio-temporalheterogeneity of
riparian soilmorphology
B Fournier et al
Title Page
Abstract Introduction
Conclusions References
Tables Figures
J I
J I
Back Close
Full Screen Esc
Printer-friendly Version
Interactive Discussion
Discussion
Paper
|D
iscussionP
aper|
Discussion
Paper
|D
iscussionP
aper|
0
5
10
15
20
0 10 20 30 40 50 60 70H
m
Distance to the river (m)
b) Control area
0
5
10
15
20
0 10 20 30 40 50 60 70
Hm
Distance to the river (m)
a) Restored area
Fig 1 Number of horizons per meter (Hm) versus lateral distance to the river (m) for therestored (a) and the reference areas (b)
4363
HESSD10 4337ndash4367 2013
Spatio-temporalheterogeneity of
riparian soilmorphology
B Fournier et al
Title Page
Abstract Introduction
Conclusions References
Tables Figures
J I
J I
Back Close
Full Screen Esc
Printer-friendly Version
Interactive Discussion
Discussion
Paper
|D
iscussionP
aper|
Discussion
Paper
|D
iscussionP
aper|
-2
-1
0
1
2
10 20 30 40 50 60 gt60
Elev
atio
n de
lta (m
)
Distance to the river (m)
a) Sedimentation Erosion before the restoration
RestoredUn-restored
RestoredUn-restored-2
-1
0
1
2
10 20 30 40 50 60 gt60
Elev
atio
n de
lta (m
)
Distance to the river (m)
b) Sedimentation Erosion after the restoration
Fig 2 Average elevation deltas (m) and their associated standard deviations before (a periodranging from 1996 to 2002) and after the restoration (b period ranging from 2002 to 2007) inthe restored and in the reference (un-restored) areas Calculations are based on cross sectionsdata for seven classes of distance to the river (10 m sections) Positive deltas (+) correspondto sedimentation process and negative deltas (minus) to erosion process
4364
HESSD10 4337ndash4367 2013
Spatio-temporalheterogeneity of
riparian soilmorphology
B Fournier et al
Title Page
Abstract Introduction
Conclusions References
Tables Figures
J I
J I
Back Close
Full Screen Esc
Printer-friendly Version
Interactive Discussion
Discussion
Paper
|D
iscussionP
aper|
Discussion
Paper
|D
iscussionP
aper|
-2
-1
0
1
10 20 30 40 50 60 gt60
Elev
atio
n de
lta (m
)Distance to the river (m)
b) Q5 flood effect after restoration
RestoredUn-restored
-2
-1
0
1
10 20 30 40 50 60 gt60
Elev
atio
n de
lta (m
)
Distance to the river (m)
a) Q5 flood effect before restoration
RestoredUn-restored
Fig 3 Effects of a single flood with a similar discharge (Q5 five-year flood) on elevation deltas(m) in the restored and in the reference area before (a) and after restoration (b) Calculationsare based on cross sections data for seven classes of distance to the river (10 m sections)Positive deltas (+) correspond to sedimentation process and negative deltas (minus) to erosionprocess
4365
HESSD10 4337ndash4367 2013
Spatio-temporalheterogeneity of
riparian soilmorphology
B Fournier et al
Title Page
Abstract Introduction
Conclusions References
Tables Figures
J I
J I
Back Close
Full Screen Esc
Printer-friendly Version
Interactive Discussion
Discussion
Paper
|D
iscussionP
aper|
Discussion
Paper
|D
iscussionP
aper|
0
5
10
15
20
0 10 20 30 40 50 60 70
Hm
Distance to the river (m)
No vegetation Sparse vegetation
and thicket
Thicket Willow
bushes
Forest
Sp
ars
e
ve
ge
tati
on
Fig 4 Vegetation successional stages versus soil dynamism (Hm) in the restored area (0ndash65 mfrom the river)
4366
HESSD10 4337ndash4367 2013
Spatio-temporalheterogeneity of
riparian soilmorphology
B Fournier et al
Title Page
Abstract Introduction
Conclusions References
Tables Figures
J I
J I
Back Close
Full Screen Esc
Printer-friendly Version
Interactive Discussion
Discussion
Paper
|D
iscussionP
aper|
Discussion
Paper
|D
iscussionP
aper|
100
80
60
40
20
0
0-15 15-35 35-45 45-55 55-65
Group4
Group5
Group6
Group2
Group7
Group8
Group1
No
vegetation
Willow
bushes
Thicket ForestSparse
vegetation
+ Thicket
Fig 5 Vegetation successional stages versus frequency of soil profile groups in the restoredarea Soil groups are given according to their succession along the river lateral gradient Soilprofile group 3 was only observed in the control area
4367
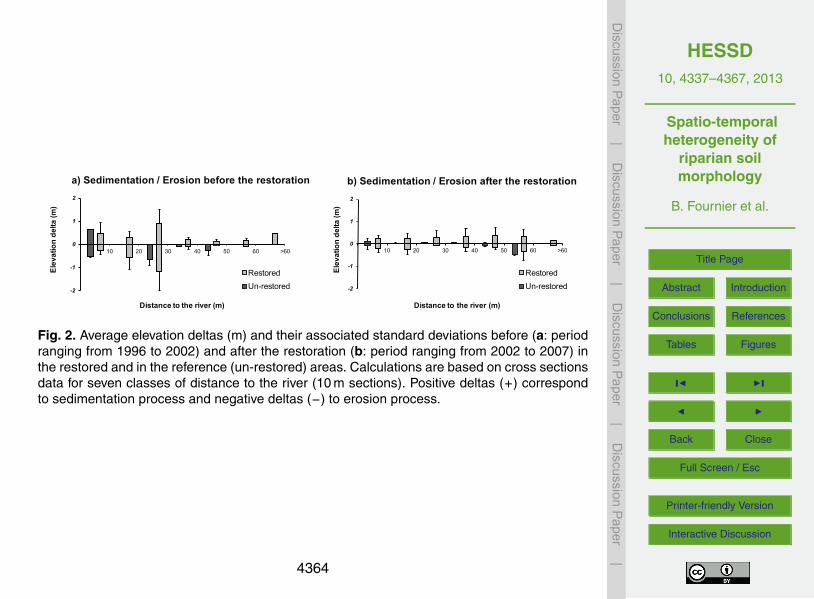
HESSD10 4337ndash4367 2013
Spatio-temporalheterogeneity of
riparian soilmorphology
B Fournier et al
Title Page
Abstract Introduction
Conclusions References
Tables Figures
J I
J I
Back Close
Full Screen Esc
Printer-friendly Version
Interactive Discussion
Discussion
Paper
|D
iscussionP
aper|
Discussion
Paper
|D
iscussionP
aper|
-2
-1
0
1
2
10 20 30 40 50 60 gt60
Elev
atio
n de
lta (m
)
Distance to the river (m)
a) Sedimentation Erosion before the restoration
RestoredUn-restored
RestoredUn-restored-2
-1
0
1
2
10 20 30 40 50 60 gt60
Elev
atio
n de
lta (m
)
Distance to the river (m)
b) Sedimentation Erosion after the restoration
Fig 2 Average elevation deltas (m) and their associated standard deviations before (a periodranging from 1996 to 2002) and after the restoration (b period ranging from 2002 to 2007) inthe restored and in the reference (un-restored) areas Calculations are based on cross sectionsdata for seven classes of distance to the river (10 m sections) Positive deltas (+) correspondto sedimentation process and negative deltas (minus) to erosion process
4364
HESSD10 4337ndash4367 2013
Spatio-temporalheterogeneity of
riparian soilmorphology
B Fournier et al
Title Page
Abstract Introduction
Conclusions References
Tables Figures
J I
J I
Back Close
Full Screen Esc
Printer-friendly Version
Interactive Discussion
Discussion
Paper
|D
iscussionP
aper|
Discussion
Paper
|D
iscussionP
aper|
-2
-1
0
1
10 20 30 40 50 60 gt60
Elev
atio
n de
lta (m
)Distance to the river (m)
b) Q5 flood effect after restoration
RestoredUn-restored
-2
-1
0
1
10 20 30 40 50 60 gt60
Elev
atio
n de
lta (m
)
Distance to the river (m)
a) Q5 flood effect before restoration
RestoredUn-restored
Fig 3 Effects of a single flood with a similar discharge (Q5 five-year flood) on elevation deltas(m) in the restored and in the reference area before (a) and after restoration (b) Calculationsare based on cross sections data for seven classes of distance to the river (10 m sections)Positive deltas (+) correspond to sedimentation process and negative deltas (minus) to erosionprocess
4365
HESSD10 4337ndash4367 2013
Spatio-temporalheterogeneity of
riparian soilmorphology
B Fournier et al
Title Page
Abstract Introduction
Conclusions References
Tables Figures
J I
J I
Back Close
Full Screen Esc
Printer-friendly Version
Interactive Discussion
Discussion
Paper
|D
iscussionP
aper|
Discussion
Paper
|D
iscussionP
aper|
0
5
10
15
20
0 10 20 30 40 50 60 70
Hm
Distance to the river (m)
No vegetation Sparse vegetation
and thicket
Thicket Willow
bushes
Forest
Sp
ars
e
ve
ge
tati
on
Fig 4 Vegetation successional stages versus soil dynamism (Hm) in the restored area (0ndash65 mfrom the river)
4366
HESSD10 4337ndash4367 2013
Spatio-temporalheterogeneity of
riparian soilmorphology
B Fournier et al
Title Page
Abstract Introduction
Conclusions References
Tables Figures
J I
J I
Back Close
Full Screen Esc
Printer-friendly Version
Interactive Discussion
Discussion
Paper
|D
iscussionP
aper|
Discussion
Paper
|D
iscussionP
aper|
100
80
60
40
20
0
0-15 15-35 35-45 45-55 55-65
Group4
Group5
Group6
Group2
Group7
Group8
Group1
No
vegetation
Willow
bushes
Thicket ForestSparse
vegetation
+ Thicket
Fig 5 Vegetation successional stages versus frequency of soil profile groups in the restoredarea Soil groups are given according to their succession along the river lateral gradient Soilprofile group 3 was only observed in the control area
4367
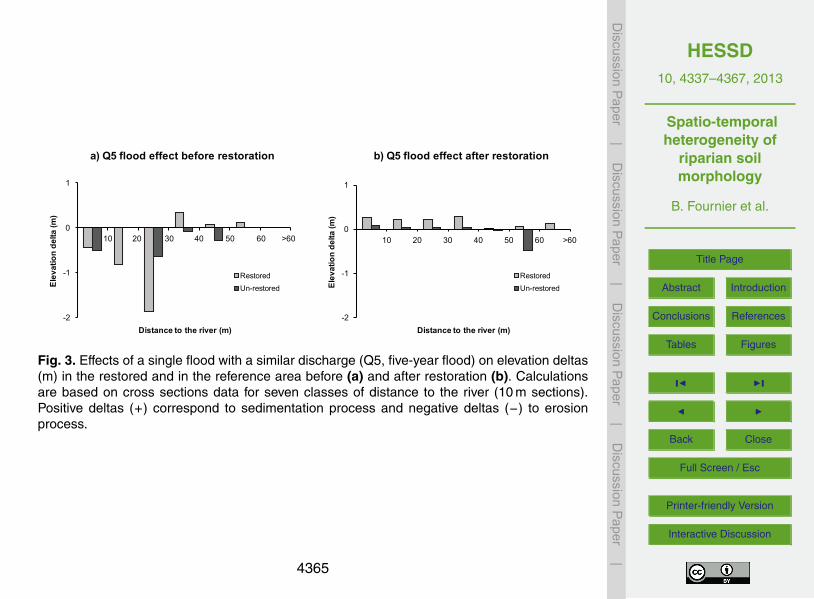
HESSD10 4337ndash4367 2013
Spatio-temporalheterogeneity of
riparian soilmorphology
B Fournier et al
Title Page
Abstract Introduction
Conclusions References
Tables Figures
J I
J I
Back Close
Full Screen Esc
Printer-friendly Version
Interactive Discussion
Discussion
Paper
|D
iscussionP
aper|
Discussion
Paper
|D
iscussionP
aper|
-2
-1
0
1
10 20 30 40 50 60 gt60
Elev
atio
n de
lta (m
)Distance to the river (m)
b) Q5 flood effect after restoration
RestoredUn-restored
-2
-1
0
1
10 20 30 40 50 60 gt60
Elev
atio
n de
lta (m
)
Distance to the river (m)
a) Q5 flood effect before restoration
RestoredUn-restored
Fig 3 Effects of a single flood with a similar discharge (Q5 five-year flood) on elevation deltas(m) in the restored and in the reference area before (a) and after restoration (b) Calculationsare based on cross sections data for seven classes of distance to the river (10 m sections)Positive deltas (+) correspond to sedimentation process and negative deltas (minus) to erosionprocess
4365
HESSD10 4337ndash4367 2013
Spatio-temporalheterogeneity of
riparian soilmorphology
B Fournier et al
Title Page
Abstract Introduction
Conclusions References
Tables Figures
J I
J I
Back Close
Full Screen Esc
Printer-friendly Version
Interactive Discussion
Discussion
Paper
|D
iscussionP
aper|
Discussion
Paper
|D
iscussionP
aper|
0
5
10
15
20
0 10 20 30 40 50 60 70
Hm
Distance to the river (m)
No vegetation Sparse vegetation
and thicket
Thicket Willow
bushes
Forest
Sp
ars
e
ve
ge
tati
on
Fig 4 Vegetation successional stages versus soil dynamism (Hm) in the restored area (0ndash65 mfrom the river)
4366
HESSD10 4337ndash4367 2013
Spatio-temporalheterogeneity of
riparian soilmorphology
B Fournier et al
Title Page
Abstract Introduction
Conclusions References
Tables Figures
J I
J I
Back Close
Full Screen Esc
Printer-friendly Version
Interactive Discussion
Discussion
Paper
|D
iscussionP
aper|
Discussion
Paper
|D
iscussionP
aper|
100
80
60
40
20
0
0-15 15-35 35-45 45-55 55-65
Group4
Group5
Group6
Group2
Group7
Group8
Group1
No
vegetation
Willow
bushes
Thicket ForestSparse
vegetation
+ Thicket
Fig 5 Vegetation successional stages versus frequency of soil profile groups in the restoredarea Soil groups are given according to their succession along the river lateral gradient Soilprofile group 3 was only observed in the control area
4367
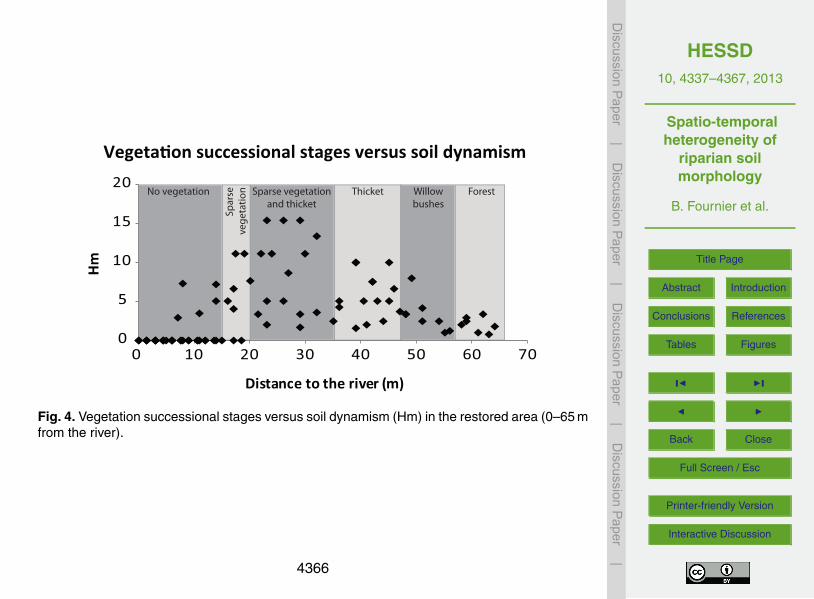
HESSD10 4337ndash4367 2013
Spatio-temporalheterogeneity of
riparian soilmorphology
B Fournier et al
Title Page
Abstract Introduction
Conclusions References
Tables Figures
J I
J I
Back Close
Full Screen Esc
Printer-friendly Version
Interactive Discussion
Discussion
Paper
|D
iscussionP
aper|
Discussion
Paper
|D
iscussionP
aper|
0
5
10
15
20
0 10 20 30 40 50 60 70
Hm
Distance to the river (m)
No vegetation Sparse vegetation
and thicket
Thicket Willow
bushes
Forest
Sp
ars
e
ve
ge
tati
on
Fig 4 Vegetation successional stages versus soil dynamism (Hm) in the restored area (0ndash65 mfrom the river)
4366
HESSD10 4337ndash4367 2013
Spatio-temporalheterogeneity of
riparian soilmorphology
B Fournier et al
Title Page
Abstract Introduction
Conclusions References
Tables Figures
J I
J I
Back Close
Full Screen Esc
Printer-friendly Version
Interactive Discussion
Discussion
Paper
|D
iscussionP
aper|
Discussion
Paper
|D
iscussionP
aper|
100
80
60
40
20
0
0-15 15-35 35-45 45-55 55-65
Group4
Group5
Group6
Group2
Group7
Group8
Group1
No
vegetation
Willow
bushes
Thicket ForestSparse
vegetation
+ Thicket
Fig 5 Vegetation successional stages versus frequency of soil profile groups in the restoredarea Soil groups are given according to their succession along the river lateral gradient Soilprofile group 3 was only observed in the control area
4367
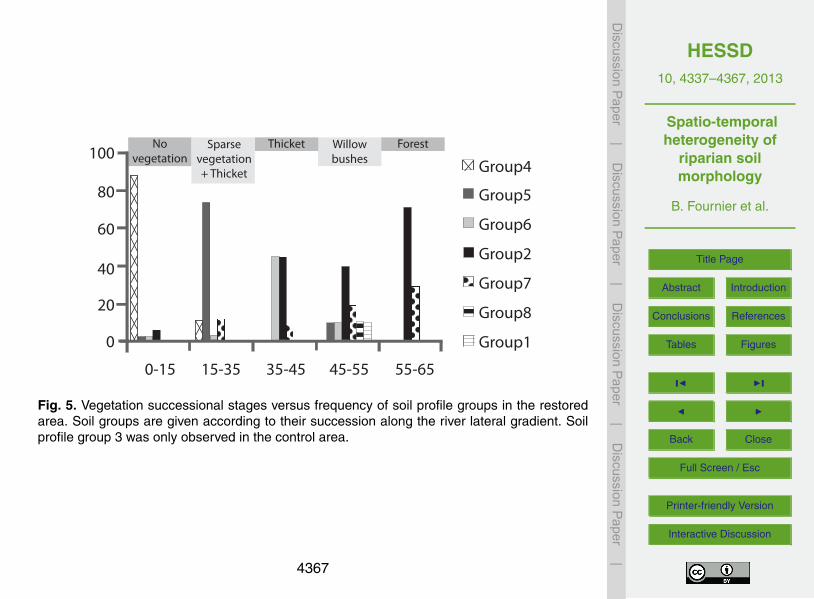
HESSD10 4337ndash4367 2013
Spatio-temporalheterogeneity of
riparian soilmorphology
B Fournier et al
Title Page
Abstract Introduction
Conclusions References
Tables Figures
J I
J I
Back Close
Full Screen Esc
Printer-friendly Version
Interactive Discussion
Discussion
Paper
|D
iscussionP
aper|
Discussion
Paper
|D
iscussionP
aper|
100
80
60
40
20
0
0-15 15-35 35-45 45-55 55-65
Group4
Group5
Group6
Group2
Group7
Group8
Group1
No
vegetation
Willow
bushes
Thicket ForestSparse
vegetation
+ Thicket
Fig 5 Vegetation successional stages versus frequency of soil profile groups in the restoredarea Soil groups are given according to their succession along the river lateral gradient Soilprofile group 3 was only observed in the control area
4367