spatio-temporal distribution of dissolved inorganic...
TRANSCRIPT

ARTICLE IN PRESS
0967-0645/$ - see
doi:10.1016/j.ds
�Correspondifax: 1 441 297 81
E-mail addre
Deep-Sea Research II 52 (2005) 3303–3323
www.elsevier.com/locate/dsr2
Spatio-temporal distribution of dissolved inorganic carbon andnet community production in the Chukchi and Beaufort Seas
Nicholas R. Batesa,�, Margaret H.P. Besta, Dennis A. Hansellb
aBermuda Biological Station For Research, Inc., 17 Biological Station Lane, Ferry Reach, BermudabRosenstiel School of Marine and Atmospheric Science, University of Miami, 4600 Rickenbacker Causeway, Miami, FL 33149, USA
Received 10 March 2004; accepted 10 September 2005
Abstract
As part of the 2002 Western Arctic Shelf–Basin Interactions (SBI) project, spatio-temporal variability of dissolved
inorganic carbon (DIC) was employed to determine rates of net community production (NCP) for the Chukchi and
western Beaufort Sea shelf and slope, and Canada Basin of the Arctic Ocean. Seasonal and spatial distributions of DIC
were characterized for all water masses (e.g., mixed layer, halocline waters, Atlantic layer, and deep Arctic Ocean) of the
Chukchi Sea region during field investigations in spring (5 May–15 June 2002) and summer (15 July–25 August 2002).
Between these periods, high rates of phytoplankton production resulted in large drawdown of inorganic nutrients and DIC
in the Polar Mixed Layer (PML) and in the shallow depths of the Upper Halocline Layer (UHL). The highest rates of NCP
(�1000–2850mgCm�2 d�1) occurred on the shelf in the Barrow Canyon region of the Chukchi Sea and east of Barrow in
the western Beaufort Sea. A total NCP rate of 8.9–17.8� 1012 g for the growing season was estimated for the eastern
Chukchi Sea shelf and slope region. Very low inorganic nutrient concentrations and low rates of NCP
(�o15–25mgCm�2 d�1) estimated for the mixed layer of the adjacent Arctic Ocean basin indicate that this area is
perennially oligotrophic.
r 2005 Elsevier Ltd. All rights reserved.
Keywords: Ocean carbon cycle; Productivity; Remineralization; Chukchi Sea; Arctic Ocean
1. Introduction
Arctic Ocean shelf seas are sites of majorbiological productivity. Northward flow of nutri-ent-rich Pacific Ocean waters through BeringStrait supports a brief but intense photosyntheticseason in the Chukchi Sea, with rates of primaryproduction at X300 gCm2 y�1 (e.g., Sambrottoet al., 1984; Springer and McRoy, 1993; Hansell
front matter r 2005 Elsevier Ltd. All rights reserved
r2.2005.10.005
ng author. Tel.: 1 441 236 5022;
43.
ss: [email protected] (N.R. Bates).
et al., 1993; Springer et al., 1996; Hill and Cota,2005). This production supports substantial benthic(e.g., Grebmeier et al., 2004) and pelagic biomass(e.g., Bates et al., 2005a, b; Ashjian et al., 2005)that, in turn, supports higher trophic levels (e.g.,fish, marine mammals, seabirds) and importanthuman socio-cultural activities. The Arctic Ocean,however, is particularly sensitive to global climatechange and potentially to ecosystem changesassociated with warming and sea-ice loss (e.g.,Walsh et al., 1990; Moritz and Perovich, 1996;Grebmeier and Whitledge, 1996; Manabe andStouffer, 2000).
.

ARTICLE IN PRESSN.R. Bates et al. / Deep-Sea Research II 52 (2005) 3303–33233304
Primary production in the Chukchi Sea andadjacent Arctic shelf seas are influenced by adynamic interplay of light, ice conditions, andcoastal inputs, although there are limited data onthe timing, extent and mechanistic controls ofproduction. It remains unclear how warming,enhanced stratification and thinning sea-ice in theArctic Ocean basin might affect productivity andecosystem dynamics of this region. For example,could productivity be enhanced in the Arctic Oceanbasin in response to the continued contraction ofpolar sea-ice extent and exposure of nutrient-ladensurface water to light? To date, only limitedmeasurements of in vitro primary productivity inthe Chukchi Sea have been collected. Furthermore,it is difficult to extrapolate these rate measurements,typically determined using dawn-to-dusk 14C in-cubations (Williams, 1993), both spatially andtemporally. An alternative approach involves ob-serving changes in the in situ water columninventories of the reactants and products (e.g.,dissolved oxygen, DO; inorganic nutrients; CO2,dissolved organic carbon, DOC; particulate organiccarbon, POC) of photosynthesis. Estimates of netcommunity production (NCP; sensu Williams, 1993)can be determined from changes in dissolvedinorganic carbon (DIC), thereby offering spatiallyand temporally integrative measures of productivity(e.g., Weiss et al., 1979; Codispoti et al., 1982, 1986;Karl et al., 1991; Chipman et al., 1993; Yager et al.,1995; Bates et al., 1998, 2005a; Lee, 2001; Lee et al.,2002).
As part of the Western Arctic Shelf–BasinInteractions (SBI) project, the timing, extent anddynamics of production were evaluated during twocruises to the Chukchi Sea region in 2002. In thisstudy, the spatio-temporal patterns of primaryproduction over the Chukchi and Beaufort Seashelves, the adjacent shelf slope and Canada Basinof the Arctic Ocean were determined from changesin the water-column distributions of DIC. Previousstudies measured only surface DIC (Murata andTakizawa, 2003) or calculated DIC from measure-ments of pH and alkalinity (Pipko et al., 2002). Inthis study, we estimate rates of NCP from DICinventory changes (corrected for ice-melt and air–sea CO2 gas exchange) and compare these with 14Cdata collected during the 2002 field activities (Hilland Cota, 2005) and earlier (Cota et al., 1996). Icealgae and phytoplankton are both significant con-tributors to primary production, with ice algaebeing quantitatively important early in the growing
season (Hill and Cota, 2005). Here, we determine ifthere was significant NCP early in the growingseason, since direct measurements suggest that icealgae contribute to 10% of total primary produc-tivity (Gradinger and Eicken, 2004). We alsoevaluate whether there were significant rates ofNCP in the surface layer of the Arctic Ocean basin,since Gosselin et al. (1997) observed relatively highrates of primary productivity and organic carbonproduction during the 1994 Arctic Ocean Study(AOS).
2. Materials and methods
Physical, biogeochemical and biological measure-ments were made from the USCGC Healy duringtwo cruises to the Chukchi and Beaufort Seas aspart of the 2002 field phase of the Western ArcticSBI project. During the spring cruise (5 May–15June 2002), 40 CTD/rosette stations were occupiedat the Bering Strait, over the Chukchi and BeaufortSea shelves, the shelf-slope region and into theArctic basin (Fig. 1). During the summer cruise (17July 26–August 2002), 45 stations were occupied inthe region. Three sections across the Chukchi andBeaufort Sea shelf, shelf-slope and Arctic Oceanbasin were repeated each cruise, including: (1) WestHanna Shoal (WHS); (2) East Hanna Shoal (EHS)transect, and; (3) Barrow Canyon (BC) transect. Inaddition, during summer field activities, a fourthsection East of Barrow (EB), and a sectionextending from the Alaskan side of the BeringStrait to the Diomede Islands also were taken. Ateach CTD/rosette station, a suite of biological andchemical measurements was collected, includingsalinity, inorganic nutrients (ammonium, nitrate,nitrite, phosphate, reactive silicon, and urea) DIC,dissolved oxygen and particulate organic matter(further details are given in Bates et al., 2005b).CTD, bottle and rate data are available at the SBIweb site, and archived at the National Snow and IceData Center (NSIDC; http://nsidc.org/). Seawatersamples for DIC were drawn from the Niskinsamplers into pre-cleaned �300-ml borosilicatebottles. DIC samples were subsequently poisonedwith HgCl2 to halt biological activity, sealed, andreturned to BBSR for analysis.
DIC samples were analyzed using a highly preciseand accurate (�0.025%; o0.5mmolkg�1), gas-ex-traction/coulometric-detection system (Bates et al.,1996, 1998; Bates, 2001). The analytical systemconsists of a Single-Operator Multi-parameter

ARTICLE IN PRESSN.R. Bates et al. / Deep-Sea Research II 52 (2005) 3303–3323 3305
Metabolic Analyzer (SOMMA) coupled to a CO2
coulometer (model 5011; UIC Coulometrics) andpersonal computer (Johnson et al., 1993). Routineanalyses of Certified Reference Materials (providedby A.G. Dickson, Scripps Institution of Oceanogra-phy) ensured that the accuracy of the DIC measure-ments was within 0.05% (�0.5mmol kg�1). TheSOMMA-coulometer system has been used atBBSR for 14 years to analyze DIC samples from
the Bermuda Atlantic Time-series Study (BATS) siteand to determine long-term trends in oceanic CO2
and air–sea CO2 exchange in the subtropical gyre ofthe North Atlantic Ocean (Bates et al., 2002). Thesalinity of each DIC sample also was directlymeasured during analysis using a SeaBird SBE-911conductivity sensor. The salinity data generatedfrom the DIC analyses were compared with discretesalinity measurements made onboard the USCGCHealy as part of the quality control and assuranceprotocols. However, discrete salinity data fromthe USCGC Healy (Codispoti et al., 2005) wereused here in data analysis and interpretation.Dissolved oxygen was determined by Winklertitration, while inorganic nutrients were determinedusing a nutrient auto-analyzer onboard the USCGCHealy (Codispoti et al., 2005).
The general circulation of the region is primarilydriven by northward flow of Pacific Ocean waterthrough Bering Strait into the Chukchi Sea shelfand exiting through outflows into the Arctic Oceanbasin (Fig. 1). At the Bering Strait, waters defined asAlaskan Coastal Current Water (eastern BeringStrait), Anadyr Current (central Bering Strait) andBering Shelf Water (western Bering Strait; Coach-man et al., 1975) were sampled during the summercruise (Codispoti et al., 2005). Several recent studiescharacterize the flow fields of the Chukchi Sea shelf(Pickart et al., 2005; Aagaard et al., 2005), includingtransport at Bering Strait (Woodgate and Aagaard,2005; Woodgate et al., 2005b), and outflowsthrough the Herald Valley (Woodgate et al.,2005a) and Barrow Canyon (Weingartner et al.,2005).
The upper several hundred meters of the ArcticOcean and adjacent seas such as the Chukchi andBeaufort Seas are strongly stratified (e.g., Kinney
Fig. 1. Location map: (A) CTD/rosette stations from the HLY
02-01 spring cruise to the Chukchi Sea (5 May–15 June 2002).
Three sections were sampled from Chukchi outer shelf into the
Arctic basin, included: (1) West Hanna Shoal (WHS); (2) East
Hanna Shoal (EHS) transect, and (3) Barrow Canyon (BC)
transect. (B) CTD/rosette stations from the HLY 02-03 summer
cruise to the Chukchi Sea (17 July 26–August 2002). Four
sections were sampled from Chukchi outer shelf into the Arctic
basin, included: (1) West Hanna Shoal (WHS); (2) East Hanna
Shoal (EHS) transect; (3) Barrow Canyon (BC) transect, and (4)
East of Barrow (EB). Northward transport of Pacific Ocean
water occurs through Bering Strait into the Chukchi Sea shelf.
The major offshore outflow occurring through Long Strait (to the
west onto the East Siberian shelf), Herald Valley and Barrow
Canyon into the Arctic Ocean Canada basin.

ARTICLE IN PRESS
F
a
D
c
d
H
d
a
N.R. Bates et al. / Deep-Sea Research II 52 (2005) 3303–33233306
et al., 1970; Aagaard et al., 1985; Jones andAnderson, 1986; Anderson et al., 1988; Aagaardand Carmack, 1994; Anderson et al., 1994a, b;Schlosser et al., 1995). Identifiable signatures intemperature and salinity (Aagaard et al., 1981), andnutrient/oxygen distributions and stoichiometry(Wallace et al., 1987; Salmon and McRoy, 1994;Jones et al., 1991) were used to identify principalwater masses in the study region (Codispoti et al.,2005). Water masses over the Chukchi and BeaufortSea shelves and Arctic Ocean included: (1) the PolarMixed Layer (PML; upper 0–50m, salinity typicallyo31); (2) the Upper Halocline Layer (UHL;�50–120m deep; core layer has salinity of 33.1,nitrate concentration of �1472 mmol kg�1, andphosphate concentration of �1.870.2 mmol kg�1);(3) Lower Halocline Layer (LHL; �150–220mdeep; core layer has salinity of 34.3, nitrateconcentration of �1271 mmol kg�1, and phosphateconcentration of �0.870.2 mmol kg�1); (4) AtlanticWater Layer water (AWL; 4250–800m deep, corelayer has salinity of 34.8–34.9, nitrate concentrationof �1471 mmol kg�1, and phosphate concentrationof �1.070.1 mmol kg�1), and; (5) Arctic OceanDeep Water (AODW; 4800m deep, core layerhas salinity of 34.95, nitrate concentration of�1571 mmol kg�1).
3. Results and discussion
3.1. Spatio-temporal distributions of DIC
PML and UHL waters were present on theChukchi and Beaufort Sea shelves during bothcruises (see Bates et al., 2005b; Codispoti et al., 2005for details). Water masses of the PML, halocline,Atlantic Water and AODW were sampled at theshelf-slope and Arctic Ocean basin stations (i.e.,WHS, EHS, BC, EB). Each water mass haddistinctive hydrographic (i.e., salinity, temperature),biogeochemical (e.g., nitrate, phosphate, dissolvedoxygen) and DIC properties.
ig. 2. Hydrographic and dissolved inorganic carbon (DIC) properties ob
nd dissolved oxygen (DO) are mmol kg�1. (A) DIC versus salinity on the
IC versus nitrate on the spring cruise. (D) DIC versus nitrate on the
ruise. (F) DIC versus dissolved oxygen on the summer cruise. Closed ci
ata. Cross (red) symbols denote all Upper Halocline Layer (UHL) da
alocline Layer (LHL). Closed diamond (yellow) symbols denote waters
enote waters of the Arctic Ocean Deep Water (AODW). Magenta squa
nd F, several low DIC values ranging from 4500 to 1700mmol kg�1 o
3.1.1. Springtime observations
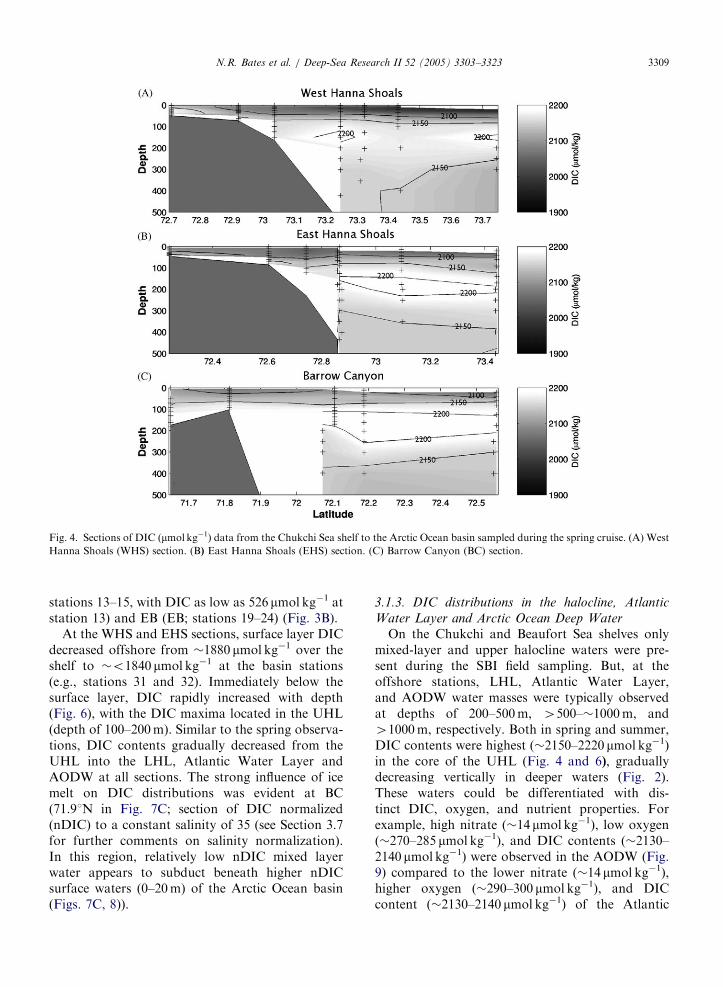
Most of the Chukchi Sea shelf and slope-basinregion was heavily ice covered during the springcruise. In the PML (depths of 0 to �30–50m),temperatures ranged from ��1.5 to �1.8 1C (seeBates et al., 2005b; their Fig. 3) and salinities rangedfrom �29 to �32 (Fig. 2A). Nitrate contents werevariable (�0–�8 mmol kg�1; Fig. 2C) as weredissolved oxygen (�300–400 mmol kg�1; Fig. 2E)and DIC contents (�o2000–2236 mmol kg�1; Fig.2A,C,E). At the surface (0–5m depth), DICconcentrations increased northward by �100 mmolkg�1 from the Bering Strait (�2127 mmol kg�1 atstation 0; �55 km S of Bering Strait; Fig. 3A) to thecentral Chukchi Sea shelf (�2236 mmol kg�1 atstation 3). Over the slope-basin region, DICcontents decreased to o2000 mmol kg�1 in theArctic Ocean basin surface layer (low nitrate ofo0.2 mmol kg�1) observed at the northernmoststations (Fig. 3A). Over the shelf-slope regions,DIC contents were higher in the vicinity of BCand East of Barrow (EB). Below the surface layer,DIC contents increased vertically, with maxima(�2150–2220 mmol kg�1) in the saline (�33;Fig. 2A), high nitrate (�10–15 mmol kg�1; Fig. 2C)core of the UHL (Fig. 4A). At greater depths, DICcontents decreased gradually from the LHL tothe Atlantic Water Layer and AODW(�2130–2150 mmol kg�1).
3.1.2. Summertime observations
Approximately 6 weeks later, most of theChukchi Sea shelf was ice-free. However significantsea-ice (430–80%) remained in the shelf-slope andbasin regions of the Chukchi and Beaufort Seashelves. Surface layer temperatures were warmer(��1.5 to +7 1C; see Bates et al., 2005a, b; theirFig. 3) and ice melt had contributed to a fresheningof the mixed layer (Fig. 2B). Nitrate contents werelow (generally �o0.2 mmol kg�1 in the mixed layeracross the region; Fig. 2D), and dissolved oxygenhad increased (�300–4500 mmol kg�1; Fig. 2F)compared to springtime.
served in the Chukchi and Beaufort Seas. Units for DIC, nitrate
spring cruise. (B) DIC versus salinity on the summer cruise. (C)
summer cruise. (E) DIC versus dissolved oxygen on the spring
rcle (green) symbols denote all Polar Mixed Layer (PML) water
ta. Closed diamond (blue) symbols denote waters of the Lower
of the Atlantic Layer (AWL). Closed diamond (orange) symbols
re symbols denote data observed at Bering Strait. In Figs. 2B, D
bserved in the upper 3m are not shown.

ARTICLE IN PRESSN.R. Bates et al. / Deep-Sea Research II 52 (2005) 3303–3323 3307

ARTICLE IN PRESS
Fig. 3. Surface layer DIC (mmol kg�1) distributions in the Chukchi Sea. (A) Spring cruise, and (B) summer cruise.
N.R. Bates et al. / Deep-Sea Research II 52 (2005) 3303–33233308
At Bering Strait, surface and halocline DIC val-ues ranged from �1900 to 2050 mmol kg�1 (Fig. 5).In the westernmost stations (closest to LittleDiomede Island; i.e., stations 2–5) low DIC valueswere observed in waters hydrographically charac-terized as Anadyr Water and Bering Shelf Water. Atthe easternmost station (station 1), DIC values weremuch higher in relatively warm, fresh watershydrographically characterized as Alaskan Coastal
Current Water (Codispoti et al., 2005; Woodgate etal., 2005b; Woodgate and Aagaard, 2005).
Elsewhere on the Chukchi and Beaufort Seashelves, surface DIC distributions were highlyvariable (�o600–2150 mmol kg�1; Fig. 2B,D,F),with typically lower values compared to springtime.In the upper 5m, ice-melt significantly diluted DICcontent in the eastern Chukchi Sea shelf (stations7–12) and in the shelf-slope regions at the BC (BC;
ARTICLE IN PRESS
Fig. 4. Sections of DIC (mmol kg�1) data from the Chukchi Sea shelf to the Arctic Ocean basin sampled during the spring cruise. (A) West
Hanna Shoals (WHS) section. (B) East Hanna Shoals (EHS) section. (C) Barrow Canyon (BC) section.
N.R. Bates et al. / Deep-Sea Research II 52 (2005) 3303–3323 3309
stations 13–15, with DIC as low as 526 mmol kg�1 atstation 13) and EB (EB; stations 19–24) (Fig. 3B).
At the WHS and EHS sections, surface layer DICdecreased offshore from �1880 mmol kg�1 over theshelf to �o1840 mmol kg�1 at the basin stations(e.g., stations 31 and 32). Immediately below thesurface layer, DIC rapidly increased with depth(Fig. 6), with the DIC maxima located in the UHL(depth of 100–200m). Similar to the spring observa-tions, DIC contents gradually decreased from theUHL into the LHL, Atlantic Water Layer andAODW at all sections. The strong influence of icemelt on DIC distributions was evident at BC(71.91N in Fig. 7C; section of DIC normalized(nDIC) to a constant salinity of 35 (see Section 3.7for further comments on salinity normalization).In this region, relatively low nDIC mixed layerwater appears to subduct beneath higher nDICsurface waters (0–20m) of the Arctic Ocean basin(Figs. 7C, 8)).
3.1.3. DIC distributions in the halocline, Atlantic
Water Layer and Arctic Ocean Deep Water
On the Chukchi and Beaufort Sea shelves onlymixed-layer and upper halocline waters were pre-sent during the SBI field sampling. But, at theoffshore stations, LHL, Atlantic Water Layer,and AODW water masses were typically observedat depths of 200–500m, 4500–�1000m, and41000m, respectively. Both in spring and summer,DIC contents were highest (�2150–2220 mmol kg�1)in the core of the UHL (Fig. 4 and 6), graduallydecreasing vertically in deeper waters (Fig. 2).These waters could be differentiated with dis-tinct DIC, oxygen, and nutrient properties. Forexample, high nitrate (�14 mmol kg�1), low oxygen(�270–285 mmol kg�1), and DIC contents (�2130–2140 mmol kg�1) were observed in the AODW (Fig.9) compared to the lower nitrate (�14 mmol kg�1),higher oxygen (�290–300 mmol kg�1), and DICcontent (�2130–2140 mmol kg�1) of the Atlantic

ARTICLE IN PRESS
Fig. 5. Sections of DIC and nDIC (mmol kg�1) at Bering Strait sampled during the summer cruise. (A) DIC section. From west to east, the
stations were 2–5, and 1. (B) nDIC section (see Section 3.7 for further comments on salinity normalization).
N.R. Bates et al. / Deep-Sea Research II 52 (2005) 3303–33233310
Water Layer. Although, no significant differencesin nDIC or nitrate were observed between springand summer, dissolved oxygen contents ofthe Atlantic Water Layer and AODW were�10 mmol kg�1 lower. In halocline waters, nDICcontents had a generally smaller range in the UHL(�2300–2340 mmol kg�1) compared to the LHL(�2150–2340 mmol kg�1) (Fig. 10).
3.2. Estimates of NCP from spatio-temporal changes
in DIC distributions
During the 2002 SBI field program, high rates ofprimary productivity were measured on the Chuk-chi Sea shelf in summer (Hill and Cota, 2005),particularly in the vicinity of the shelf-slope regionsof the BC and EB. This production manifested itselfas drawdown in inorganic nutrients and DIC, aswell as production of dissolved oxygen andsuspended POM. Portions of the POM producedon the shelf were exported vertically to the sea floor(Moran et al., 2005) or offshore to the UHL (Bateset al., 2005b).
DIC concentrations are influenced by a variety ofphysical and biogeochemical factors. The factors ofmost importance in the Chukchi Sea shelf regionwere: (1) NCP and ice-melt (both decreasing DIC),and; (2) air–sea CO2 gas exchange and reminerali-zation of organic matter (both increasing DIC).
Between the spring and summer occupations, largedecreases (4100–300 mmol kg�1) of DIC were ob-served in the entire water column (0–�50m, bothPML and UHL) at the shelf stations and in theupper 50–70m of the PML and UHL at the slopeand basin stations. A large component of thisdecrease was due to dilution by ice melt (and minorcontributions from local precipitation and evapora-tion), although largely restricted to the surface (e.g.,0–5m) layer. The contribution of ice-melt to DICchanges can be estimated by normalizing DIC to aconstant salinity of 35. This correction assumesthat: (1) ice-melt contributed negligible amounts ofDIC (i.e., 0 mmol kg�1) to the mixed layer, and; (2)an absence of mixing with new water mass sources.Therefore, changes in the spatio-temporal distribu-tions of nDIC reflect the influence of other factorssuch as NCP and air–sea CO2 gas exchange ratherthan ice-melt and other potential contributors(discussed later in caveat and qualifiers section).
The map (Fig. 8A) of springtime nDIC showsrelatively high nDIC in the PML of the Chukchishelf and slope regions (�2340 mmol kg�1) withslightly lower values southward at Bering Strait(2260 mmol kg�1). Six weeks later, large decreases innDIC were observed over much of the NE ChukchiSea shelf near BC and eastward on the Beaufort Seashelf at the EB section (Fig. 8B). In the watercolumn, summertime drawdown of DIC (and

ARTICLE IN PRESS
Fig. 6. Sections of DIC (mmol kg�1) data from the Chukchi and Beaufort Sea shelves to the Arctic basin sampled during the summer
cruise. (A) West Hanna Shoals (WHS) section. (B) East Hanna Shoals (EHS) section. (C) Barrow Canyon (BC) section. (D) East of
Barrow (EB) section.
N.R. Bates et al. / Deep-Sea Research II 52 (2005) 3303–3323 3311
nitrate depletion and oxygen production) wasevident in the PML and UHL (Fig. 9). Previousstudies have shown similar seasonal drawdown ofsurface DIC and seawater pCO2 in the vicinity ofBC (Pipko et al., 2002; Murata and Takizawa,2003). The drawdown of DIC can be clearlyidentified in property–property plots of nDICversus salinity, nitrate, and dissolved oxygen (Fig.10). In the PML, the largest depletion of nDIC (upto �200 mmol kg�1), relative to spring conditions,occurred in the salinity range of 27–33 (Fig. 10B)
and was accompanied by nitrate drawdown (Fig.10D) and dissolved oxygen production (Fig. 10F).The largest drawdown of nDIC (and DIC) occurredin the BC and EB region (Figs. 8 and 10).
A more complicated pattern was observed in theUHL (Fig. 11). In the shallower depths of the UHL(�50–�100m deep), a modest depletion of DIC (upto �50 mmol kg�1; Fig. 11B) was observed (accom-panied by a dissolved oxygen increase of similarmagnitude; Fig. 11F). However, this feature wasgeographically restricted to the BC and EB region,

ARTICLE IN PRESS
Fig. 7. Sections of nDIC (mmol kg�1) data from the Chukchi and Beaufort Sea shelves to the Arctic basin sampled during the summer
cruise. (A) West Hanna Shoals (WHS) section. (B) East Hanna Shoals (EHS) section. (C) Barrow Canyon (BC) section. (D) East of Point
Barrow (EB) section.
N.R. Bates et al. / Deep-Sea Research II 52 (2005) 3303–33233312
and not observed to the west at the WHS and EHSsections. The core of UHL (at deeper depths of�100–200m) remained relatively unchanged (exceptfor a remineralization signal in DIC at a few depthsobserved during summer).
3.3. Chukchi Sea shelf and slope productivity
estimates
The drawdown of DIC in the PML and shallowerdepths of the UHL can be attributed to primary
production (caveats and qualifiers are discussedbelow). Estimates of NCP were determined fromchanges in the inventory of DIC over time (i.e.,between spring and summer). At each station, therate of NCP over time (t) was determined as follows:
NCP ¼ ðspringnDICð0�30 mÞ�summernDICð0�30 mÞÞ=t.
(1)
The rate of NCP was expressed as mg Cm�2d�1, withan error of �24–40mgCm�2d�1 due to imprecision

ARTICLE IN PRESS
Fig. 8. Surface layer nDIC (mmol kg�1) distributions and rates of net community production (NCP) in the Chukchi Sea (italicized bold
values). (A) Spring cruise and (B) summer cruise. NCP rates were determined at each station. Total NCP was estimated for the region of
the Chukchi and Beaufort Sea shelves enclosed within the dashed area.
N.R. Bates et al. / Deep-Sea Research II 52 (2005) 3303–3323 3313
and inaccuracy of �1mmol kg�1 associated with DICanalyses. nDIC data were used rather than DIC datain order to eliminate changes imparted by ice melt(and local precipitation and evaporation). At eachstation, rates of NCP were computed from nDICdata integrated over 0–30m depth. During the 2002SBI field season, the 1% light level was typicallyshallower than 30m, and productivity was typicallyconfined to the 0–30m layer (Hill and Cota, 2005).
In the springtime condition, mixed-layer DICconcentrations were uniform across much of theChukchi Sea shelf. Over most of the Chukchi Seashelf, slope and adjacent basin, the average nDIC inthe 0–30m layer was 235774 mmol kg�1 during thespring (stations 24, 27, 29–34). The spring nDICvalue was then used to determine the subsequentnDIC changes and rates of NCP observed for thespring to summer period (�44–74 d; Table 1). The

ARTICLE IN PRESS
Fig. 9. Hydrographic and dissolved inorganic carbon (DIC) properties of the surface mixed layer (PML) and the UHL observed in the Chukchi
and Beaufort Seas. UHL data are shown for context. Units for DIC, nitrate and DO are mmolkg�1. (A) DIC versus salinity on the spring cruise. (B)
DIC versus salinity on the summer cruise. (C) DIC versus nitrate on the spring cruise. (D) DIC versus nitrate the summer cruise. (E) DIC versus
dissolved oxygen on the spring cruise (F) DIC versus dissolved oxygen on the summer cruise. Open circle (green) symbols denote West Hanna
Shoals (WHS) section data. Closed circle (green) symbols denote East Hanna Shoals (EHS) section data. Magenta circle symbols denote Barrow
Canyon (BC) section data. Purple circle symbols denote East of Barrow (EB) section data. Cross (red) symbols denote Upper Halocline Layer data.
N.R. Bates et al. / Deep-Sea Research II 52 (2005) 3303–33233314

ARTICLE IN PRESSN.R. Bates et al. / Deep-Sea Research II 52 (2005) 3303–3323 3315
NCP rate calculated for each station (Table 1)estimates the total spring to summer productivitysignature imparted on the water mass advected toand present at each station by summertime.
Rates of NCP integrated over the top 30mdetermined for the spring–summer period werehighly variable, ranging from low values of 2mgCm�2 d�1 over the basin to 42800mgC m�2 d�1
over the shelf (Fig. 8). The highest NCP rates(�1000–2800mgCm2d�1) were estimated for theshelf region of BC and EB; with slightly lowervalues (�300–600mgCm�2 d�1) in the slope re-gions. Lower values (�54–467mgCm�2 d�1) ofNCP were observed at shelf and slope station inthe vicinity of WHS and EHS. The highest NCPrates were geographically located in the BC/EBregion of large nitrate depletion, and POM produc-tion and export (Bates et al., 2005b; Moran et al.,2005). Previous measurements of 14C based pro-ductivity on the Chukchi Sea shelf and slope werealso highly variable, ranging from �340 to2570mgCm�2 d�1 (Hameedi, 1978; Cota et al.,1996; Wheeler et al., 1996; Gosselin et al., 1997;Chen et al., 2002; Table 2). During the SBI fieldprogram, relatively low rates of primary productiv-ity were measured during the summer field samplingin shelf (�340mgCm2d�1) and slope locations(�404mgCm�2 d�1; Hill and Cota, 2005). At thattime, phytoplankton productivity was probablynutrient-limited, since nitrate and phosphate con-centrations across the entire Chukchi shelf andslope regions were at or below detection (e.g., NO3
concentrations o0.2 mmol kg�1).Assuming that the growing season of the Chukchi
Sea shelf is approximately 120 d, 14C-based pro-ductivity measurements (Hill and Cota, 2005) canbe extrapolated to give an annual productivity of�35–50 gCm�2 yr�1. However, the 14C-based pro-ductivity measurements probably missed the bulk ofthe productivity occurring between the spring (June)and summer (July–August) cruise. NCP rates,estimated from inventory changes of nDIC, yieldedconsiderably higher annual productivity estimatesof �120–240 gCm�2 d�1 (Table 3).
3.4. Areal rate of NCP observed on the Northeast
Chukchi Sea shelf
In determining an areal estimate of productivity,annual rates of NCP were determined for thenortheast sector of the Chukchi Sea shelf (Fig. 8).Within the area shown in Fig. 8 (assuming that all
the mixed-layer water masses present in this areawere located within the Chukchi Sea shelf duringthe spring cruise), the average NCP is 1064mgCm2d�1 (Table 1). In this area of 13.9� 104 km2, thetotal rate of NCP for the spring to summer period(60 d) was estimated at 8.9� 1012 gC (Table 4). If agrowing season of 120 d is assumed, the total rate ofNCP for this region was estimated at 18� 1012 gC(Table 4).
NCP rates were not determined outside thenortheast sector of the Chukchi Sea shelf due tothe potential for lateral transport of surface waterswith different springtime DIC properties. Thedominant pathway of circulation transports shelfwater northward from Bering Strait across theChukchi Sea shelf, with the major offshore outflowoccurring through Long Strait (to the west onto theEast Siberian shelf), Herald Valley and BarrowCanyon (Woodgate et al., 2005a,b). Flow rates atBering Strait were highly variable with the strongestnorthward flow in the Alaskan Coastal Current (upto 100 cm s�1). However, across the Chukchi Seashelf region, typical flow rates vary from �2 to10 cm s�1, with a mean of 5 cm s�1 in the centralChukchi (Woodgate et al., 2005a). Annual meanvelocities suggest a transit time of �4 months fromBering Strait to the heads of Herald Valley and BC(Woodgate et al., 2005a), with a shorter transit timeof 3 months during the summer (Weingartner et al.,2005). Other studies suggest it takes �6 months forwater at Bering Strait to transit to the shelf breakoutflow at BC (Aagaard et al., 2005). Since thechange in DIC used to estimate NCP occurs over aperiod of 44–74 d, the influence of water massesflowing through Bering Strait would likely haveinfluenced the southern part of the Chukchi Seashelf up to the central Channel (Fig. 1). Given theresidence time of waters on the Chukchi Sea shelf(�90–180 d), during the time-frame of the 2002 SBIcruises, we assume that lateral transport of waters atBering Strait had minimal impact on the north-eastern sector of the Chukchi Sea shelf during thetime-frame of the 2002 SBI cruises. As shown by theDIC properties observed at Bering Strait, the flowof Anadyr/Bering Shelf Water from Bering Straitwould have contributed low-nDIC waters to theChukchi Sea shelf. In contrast, flow of the AlaskanCoastal Current would have contributed high-nDICwater to the Chukchi Sea shelf (Fig. 5). Most ofthe stations in the southern sector of the ChukchiSea shelf appear to be located in regions wherethe influence of the Alaskan Coastal Current

ARTICLE IN PRESSN.R. Bates et al. / Deep-Sea Research II 52 (2005) 3303–33233316

ARTICLE IN PRESSN.R. Bates et al. / Deep-Sea Research II 52 (2005) 3303–3323 3317
dominates. The inflow of high nDIC water makesestimates of NCP difficult in the southern sector ofthe Chukchi Sea shelf. The lack of sufficient stationssampled in spring and summer in the western partsof the Chukchi Sea shelf makes NCP estimates notpossible in that region.
3.5. Adjacent Canada Basin productivity estimates
Early studies suggested that the Arctic Oceanbasin is perennially oligotrophic with very low levelsof productivity (i.e., �5mgCm�2 d�1; English,1961). More recent studies have reported higherlevels of productivity (�45–123mgCm�2 d�1; Cotaet al., 1996; Wheeler et al., 1996; Gosselin et al.,1997; Chen et al., 2002). Estimates of annualproductivity in the central Arctic Ocean basin rangefrom low values (�0.6–1.3 gCm�2 yr�1, Andersonet al., 2003; 1.8 gCm�2 yr�1, English, 1961;3.6 gCm�2 yr�1, Moran et al., 1997) to relativelyhigh values (15 gCm�2 yr�1; Gosselin et al., 1997).At the Arctic Ocean basin stations adjacent to theChukchi Sea shelf, very low nitrate and phosphateconcentrations were observed during spring andsummer of 2002. Estimates of NCP from nDICinventory changes between the spring and summercruises (�19–54730mgCm�2 d�1; Table 1) were atthe lower range of previous productivity estimates,and much lower compared to the slope and shelfregions of the adjacent Chukchi and Beaufort Seashelves. If a growing season of 120 d is assumed, thetotal rate of NCP estimated at the Arctic Oceanbasin stations was estimated at 2.2–6.5 gCm�2 yr�1.
The rates of productivity determined in thisstudy indicates that the Arctic Ocean basin adjacentto the Chukchi Sea has an active carbon andnitrogen cycle, but the region appears perenniallyoligotrophic with rates of productivity two ordersof magnitude lower than the North Pacific(mean of 172 gCm�2 yr�1; Karl et al., 2001) andNorth Atlantic subtropical gyres (mean of154 gCm�2 yr�1; Steinberg et al., 2001). Our
Fig. 10. Hydrographic and salinity normalized dissolved inorganic car
Halocline Layer observed in the Chukchi and Beaufort Seas. UHL d
mmol kg�1. (A) nDIC versus salinity on the spring cruise. (B) nDIC ver
spring cruise. (D) nDIC versus nitrate on the summer cruise. (E) nDIC
dissolved oxygen on the summer cruise. Open circle (green) symbols den
symbols denote East Hanna Shoals (EHS) section data. Magenta circle
symbols denote East of Point Barrow (EB) section data. Cross (red)
dashed regions indicate the approximate range of springtime property–
spring range are shown and attributed to net community production (P
estimates of NCP calculated from nDIC inventorychanges at the periphery of the Canada basinsuggest rates of productivity closer to the low valuesof English (1961), Moran et al. (1997) and Andersonet al. (2003), rather than the higher estimates ofGosselin et al. (1997) and Pomeroy (1997).
3.6. Early growing season productivity estimates
It is difficult to quantify rates of NCP on theChukchi and Beaufort Sea shelves prior to thespring cruise due to the lack of winter DIC data. Inthe spring, DIC (nDIC) concentrations in the PMLwere fairly uniform across much of the shelf, slopeand basin (Fig. 8). However, nDIC concentrationswere somewhat lower at the Bering Strait and innerChukchi Sea shelf (where ice conditions were lessthan 70–80% ice cover), perhaps indicative of earlyseason productivity. However, these waters werenitrate-rich (�10–15 mmol kg�1), and the relativelylow nDIC values may simply represent the DIC-salinity properties of Anadyr Current and AlaskanCoastal Current waters (perhaps modified by earlyseason productivity in the Bering Sea) flowingnorthward from the Bering Sea into the ChukchiSea.
Elsewhere in the Chukchi and Beaufort Sea shelf,slope and adjacent basin, there was no geochemicalevidence for significant early season productivity(either as DIC drawdown or elevated DO concen-trations). Walsh et al. (2005), using a coupled bio-physical model analysis of the Chukchi Sea, alsohave suggested that productivity was low(�5mgCm�2 d�1) in the early season (April–May)prior to the spring cruise. It was not possible todetermine the potential contribution of ice algaeproductivity to net productivity during the spring(June) to summer (August) period. Gradinger andEicken (2004) found significant ice algae productiv-ity at a couple of first year ice stations during theheavy sea-ice conditions of the spring cruise.However, this productivity did not appear to
bon (nDIC) properties of the Polar Mixed Layer and the Upper
ata are shown for context. Units for nDIC, nitrate and DO are
sus salinity on the summer cruise. (C) nDIC versus nitrate on the
versus dissolved oxygen on the spring cruise. (F) nDIC versus
ote West Hanna Shoals (WHS) section data. Closed circle (green)
symbols denote Barrow Canyon (BC) section data. Purple circle
symbols denote Upper Halocline Layer (UHL) water data. The
property distributions. In the summer plots, deviations from the
). nDIC is DIC normalized to a salinity of 35.

ARTICLE IN PRESSN.R. Bates et al. / Deep-Sea Research II 52 (2005) 3303–33233318

ARTICLE IN PRESSN.R. Bates et al. / Deep-Sea Research II 52 (2005) 3303–3323 3319
modify the PML present over much of the shelf,slope and basin during the spring cruise (Fig. 8).
3.7. Caveats and qualifiers for productivity estimates
The carbon mass balance approach employedhere to estimate the rate of NCP does not accountfor contributions from air–sea CO2 gas exchangeand vertical diffusion. Although both processesadded CO2 to the mixed layer, the contributions tomixed layer nDIC inventory changes were minor.
For example, previous studies have indicated thatthe Chukchi Sea shelf is undersaturated with respect toCO2 and that the region is a small sink of atmosphericCO2 during ice-free periods (Pipko et al., 2002; Walshet al., 2005). Typical air to sea CO2 flux rates of�5–10mmol CO2 m
�2 d�1 have been observed duringthe spring to summer period (Walsh and Dieterle,1994; Pipko et al., 2002; Wang et al., 2003; Murataand Takizawa, 2003). In the Chukchi Sea shelf region,these CO2 flux rates add �5–10mmolkg�1 to the DICinventory of the 0–30m layer for the spring to summerperiod. Accounting for CO2 gas exchange would add�50–100mgCm2d�1 to the NCP rates reported inTable 2. However, this contribution is likely to besmaller since the shelf was not 100% ice-free for all ofthe spring to summer period (see Bates et al., 2005b;their Fig. 2).
Surface waters at the slope and Arctic Oceanbasin stations were undersaturated with respect toCO2 (i.e., a potential ocean sink for atmosphericCO2) and air-to-sea CO2 flux also might signifi-cantly affect the NCP rate estimates (Table 2). Eventhough significant ice cover remained in the slopestations by summer (430–70%), accounting for gasexchange would add �25–50mgCm�2 d�1 to theNCP estimates. At the Arctic Ocean basin stations,determining the contribution of gas exchange isdifficult since the region is almost perennially icecovered. If a 90% ice cover is assumed, gasexchange might contribute �5–10mgCm�2 d�1 tothe low NCP rate estimates (�15730mgCm2 d�1).
Fig. 11. Hydrographic and nDIC properties of the Upper Halocline La
Seas. The other water masses, PML and LHL, are shown for context. U
salinity on the spring cruise. (B) nDIC versus salinity on the summer cru
nitrate on the summer cruise. (E) nDIC versus dissolved oxygen on the
cruise. Open pluses (red) symbols denote West Hanna Shoals (WHS) se
(EHS) section data. Magenta plus symbols denote Barrow Canyon (BC
(EB) section data. Open circle (green) symbols denote all mixed layer w
the Lower Halocline Layer (LHL), Atlantic Layer (AWL) and Arctic
approximate range of springtime property–property distributions. In th
attributed to net community production (P) and remineralization (R).
Vertical diffusion of CO2 across the base of themixed layer would have contributed minor amounts(o1–2 mmol kg�1) of CO2 to the DIC pool in theupper 30m between the spring and summer cruisesat the shelf and slope stations. Vertical diffusivityflux of CO2 was computed as the product ofthe vertical diffusion coefficient, Kv, the verticalgradient of inorganic carbon (dDIC=dz) below themixed layer (i.e., vertical gradient in DIC from30–50m), and the seawater density (Denman andGargett, 1983). Although Kv is highly variable(0.2–80 cm2 s�1; Denman and Gargett, 1983), anaverage Kv of 30 cm2 s�1 increased mixed layer(0–30m) DIC by�2.2 mmol kg�1 over a 45-d period.Thus, accounting for vertical diffusion of CO2 intothe mixed layer would add �10–20mgCm2d�1 tothe NCP rates reported in Table 1.
At the Arctic Ocean basin stations, verticaldiffusion of CO2 across the base of the mixed layerwould have contributed much less CO2 to the mixedlayer compared to the shelf and slope stations.Vertical diffusivity estimates for the Arctic Oceanbasin are very low (�0.1–0.7 cm2 s�1; Wallace et al.,1987; D’Asaro and Morison, 1992; Rudels et al.,1996). Accounting for vertical diffusion of CO2 intothe mixed layer would add �0.3–1mgCm2d�1 tothe NCP rates reported in Table 1.
Here, DIC data normalized to a salinity of 35(i.e., nDIC) was used in the NCP calculation. If, forexample, DIC data had been normalized to asalinity of 33.1 (i.e., salinity of the core UHL),similar rates of NCP are calculated with a meandifference of 19mgCm2d�1, within the error of thecalculation. These estimates of NCP also do notinclude DIC depletion due to productivity in theshallow depths of the UHL. By summer, a depletionof DIC in the shallow layer of the UHL wasobserved at the BC and EB sections (Fig. 11B),although it occurred at depths deeper than the 1%light level. The DIC feature most likely results fromtransfer of the productivity signal from mixed layerto upper halocline through vertical mixing and
yer and other water masses observed in the Chukchi and Beaufort
nits for nDIC, nitrate and DO are mmol kg�1. (A) nDIC versus
ise. (C) nDIC versus nitrate on the spring cruise. (D) nDIC versus
spring cruise. (F) nDIC versus dissolved oxygen on the summer
ction data. Closed plus (red) symbols denote East Hanna Shoals
) section data. Purple plus symbols denote East of Point Barrow
ater (PML) data. Open diamond (blue) symbols denote waters of
Ocean Deep Water (AODW). The dashed regions indicate the
e summer plots, deviations from the spring range are shown and
nDIC is DIC normalized to a salinity of 35.

ARTICLE IN PRESS
Table 1
Mean nDIC contents for 0–30m surface layer during the summer HLY 02-03 cruise (17 July 26–August 2002)
Station Location Date Mean nDIC (mmol kg�1) DnDIC Days NCP (mgCm2d�1)
Barrow Canyon
8 Shelf 20 July 2002 2264 94 44 850740
10 Shelf 21 July 2002 2185 172 45 1529739
11 Shelf 21 July 2002 2257 101 45 896739
12 Shelf 21 July 2002 2241 116 45 1033739
13 Slope 22 July 2002 2166 192 46 1668738
14 Slope 23 July 2002 2119 239 47 2031737
15 Slope 24 July 2002 2276 82 48 680737
16 Slope/Basin 26 July 2002 2316 41 50 326735
17 Basin 28 July 2002 2355 2 52 15734
East of Barrow
18 Slope/Basin 29 July 2002 2311 46 53 349733
19 Slope 31 July 2002 2299 58 55 424732
20 Slope 01 Aug 2002 2120 237 56 1691731
21 Slope 02 Aug 2002 2182 175 57 1227730
22 Slope 03 Aug 2002 2236 122 58 836730
23 Shelf 04 Aug 2002 1937 420 59 2850729
24 Shelf 04 Aug 2002 2264 94 59 624729
East Hanna Shoals
25 Shelf 06 Aug 2002 2198 159 61 1045729
26 Shelf 06 Aug 2002 2323 34 61 225729
27 Slope 07 Aug 2002 2349 8 62 54728
28 Slope 08 Aug 2002 2332 25 63 161728
29 Slope 09 Aug 2002 2339 18 64 114728
30 Slope/Basin 10 Aug 2002 2325 32 65 199727
31 Basin 11 Aug 2002 2336 21 66 129727
West Hanna Shoals
32 Basin 13 Aug 2002 2354 3 68 19726
33 Slope 14 Aug 2002 2335 22 69 129725
34 Slope 15 Aug 2002 2347 10 70 59725
35 Slope 16 Aug 2002 2325 34 71 182725
37 Slope 17 Aug 2002 2330 27 72 151724
38 Shelf 17 Aug 2002 2292 65 72 362724
39 Shelf 18 Aug 2002 2272 85 73 467724
Herald Valley
43 Shelf 19 Aug 2002 2356 1 74 7724
Average (Stations 8–24; region of Barrow Canyon and East of Barrow Canyon) 1065
NCP rates (mgCm2 d�1) integrated over the upper 30m were estimated for each station using the DIC change (compared to the average
spring nDIC of 2357.3) observed since springtime. The error estimates for NCP were calculated with the standard deviation of the spring
nDIC contents. Station 17 is the station furthest offshore. For stations along the East of Barrow (EB) section (stations 18–24), it is
assumed that these waters originated west of Point Barrow either from the Chukchi Sea shelf or in the basin. Geostrophic flow along the
shelf and shelf break was from west to east (Pickart et al., 2005). The salinity to which the DIC data was normalized did not significantly
alter the NCP estimates. If a salinity of 33 was used to normalize DIC data, estimated rates of NCP had a mean difference of 19mg
Cm2d�1, within the error estimated below.
N.R. Bates et al. / Deep-Sea Research II 52 (2005) 3303–33233320
diffusion processes, and the subsequent lateraltransport of UHL from the shelf offshore into thebasin.
4. Conclusions
As part of the 2002 SBI project, spatio-temporalvariability of DIC and rates of net community
production (NCP) were determined for the Chukchiand western Beaufort Sea shelf and slope region,and adjacent Arctic Ocean basin. Between spring(5 May–15 June 2002) and summer (15 July 2–5August 2002), high rates of phytoplankton produc-tion resulted in large drawdown of inorganicnutrients and DIC in the PML and in the shallowdepths of the Upper Halocline Layer. The highest

ARTICLE IN PRESS
Table 2
Comparison of previous primary productivity (PPz) measure-
ments (average values) and rates of NCPy determined for the 2002
SBI program in the Chukchi Sea shelf, slope and basin
Location PPzor NCPy
(mgCm2 d�1)
Reference
Shelf 990z Hameedi (1978)
Shelf 748z Cota et al. (1996)
Shelf 2365z Wheeler et al. (1996)
Shelf 510z Chen et al. (2002)
Shelf 340z Hill and Cota (2005)
Shelf 898–2850y This study
Slope 406z Hill and Cota (2005)
Slope 680–2031y This study
Basin 5z English (1961)
Basin 123z Cota et al. (1996)
Basin 46z Wheeler et al. (1996)
Basin 45z Chen et al. (2002)
Basin 15y This study
Basin o20–25y This study; adjusted for
air–sea CO2 exchange
Table 3
Annual rate of primary productivity (PP) or net community
production (NCP) for 2002 in the Chukchi Sea assuming a
growing season of 120 d
Location PPz or NCPy
(gCm2 yr�1)
Reference
Shelf �35–50z Hill and Cota (2005)
Shelf �120–240y This study
Shelf �364z Walsh et al., (2005)
Table 4
Total annual net community production (NCP) in the northeast
region of the Chukchi Sea shelf. The area, delineated by dashed
lines in Fig. 8 is 13.9� 104 km2
Location NCP (gCyr�1) Growing
season (d)
Shelf 8.9� 1012 60
Shelf 17.8� 1012 120
N.R. Bates et al. / Deep-Sea Research II 52 (2005) 3303–3323 3321
rates of NCP (�1000–2850mgCm�2 d�1) occurredon the shelf and slope regions in the Barrow Canyonregion of the Chukchi Sea and East of Barrow in thewestern Beaufort Sea. In the northeast sector of theChukchi Sea shelf, an annual rate of NCP of 9 and18� 1012 g was estimated for a growing season of 60
and 120 d, respectively. Much of the productivityoccurring in this region of the Chukchi Sea shelf wasvertically exported laterally, with plumes of sus-pended POM in the upper halocline observedoffshelf extending into the Arctic Ocean basin(Bates et al., 2005a, b), or vertically exported tothe sea floor (Moran et al., 2005). In the ArcticOcean basin, very low inorganic nutrient concentra-tions and low rates of NCP (�15–25mgCm�2 d�1)confirm that this area is perennially oligotrophic,with rates of productivity closer to the low values ofEnglish (1961), Moran et al., (1997) and Andersonet al. (2003), rather than the higher estimates ofGosselin et al. (1997) and Pomeroy (1997).
Acknowledgements
Jackie Grebmeier and Lee Cooper are thankedfor their dedicated contributions to the SBIprogram. We are also grateful to the captain, crewand all scientific participants on the two 2002 Healy
cruises. Our thanks to Charlie Farmer (RSMAS),Cindy Miller (RSMAS), Christine Pequignet(BBSR) and Paul Lethaby (BBSR) for theirparticipation in the field activities of SBI. ChristinePequignet and Julian Mitchell (BBSR) are thankedfor their organization of pre-cruise and post-cruiselogistics. Leif Anderson and an anonymous re-viewer are thanked for their detailed and helpfulcomments. NSF Office of Polar Programs isthanked for the support of this research throughGrant OPP-0124868.
References
Aagaard, K., Carmack, E.C., 1994. The Arctic Ocean and
climate: a perspective. In: Johannessen, O.M., Muench, R.D.,
Overland, J.E. (Eds.), The Polar Oceans and Their Role in
Shaping the Global Environment, American Geophysical
Union, Geophysical Monograph 85, 5–20.
Aagaard, K., Coachman, L.K., Carmack, E.C., 1981. On the
halocline of the Arctic Ocean. Deep-Sea Research 28,
529–545.
Aagaard, K., Swift, J.H., Carmack, E.C., 1985. Thermohaline
circulation in the Arctic Mediterranean Sea. Journal of
Geophysical Research 95, 18163–18175.
Aagaard, K., Woodgate, R.A., Weingartner, T., 2005. From
Bering Strait to the Chukchi Shelf Break: chronology of the
Pacific Throughflow, 2002–2004. SBI Phase II Meeting, US
Naval Postgraduate School, Monterey, California, 21–23
March 2005.
Anderson, L.G., Jones, E.P., Lindegren, R., Rudels, B.,
Sehlstedt, P.I., 1988. Nutrient regeneration in cold, high

ARTICLE IN PRESSN.R. Bates et al. / Deep-Sea Research II 52 (2005) 3303–33233322
salinity bottom water of the Arctic shelves. Continental Shelf
Research 8, 1345–1355.
Anderson, L.G., Olsson, K., Skoog, A., 1994a. Distribution of
dissolved inorganic and organic carbon in the Eurasian basin
of the Arctic Ocean. In: Polar Oceans and Their Role in
Shaping the Global Environment, American Geophysical
Unions, Geophysical Monograph 85, 255–262.
Anderson, L.G., Bjork, G., Holby, O., Jones, E.P., Kattner, G.,
Koltermann, K.P., Liljeblad, B., Lindegren, R., Rudels, B.,
Swift, J.H., 1994b. Water masses and circulation in the
Eurasian basin: results from the Oden 91 Expedition. Journal
of Geophysical Research 99 (C2), 3273–3283.
Anderson, L.G., Jones, E.P., Swift, J.H., 2003. Export produc-
tion in the central Arctic Ocean evaluated by phosphate
deficits. Journal of Geophysical Research 108, 3199 doi:
10.1029/2001JC001057.
Ashjian, C.J., Gallager, S.M., Plourde, S., 2005. Transport of
plankton and particles between the Chukchi and Beaufort
Seas during Summer 2002, described using a video plankton
recorder. Deep-Sea Research II, this issue [doi:10.1016/
j.dsr2.2005.10.012].
Bates, N.R., 2001. Interannual changes of oceanic CO2 and
biogeochemical properties in the Western North Atlantic
subtropical gyre. Deep-Sea Research II 48 (8–9), 1507–1528.
Bates, N.R., Michaels, A.F., Knap, A.H., 1996. Seasonal and
interannual variability of the oceanic carbon dioxide system
at the US JGOFS Bermuda Atlantic Time-series Site. Deep-
Sea Research II 43 (2–3), 347–383.
Bates, N.R., Hansell, D.A., Carlson, C.A., Gordon, L.I., 1998.
Distribution of CO2 species, estimates of net community
production and air–sea CO2 exchange in the Ross Sea
polynya. Journal of Geophysical Research 103 (C2),
2883–2896.
Bates, N.R., Pequignet, A.C., Johnson, R.J., Gruber, N., 2002. A
short-term sink for atmospheric CO2 in Subtropical Mode
Water of the North Atlantic Ocean. Nature 420, 389–393.
Bates, N.R., Pequignet, A.C., Sabine, C.L., 2005a. Ocean carbon
cycling in the Indian Ocean II. Estimates of net community
production. Global Biogeochemical Cycles, in review.
Bates, N.R., Hansell, D.A., Moran, S.B., Codispoti, L.A., 2005b.
Seasonal and spatial distribution of particulate organic matter
(POM) in the Chukchi and Beaufort Seas. Deep-Sea Research
II, this issue [doi:10.1016/j.dsr2.2005.10.003].
Chen, M., Huang, Y.P., Guo, L.D., Cai, P.H., Yang, W.F., Liu,
G.S., Qiu, Y.S., 2002. Biological productivity and carbon
cycling in the Arctic Ocean. Chinese Science Bulletin 47 (12),
1037–1040.
Chipman, D.W., Marra, J., Takahashi, T., 1993. Primary
production at 471N and 201W in the North Atlantic Ocean:
a comparison between the 14C incubation method and the
mixed layer carbon budget. Deep-Sea Research 40, 151–169.
Coachman, L.K., Aagaard, K., Tripp, R.B., 1975. Bering Strait:
The Regional Physical Oceanography. University of Wa-
shington Press, Seattle, WA, 172pp.
Codispoti, L.A., Friederich, G.E., Iverson, R.L., Hood, D.W.,
1982. Temporal changes in the inorganic carbon system of the
southeastern Bering Sea during spring 1980. Nature 296,
242–245.
Codispoti, L.A., Friederich, G.E., Hood, D.W., 1986. Variability
in the inorganic carbon system over the southeastern Bering
Sea shelf during spring 1980 and spring-summer 1981.
Continental Shelf Research 5, 133–160.
Codispoti, L. Flagg, C., Kelly, V., 2005. Hydrographic conditions
during the 2002 SBI process experiments. Deep-Sea Research
II, this issue [doi:10.1016/j.dsr2.2005.10.007].
Cota, G.F., Pomeroy, L.R., Harrison, W.G., Jones, E.P., Peters,
F., Sheldon, W.M., Weingartner, T.R., 1996. Nutrients,
primary production and microbial heterotrophy in the
southeastern Chukchi Sea: Arctic summer nutrient depletion
and heterotrophy. Marine Ecology Progress Series 135 (1–3),
247–258.
D’Asaro, E.A., Morison, J.H., 1992. Internal waves and mixing
in the Arctic Ocean. Deep Sea Research A39, S459–S484.
Denman, K.L., Gargett, A.E., 1983. Time and space scales of
vertical mixing and advection of phytoplankton in the upper
ocean. Limnology and Oceanography 28, 801–815.
English, T.S., 1961. Some biological oceanographic observations
in the central north Polar Sea, Drift Station Alpha,
1957–1958. Arctic Institute of North America Scientific
Report 15.
Gosselin, M., Levasseur, M., Wheeler, P.A., Horner, R.A.,
Booth, B.C., 1997. New measurements of phytoplankton and
ice algal production in the Arctic Ocean. Deep-Sea Research
II 44, 1623–1644.
Gradinger, R., Eicken, H., 2004. Magnitude and control of sea
ice algae in the Chukchi and Beaufort Seas in spring 2002.
Session SS1.01. Abstract ID 882. ALSO/TOS SBI Special
Session, Honolulu Hawaii, 15–19 February 2004.
Grebmeier, J.M., Whitledge, T.E., 1996. Arctic System Science:
Ocean–Atmosphere–Ice Interactions Biological Initiative in
the Arctic: Shelf–Basin Interactions Workshop, ARCSS/
OAII Report Number 4, University of Washington, Seattle,
39pp.
Grebmeier, J. M., Cooper, L. W., Codispoti, L. A., Benner, R.,
2004. Benthic carbon cycling and nutrient exchange in the
western Arctic Shelf–Basin Interactions (SBI) study area.
Session SS1.01. Abstract ID 774. ALSO/TOS SBI Special
Session, Honolulu, Hawaii, 15–19 February 2004.
Hameedi, M.J., 1978. Aspects of water column primary
productivity in Chukchi Sea during summer. Marine Biology
48 (1), 37–46.
Hansell, D.A., Whitledge, T.E., Goering, J.J., 1993. Patterns of
nitrate utilization and new production over the Bering–Chuk-
chi shelf. Continental Shelf Research 13, 601–628.
Hill, V.J., Cota, G.F., 2005. Spatial patterns of primary
production on the shelf, slope and basin of the Western
Arctic in 2002. Deep-Sea Research II, this issue [doi:10.1016/
j.dsr2.2005.10.001].
Johnson, K.M., Wills, K.D., Butler, D.B., Johnson, W.K.,
Wong, C.S., 1993. Coulometric total carbon dioxide analysis
for marine studies: maximizing the performance of an
automated gas extraction system and coulometric detector.
Marine Chemistry 44, 167–188.
Jones, E.P., Anderson, L.G., 1986. On the origin of chemical
properties of the Arctic Ocean halocline. Journal of Geophy-
sical Research 91, 10,759–10,767.
Jones, E.P., Anderson, L.G., Wallace, D.W.R., 1991. Tracers of
near-surface, halocline and deep waters in the Arctic Ocean:
Implications for circulation. Journal of Marine Systems 2,
241–255.
Karl, D.M., Tilbrook, B.D., Tien, G., 1991. Seasonal coupling of
organic matter production and particle flux in the western
Bransfield Strait, Antarctica. Deep-Sea Research 38,
1097–1126.

ARTICLE IN PRESSN.R. Bates et al. / Deep-Sea Research II 52 (2005) 3303–3323 3323
Karl, D.M., Bidigare, R.R., Letelier, R.M., 2001. Long-term
changes in plankton community structure and productivity in
the North Pacific Subtropical Gyre: the domain shift
hypothesis. Deep-Sea Research II 48, 1449–1470.
Kinney, P., Arhelger, M.E., Burrell, D.C., 1970. Chemical
characteristics of water masses in the Amerasian Basin of
the Arctic Ocean. Journal of Geophysical Research 75,
4097–4104.
Lee, K., 2001. Global net community production estimated from
the annual cycle of surface water total dissolved inorganic
carbon. Limnology and Oceanography 46 (6), 1287–1297.
Lee, K., Karl, D.M., Wanninkhof, R., Zhang, J.Z., 2002. Global
estimates of net carbon production in the nitrate-depleted
tropical and subtropical oceans. Geophysical Research
Letters 29 (19), 1907.
Manabe, S., Stouffer, RE.J., 2000. Study of abrupt climate
change by a coupled ocean atmosphere model. Quaternary
Science Reviews 19, 285–299.
Moran, S.B., Ellis, K.M., Smith, J.N., 1997. 234Th/238U
disequilibrium in the central Arctic Ocean: implications for
particulate organic carbon export. Deep-Sea Research II 44,
1593–1606.
Moran, S.B., Kelly, R.P., Hagstrom, K., Smith, J.N., Grebmeier,
J.M., Cooper, L.W., Cota, G.F., Walsh, J.J., Bates, N.R.,
Hansell, D.A., Maslowski, W., 2005. Seasonal changes in
POC export flux in the Chukchi Sea and implications for
water column-benthic coupling in Arctic shelves. Deep-Sea
Research II, this issue [doi:10.1016/j.dsr2.2005.09.009].
Moritz, R.E., Perovich, D.K., 1996. Arctic System Science:
Ocean–Atmosphere–Ice Interactions. SHEBA. Surface Heat
Budget of the Arctic Ocean Science Plan. ARCSS/OAII
Report Number 5, University of Washington, Seattle, 60pp.
Murata, A., Takizawa, T., 2003. Summertime CO2 sinks in shelf
and slope waters of the western Arctic Ocean. Continental
Shelf Research 23 (8), 753–776.
Pipko, I.I., Semiletov, I.P., Tishchenko, P.Y., Pugach, S.P.,
Christensen, J.P., 2002. Carbonate chemistry dynamics in
Bering Strait and the Chukchi Sea. Progress in Oceanography
55 (1–2), 77–94.
Pomeroy, L.R., 1997. Primary production in the Arctic Ocean
estimated from dissolved oxygen. Journal of Marine Systems
10, 1–8.
Rudels, B., Anderson, L.G., Jones, E.P., 1996. Formation and
evolution of the surface mixed layer and halocline of the
Arctic Ocean. Journal of Geophysical Research 101,
8807–8821.
Salmon, D.K., McRoy, C.P., 1994. Nutrient-based tracers in the
western Arctic: a new lower halocline water defined. In:
Johannessen, O.M., Muench, R.D., Overland, J.E. (Eds.),
The Polar Oceans and Their Role in Shaping the Global
Environment, American Geophysical Union, Geophysical
Monograph 85, 47–61.
Sambrotto, R.N., Goering, J.J., McRoy, C.P., 1984. Large yearly
production of phytoplankton in the western Bering Sea.
Science 225, 1147–1155.
Schlosser, P., Swift, J.H., Lewis, D., Pfirman, S., 1995. The role
of the large-scale Arctic Ocean circulation in the transport of
contaminants. Deep-Sea Research II 42, 1341–1368.
Springer, A.M., McRoy, C.P., 1993. The paradox of pelagic
food webs in the Northern Bering Sea. 3. Patterns of
primary production. Continental Shelf Research 13 (5–6),
575–599.
Springer, A.M., McRoy, C.P., Flint, M.V., 1996. The Bering Sea
Green Belt: shelf-edge processes and ecosystem production.
Fisheries Oceanography 5 (3–4), 205–223.
Steinberg, D.K., Carlson, C.A., Bates, N.R., Johnson, R.J.,
Michaels, A.F., Knap, A.H., 2001. The US JGOFS Bermuda
Atlantic Time-series study: a decade-scale look at ocean
biology and biogeochemistry. Deep-Sea Research II 48 (8–9),
1405–1447.
Wallace, D.W.R., Moore, R.M., Jones, E.P., 1987. Ventilation of
the Arctic Ocean cold halocline: rates of diapycnal and
isopycnal transport, oxygen utilization and primary produc-
tion inferred using chlorofluoromethane distributions. Deep-
Sea Research 34, 1957–1979.
Walsh, J.J., Dieterle, D.A., 1994. CO2 cycling in the coastal ocean
I—a numerical analysis of the southeastern Bering Sea with
applications to the Chukchi Sea and the Northern Gulf of
Mexico. Progress in Oceanography 74, 335–392.
Walsh, J.J., Bryan, F., Cattle, H., Dickinson, R., Moritz, R.E.,
Mysak, L., 1990. Global-Arctic interactions. In: Moritz, R.E.,
Aagaard, K., Baker, D.J., Codispoti, L.A., Smith, S.L.,
Smith, W.O., Tipper, R.C., Walsh, J.J. (Eds.), Arctic System
Science: Ocean–Atmosphere–Ice Interactions. Joint Oceano-
graphic Institutions, Washington DC, pp. 75–111.
Walsh, J.J., Dieterle, D.A., Maslowski, W., Grebmeier, J.M.,
Whitledge, T.E., Flint, M., Sukhanova, I.N., Bates, N.R.,
Cota, G.F., Stockwell, D., Moran, S.B., Hansell, D.A.,
McRoy, C.P., 2005. A numerical model of neglected spring
primary production within the Chukchi/Beaufort Seas. Deep-
Sea Research II, this issue [doi:10.1016/j.dsr2.2005.09.011].
Wang, W.Q., Chen, L.Q., Yang, X.L., Huang, X.B., 2003.
Investigations on distributions and fluxes of sea–air CO2 of
the expedition areas in the Arctic Ocean. Science in China
Series D-Earth Sciences 46 (6), 569–579.
Weingartner, T., Aagaard, K, Woodgate, R., Danielson, S.,
Sasaki, Y., Cavalieri, D., 2005. Circulation on the North
Central Chukchi Sea Shelf. Deep-Sea Research II, this issue
[doi:10.1016/j.dsr2.2005.10.015].
Weiss, R.F., Ostlund, H.G., Craig, H., 1979. Geochemical studies
of the Weddell Sea. Deep-Sea Research 26, 1093–1120.
Wheeler, P.A., Gosselin, M., Sherr, E., Thibault, D., Kirchman,
D.L., Benner, R., Whitledge, T.E., 1996. Active cycling of
organic carbon in the central Arctic Ocean. Nature 380
(6576), 697–699.
Williams, P.J.B., 1993. On the definition of plankton production
terms. In: Li, W.K.W., Maestrini, S.Y. (Eds.), Measurement
of Primary Production from the Molecular to the Global
Scale. ICES Marine Science Symposium, vol. 197, pp. 9–19.
Woodgate, R.A., Aagaard, K., 2005. Revising the Bering Strait
freshwater flux into the Arctic Ocean. Geophysical Research
Letters 32 (2), Art. No. L02602 JAN 20 2005.
Woodgate, R.A., Aagaard, K., Weingartner, T., 2005a. A year in
the physical oceanography of the Chukchi Sea: moored
measurements from autumn 1990–1991. Deep-Sea Research
II, this issue [doi:10.1016/j.dsr2.2005.10.016].
Woodgate, R.A., Aagaard, K., Weingartner, T., 2005b. Monthly
temperature, salinity and transport variability of the Bering
Strait throughflow. Geophysical Research Letters 32 (4), Art.
No. L04601 FEB 16 2005.
Yager, P.L., Wallace, D.W.R., Johnson, K.M., Smith Jr., W.O.,
Minnett, P.J., Deming, J.W., 1995. The Northeast Water
Polynya as an atmospheric CO2 sink: a seasonal rectification
hypothesis. Journal of Geophysical Research 100, 4389–4398.