inter-annual variability of dissolved inorganic nitrogen in the biobío
TRANSCRIPT

HESSD12, 705–738, 2015
Inter-annualvariability of
dissolved inorganicnitrogen in the Biobío
River
M. Yévenes et al.
Title Page
Abstract Introduction
Conclusions References
Tables Figures
J I
J I
Back Close
Full Screen / Esc
Printer-friendly Version
Interactive Discussion
Discussion
Paper
|D
iscussionP
aper|
Discussion
Paper
|D
iscussionP
aper|
Hydrol. Earth Syst. Sci. Discuss., 12, 705–738, 2015www.hydrol-earth-syst-sci-discuss.net/12/705/2015/doi:10.5194/hessd-12-705-2015© Author(s) 2015. CC Attribution 3.0 License.
This discussion paper is/has been under review for the journal Hydrology and Earth SystemSciences (HESS). Please refer to the corresponding final paper in HESS if available.
Inter-annual variability of dissolvedinorganic nitrogen in the Biobío River,Central Chile: an analysis base on adecadal database along with 1-D reactivetransport modeling
M. Yévenes1, R. Figueroa2, O. Parra2, and L. Farías3
1Centro de Ciencia del Clima y la Resiliencia (CR)2, Laboratorio de Procesos Oceanográficosy clima (PROFC), Universidad de Concepción, Concepción, Chile2Facultad de Ciencias Ambientales, Centro de Ciencias Ambientales EULA, Universidad deConcepción, Concepción, Chile3Departamento de Oceanografía, Centro de Ciencia del Clima y la Resiliencia (CR)2,Universidad de Concepción, Concepción, Chile
Received: 20 October 2014 – Accepted: 12 December 2014 – Published: 16 January 2015
Correspondence to: R. Figueroa ([email protected])
Published by Copernicus Publications on behalf of the European Geosciences Union.
705

HESSD12, 705–738, 2015
Inter-annualvariability of
dissolved inorganicnitrogen in the Biobío
River
M. Yévenes et al.
Title Page
Abstract Introduction
Conclusions References
Tables Figures
J I
J I
Back Close
Full Screen / Esc
Printer-friendly Version
Interactive Discussion
Discussion
Paper
|D
iscussionP
aper|
Discussion
Paper
|D
iscussionP
aper|
Abstract
Rivers may act as important sinks (filters) or sources for inorganic nutrients betweenthe land and the sea, depending on the biogeochemical processes and nutrient in-puts along the river. This study examines the inter-annual variability of dissolved inor-ganic nitrogen (DIN) seasonal (wet–dry) cycle for the Biobío River, one of the largest5
and most industrialized rivers of Central Chile (36◦45′–38◦49′ S and 71◦00′–73◦20′W).Long-term water flow (1990–2012) and water quality datasets (2004–2012) were usedalong with a one-dimensional reactive transport ecosystem model to evaluate the ef-fects of water flow and N inputs on seasonal pattern of DIN. From 2004 to 2012, an-nual average nitrate levels significantly increased from 1.73±2.17 µmol L−1 (upstream10
of the river) to 18.4±12.7 µmol L−1 (in the river mouth); while the annual average oxy-gen concentration decreased from 348±22 to 278±42 µmol L−1 between upstreamand downstream, indicating an additional oxygen consumption. Variability in the mid-section of the river (station BB8) was identified as a major influence on the inter-annualvariability and appeared to be the site of a major anthropogenic disturbance. However,15
there was also an influence of climate on riverine DIN concentrations; high DIN pro-duction occurred during wet years, whereas high consumption proceeded during dryyears. Extremely reduced river flow and drought during summer also strongly affectedthe annual DIN concentration, reducing the DIN production. Additionally, summer stormevents during drought periods appeared to cause significant runoff resulting in nitrate20
inputs to the river. The total DIN input reaching the river mouth was 0.159 Gmol yr−1,implying that internal production exceeds consumption processes, and identifying nitri-fication as one of the predominant processes occurring in the estuary. In the following,the impact on the river of DIN increases as a nutrient source, as well as climate andbiogeochemical factors are discussed.25
706

HESSD12, 705–738, 2015
Inter-annualvariability of
dissolved inorganicnitrogen in the Biobío
River
M. Yévenes et al.
Title Page
Abstract Introduction
Conclusions References
Tables Figures
J I
J I
Back Close
Full Screen / Esc
Printer-friendly Version
Interactive Discussion
Discussion
Paper
|D
iscussionP
aper|
Discussion
Paper
|D
iscussionP
aper|
1 Introduction
Watersheds provide ecosystem services and rivers are important components that reg-ulate the export of nutrients and other solutes from the land to coastal waters (Scott andPrinsloo, 2008; Palmer et al., 2009). However, human activity in coastal watersheds hasaffected the provision of ecosystem services by greatly increasing the fluxes of growth-5
limiting nutrients from land to receiving waters. This trend has increased dramaticallyin the last few decades as a consequence of climate variability, which has reduced theintensity and duration of rainfall, and land uses changes due to deforestation, industrialsettlement, coastal development, forestry, and agriculture activities (EEA, 2010).
Rivers are known to be one of the major sources of dissolved inorganic nitrogen (DIN10
as mainly nitrate and ammonium) but this input extend depends on various biologicalfactors such as sediment disturbance, nitrate assimilation, denitrification and nitrifica-tion processes, among others. For example, rivers act as a sink or nutrient filter forDIN under denitrification conditions when the water column is depleted of oxygen, or insuboxic or anoxic sediments (Lehmann et al., 2004). Conversely rivers act as a source15
under conditions of nitrification, driven by microorganisms which have a key role inriverine nutrient regeneration (Dahkne et al., 2008).
A large number of studies have contributed to the knowledge base on DIN turnover(Seitzinger, 1988; Seitzinger et al., 2000; Soetaert et al., 2006; Conley et al., 2009),spatial and temporal patterns, relationships between nitrogen sources and sinks in20
rivers, and concentrations and fluxes (Meybeck, 1982; Seitzinger et al., 1988; Boyeret al., 2002). However, nitrogen variability is still not comprehensively understood. Therelevance of inter-annual climatic variation for biogeochemistry of nitrogen has not beenfully explored yet, possibly due to the scarcity of time series datasets (Jentsch et al.,2007). Understanding the relation of climatic conditions and large inter-annual varia-25
tions in DIN concentration are crucial when considering the implications to the fate ofDIN in aquatic ecosystems (Stuart et al., 2011). Kaushal et al. (2008) suggested thatnitrogen exportation increases during floods (sometimes by orders of magnitude) and
707
HESSD12, 705–738, 2015
Inter-annualvariability of
dissolved inorganicnitrogen in the Biobío
River
M. Yévenes et al.
Title Page
Abstract Introduction
Conclusions References
Tables Figures
J I
J I
Back Close
Full Screen / Esc
Printer-friendly Version
Interactive Discussion
Discussion
Paper
|D
iscussionP
aper|
Discussion
Paper
|D
iscussionP
aper|
decreases during droughts. The relationships between annual runoff and nitrogen ex-ports differ across land uses. In rivers, about 50 % of the nitrogen load is retained in theriver mouth or estuaries (Seitzinger, 1988), whereas climatic variations and land usechanges can act as potential drivers for substantial increases in nitrate export (Kaushalet al., 2008; Wang et al., 2010).5
Recent investigations in the Northern Hemisphere suggest a relationship betweennitrate variation and climatic conditions (Cerro et al., 2013; Vegas-Vilarrubia et al.,2012). For instance, in the UK, synchronous trends of variation in nitrate have beenrelated to climatic change (Monteith et al., 2000). Other studies have found strong andconsistent signs of El Niño Southern Oscillation (ENSO) in river inflows, nitrate and10
oxygen contents (Marcé et al., 2010; Vegas-Vilarrubia et al., 2012). Conversely, in theSouthern Hemisphere little information is known about temporal DIN variability. It isthe case of Chile, where there are some scarce spaced short term studies (Debelset al., 2005; Leniz et al., 2012). Despite valuable results from these studies, they fail toprovide a sufficient base of information.15
Research in Chile has focused on major problems such as rapid changes in land use,wastewater and industrial discharge, and runoff from areas of intensive deforestation(Echeverria et al., 2006; Aguayo et al., 2009; Sterh et al., 2009). In South-Central Chilethis has raised concerns about the effect on hydrological alterations associated withland use changes (Meza et al., 2012) because these can amplify the climate-driven20
export of nitrate in river catchments (Jordan et al., 2003; Wollheim et al., 2005). Mostof the water quality studies in Chilean rivers have focused on characterizing nitrogenconcentration dynamics, based on short-term databases which do not incorporatedDIN fluxes or budgets (Debels et al., 2005; Pizarro et al., 2010).
The Biobío River is one of the largest hydrological systems located in the Biobío25
region of Central Chile. It drains into the Pacific Ocean and is strongly threatened byurban and industrial expansion (Valdovinos et al., 2009; Salamanca and Pantoja, 2009;Parra et al., 2012). Studies efforts such as Leniz et al. (2012) found a significant fluxof phytoplankton, carbon, and nutrients from the Biobío river mouth to the adjacent
708

HESSD12, 705–738, 2015
Inter-annualvariability of
dissolved inorganicnitrogen in the Biobío
River
M. Yévenes et al.
Title Page
Abstract Introduction
Conclusions References
Tables Figures
J I
J I
Back Close
Full Screen / Esc
Printer-friendly Version
Interactive Discussion
Discussion
Paper
|D
iscussionP
aper|
Discussion
Paper
|D
iscussionP
aper|
coastal ocean during winter and summer of 2009, but there were no long term obser-vations about DIN retention and removal.
As a result, our understanding of DIN concentration dynamics in rivers, and theirrelations with climatic variations and land use, remains unclear and requires furtherresearch in the form of long-term studies. Long-term studies make it possible to track5
changes in rivers over time, and complements information about the influence of cli-mate in these ecosystems, which are particularly valuable as they provide insights intoDIN sources (e.g., nitrification) and sinks (assimilation and burial, denitrification). To in-tegrate long-term data series, reactive transport models (RTMs) provide a quantitativeunderstanding and a mechanistic description of biogeochemical transformations and10
allow systematic integration of biogeochemical processes (Regnier et al., 2003).In this study we have gathered water quality and physical parameters collected by
the Centro EULA (Parra et al., 2013) during an 8 year period in the Biobío River, andriver water discharge samples from the National Water Direction (DGA) of the Ministryof Public Works of Chile over a 22 year period. Based on the premise that over the15
past years climatic conditions in the watershed have changed (i.e. rainfall intensity),and land use activities have increased (i.e. urban, industrial, agriculture and forestry),we investigated seasonal and inter-annual variations in dissolved inorganic nitrogen(mainly nitrate and ammonium) and oxygen conditions during drought and wet yearsfrom 2004 until 2012.20
2 Materials and methods
2.1 Study site
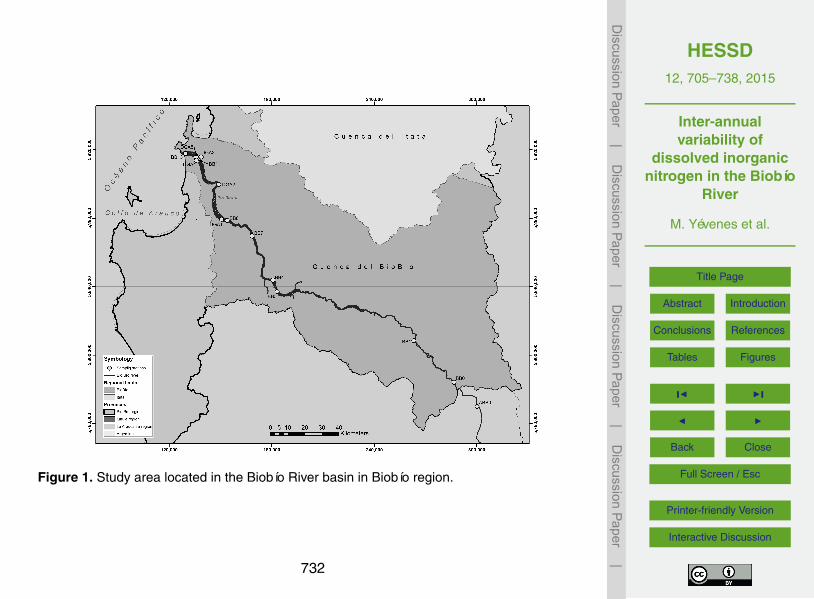
The Biobío River has the third largest watershed in Chile with an area of 24 260 km2.It is located in Central Chile, between 36◦45′–38◦49′ S and 71◦00′–73◦20′W (Fig. 1).It flows for 380 km between the Andes mountain and the Pacific Ocean (Grantham25
et al., 2013). The river covers approximately 3 % of the total area of the country and
709
HESSD12, 705–738, 2015
Inter-annualvariability of
dissolved inorganicnitrogen in the Biobío
River
M. Yévenes et al.
Title Page
Abstract Introduction
Conclusions References
Tables Figures
J I
J I
Back Close
Full Screen / Esc
Printer-friendly Version
Interactive Discussion
Discussion
Paper
|D
iscussionP
aper|
Discussion
Paper
|D
iscussionP
aper|
is influenced by the temperate climates of the south as well as by the Mediterraneanclimate of central Chile (Stehr et al., 2008). In this region, rainfall is at its highest duringthe autumn, winter and spring and precipitation in the Biobío watershed reaches up to1400 mmyr−1. Many authors have reported that anthropogenic stressors, including thealteration of natural water flow patterns through the Pangue (1996) and Ralco (2004)5
dams, and the diffuse and point source inputs of nutrients, have recently caused detri-mental impacts on the system (Karrasch et al., 2006; Stehr et al., 2008; García et al.,2011). The Ralco dam has an annual flow regulation capacity and a storing volume thatamounts to 7 % of the mean annual Biobío River discharge. The Pangue and Ralcodams have a total reservoir capacity of 175×106 m3 and 1222×106 m3, respectively.10
The area within the Biobío watershed is important for forestry activities (both pulp millsand exotic species forestry plantations), and contain a major proportion of the Chileanagricultural soils (Stehr et al., 2009). The basin also plays a key role in the national en-ergy supply (hydropower). The Biobío River has a pluvio-nival flow regime, with a verymarked difference in discharge near the mouth between dry and wet seasons (the15
Austral winter wet season is from June to September and the Austral summer dry sea-son is from December to March). A maximum monthly mean discharge of 1823 m3 s−1
occurs during July, while a minimum monthly mean discharge of 279 m3 s−1 occursduring February. The adjacent coastal area is not only influenced by the river but alsoby seasonal coastal upwelling events, mainly in spring-summer (Sobarzo et al., 2007).20
2.2 River datasets
Long-term water flow (1990–2012) and water quality (2004–2012) datasets are sup-plied by the National River Monitoring Network of the National Water Direction (DGA)(www.dga.cl), and water quality data (2004–2012) from the EULA Centre from Uni-versity of Concepcion (Parra et al., 2012). Water quality monitoring from the EULA25
Center began in 1994, however only the datasets from 2004–2012 have been includedin this study over nine continuously monitored EULA sampling stations (see Fig. 1; sta-tions ABB0, BB0, BB1, BB4, BB6, BB7, BB8, BB11 and BB13). Discrete surface water
710
HESSD12, 705–738, 2015
Inter-annualvariability of
dissolved inorganicnitrogen in the Biobío
River
M. Yévenes et al.
Title Page
Abstract Introduction
Conclusions References
Tables Figures
J I
J I
Back Close
Full Screen / Esc
Printer-friendly Version
Interactive Discussion
Discussion
Paper
|D
iscussionP
aper|
Discussion
Paper
|D
iscussionP
aper|
sampling of the river was carried out seasonally during 2004 to 2012. The stations aresystematically distributed along the river and main tributaries (sub-basins), covering thecontinuum from upstream to the river mouth (Fig. 1). Water quality parameters includednitrate, nitrite, ammonium, oxygen, biochemical oxygen demand (BOD). Approximately72 water samples were collected through manual sampling during the study period. In5
the laboratory, the water samples were filtered using pre-weighted glass microfiber fil-ter paper (Whatman GF/F 0.7 µm) in order to retain the suspended matter. Each filteredwater sample was stored at 4 ◦C until analysis could be performed as soon as possiblenot later than one week after filtration. The nutrients concentration was determined bymolecular spectrophotometer, Perkin Elmer, model Lambda 25.10
Five DGA sampling stations for water quality parameters were selected (DGA1,DGA2, DGA3, DGA4 and DGA 5) and indicated in Fig. 1. Water samples from theriver estuary were collected during low tide.
To characterize ENSO periods, we used the Oceanic Niño Index (ONI) downloadedby http://www.cgd.ucar.edu/cas/catalog/climind/Nino_3_3.4_indices.html, ftp://ftp.cpc.15
ncep.noaa.gov/wd52dg/data/indices/.
2.3 Land use
Land use data was interpreted from Landsat TM satellite imagery. Landsat TM images(2011) of the Biobío river watershed were downloaded from the US Geological Sur-vey, Global Visualization Viewer site (http://glovis.usgs.gov/). ENVI software was used20
to process the Landsat image. After classification, land uses in the catchments wereextracted through buffer tools in ArcGIS, and the result was compared with existingdata from the Department of Geography at the University of Concepción, for purposesof corroboration. We identified ten land use classes, our classifications are as follow:(1) forest, (2) water bodies, (3) steppe, (4) scrubland, (5) snow (6), grassland (7), sil-25
viculture (8), agriculture (9), and urban. Table 1 characterized the sample sites in theriver basin and the related industries in the area.
711
HESSD12, 705–738, 2015
Inter-annualvariability of
dissolved inorganicnitrogen in the Biobío
River
M. Yévenes et al.
Title Page
Abstract Introduction
Conclusions References
Tables Figures
J I
J I
Back Close
Full Screen / Esc
Printer-friendly Version
Interactive Discussion
Discussion
Paper
|D
iscussionP
aper|
Discussion
Paper
|D
iscussionP
aper|
2.4 Flow data, load calculations and data analysis
Flow data was obtained from DGA and expressed in mega liters (ML) per day and DINconcentrations from EULA, both were used to calculate total load. The total load wascalculated for each site and time period using the following formula (UNESCO, 2009):
Ld = Cd×Vd (1)5
where Ld=observed load of the compound (td−1) for specified day, Cd= concentrationof the pollutant for specified day (µmolL−1), Vd= total volume of discharge (MLd−1) forspecified day.
2.5 Numerical approach (reactive transport ecosystem model)
To assess the dynamics of DIN in the water (i.e NO−3 and NH+4 ), we developed a one10
dimensional (1-D) reactive transport model for NO−3 NO−3 NO−3 and NH+4 for the last
section of the Biobío River (approx. length 80 km). The 1-D reactive transport modelwas scripted using the open source software R (R Development Core Team, 2009;http://www.r-project.org/). The R package ReacTran (Soetaert and Meysman, 2012)permits the application of the volumetric advective-diffusive transport function in R15
(Eq. 1):
∂C∂t
= − 1Ax·∂ (Q ·C)
∂x+
1Ax· ∂∂x
(Ax ·E
∂C∂x
)+ reaction (2)
where t is time, and x is distance along the river axis; the first term represents transportby the river flow (advection) and the second term represents (turbulent) dispersion. It isassumed that the cross-sectional area (Ax) is constant in time (Alexander et al., 2009),20
but it varies along the river axis (x). The chemical state variables in the reactive advec-tion dispersion model are described in terms of concentration (µmolL−1). The reactionscomprise two main biogeochemical processes: nitrate removal by denitrification and ni-trate regeneration by nitrification. Boundary conditions for nitrate and ammonium were
712
HESSD12, 705–738, 2015
Inter-annualvariability of
dissolved inorganicnitrogen in the Biobío
River
M. Yévenes et al.
Title Page
Abstract Introduction
Conclusions References
Tables Figures
J I
J I
Back Close
Full Screen / Esc
Printer-friendly Version
Interactive Discussion
Discussion
Paper
|D
iscussionP
aper|
Discussion
Paper
|D
iscussionP
aper|
derived from the river database, whereas nitrification and denitrification rates were ob-tained from literature.
In order to simulate the nitrate, ammonium, oxygen and BOD dynamics in the riverflow only the main river, and no tributaries in the catchment, were considered in themodel. The modelling was simulated during winter and summer from 2004 to 2012.5
Representative steady state flow conditions (Q) for the sampling period were assumedin the model in order to focus on the biogeochemical reactions and transformations ofnitrate in the river flow. The cross-sectional area (Ax) was estimated from the surfaceareas at the sampling points and afterwards linearly interpolated. Length axis was de-fined by the river boundary located upstream (Hualqui) at 0 km and the downstream10
(river mouth) boundary at 40 km. For modelling purposes we only considered the lastsix sample collection sites, this is from the mid-section (DGA2) downward to the rivermouth (BB13), with six sites (DGA2, DGA3, DGA4, DGA5, BB11 and BB13) collectedfrom DGA and EULA Centre.
The two major reactions in the model are nitrification and denitrification and are15
calculated by the following chemical reactions:
NH+4 +2O2
k1−→ NO−3 +2H+ +H2O (R1)
5CH2O+4NO−3k2−→ 2N2 +4HCO−3 +CO2 +3H2O. (R2)
2.6 Calibration and validation of the model
Model calibration and verification consisted of testing whether the designed model was20
able to reproduce qualitatively and quantitatively the observed data (Soetaert and Her-man, 2009). During the evaluation step we confronted model predicted outputs againstobserved data for nitrate, ammonium, oxygen and BOD parameters. Calibration wasdone using data from 2007 to 2012, while the data from 2004 to 2006 were usedto validate the model. We used the Levenberg–Marquardt calibration algorithm, with25
a non-linear least-squares function objective, to minimize the sum of squared residuals
713

HESSD12, 705–738, 2015
Inter-annualvariability of
dissolved inorganicnitrogen in the Biobío
River
M. Yévenes et al.
Title Page
Abstract Introduction
Conclusions References
Tables Figures
J I
J I
Back Close
Full Screen / Esc
Printer-friendly Version
Interactive Discussion
Discussion
Paper
|D
iscussionP
aper|
Discussion
Paper
|D
iscussionP
aper|
between model and data (Soetaert and Herman, 2009). To run the objective functionR program also was used with the minpack.lm package.
3 Results
3.1 River flow and rainfall conditions
Daily flow data from the Biobío River from 1990 to 2012 is shown in Fig. 2a. Yearly5
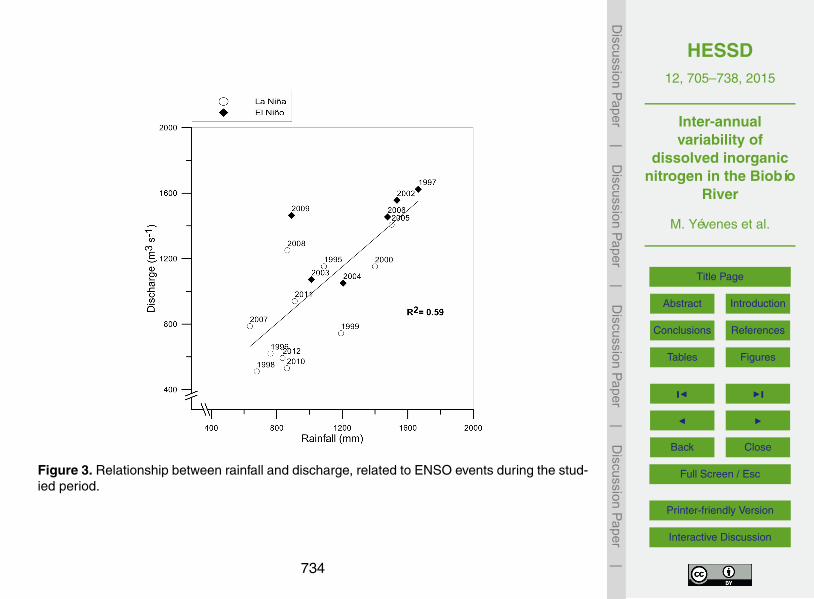
average river flow, calculated at the river mouth, varied from 473 to 1469 m3 s−1 duringthe 22 year period (Fig. 2a). The 25th percentile of the extreme-value distribution was863 mmyr−1. Six of the 22 year in the dataset had < 863 mm and the 75 % percentilewas 1457 mmyr−1 (Fig. 2b). Data showed a clear relationship between river flow andrainfall (r2 = 0.85). There was a clear inter-annual variability in river flow related to pre-10
cipitation anomalies during wet and dry conditions during ENSO events (Fig. 2b). Wetconditions were associated to maximum river flows in 1997 (strong El Niño event) andfollowed by less intense in 2002. During 2005 and 2006 a high incidence of rainfall wasobserved during a moderate to weak El Niño event. Major winter precipitation events(1600 mm) were recorded in April of 1997 at the river mouth (Fig. 2c), corresponding to15
the strong El Niño. Climate data showed an abrupt drop in rainfall after 2006 until 2012,with the exception of La Niña year in 2008, with one of the most extreme rainfall events(108 mm in 24 h) recorded (Fig. 2b and c). Extreme dry conditions accompanied byvery low river discharges were observed from 2007 to 2012, also corresponding to LaNiña years (Fig. 3). From 2007 onwards, the probability of extreme drought conditions20
(less than 863 mm rainfall) increased with extreme lows of 108 mm rainfall registeredduring 2008.
3.2 Spatial water quality trends (entire river course) related to land uses
Concentrations of DIN and water quality parameters varied significantly at differentsites across the watershed and at individual sites (Table 2). Nitrate was the most25
714

HESSD12, 705–738, 2015
Inter-annualvariability of
dissolved inorganicnitrogen in the Biobío
River
M. Yévenes et al.
Title Page
Abstract Introduction
Conclusions References
Tables Figures
J I
J I
Back Close
Full Screen / Esc
Printer-friendly Version
Interactive Discussion
Discussion
Paper
|D
iscussionP
aper|
Discussion
Paper
|D
iscussionP
aper|
prominent DIN constituent during the time scale analysis. Levels of nitrate upstream(stations ABB0, BB0, and BB1) presented lower mean values between 0.81 and9.19 µmolL−1. On the contrary, nitrate in stations associated with the river mouth aver-aged 16±17 µmolL−1. Nitrite and ammonium concentrations in the headwater showeda similar trend, nitrite minimal and maximal values were 0 to 0.13 µmolL−1 in stations5
ABB0, BB0, and BB1. High concentrations of oxygen (always supersaturated) in theheadwaters remained above 300 µmolL−1. If we consider that the percentage of oxy-gen saturation varied inversely against temperature, time series records began highin the upstream areas (ABB0, BB0, and BB1), where temperatures were always low(Table 2). Oxygen values in the mid-section of the river fluctuated between 109 and10
375 µmolL−1 (stations BB4 and BB7) and decreased between 250 and 284 µmolL−1 inthe river mouth (between stations BB8 and BB13). In general, BOD5 in the river alongthe river continuum varied from < 31 to 109 µmolL−1, these values indicate good waterquality conditions.
The pH remained fairly constant from the headwater to the mouth; pH was slightly15
alkaline mostly with values between 7 and 8. Low electrical conductivity values in theupstream and in mid-section were found, however conductivity increased substantiallyfrom the station BB7 to the river mouth, from 56 till 3300 µsC−1. Total suspended solids(TSS) did not exhibit clear spatial trend values and generally varied between 3 and51 mgL−1 along the river, with exception of a maximum of 86 mgL−1 at the river mouth20
(BB13). In addition, TSS and nitrate were higher near urban (BB11) and industrialareas (BB8), and in the area of the river mouth (BB11 and BB13).
River stations exposed to draining from silviculture and agricultural land uses hadlower nitrate and ammonium concentrations than those subject to draining from urbanareas (Fig. 4), but higher nitrate and ammonium levels than river areas draining from25
forest land uses. Dissolved oxygen was higher in the presence of forest areas (up-stream) than urban land use (downstream), and BDO5 showed the highest values inareas with populations related to industrial activities. Approximately 20 % of the landarea draining into the Biobío is comprised of urban land areas and approximately 50 %
715

HESSD12, 705–738, 2015
Inter-annualvariability of
dissolved inorganicnitrogen in the Biobío
River
M. Yévenes et al.
Title Page
Abstract Introduction
Conclusions References
Tables Figures
J I
J I
Back Close
Full Screen / Esc
Printer-friendly Version
Interactive Discussion
Discussion
Paper
|D
iscussionP
aper|
Discussion
Paper
|D
iscussionP
aper|
of agricultural land areas. The remaining area corresponds mainly to silviculture andforest.
3.3 Seasonal water quality trends (entire river continuum)
In general, nitrate, ammonium, BOD5, conductivity, TSS and oxygen concentrationswere higher during winter periods (higher rainfall) of 2004, 2005 and 2006. Mean and5
SD of water quality parameters during winter and summer periods are shown in Ta-ble 2. Average ammonium and nitrate concentrations in surface waters increase morethan 3 and 5 times, respectively. Ammonium concentrations remained constant in theheadwaters during summer, and slightly increased during winter (i.e. ABB0 to BB0 from1.1 to 3.3 µmolL−1). Moreover, nitrate, ammonium, and oxygen concentrations showed10
a clear seasonal trend characterized by higher values during winter and a progressivedecrease to minimum values in summer; this continually decreased through the sum-mer. During summer in the river mouth, nitrate concentrations were 16±17 µmolL−1
(Fig. 5).
3.4 Temporal and spatial nitrogen and oxygen variations; observed vs. model15
data
Modelled concentrations of nitrate, ammonium, oxygen and biological oxygen demandin the ultimate 40 km of the Biobío River included both winter and dry seasons forthe entire study period and for individual years are shown in Fig. 6. Model simulationshowed a reasonable fit against observed data to the overall biogeochemical cycling of20
nitrogen. Seasonal variations in water volumes influenced nitrate concentration towardsthe mouth. During the modelled period, the trend of simulated result was consistentwith the field data. In Fig. 6, the solid line represents the estimated annual mean nitrateconcentration during summer periods which showed to be highly variable. The dottedline represents the annual nitrate concentration during winter periods. At the headwater25
(0 km, around Hualqui) observed nitrate and ammonium were lower than in the river
716

HESSD12, 705–738, 2015
Inter-annualvariability of
dissolved inorganicnitrogen in the Biobío
River
M. Yévenes et al.
Title Page
Abstract Introduction
Conclusions References
Tables Figures
J I
J I
Back Close
Full Screen / Esc
Printer-friendly Version
Interactive Discussion
Discussion
Paper
|D
iscussionP
aper|
Discussion
Paper
|D
iscussionP
aper|
mouth. The model showed an increase in winter nitrate and ammonium concentrationsover time, most evidently in the case of nitrate (Fig. 6). A slight production of NH4 withinthe river mouth was observed.
Concentrations of nitrate in winter, during higher river discharges, were higher thanthose measured during summer. An exception occurred during summer 2008 where5
the highest nitrate values were observed (Fig. 6); the lowest concentrations of oxy-gen were recorded during summer. Oxygen levels were relatively constant during bothseasons. However, for every modeled year, differences in the mouth of the river wereobserved. In winter, oxygen values were high, whereas during summer, significant oxy-gen depletion was detected in the first measured site of the Ralco station, related to10
minimal oxygen concentrations values (< 259 µmolL−1).The model was used to estimate the nitrate and ammonium production and con-
sumption in the river (Table 3). Most of the nitrate in the estuary was produced/importedfrom the river (Fig. 6). The majority of the nitrate imported from upstream was partiallytransported to the estuary.15
4 Discussion
Nitrate represents a mobile and biologically reactive fraction of the total N pool thatmay originate from different sources in a river. Previous studies have suggested thatinter-annual and seasonal nitrate variation from rivers in central Chile remain uncertain(Pizarro et al., 2010). The present study found that DIN has spatially and temporally20
increased in the Biobío River (i.e. three times higher), especially during wet periodsand in 2011–2012 during wet events in the summer (Figs. 2c and 6). This suggeststhat wet periods may increase nitrate leaching and runoff to the river especially in areaswith more leaching and runoff potential (Kaushal et al., 2014), and therefore carry anincreased nitrate load (Table 3).25
717

HESSD12, 705–738, 2015
Inter-annualvariability of
dissolved inorganicnitrogen in the Biobío
River
M. Yévenes et al.
Title Page
Abstract Introduction
Conclusions References
Tables Figures
J I
J I
Back Close
Full Screen / Esc
Printer-friendly Version
Interactive Discussion
Discussion
Paper
|D
iscussionP
aper|
Discussion
Paper
|D
iscussionP
aper|
4.1 Changes in spatial pattern of DIN along time
As expected, the DIN concentration in the riverine water are generally higher in thelower than in the upper reaches of the river, probably due to the accumulated flux ofchemical weathering and runoff from the catchment (Table 2). As shown in Fig. 5, sta-tions located at upper reaches show lower DIN, and BOD values, but higher oxygen5
levels (Table 2). This distribution is typical of healthy surface water (WHO, 2012). Distri-butions in the headwaters of the Biobío river watershed are due to vegetation cover inthe uplands with dense native forest (Fig. 4), soils with low cation exchange capacities(Stolpe, 2006), and less human impacts (except in the Ralco dam with high DIN values,located at the Ralco station). All these factors contribute to the found low solute concen-10
trations. On the contrary, stations collected from the lower reaches are characterizedby higher nitrate values, suggesting important DIN concentration inputs in this part ofthe catchment. The significant increase of nitrate concentration in the Biobío water-shed can also be explained by the increase in forestry (silviculture) and manufacturingactivities during the last decade (Habit et al., 2006). Certainly, nitrate concentrations15
in reaches draining from urban and industrial sub-catchments are higher than thosedraining from predominantly agricultural sub catchments (Fig. 4). Other studies for theBiobío showed a clear historical increase in nitrate attributed mainly to industrial ac-tivity and forestry for the last two decades (Pizarro et al., 2010). At a regional level,the presence of abundant deciduous trees and annual grasses have little capacity to20
take up nutrients after senescence which allows nutrient pools, especially nitrate, toaccumulate up to high levels (Hart et al., 1993; Ahearn et al., 2004). These nutrientsare rapidly leached at the beginning of the winter season.
The impact of various land uses on the hydrochemistry of the river can be bestobserved when the catchment ecosystem is hydrologically connected with local water-25
ways (Aheard et al., 2004; Aguayo et al., 2009). During summer periods when appar-ently this hydrological connection is not present, the chemistry throughout the water-shed varies minimally, but during high precipitation in winter the terrain is connected
718

HESSD12, 705–738, 2015
Inter-annualvariability of
dissolved inorganicnitrogen in the Biobío
River
M. Yévenes et al.
Title Page
Abstract Introduction
Conclusions References
Tables Figures
J I
J I
Back Close
Full Screen / Esc
Printer-friendly Version
Interactive Discussion
Discussion
Paper
|D
iscussionP
aper|
Discussion
Paper
|D
iscussionP
aper|
to the river and a wide fluctuation in chemistry can be observed between the sites innearly all of the measured constituents (Table 2). Comparing the data from headwa-ter, mid-section and downstream, we can see that each site responds differently toseasonal change. In headwaters (site BB0) the lowest chemical variability is exhibit be-tween seasons for the analyzed parameters. Meanwhile, in the river mouth (site BB13)5
the highest chemical variability is observed between seasons. Therefore, spatial loca-tion within the watershed affects the seasonal variability in hydrochemistry.
4.2 Seasonal and inter-annual variability
Seasonal variations mainly in nitrate and oxygen concentrations in the river, allows thedifferentiation of DIN levels between winter and summer. We observed that chemical10
variations in the river are mainly controlled by the high flows. During winter seasonshigh discharges carrying high concentrations of nitrate, ammonium and oxygen, dif-fer from those during summer periods (Fig. 5). Exceptions occurred during summer2006 and 2008, where extreme values reaching 30 µmolL−1 were observed in the rivermouth, and important rainfall events and high river flow were also recorded (Fig. 2b15
and c, DGA, 2014). Vega-Villarrubia et al. (2012) identified that ENSO, showed highlysignificant correlations with nitrate concentrations in a Spanish river suggesting thatit is a driver of large nitrate inputs to river. Apparently, ENSO extreme negative andpositive phases can significantly influence on climatic conditions in Europe, affectingprecipitation in spring and autumn (Mariotti et al., 2002), and during winter (Brönni-20
mann et al., 2007; Vega-Villarrubia et al., 2012). The 1990s and 2000s were activeENSO decades, and our results indicated that high rainfall and river flow from 2005and 2006 (moderate to weak El Niño events) was correlated with nitrate concentra-tions. We observed a strong correlation (r = 0.54) between nitrate concentrations andthe ONI indices during the winter and summer of El Niño and Niña and correlate of25
0.50 between nitrate concentrations and El Niño (Fig. 7a and b). This suggests thatENSO could influence nitrate concentrations in the Biobío River probably due to thefrequent runoff of allochthonous nitrate from the catchment to the river during winter,
719

HESSD12, 705–738, 2015
Inter-annualvariability of
dissolved inorganicnitrogen in the Biobío
River
M. Yévenes et al.
Title Page
Abstract Introduction
Conclusions References
Tables Figures
J I
J I
Back Close
Full Screen / Esc
Printer-friendly Version
Interactive Discussion
Discussion
Paper
|D
iscussionP
aper|
Discussion
Paper
|D
iscussionP
aper|
and occasionally during summer storms. It appears that climatic conditions may playa considerable role in influencing watershed N export (Kaushal et al., 2008).
Some studies have described that sometime during summer an inverse relationshipbetween nitrate concentration and river discharge can be observed (Melack and Sick-man, 1995). However rain events after an extended dry season, can produce a solute5
flushing effect (Ahearn et al., 2004). Apparently, in the Biobío River this flushing effectwas observed principally during summer 2008 (Fig. 5). These rainfall events can gen-erate leaches of nitrate-rich water from the soil horizons into the main river (Muscuttet al., 1990; Neal et al., 2004) which explain the high values of DIN in these peri-ods. Subsequently, low concentrations of nitrate and ammonium were observed, which10
could be explained by the ongoing rain events that drain through soil horizons that havealready had accumulated solutes flushed out, creating a negative relationship betweendischarge and solute concentration (Ahearn et al., 2004).
The response of inter-annual variability in nitrate and ammonium levels to climaticvariability was relatively high compared to observations in other watersheds with simi-15
lar characteristics in Chile (Pizarro et al., 2010). Although mean annual concentrationsof nitrate varied inter-annually from 2004 to 2012, it is important to note that concen-trations in the river strongly increased with river flow. Water flow depletion due to lowrainfall was observed which may have altered river watershed functionality.
4.3 Processes controlling DIN reactivity along the river20
The 1-D model results indicated that nitrification is apparently the most important pro-cess in the river mouth and a sizable quantity of oxygen is consumed during summer(Fig. 6) as a product of ammonium oxidation. Since the model reproduces the spatialpatterns of yearly averaged concentrations of nitrate, ammonium, oxygen, and DBO5for each of the eight years, model rates can be used to compile budgets. The model es-25
timates an average nitrate budget of 159 megamole (0.159 Gmolyr−1) in the years 2004to 2012, which is apparently high in the context of previous estimates of nitrate (Lenizet al., 2012). Nitrate along the river transect is mainly governed by nitrate production
720

HESSD12, 705–738, 2015
Inter-annualvariability of
dissolved inorganicnitrogen in the Biobío
River
M. Yévenes et al.
Title Page
Abstract Introduction
Conclusions References
Tables Figures
J I
J I
Back Close
Full Screen / Esc
Printer-friendly Version
Interactive Discussion
Discussion
Paper
|D
iscussionP
aper|
Discussion
Paper
|D
iscussionP
aper|
by nitrification and nitrate consumption. It can be observed that ammonium concentra-tion is mainly the result of the interaction between nitrification and advective-dispersivetransport, with ammonium exports to the mouth. The oxygen budget is apparently dom-inated by oxygen consumption probably due to nitrification (Fig. 7).
In the case of oxygen concentrations, levels remained relatively constant and showed5
a clear seasonal trend; with higher values (around 300 µmolL−1) at 0 and 40 km asa consequence of better ventilation of the water and/or influence of marine water inthe river mouth. Nitrate variability is the result of the increase in the magnitude of bio-geochemical transformations and in some cases from in situ production. The latteris probably a result of important productivity processes occurring at the river mouth10
(Leniz et al., 2012; Vargas et al., 2013). Spatial DIN distribution in summer revealed anincrease of DIN from the most fluvial influence station to the adjacent ocean, suggest-ing that the coastal area is both a source of DIN into the river mouth and a sink of thisnutrient due to internal cycling. This pattern was more pronounced in summer duringcoastal upwelling events, and to a lower extent in winter when these events cease,15
supporting the effect of nitrate rich water advection into the river (Daniel et al., 2013).Historical nitrate loads from the Biobío River watersheds apparently responded
strongly to climatic conditions. During winter, the mean nitrate load concentrations inthe river, towards the coastal sea, clearly showed that nitrate and ammonium were ex-ported into the coastal sea during 2004 to 2008 (Table 3). However after 2008, nitrate20
concentrations decreased towards the mouth. This suggests that during winters withdrought trends nitrate concentrations were lower than during wet years, due mainlyto lower river flow and low biological demand. Saldias et al. (2012) indicated that theBiobío River had a turbid river plume during winter, with a seasonal peak in dischargeand plume area during July and August. Therefore, the incidence of turbid waters dur-25
ing wet periods (winter) can be an important driver of nutrient input towards the rivermouth and the coastal sea.
Nitrate export estimations showed low nitrate loadings during summer as a resultof the decrease in the volume of water. Downstream, a decrease in more than 40 %
721

HESSD12, 705–738, 2015
Inter-annualvariability of
dissolved inorganicnitrogen in the Biobío
River
M. Yévenes et al.
Title Page
Abstract Introduction
Conclusions References
Tables Figures
J I
J I
Back Close
Full Screen / Esc
Printer-friendly Version
Interactive Discussion
Discussion
Paper
|D
iscussionP
aper|
Discussion
Paper
|D
iscussionP
aper|
of the water flow has been recorded from the data between 2009 and 2012. In winter(July 2004), 87±31 t of nitrate were added to the river continuum per day at the stationBB11, while during summer (December 2004) only 5 t were added per day. Significantwater volume reduction occurred in the winters between 2009 and 2012 (Fig. 7), overthe BB8 station which resulted in nitrate increases. This indicates a decrease in the ni-5
trate load (28 tN±19 t) in July 2012 and decreases (11±12 t nitrate) during summers ofthe same period (Table 3). During 2006, a drought year, higher values of nitrate loadswere observed during summer (22±8 t nitrate). With these results it was observed thatyears with lowest precipitation, also reduced the water flow and the nitrate loading inthe river. Large scale decreases in water volume in the river as a result of climatic10
variability or anthropogenic activities could affect nitrogen distribution and primary pro-duction in the system. Best and Lowry (2014), suggested that in the near future intensewater demand worldwide will require large volumes of river water to supply urban andindustrial needs, which would be extracted from regions with ample fresh water re-sources. However, it is necessary to investigate potential feedbacks from the rivers15
to this impact. It would not be enough to quantify the potential effects using a typicalwater budget approach. Focusing on water quantity, together other lines of researchconcerning biogeochemistry and water quality, introduces an important perspective tothis important issue.
5 Conclusion20
This study suggests that climatic variability, urban and deforested areas exert a strongcontrol on water chemistry in the Biobío River watershed. The remarkable importanceof relatively long-term quantification of riverine nutrient variability is reflected in thebiogeochemical variables. DIN concentrations in the river appear to be largely con-trolled by riverine nitrate loads. The temporal variability of precipitations and discharge25
is positively correlated with nitrate loads and concentrations. Nitrate and ammonium inBiobío River, mainly from the downstream section, is controlled apparently by external
722
HESSD12, 705–738, 2015
Inter-annualvariability of
dissolved inorganicnitrogen in the Biobío
River
M. Yévenes et al.
Title Page
Abstract Introduction
Conclusions References
Tables Figures
J I
J I
Back Close
Full Screen / Esc
Printer-friendly Version
Interactive Discussion
Discussion
Paper
|D
iscussionP
aper|
Discussion
Paper
|D
iscussionP
aper|
sources through advection of nitrate carried into the river mouth, by internal biogeo-chemical transformations that consume nitrate (i.e. assimilation, denitrification) in themid-section of the river, this produce nitrate (i.e nitrification) in the river mouth. Theanalyses demonstrate that there is an influence of climate on riverine DIN concentra-tions; high DIN production occurs during wet years, while high consumption occurs dur-5
ing dry years. Extremely reduced river flow and drought during summer also stronglyaffects the annual DIN concentration, reducing the DIN production.
By using data of nitrogen, water quality parameters and 1-D reactive transportecosystem modeling, we have detected seasonal and inter-annual variability in theBiobío River, South-Central Chile. The modelling approach developed for this study10
highlights the determinant role of the spatio-temporal variability, surface area, andvolume in the nitrogen biogeochemical dynamics. These results indicate a need tocontinue conducting studies using high frequency data acquisition systems. In futureresearch, relation of storms and nutrient uptake, sources and sinks can be quantifiedthrough isotopic composition investigation of the waters and sediment. Finally, we iden-15
tify a need for further investigations of nitrate sources (natural and anthropogenic), andretention in the watershed in response to dry and wet events, and climatic variability.
Acknowledgements. To Centro EULA from University of Concepción for providing the data andconducting the water sampling and chemical analysis of surface waters of Biobío River. TheNational Water Direction (DGA) collected precipitation and river flow data. It is a contribution to20
CONICYT/FONDAP program 15110009 and 15130015.
References
Aguayo, M., Pauchard, A., Azócar, G., and Parra, O.: Cambio del uso del suelo en el centro surde Chile a fines del siglo XX. Entendiendo la dinámica espacial y temporal del paisaje, Rev.Chil. Hist. Nat., 82, 361–374, 2009.25
Ahearn, D. S., Sheibley, R. W., Dahlgren, R. A., and Keller, K. E.: Temporal dynamics of streamwater chemistry in the last free-flowing river draining the western Sierra Nevada, California,J. Hydrol., 295, 47–63, 2004.
723

HESSD12, 705–738, 2015
Inter-annualvariability of
dissolved inorganicnitrogen in the Biobío
River
M. Yévenes et al.
Title Page
Abstract Introduction
Conclusions References
Tables Figures
J I
J I
Back Close
Full Screen / Esc
Printer-friendly Version
Interactive Discussion
Discussion
Paper
|D
iscussionP
aper|
Discussion
Paper
|D
iscussionP
aper|
Alexander, R. B., Bohlke, J. K., Boyer, E. W., David, M. B., Harvey, J. W., Mulholland, P. J.,Seitzinger, S. P., Tobias, C. R., Tonitto, C., and Wollheim, W. M.: Dynamic modeling of nitro-gen losses in river networks unravels the coupled effects of hydrological and biogeochemicalprocesses, Biogeochemistry, 93, 91–116, doi:10.1007/s10533-008-9274-8, 2009.
Best, L. and Lowry, C. S.: Quantifying the potential effects of high-volume water extractions on5
water resources during natural gas development: Marcellus Shale, NY, J. Hydrol. Reg. Stud.,1, 1–16, doi:10.1016/j.ejrh.2014.05.001, 2014.
Boyer, E. W., Goodale, C. L., Jaworski, N. A., and Howarth, R. W.: Anthropogenic nitrogensources and relationships to riverine nitrogen export in the northeastern USA, Biogeochem-istry, 57/58, 137–169, 2002.10
Brönnimann, S., Ewen, T., Griesser, T., and Jenne. R.: Multidecadal signal of solar variability inthe upper troposphere during the 20th century, Space Sci. Rev., 125, 305–315, 2007.
Cerro, I., Sanchez-Perez, J. M., Ruiz-Romera, E., and Antigüedad, I.: Variability of particulate(SS, POC) and dissolved (DOC, NO3) matter during storm events in the Alegria agriculturalwatershed, Hydrol. Process., doi:10.1002/hyp.9850, in press, 2013.15
Conley, D. J., Paerl, H. W., Howarth, R. W., Boesch, D. F., Seitzinger, S. P., Havens, K. E.,Lancelot, C., and Likens, G. E.: Controlling eutrophication: nitrogen and phosphorus, Sci-ence, 323, 1014–1015, doi:10.1126/science.1167755, 2009.
Claret, M., Urrutia, R., Ortega, R., Best, S., and Valderrama, N.: Quantifying nitrate leaching inirrigated wheat with different nitrogen fertilization strategies in an Alfisol, Chil. J. Agr. Res.,20
71, 148–156, 2011.Dahnke, K., Bahlmann, E., and Emeis, K. C.: A nitrate sink in estuaries? An assessment by
means of stable nitrate isotopes in the Elbe estuary, Limnol. Ocean., 53, 1504–1511, 2008.Daniel, I., DeGrandpre, M., and Farías, L.: Greenhouse gas emissions from the Tubul-Raqui
estuary (central Chile 36◦ S), Estuar. Coast. Shelf S., 134, 31–44, 2013.25
Debels, P., Figueroa, R., Urrutia, R., Barra, R., and Niell, X.: Evaluation of water quality in theChillán river (Central Chile) using physicochemical parameters and a modified water qualityindex, Environ. Monit. Assess., 110, 301–322, 2005.
Echeverría, C., Coomes, D., Salas, J., Rey-Benayas, J. M., Lara, A., and Newton, A.: Rapiddeforestation and fragmentation of Chilean temperate forests, Biol. Conserv., 130, 481–494,30
2006.EEA: The European Environment: State and outlook 2010, Water Resources: Quantity and
flows, European Environmental Agency, Copenhagen, 36 pp., 2010.
724
HESSD12, 705–738, 2015
Inter-annualvariability of
dissolved inorganicnitrogen in the Biobío
River
M. Yévenes et al.
Title Page
Abstract Introduction
Conclusions References
Tables Figures
J I
J I
Back Close
Full Screen / Esc
Printer-friendly Version
Interactive Discussion
Discussion
Paper
|D
iscussionP
aper|
Discussion
Paper
|D
iscussionP
aper|
García, A., Jorde, K., Habit, E., Caamaño, D., and Parra, O.: Downstream environmental effectsof Ralco and Pangue dam operations: changes in habitat quality for native fish species,Biobío River, Chile River Res. Appl., 27, 312–327, 2011.
Grantham, T. E., Figueroa, R., and Prat, N.: Water management in mediterranean river basins:a comparison of management frameworks, physical impacts, and ecological responses, Hy-5
drobiologia, 719, 451–482, 2013.Habit, E., Belk, M., Tuckfield, C., and Parra, O.: Response of the fish community to human-
induced changes in of the Biobío River in Chile, Freshwater Biol., 51, 1–11, 2006.Hart, S. C., Firestone, M. K., Paul, E. A., and Smith, J. L.: Flow and fate of soil nitrogen in an
annual grassland and a young mixedconifer forest, Soil Biol. Biochem., 25, 431–442, 1993.10
Jentsch, A., Kreyling, J., and Beierkuhnlein, C.: A new generation of climate change experi-ments: events, not trends, Front. Ecol. Environ., 5, 365–374, 2007.
Jordan, T. E., Weller, D. E., and Correll, D. L.: Sources of nutrient inputs to the Patuxent Riverestuary, Estuaries, 26, 226–243, 2003.
Karrasch, B., Parra, O., Cid, H., Mehrens, M., Pacheco, P., Urrutia, R., Valdovinos, C., and15
Zaror, C.: Effects of pulp and paper mill effluents on the microplankton and microbial self-purification capabilities of the Biobio River, Chile, Sci. Total Environ., 359, 194–208, 2006.
Kaushal, S. S., Groffman, P. M., Band, L. E., Shields, C. A., Morgan, R. P., Palmer, M. A.,Belt, K. T., Fisher, G. T., Swan, C. M., and Findlay, S. E. G.: Interaction between urbanizationand climate variability amplifies watershed nitrate export in Maryland, Environ. Sci. Technol.,20
42, 5872–5878, doi:10.1021/es800264f, 2008.Kaushal, S. S., McDowell, W. H., and Wollheim, W. M.: Tracking evolution of urban biogeochem-
ical cycles: past, present, and future, Biogeochemistry, 121, 1–21, doi:10.1007/s10533-014-0014-y, 2014.
Kemp, W. M., Boynton, W. R., Adolf, J. E., Boesch, D. F., Boicourt, W. C., Brush, G., Corn-25
well, J. C., Fisher, T. R., Glibert, P. M., Hagy, J. D., Harding, L. W., Houde, E. D., Kimmel, D. G.,Miller, W. D., Newell, R. I. E., Roman, M. R., Smith, E. M., and Stevenson, J. C.: Eutrophica-tion in Chesapeake Bay: historical trends and ecological interactions, Mar. Ecol.-Prog. Ser.,303, 1–29, 2005.
Lehmann, M. F., Sigman, D. M., and Berelson, W. M.: Coupling the 15N/14N and 18O/16O of30
nitrate as a constraint on benthic nitrogen cycling, Mar. Chem., 88, 1–20, 2004.
725
HESSD12, 705–738, 2015
Inter-annualvariability of
dissolved inorganicnitrogen in the Biobío
River
M. Yévenes et al.
Title Page
Abstract Introduction
Conclusions References
Tables Figures
J I
J I
Back Close
Full Screen / Esc
Printer-friendly Version
Interactive Discussion
Discussion
Paper
|D
iscussionP
aper|
Discussion
Paper
|D
iscussionP
aper|
Leniz, B., Vargas, C., and Ahumada, R.: Characterization and comparison of microphytoplank-ton biomass in the lower reaches of the Biobío River and the adjacent coastal area off CentralChile during autumn-winter conditions, Lat. Am. J. Aquat. Res., 40, 847–857, 2012.
Marcé, R., Rodríguez-Arias, M. A., García, J. C., and Armengol, J.: El Niño Southern Oscilla-tion and climate trends impact reservoir water quality, Global Change Biol., 16, 2857–2865,5
2010.Mariotti, A., Zeng, N., and Lau, K.-M.: Euro-Mediterranean rainfall and ENSO – a seasonally
varying relationship, Geophys. Res. Lett., 29, 1621, doi:10.1029/2001GL014248, 2002.Melack, J. M. and Sickman, J. O.: Snowmelt induced chemical changes in Sierra Nevada
streams, in: Biogeochemistry of Seasonally Snow-Covered Catchments, edited by: Ton-10
nessen, K. A., Williams, M. W., and Tranter, M., Proceedings, IAHS Publications, Boulder,CO, 221–234, 1995.
Meybeck, M.: Carbon, nitrogen and phosphorous transport by world rivers, Am. J. Sci., 282,401–450, 1982.
Meza, F. J., Wilks, D. S., Gurovich, L., and Bambach, N.: Impacts of climate change on irrigated15
agriculture in the Maipo Basin, Chile: reliability of water rights and changes in the demandfor irrigation, J. Water Res. Pl.-ASCE, 138, 421–430, 2012.
Monteith, D. T., Evans, C. D., and Reynolds, B.: Are temporal variations in the nitrate content ofUK upland freshwaters linked to the North Atlantic Oscillation?, Hydrol. Process., 14, 1745–1749, 2000.20
Muscutt, A. D., Wheater, H. S., and Reynolds, B.: Stormflow hydrochemistry of a small Welshupland catchment, J. Hydrol., 116, 239–249, 1990.
Neal, C., Skeffington, R., Neal, M., Wyatt, R., Wickham, H., Hill, L., and Hewitt, N.: Rainfalland runoff water quality of the Pang and Lambourn, tributaries of the River Thames, south-eastern England, Hydrol. Earth Syst. Sci., 8, 601–613, doi:10.5194/hess-8-601-2004, 2004.25
Palmer, M. A., Lettenmaier, D. P., Poff, N. L., Postel, S. L., Richter, B., and Warmer, R.: ClimateChange and River Ecosystems: protection and Adaptation Options, Environ. Manage., 44,1053–1068, 2009.
Parra, O. and Díaz, M. E.: Programa de Monitoreo de la calidad del agua del Sistema ríoBiobío 1994–2012, Aplicación del anteproyecto de norma de la calidad del agua del río30
Biobío, Universidad de Concepción, Concepción, 165 pp., 2013.Parra, O., Rojas, J., and Zaror, C.: Chile Rumbo al Desarrollo: Miradas Críticas, Comisión Na-
cional Chilena de Cooperación – Organización de las Naciones Unidas para la Educación
726

HESSD12, 705–738, 2015
Inter-annualvariability of
dissolved inorganicnitrogen in the Biobío
River
M. Yévenes et al.
Title Page
Abstract Introduction
Conclusions References
Tables Figures
J I
J I
Back Close
Full Screen / Esc
Printer-friendly Version
Interactive Discussion
Discussion
Paper
|D
iscussionP
aper|
Discussion
Paper
|D
iscussionP
aper|
(UNESCO), in: Desafíos Ambientales para un Desarrollo Sustentable, edited by: Cousiño, F.and Foxley, A. M., Comision Nacional Chilena con UNESCO, Santiago, Chile, 203–240,2012.
Pizarro, J., Vergara, P., Rodríguez, J., Sanhueza, J., and Castro, J.: Nutrients dynamics in themain river basins of the centre-southern region of Chile, J. Hazards Mater., 175, 608–613,5
2010.Regnier, P., Slomp, C., and Jourabchi, P.: Reactive-transport modeling as a technique for under-
standing coupled biogeochemical processes in surface and subsurface environments, Neth.J. Geosci., 82, 5–18, 2003.
Salamanca, M. and Pantoja, S.: Caracterización química en la zona marina adyacente a la10
desembocadura del río Itata, in: La cuenca hidrográfica del río Itata, edited by: Parra, O.,Castilla, J. C., Romero, H., Quiñones, R., and Camaño, A., La cuenca hidrográfica del ríoItata, Editorial universidad de Concepción, Concepción, Chile, 177–191, 2009.
Saldías, G. S., Sobarzo, M., Largier, J., Moffat, C., and Letelier, R.: Seasonal variability ofturbid river plumes off central Chile based on high-resolution MODIS imagery, Remote Sens.15
Environ., 123, 220–233, 2012.Scheffer, M., Bascompte, J., Brock, W. A., Brovkin, V., Carpenter, S. R., and Dakos, V.: Early-
warning signals for critical transitions, Nature, 461, 53–59, 2009.Scott, D. and Prinsloo, F.: Longer-term effects of pine and eucalypt plantations on streamflow,
Water Resour. Res., 44, 1–8, 2008.20
Seitzinger, S. P.: Denitrification in freshwater and coastal marine ecosystems: ecological andgeochemical significance, Limnol. Oceanogr., 33, 702–724, 1988.
Seitzinger, S. P., Kroeze, C., and Styles, R. V.: Global distribution of N2O emission from sys-tem: natural emissions and antropoigenic effects, Chemos. Global Change Sci., 2, 267–279,2000.25
Sobarzo, M., Bravo, L., Donoso, D., Garces-Vargas, J., and Schneider, W.: Coastal upwellingand seasonal cycles that influence the water column over the continental shelf off centralChile, Progr. Oceanogr., 75, 363–382, 2007.
Soetaert, K. and Herman, P. M.: A Practical Guide to Ecological Modelling. Using R as a Sim-ulation Platform, Springer, 2009.30
Soetaert, K. and Meysman, F.: Reactive transport in aquatic ecosystems: rapid model proto-typing in the open source software R, Environ. Modell. Softw., 32, 49–60, 2012.
727

HESSD12, 705–738, 2015
Inter-annualvariability of
dissolved inorganicnitrogen in the Biobío
River
M. Yévenes et al.
Title Page
Abstract Introduction
Conclusions References
Tables Figures
J I
J I
Back Close
Full Screen / Esc
Printer-friendly Version
Interactive Discussion
Discussion
Paper
|D
iscussionP
aper|
Discussion
Paper
|D
iscussionP
aper|
Soetaert, K., Middelburg, J., Heip, C., Meire, P., Van Damme, S., and Maris, T.: Long-termchange in dissolved inorganic nutrients in the heterotrophic Scheldt estuary (Belgium, theNetherlands), Limnol. Oceanogr., 51, 409–423, 2006.
Stehr, A., Debels, P., and Arumi, J. L.: Modelling hydrological response to climate change;experiences from two south-central Chilean Watersheds, in: Proceedings of the International5
Conference on Watershed Technology: Improving Water Quality and Environment. AmericanSociety of Agricultural and Biological Engineers, Concepción, Chile, 2008.
Stehr, A., Bohle, G., Caamaño, D., Link, O., Monsalve, A., Caamaño, F., Torres, P., andAguayo, M.: Evaluation of different spatial discretization schemes in the hydrological re-sponse of an Andean watershed, International SWAT conference, 5–7 August 2009, Boulder,10
Colorado, USA, 2009.Stolpe, N. B.: Descripciones de los Principales Suelos de la VIII Región de Chile, Departamento
de Suelos y Recursos naturales, Universidad de Concepción, Concepción, 2006.Stuart, M. E., Goody, D. C., Bloomfield, J. P., and Williams, A. T.: A review of the impact of
climate change on future nitrate concentrations in groundwater of the UK, Sci. Total Environ.,15
409, 2859–2873, 2011.UNESCO: Water in a Changing World, Report 3, The United Nations World Water Develop-
ment, the Netherlands, 318 pp., 2009.Valdovinos, C., Mancilla, G., and Figueroa, R.: Biodiversidad dulceacuícola de Chile central:
macroinvertebrados bentónicos del río Itata, in: La cuenca hidrográfica del río Itata, edited20
by: Parra, O., Castilla, J. C., Romero, H., Quiñones, R., and Camaño, A., Editorial Universi-dad de Concepción, Concepción, Chile, 111–125, 2009.
Vargas, C., Arriagada, L., Sobarzo, L., Contreras, P., and Saldías, G.: Bacterial production alonga river to ocean continuum in Central Chile: implications for organic matter cycling, Aquat.Microb. Ecol., 68, 195–213, 2013.25
Vegas-Vilarrúbia, T., Sigró, J., and Giralt, S.: Connection between El Niño–Southern Oscillationevents and river nitrate concentrations in a Mediterranean river, Sci. Total Environ., 426,446–453, 2012.
Wang, X., Mannaerts, C. M., Yang, S., Gao, Y., and Zheng, D.: Evaluation of soil nitrogen emis-sions from riparian zones coupling simple process – oriented models with remote sensing30
data, in: Sci. Total Environ., 40816, 3310–3318, 2010.WHO: http://www.who.int/water_sanitation_health/hygiene/en/ (last access: 25 Septem-
ber 2014), 2012.
728

HESSD12, 705–738, 2015
Inter-annualvariability of
dissolved inorganicnitrogen in the Biobío
River
M. Yévenes et al.
Title Page
Abstract Introduction
Conclusions References
Tables Figures
J I
J I
Back Close
Full Screen / Esc
Printer-friendly Version
Interactive Discussion
Discussion
Paper
|D
iscussionP
aper|
Discussion
Paper
|D
iscussionP
aper|
Table 1. Monitoring stations on the Biobío River. Coordinates are WGS84 values.
Station Id Station name River(km)
Latitude Longitude Riveraffluent
Urban(No.)
Relatedindustries
ABB0 Ralco 90 38◦31′59′′ 72◦21′28′′ –BB0 Pangue 140 38◦07′62′′ 78◦30′44′′ –BB1 Callaqui 180 37◦50′29′′ 71◦41′27′′ –BB3 Puente
Coigue220 37◦33′33′′ 72◦35′15′′ Los
Angeles:165 655Laja:22 450
Hydroelectricdams pine kraft pulp mill(3.60 ktyr−1)Sugar roduction600 t sugarday−1
Seeding 31.24–5 leaves 92End of tiller 92Total 215.2 (Nitrogen fertilizerinput) Producer fertilization(Farmers)∗
BB4 Nascimiento 250 37◦29′53′′ 72◦36′38′′ Vergara Angol:48 966 Eucalyptus kraft pulp milleffluent(> 1 Mtyr−1),WWTP effluent
BB7 San Rosendo 285 37◦15′36′′ 72◦44′13′′ Eucalyptus kraft pulp milleffluent(> 1 Mtyr−1)
BB8 Santa Juana 320 37◦10′25′′ 72◦53′48′′ Eucalyptus kraft pulp milleffluent(> 1 Mtyr−1)Agriculture 211.800 ha
DGA1 Sta. Juana-Patagual
328 37◦10′00′′ 72◦56′00′′ Santa Juana:12 713
DGA2 Hualqui 360 36◦58′57′′ 72◦56′29’ Hualqui: 18 768 Oil refineries metallurgickraft pulp mills (130 ktyr−1)
BB11 Concepción 365 36◦50′58′′ 73◦03′52′′ Concepción:972 741
DGA3 La Mochita 365 36◦50′00′′ 73◦03′00′′ San Pedro:67 892
DGA4 South river mouth 370 36◦51′00′′ 73◦05′00′′
DGA5 North river mouth 370 36◦50′00′′ 73◦05′00′′
BB13 River mouth (Es-tuary)
380 36◦08′49′′ 73◦08′32′′
∗ Claret et al. (2011); Parra and Diaz (2013).
729

HESSD12, 705–738, 2015
Inter-annualvariability of
dissolved inorganicnitrogen in the Biobío
River
M. Yévenes et al.
Title Page
Abstract Introduction
Conclusions References
Tables Figures
J I
J I
Back Close
Full Screen / Esc
Printer-friendly Version
Interactive Discussion
Discussion
Paper
|D
iscussionP
aper|
Discussion
Paper
|D
iscussionP
aper|
Table 2. Averaged values of chemical parameters for winter and summer for each station in theBiobío River. Units are in µmolL−1 for nitrate, nitrite, ammonium, dissolved oxygen and BOD.Temperature (T ) in ◦C. Conductivity in µ SC and Total suspended solid in mg L−1
Season T pH Cond TSS O2 DBO5 NO3 NO2 NH4
ABB0 Winter 7.3±3.6 7.2±0.45 64±16 24.4±36.8 368±22 43±22 3.87±2.74 0.11±0.00 3.89±7.784-16.3 6.4–7.9 43–85 1.3–126 300–368 19–94 0.81–9.19 0.11–0.11 1.11–23.89
Summer 18.9±1.8 7.4±0.29 47±7.9 18.7±31.7 289±24 37.5±9.4 0.81±0.00 0.11±0.00 1.61±1.2817–21.6 7.1–7.9 36–60 1–126 259–331 31–59 0.81–0.81 0.11–0.13 1.11–4.44
BB0 Winter 6.1±1.1 7.4±0.45 74±18 19.8±62 367±16 37±6.25 2.26±0.97 0.11±0.00 1.9±1.54–7.5 6.6–8.3 51–99 1–265 337–386 31–44 0.81–3.39 0.00–0.11 1.1–5.5
Summer 12.3±1.8 7.6±0.4 80±12 14.3±50.4 339±10 41±15 0.97±0.48 0.13±0.04 1.3±0.728.2–19.3 6.8–8.6 53–100 1–266 319–353 32–75 0.11–1.61 0.11–0.22 1.1–4.4
BB1 Winter 6.1±1.1 7.3±0.3 60±9.7 2.8±2.8 373±25 37±5.7 2.42±0.48 0.11±0.00 2.22±3.124–7.7 6.8–7.7 41–72 1–13.5 312–403 31–47 1.94–3.23 0.11–0.11 1.11–11
Summer 14±2.6 7.4±0.3 55.4±12 2.5±2.4 333±17 38±9.4 0.81±0.32 0.11±0.00 1.39±0.788.2–20.5 6.8–7.9 40–81 1–13.5 313–356 31.25–56 1.13–1.61 0.11–0.13 1.11–3.33
BB3 Winter 8.9±0.6 7.48±0.26 56±10 12±10.5 347±19 34±5.3 11.61±3.71 0.11±0.02 1.7±2.77.9–9.6 7.07±7.7 42–66 3.5–35 318–365 32–44 7.10–16.94 0.11–0.17 1.1–8.3
Summer 18.4±1.3 7.7±0.3 70±20 8.7±9.5 320±30 37±10. 1.13±2.74 0.11±0.00 2.56±1.7212.1–22 6.6–7.9 44–98 1.4±35 278–350 32–56 1.61–4.19 0.11–0.11 1.11–5.56
BB4 Winter 8.2±1.1 7.54±0.68 61±15 11.5±7.8 351±19 47±28 14.19±10. 1.50±1.70 1.4±0.66.1–9.5 6.9–9.3 42–95 3.5–35 312–375 31–100 5.81–33.8 0.11–1.43 1.11–2.8
Summer 17.3±2.3 7.7±0.6 73±15 9.3±7.2 310±21 43.±19 1.61±2.26 0.33±0.61 1.33±0.3913–22 6.4–8.7 50–141 2.8–30 278–335 31–81 0.05–6.45 0.11–1.96 1.11–2.22
BB7 Winter 9.2±0.98 7.5±0.27 87±48 15.8±12 329±18 41±12.5 7.42±16.29 0.24±0.13 1.2±1.47.5–9.9 7.1–7.8 56–171 3.7–3.7 303–353 29–65 10.65–28.71 0.11–0.39 1.11–3.3
Summer 23.9±2.7 7.7±0.2 99±23 11.4±10.9 263±15 31±1.56 2.58±6.45 0.13±0.04 1.32±0.511.0–30 7.3–7.8 49–135 2.4–37 244–281 31–34 3.23–11.29 0.11–0.20 1.11–2.22
BB8 Winter 9.8±1.35 7.2±0.25 58±12 11.5±7.8 359±13 45±16 12.10±2.74 0.13±0.04 2.65±2.908.0–12 6.9–7.6 44–83 3.6–36 113–362 31–75 7.10–16.29 0.11–0.20 1.11–9.98
Summer 21±2.9 7.6±0.47 87±24 9.5±7 270±13 33±3.4 2.10±3.87 0.13±0.02 1.28±0.5611.0–26 6.4–7.9 50–126 2.9–36 253–288 31–41 0.16–8.06 0.11–0.20 1.11–2.78
BB11 Winter 10.1±1.4 7.6±0.75 58±11 16.8±12 338±16 43±22 12.42±3.39 0.13±0.02 1.48±0.739.0–12 6.9–9.5 45–81 6.3–51.4 315–367 31–90 5.81–16.45 0.11–0.20 1.11–3.33
Summer 21.8±1.7 7.7±0.4 85±23 14±11 273±11 35±4.6 3.71±4.84 0.11±0.00 0.39±1.2212.3–27 6.7–8.3 59–124 3.6–51 259–291 0.15–12.90 0.11–0.13 1.11–2.22
BB13 Winter 10.9±1.4 7.3±0.2 80±19 15.5±18.5 315±30 53±25 18.77±6.94 0.57±0.54 18.33±37.89–13.5 7–7.7 56–111 2.8–86 246–356 31–109 4.35–29. 0.11–1.59 1.11–118
Summer 21.3±1.7 7.6±0.5 225±181 13±16 250±43 59±30. 16±17 1.09±1.30 11.89±10.713–27 6.7–8.5 12.2–3300 2.8–86 176–300 31–109 2.90–57.7 0.30–1.52 1.11–38.3
730

HESSD12, 705–738, 2015
Inter-annualvariability of
dissolved inorganicnitrogen in the Biobío
River
M. Yévenes et al.
Title Page
Abstract Introduction
Conclusions References
Tables Figures
J I
J I
Back Close
Full Screen / Esc
Printer-friendly Version
Interactive Discussion
Discussion
Paper
|D
iscussionP
aper|
Discussion
Paper
|D
iscussionP
aper|
Table 3. Nitrate load during winter and summer from 2004 to 2012 at the river mouth (BB11).
Nitrate loading (td−1)Winter Summer
2004 87±40 9±0.52005 118±75 5±9.12006 49±19 22±82007 31±18 6±0.62008 107±58 25±3.72009 73±44 11±2.82010 25±13 7±132011 87±55 8±0.82012 28±19 11±12
731
HESSD12, 705–738, 2015
Inter-annualvariability of
dissolved inorganicnitrogen in the Biobío
River
M. Yévenes et al.
Title Page
Abstract Introduction
Conclusions References
Tables Figures
J I
J I
Back Close
Full Screen / Esc
Printer-friendly Version
Interactive Discussion
Discussion
Paper
|D
iscussionP
aper|
Discussion
Paper
|D
iscussionP
aper|
Figure 1. Study area located in the Biobío River basin in Biobío region.
732

HESSD12, 705–738, 2015
Inter-annualvariability of
dissolved inorganicnitrogen in the Biobío
River
M. Yévenes et al.
Title Page
Abstract Introduction
Conclusions References
Tables Figures
J I
J I
Back Close
Full Screen / Esc
Printer-friendly Version
Interactive Discussion
Discussion
Paper
|D
iscussionP
aper|
Discussion
Paper
|D
iscussionP
aper|
Figure 2. Maximum rainfall, precipitation and River flow conditions since 1990 to 2012. (a) Max-imum rainfall events recorded at the Biobío River mouth station from 1990 to 2012. (b) Analysisof extreme precipitation events in the climatic data from Biobío River mouth station, Chile.Lower dashed line represents 25th percentile and upper line represent 75th percentile of ex-treme value distribution. Pointed line represents the river discharge (m3 s−1) at the river mouth.(c) River flow at the Biobío River mouth station.
733
HESSD12, 705–738, 2015
Inter-annualvariability of
dissolved inorganicnitrogen in the Biobío
River
M. Yévenes et al.
Title Page
Abstract Introduction
Conclusions References
Tables Figures
J I
J I
Back Close
Full Screen / Esc
Printer-friendly Version
Interactive Discussion
Discussion
Paper
|D
iscussionP
aper|
Discussion
Paper
|D
iscussionP
aper|
Figure 3. Relationship between rainfall and discharge, related to ENSO events during the stud-ied period.
734

HESSD12, 705–738, 2015
Inter-annualvariability of
dissolved inorganicnitrogen in the Biobío
River
M. Yévenes et al.
Title Page
Abstract Introduction
Conclusions References
Tables Figures
J I
J I
Back Close
Full Screen / Esc
Printer-friendly Version
Interactive Discussion
Discussion
Paper
|D
iscussionP
aper|
Discussion
Paper
|D
iscussionP
aper|
Figure 4. Land use data was interpreted from Landsat TM satellite imagery. Landsat TM im-ages (2011) of the Biobío river watershed were downloaded from the US Geological Survey,Global Visualization Viewer site. Compared with existing data from the Department of Geogra-phy at the University of Concepcion. Ten land use classes were classified as follow: (1) forest,(2) water bodies, (3) steppe, (4) scrubland, (5) snow (6), grassland (7), silviculture (8), agricul-ture (9), and urban (10).
735

HESSD12, 705–738, 2015
Inter-annualvariability of
dissolved inorganicnitrogen in the Biobío
River
M. Yévenes et al.
Title Page
Abstract Introduction
Conclusions References
Tables Figures
J I
J I
Back Close
Full Screen / Esc
Printer-friendly Version
Interactive Discussion
Discussion
Paper
|D
iscussionP
aper|
Discussion
Paper
|D
iscussionP
aper|
Figure 5. Spatial distribution of averaged chemical parameters (nitrate, ammonium, dissolvedoxygen and DBO5) in the river continuum from upstream (number 1 corresponding to ABB0station) to downstream (number 13 to BB13 station in the estuary).
736

HESSD12, 705–738, 2015
Inter-annualvariability of
dissolved inorganicnitrogen in the Biobío
River
M. Yévenes et al.
Title Page
Abstract Introduction
Conclusions References
Tables Figures
J I
J I
Back Close
Full Screen / Esc
Printer-friendly Version
Interactive Discussion
Discussion
Paper
|D
iscussionP
aper|
Discussion
Paper
|D
iscussionP
aper|
Figure 6. Fit the biogeochemical model from 2004 to 2012. Calibration was done on data for2007 to 2012. Data from 2004 to 2006 was used to validate the model. Circle symbols (◦)represent observational data.
737

HESSD12, 705–738, 2015
Inter-annualvariability of
dissolved inorganicnitrogen in the Biobío
River
M. Yévenes et al.
Title Page
Abstract Introduction
Conclusions References
Tables Figures
J I
J I
Back Close
Full Screen / Esc
Printer-friendly Version
Interactive Discussion
Discussion
Paper
|D
iscussionP
aper|
Discussion
Paper
|D
iscussionP
aper|
10-1
60
50
40
30
20
10
01.00.80.60.40.2
60
50
40
30
20
10
0
ONI index
Nitr
ate
(um
ol L
-1)
ONI index (El NIÑO)
Figure 7. Relationship between ONI index and nitrate concentrations (µmolL−1), related to (a)(left panel) positive and negative ONI values, (b) (right panel) El NIÑO events during the studiedperiod (2004–2012).
738