spatial spillovers and innovation activity in european regions
TRANSCRIPT

1 IntroductionKnowledge and technological progress are the main engines of economic dynamics inmost endogenous growth models (Romer, 1986). In the spatial context this suggeststhat local growth depends on the amount of technological activity which is carried outlocally, and possibly appropriated, and on the ability to take advantage of externaltechnological achievements (Coe and Helpman, 1995; Martin and Ottaviano, 2001).These two phenomenaölocalised knowledge and absorptive capacityöare intertwinedand, according to Audretsch and Feldman (2004), have to be jointly analysed becausethey are key factors in explaining the determinants of local technological change and,indirectly, of local economic growth. The analysis of such factors has traditionally beenaccomplished through the estimation of a knowledge production function (KPF)across regions rather than firms (as in the original setting by Griliches, 1979). The shiftin the analytical framework of the KPF is credited to Jaffe (1989) who was the first toshow that local externalities in the process of creation and diffusion of knowledge mayoperate outside the firm but, nonetheless, within the local space of regions.
In the present paper we proceed in the tradition of Jaffe's seminal contribution,with the aim of assessing the role of localised knowledge and absorptive capacity inenhancing the technological capability of European regions. In particular, we try toassess if the pattern, extent, and pace of the absorptive capacity depend not onlyon geographical proximity but also on technological, economic, and institutionalsimilarities. This aim is pursued with a specific econometric strategy, which allows
Spatial spillovers and innovation activity in European regions
Rosina MorenoAQRöRegional Quantitative Analysis Research Group, Department of Econometrics and Sta-tistics, University of Barcelona, Diagonal, 690, 08034 Barcelona, Spain;e-mail: [email protected]
Raffaele Paci, Stefano UsaiCRENoS, University of Cagliari, Via S. Ignazio 78, 09123 Cagliari, Italy; e-mail: [email protected],[email protected] 4 October 2004; in revised form 20 January 2005
Environment and Planning A 2005, volume 37, pages 1793 ^ 1812
Abstract. This paper explores the spatial distribution of innovative activity and the role of technologicalspillovers in the process of knowledge creation and diffusion across 175 regions of seventeen countriesin Europe (the fifteen members of the pre-2004 European Union plus Switzerland and Norway). Theanalysis is based on a databank set up by CRENoS on regional patenting at the European PatentOffice, spanning 1978 ^ 2001 and classified by ISIC sectors. The first step is an exploratory spatialdata analysis of the dissemination of innovative activity in Europe. The goal of the rest of the paperis to analyse to what extent externalities that cross regional boundaries can explain the spatialassociation process detected in the distribution of innovative activity in the European regions. Theframework given by the knowledge-production function together with the use of spatial econometricstechniques allow us to look for insights on the mechanics of knowledge interdependences acrossregions, which are shown to exist. Empirical results point to the relevance of internal regional factors(R&D expenditure and agglomeration economies). Moreover, the production of knowledge appearsalso to be affected by spatial spillovers due to innovative activity (both patenting and R&D) per-formed in other regions. Additional results show that spillovers are mostly constrained by nationalborders within less than 250 km, and that technological similarity between regions also matters.
DOI:10.1068/a37341

for rigorous testing procedures in the search for the best specification. First, we checkthe need to introduce external spillovers in the estimation of a regional KPF. Once thisneed has been assessed, the statistically correct specification of the KPF is searched bymeans of the usual testing strategy of spatial econometrics. In the process, we study thegeographical scope of spillovers, in order to evaluate and measure the possible exis-tence of a spatial decay effect. Additionally, we explore whether the similarity of thetechnological structure among regions is an advantage in the diffusion of knowledgeand test the relevance of sharing a common institutional background in facilitatingspillovers across regions.
We use an original databank on regional patenting at the European Patent Office(EPO) spanning 1978 to 2001 to analyse the spatial distribution of innovative activityacross 175 regions of seventeen countries in Europe (the fifteen members of the pre-2004 European Union plus Switzerland and Norway). The use of this rich longitudinalpanel dataset is an advantage with respect to previous studies on Europe for investigat-ing how technological agglomerations are forming and evolving through space andtime.
The paper is organised as follows. The next section provides a short summary of thebackground literature and a critical discussion of the interpretation of some recurringfindings from the abundant empirical production. In the third section we deal withsome measurement issues by describing the pros and cons of the database in use, and weexamine the spatial mapping of innovative activity throughout the European regions.In the fourth section we use spatial econometrics analysis to explore the questionof the relevance of externalities in the process of spatial creation and dissemination ofknowledge which may cross the boundaries of regions. Section 5 is a discussion of theempirical results for the basic model together with some extensions to explore hownational and technological proximity influences technological spillovers. Final remarksconclude the analysis.
2 Literature backgroundThe traditional starting point of the analysis of the determinants of innovative activityby means of a so-called KPF is the seminal contribution by Griliches (1979). This earlycontribution found that the model in hand was more appropriate to describe the func-tional relationship between technological progress and innovative inputs at the industryor the country level, rather than at the firm or the plant level. This is interpreted, byAudretsch and Feldman (2004), as evidence of spillovers or externalities generatedby innovative activity performed by single economic agents. Starting from Marshall(1920), there has been a long tradition of studies which relate externalities to geo-graphical space. A tradition recently revived by the new economic geography (seeHenderson and Thisse, 2004), according to which local increasing returns may play acrucial role in explaining the existence of core ^ periphery settings among regions. Suchincreasing returns are usually classified in two categories: pure technological andpecuniary externalities (Krugman, 1991). Going back to Marshall's classical taxonomy,one can see that the former are clearly associated with knowledge spillovers, whereasthe latter are the result of market-mediated mechanisms concerning the availability ofqualified workers and specific primary and intermediate inputs.
The spatial context was originally introduced into the KPF model by Jaffe (1989),whose aim was to analyse externalities created by universities. In other words, heaimed to establish if knowledge produced by universities is a sort of local publicgood, because of its peculiar nature, its tacitness, which makes it transmissible onlythrough personal contacts (von Hipple, 1994).
1794 R Moreno, R Paci, S Usai

This concept of localised knowledge spillovers was later refocused and strengthenedby several empirical works addressed mainly to the US case (either at the state or at themetropolitan level) such as those by Acs et al (1994), Anselin et al (1997), andAudrestsch and Feldman (1996). Their common feature is that the estimation of aKPF is seen only as a practical device to find direct evidence of knowledge spillovers.
The possibility that local spillovers are caused by other mechanisms, such aspecuniary externalities, is only marginally taken into account. Breschi and Lissoni(2001) provide an excellent critical review of the risks related to this biased approachwhich treats knowledge spillovers as homogeneous. In this light, a more general line ofresearch has attempted to investigate the main mechanisms and determinants of theprocess of creation and diffusion of innovative knowledge in terms of temporaldynamics and geographical scope, using a full set of spatial econometrics techniques.Such a testing procedure has become standard in the estimation of regional KPFs forthe US case, as in Varga et al (2005). At the European level, previous attempts weremade by Bottazzi and Peri (2003) and Greunz (2003), who indeed addressed theproblem of spatial dependence, but never with proper measures to assess its relevance.Similar comments apply to the studies of Autant-Bernard (2001) for the French depart-ments and of Andersson and Ejermo (2003) for Swedish functional regions. By contrast,spatial econometrics techniques were applied to their full potential in Fischer and Varga(2003) for Austrian political districts.
3 The spatial distribution of innovation activity in the European regionsThe contributions surveyed in the previous section make extensive use of patentstatistics in order to analyse the determinants of innovation activity. But the use ofsuch indicators gives rise to some inconveniences and shortcomings (see Griliches,1990)öboth descriptive and econometricöwhich ought to be kept in mind whileinterpreting the outcome of the analysis. Starting from the concept of KPF, twotypes of indicators are usually identified: technology-input data (such as R&D expen-diture and employees) and technology-output data (such as patents and new productannouncements).
The main drawback of the former is that they include firms' efforts both forinnovation and for imitation activities. Moreover, they do not take into accountinformal technological activity and, as a consequence, tend to underestimate theamount of innovative activity of medium and small firms. Technology-output datarepresent the outcome of the inventive and innovative process even though there maybe inventions which are never patented, as well as patents which are never developedinto innovations. However, the patenting procedures require innovations to have nov-elty and usability features and imply relevant costs for the proponent. This in turnimplies that patented innovations, especially those extended to foreign countries, areexpected to have economic, although highly heterogeneous, value. With respect to theobject of our research, patent statistics seem particularly suitable, thanks to someuseful properties with respect to R&D data: first, they provide information on theresidence of the inventor and proponent and can thus be grouped into differentterritorial units identified through area codes, whereas R&D statistics are available atthe national or regional level. Second, they record the technological content of theinvention and can thus be classified according to the industrial sectors, whereas R&Ddata are usually aggregated, especially at the regional level. Third, they are available asa long series of yearly records, and this allows for a dynamic analysis; in contrastregional R&D data are available only for recent years and discontinuously.
Our proxy for innovative activity refers to patent applications at the EPO over theperiod 1978 ^ 2001, classified by inventor's region in Europe. Applications at the EPO
Spatial spillovers and innovation activity in European regions 1795

should provide a measure of sufficiently homogeneous quality, because applying to theEPO is difficult, time consuming, and expensive. This indicator, in other words, shouldprove particularly effective at taking into account innovations that are potentially highlyremunerative. The use of the inventor's rather than the proponent's residence is pre-ferred in order to attribute the spatial localisation of each innovation (Breschi, 2000;Paci and Usai, 2000). Indeed, as the latter generally corresponds to firms' headquarters,it might lead to an underestimation of peripheral regions' innovative activity wheneverthe invention has been developed in a firm's subsidiary located in another area. More-over, unlike previous research (Bottazzi and Peri, 2003), we deal with multiple inventorsby assigning a proportional fraction of each patent to the different inventors' regions ofresidence.
As for the territorial breakdown, we have tried to select, for each country, a geo-graphical unit with a certain degree of administrative and economic control. The resultis a division of Europe (fifteen countries of the pre-2004 European Union plus Switzerlandand Norway) in 175 subnational units (which, from now on, we will simply call regions)which are a combination of NUTS 0, 1, and 2 levels (see table 1 for details).
We now concentrate on the spatial distribution of innovative activity in Europe andits changes over two decades by using patents per 100 000 inhabitants as a measure ofinnovative intensity. Table 1 reports the innovative activity at country level. At thebeginning of the period under consideration (1981 ^ 83), the most innovative countryby far is Switzerland, with 14.5 patents per 100 000 inhabitants, followed by Germany(8.3) and Luxembourg (7.2). The regional level exhibits a similar picture, with mainlySwiss and German regions among the top performers. From figure 1(a) (over) we cansee strong patenting activity in regions of Switzerland, West Germany, the north and
Table 1. Innovative activity in the European countries (patents per 100 000 inhabitants, annualaverage).
Nation Number of NUTS 1981 ± 83 1988 ± 90 1994 ± 96 1999 ± 2001regions level
value rank value rank value rank value rank
Switzerland 7 2 14.5 1 20.9 1 19.7 1 27.8 1Germany 40 2 8.3 2 14.7 2 12.2 2 19.9 2Sweden 8 2 6.5 4 8.3 4 11.7 3 18.7 3Finland 6 2 1.4 11 4.7 10 9.6 4 18.3 4The Netherlands 4 1 4.1 5 8.3 3 8.3 5 14.5 5Denmark 1 0 2.5 9 4.8 9 7.6 6 12.9 6Luxembourg 1 0 7.2 3 5.0 8 6.4 10 12.7 7Austria 9 2 3.3 8 6.8 6 6.8 8 10.5 8Belgium 3 1 2.2 10 4.5 11 6.6 9 10.1 9France 22 2 3.9 6 6.8 5 7.1 7 9.8 10United Kingdom 12 1 3.4 7 5.4 7 5.1 11 7.3 11Norway 7 2 0.9 13 2.1 13 3.0 13 5.1 12Italy 20 2 1.1 12 3.0 12 3.4 12 5.0 13Ireland 2 1 0.5 14 1.3 14 1.9 14 4.2 14Spain 15 2 0.1 15 0.5 15 0.8 15 1.5 15Greece 13 2 0.1 16 0.1 16 0.2 16 0.4 16Portugal 5 2 0.0 17 0.1 17 0.1 17 0.3 17
European Union 175 3.6 6.5 6.7 10.4
Coefficient of variationacross nations 1.05 0.91 0.75 0.71across regions 1.42 1.17 1.05 1.05
1796 R Moreno, R Paci, S Usai

east of France, the north of Italy, the United Kingdom, Denmark, the Netherlands,and Sweden. Little or no technological activity is documented in most regions of thesouth of Europe: Spain, Greece, Portugal, and the south of Italy.
Looking at the evolution of the innovative activity from 1981 ^ 83 to 1999 ^ 01, wecan make some important remarks. First, innovation activity has increased consider-ably over the two decades in all countries: the average innovative output was 3.6patents per 100 000 inhabitants in the early 1980s and almost three times higher (10.4)at the end of the 1990s. This is partly caused by a shift of patent applications by firmsfrom national patenting offices to the EPO. Most importantly, innovations have beenspreading to more regions in the south of Europe (especially in Spain and the south ofItaly) and in the Scandinavian countries [see figure 1(b)]. Accordingly, we observe adecrease in the degree of spatial concentration of innovative activity as shown by thecoefficient of variation (CV) for countries and regions, reported in the last rows oftable 1. More specifically, the CV across nations decreases from 1.05 at the beginningof the 1980s to 0.71 twenty years later. Similarly, the CV computed at the regional levelshows a sharp decrease from 1.42 to 1.05.
The process of spatial diffusion of technological activity characterizes someregions of central Europe (France and East Germany), where there is evidence of anexpansion in spatial clustering. However, the most brilliant performance is shown bythe Scandinavian countries, particularly by Finland, which in the 1990s managed toreach fourth position in the country rankings and place its capital region, Uusimaa,among the first producers of innovation in Europe. This region was 49th at thebeginning of the 1980s and 6th at the end of the 1990s: undoubtedly one of the mostremarkable catching-up performances in Europe in the last twenty years.
Interestingly, fifteen of regions which are in the top twenty in the last period werealready there in the early 1980s. Here, there are some interesting stories to highlight:Stuttgart and Zuid Nederland, for example, were in the 13th and 18th position andare now 2nd and 4th. The Austrian region of Voralberg (the most westerly Austrianregion, lying between Switzerland and Germany) was 64th and it is now 14th.Conversely, among the most remarkable cases of decline are Luxembourg, whichgoes from 20th to 44th place, and Iê le de France, which moves from 9th to 23rd.Two Swiss regions (Region Lemanique and Espace Mittelland) and one German(Du« sseldorf) have also lost their places among the top innovators in the two decadesconsidered.
In conclusion, the strong centre ^ periphery distribution of innovation activity whichcharacterized the 1980s has now weakened; more regions in northern and southernEurope participate in technological activity. The process described above could berelated to spatial dependence, that is, to the fact that technological activity performedin one region may be associated with the technological activity in neighbouring regions.This possibility can be evaluated by means of the Moran's I-statistic based on contiguityweight matrices. The most general specification for the matrix is one of physicalcontiguity, where unity represents the case of two regions sharing a boundary, andzero the case where they do not.
The Moran index for the entire economy (table 2, over) shows the existence of astrong positive spatial autocorrelation process, confirming the visual impression ofspatial clustering given by the maps. If one also considers the spatial correlogram,this rejection is observed until the third order of contiguityöfirst, second, and third-order neighboursöas reported in table 2. Nonetheless, we observe a typical pattern ofdecreasing autocorrelation with increasing orders of contiguity.
Scatter maps enable us to assess the sign of spatial association of innovativeactivity in the different areas. The scatter map shows that there is a clear association
Spatial spillovers and innovation activity in European regions 1797

of high ^ high values in the centre, and low ^ low values in the south [see figure 2 (over)for the annual average in the period 1999 ^ 2001]. This picture remains almostunchanged if we look throughout the period considered, with only few exceptions:some regions in the north of Italy initially presented isolated high values of patents,surrounded by low values, whereas in the 1990s they became a cluster of high values.Finland has performed remarkably well during the entire period, presenting lowvalues surrounded by low values at the beginning, but changing to high values later.
Patents per 100 000 inhabitants
0<33 ± 88 ± 15>15No data
(a)
Figure 1. Distribution of innovative activity in the European regions (patents per 100000 inhabitants):(a) 1981 ^ 83, (b) 1999 ^ 2001.
Table 2. Spatial autocorrelation in the innovative activity, total manufacturing (Moran's I test,normal approximation).
Contiguity 1981 ± 83 1988 ± 90 1994 ± 96 1999 ± 2001
Z-value prob. Z-value prob. Z-value prob. Z-value prob.
1st-order 3.4 0.0 4.1 0.0 4.3 0.0 4.5 0.02nd-order 2.8 0.0 3.6 0.0 4.2 0.0 4.3 0.03rd-order 3.4 0.0 3.4 0.0 3.7 0.0 3.5 0.0
prob. probability.
1798 R Moreno, R Paci, S Usai

In the following sections we analyse to what extent externalities that cross regionalboundaries are behind the spatial association pattern detected in the descriptive andstatistical analysis above. The use of spatial econometrics techniques in conjunctionwith the KPF framework should allow us to obtain some insights into the mechanismsof local interdependences of knowledge.
4 The KPF modelIn this section we describe the econometric model used to investigate the mechanismsand determinants of the process of creation and diffusion of innovative knowledgeusing spatial econometrics techniques.
The basic KPF relates the innovative output in region i to R&D inputs in the sameregion. We depart slightly from this specification by introducing a number of furtherfactors related to the economic and institutional environment, so that the general formof our basic KPF is given as
Ii � R q1i Z
q21i ei , (1)
where I is a proxy for innnovative output, R indicates R&D expenditures, Z1 is avector of variables that reflects the economic and institutional additional determinantsand e represents a random independent and identically distributed error term capturing
(b)
Figure 1 (continued).
Spatial spillovers and innovation activity in European regions 1799

other unobservable determinants of innovative output. These additional factors areincluded in the model to control for systematic effects that may be present in theinnovation process but are neglected by the original KPF.We consider the institutionalenvironment within which the resources are deployed, as well as externalities internalto the region and associated with human, social, and public capital, and agglomerationeconomies. This latter component, in the form of either Marshall ^Arrow ^Romerexternalities (that is, localisation economies) or Jacobs externalities (that is, urbanisa-tion economies), can be considered the basis of benefits for individual firms in certaingeographic areas. It can be argued that the same R&D expenditure results in a higherlevel of innovative activity in large metropolitan areas than in smaller cities because ofagglomeration economies (Audretsch and Stephan, 1996). In particular, considering theknowledge-intensive nature of innovative activity, it is likely that the tacit componentof knowledge has a major role. In this respect, the concentration of skilled workers inone place is a mechanism through which knowledge externalities may materialise, asdirect communication enables flows of information and knowledge (Feldman andFlorida, 1994).
The theoretical and empirical literature surveyed in section 2 suggests that theproduction of knowledge in a region depends not only on its own research efforts,but also on the knowledge stock available in the whole economy. In other words,
Spatial association
0 (8)
High ± high (47)
Low± low (85)
High ± low (14)
Low± high (21)
Figure 2. Scatter for innovative activity in the European regions, 1999 ^ 2001 (patents per 100 000inhabitants, annual average; number of regions in parenthesis).
1800 R Moreno, R Paci, S Usai
knowledge may spill over from other regions. Many factors, external to the region,can act as determinants of technological activity, channelled through trade flows,external investments, imports of machinery, and common markets for skilled labourand final goods. Moreover, pecuniary externalities may be at work, thereby shiftingexternalities at the firm level to higher territorial levels. Our general framework givenin equation (1) is consequently modified to introduce an additional vector of externalfactors Z2 , reflecting the fact that innovation generated in one region may spill overand help knowledge formation in other regions:
Ii � R q1i Z
q21i Z
q32i ei . (2)
This extended model can provide an explanation for spatial dependence at the level ofinnovation output and, because the distribution of innovation output has been shownto be spatially correlated, we should expect the estimates of the coefficients of Z2 to besignificant.
However, instead of estimating model (2) directly, we start with model (1) and bymeans of spatial econometric techniques we assess whether external effects are tobe included in the KPF, as in model (2). Therefore we begin by assuming that anynew knowledge produced by a region in a given period is related to its R&D efforts inprevious periods and to a vector of internal factors Z1 � (D, M, N ) according to aCobb ^Douglas technology which can be written in logarithmic form as follows:
ln Ii; t � b1 lnRi; tÿq � b2 lnDi; tÿs � b3 lnMi; tÿs �X17c � 1
dcNic � ei; t , (3)
where b1 , b2 , and b3 are interpreted as the elasticities of the increment of economicallyvaluable technological knowledge, I, owing to changes in the respective variables. Thedependent variable is proxied by the number of patents per capita in one region. As forthe independent variables, the input of innovative activities, R, is measured by theshare of gross domestic product invested in research and development activities.Among the other potentially relevant internal forces, we introduce density of popula-tion, D, and the quota of manufacturing employment, M. Following general practice inthe literature, the rationale behind the introduction of these variables into the basicKPF is to capture agglomeration economies. Different variables have been used inthe related literature to proxy agglomeration economies, such as employment in thebusiness sector and high-technology employment (Anselin et al, 1997), the relativeimportance of large firms in the geographical area (Varga, 2000), or the density ofpopulation (Ciccone, 2002). In our opinion, the inclusion of the quota of manufacturingemployment presents the advantage of proxying not only agglomeration economies, butalso the differences in the propensity to patent across regions. The propensity to patentis usually higher in manufacturing than in service industries, and therefore includingthis variable should prevent the output elasticity of R&D from being biased (Bode,2004). Finally, by including a set of national dummies, N, we control for institutionaland other structural factors, which may affect either the innovative activity or thepropensity to appropriate its results by patenting.
Because we are estimating a cross-section, each variable is an average of threeyears' data, to smooth out possible transient effects and approximate long-run values.Additionally, because the production of knowledge takes time, we assume a time lagbetween R&D expenditure and the innovation yield. As a result, variable I refers tothe period 1999 ^ 2001, whereas R refers to 1989 ^ 96, and D and M to 1997 ^ 99.We alsoperformed a robustness check of the main econometric results with respect to differentlag structures.
Spatial spillovers and innovation activity in European regions 1801

To date, most empirical analyses have not devoted special attention to an econometricmethod capable of robustly testing and estimating externalities within a KPF. The onlyimportant exceptions are the works by Anselin et al (1997; 2000) focused on the UScase, and Fischer and Varga (2003) for Austrian regions, although in both cases theemphasis is on the effect of academic knowledge spillovers on private R&D. Ourempirical exercise, instead, directly addresses interregional externalities in the genera-tion of innovation through the use of spatial econometrics techhniques. The use of across-sectional sample potentially leads to spatial autocorrelation in the regressionequations which is assessed by means of a set of Lagrange multiplier tests. They areused to assess the extent to which remaining unspecified spatial spillovers may bepresent in the estimation of expression (3). If this is the case, spatial econometricsprovides the necessary tools to deal with this problem.
Specifically, spatial statistics applied to the estimation of equation (3) would revealnot only the existence of spatial dependence in our specification, but also its possibleform: a substantive or a nuisance model. The former is as follows:
ln Ii; t � b1 lnRi; tÿq � b2 lnDi; tÿs � b3 lnMi; tÿs � b4Wi ln Ii �X17c � 1
dcNic � ei; t ,
(4)
where W is a weight matrix defining linkages across regions. The variable representedby the term W ln I is therefore the spatial lag for the innovation output; in other words,it is a weighted measure of patents in the regions with which region i has contacts. Weinterpret an influence of this variable on the endogenous variable as evidence ofinterregional spillovers of the knowledge located outside the region, whereas the lackof significance of b4 would indicate that the production of new knowledge is generatedinternally. This spatial lag term has to be treated as an endogenous variable andmaximum likelihood (ML) has to be used because ordinary least squares (OLS)estimators are biased and inconsistent.
The nuisance model represents a second way to incorporate spatial autocorrelationinto the knowledge-production function by specifying a spatial process for the dis-turbance term. Although unbiased, the OLS estimators will no longer be efficient, asa consequence of the nonspherical error covariance [for different specifications of thespatial error terms see Anselin and Moreno (2003)]. The spatial error model forthe regional KPF would be expression (3) as it stands, with the error term denoted as:
e i � lWe i � l i , (5)
where l is asymptotically distributed as N(0; s 2 ), e follows a first-order Markovprocess, and l is the spatial autoregressive coefficient for the error lag. In the case ofspatial error autocorrelation, OLS parameter estimates are inefficient, whereas in thepresence of spatial lag dependence parameters become not only biased, but alsoinconsistent (Anselin, 1988; Anselin and Florax, 1995).
5 Econometric results5.1 Evidence on interregional technological spilloversEconometric results are summarised in table 3. The KPF holds in the European regionalcase: the elasticity of patents with respect to R&D expenditure when the OLS estima-tion (see first column(1)) is carried out for equation (3) presents a significant value of
(1) Following a referee's suggestion we have also tested the robustness of our results with respect tothe estimation methodology by using Poisson and negative binomial models applied to the depend-ent variable transformed into an integer. The main results of table 3 (column 1) are maintained.However, coefficients are not perfectly comparable given that in order to use negative binomials
1802 R Moreno, R Paci, S Usai

around 0.24. This result confirms the consensus found in the literature, although it is inthe lower limit of the range of values obtained in previous works. The elasticity goesfrom 0.2 to 0.9 in the USA (Acs et al, 1994; Anselin et al, 1997; Jaffe, 1989), and from0.4 to 0.8 in the European case (see Bottazzi and Peri, 2003; Greunz, 2003). It shouldbe noted that with respect to these two previous contributions we exploit a moredisaggregated and updated database. In particular, contrary to Bottazzi and Peri(2003), we use the whole set of information available from the EPO office ratherthan a random subsample. This difference is supposed to be particularly relevant forthe analysis of peripheral regions, whose innovative activity is rather sporadic,and for the analysis of the complex set of industrial interdependences for which sectorrepresentativeness may prove an important issue. We have also estimated the KPFwithout considering the vector Z1 , to check the robustness of this result: the elasticityis still significant with a much greater value of 0.87. However, when these additionalfactors are included, the explanatory power of the regressions is substantially andsignificantly increased. The added variables increase regression fit from an adjusted R 2
of 0.57 to 0.85, and the Akaike information criterion (AIC) decreases from 549 to 377.The local agglomeration factors exhibit a positive and significant effect on inno-
vative activity, with elasticities of 0.29 for density and 0.74 for the quota of themanufacturing sector. As for the institutional factors related to national differences,all dummies are significant. They can be interpreted as a reflection of the general
(1) (continued)and Poisson we have to estimate a semilog function instead of a double-log. Furthermore, it shouldbe stressed that estimating the whole set of regressions with Poisson and negative binomial modelsincluding spatial autocorrelation is not straightforward and the derivation of these estimationmethods would go beyond the scope of this paper.
Table 3. Estimation of innovative activity, dependent variable: ln I.
Variable OLS estimation ML estimationequation (3) equation (4)
Wbin Wdist Wbin Wdist
lnR 0.244 0.225 0.257(0.000) (0.000) (0.000)
lnD 0.286 0.319 0.265(0.000) (0.000) (0.000)
lnM 0.741 0.455 0.434(0.000) (0.007) (0.010)
W ln I 0.051 0.086(0.000) (0.000)
N (dummies) yes yes yes
R 2Ðadjusted 0.853 0.883 0.885AIC 376.9 357.3 354.3
LM-ERR 10.733 5.473(0.001) (0.019)
LM-LAG 23.522 26.238(0.000) (0.000)
Likelihood ratio test 21.639 24.549(0.000) (0.000)
Notes: OLSÐordinary least squares; MLÐmaximum likelihood. N � 175. p-values are givenin parentheses.Wbin is a first-order contiguity matrix, Wdist is an inverse distance matrix. W ln I is the spatiallylagged dependent variable where W stands for the weight matrix corresponding to the column.
Spatial spillovers and innovation activity in European regions 1803
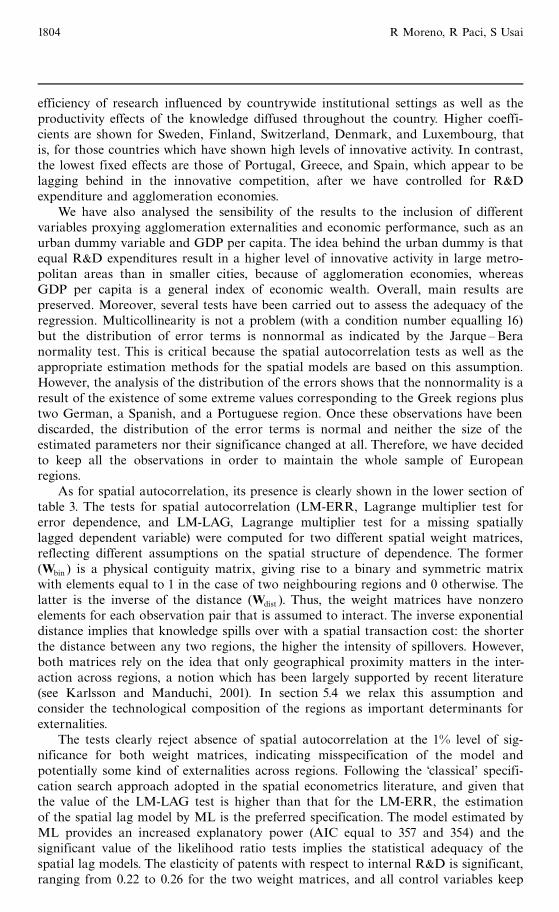
efficiency of research influenced by countrywide institutional settings as well as theproductivity effects of the knowledge diffused throughout the country. Higher coeffi-cients are shown for Sweden, Finland, Switzerland, Denmark, and Luxembourg, thatis, for those countries which have shown high levels of innovative activity. In contrast,the lowest fixed effects are those of Portugal, Greece, and Spain, which appear to belagging behind in the innovative competition, after we have controlled for R&Dexpenditure and agglomeration economies.
We have also analysed the sensibility of the results to the inclusion of differentvariables proxying agglomeration externalities and economic performance, such as anurban dummy variable and GDP per capita. The idea behind the urban dummy is thatequal R&D expenditures result in a higher level of innovative activity in large metro-politan areas than in smaller cities, because of agglomeration economies, whereasGDP per capita is a general index of economic wealth. Overall, main results arepreserved. Moreover, several tests have been carried out to assess the adequacy of theregression. Multicollinearity is not a problem (with a condition number equalling 16)but the distribution of error terms is nonnormal as indicated by the Jarque ^Beranormality test. This is critical because the spatial autocorrelation tests as well as theappropriate estimation methods for the spatial models are based on this assumption.However, the analysis of the distribution of the errors shows that the nonnormality is aresult of the existence of some extreme values corresponding to the Greek regions plustwo German, a Spanish, and a Portuguese region. Once these observations have beendiscarded, the distribution of the error terms is normal and neither the size of theestimated parameters nor their significance changed at all. Therefore, we have decidedto keep all the observations in order to maintain the whole sample of Europeanregions.
As for spatial autocorrelation, its presence is clearly shown in the lower section oftable 3. The tests for spatial autocorrelation (LM-ERR, Lagrange multiplier test forerror dependence, and LM-LAG, Lagrange multiplier test for a missing spatiallylagged dependent variable) were computed for two different spatial weight matrices,reflecting different assumptions on the spatial structure of dependence. The former(Wbin ) is a physical contiguity matrix, giving rise to a binary and symmetric matrixwith elements equal to 1 in the case of two neighbouring regions and 0 otherwise. Thelatter is the inverse of the distance (Wdist ). Thus, the weight matrices have nonzeroelements for each observation pair that is assumed to interact. The inverse exponentialdistance implies that knowledge spills over with a spatial transaction cost: the shorterthe distance between any two regions, the higher the intensity of spillovers. However,both matrices rely on the idea that only geographical proximity matters in the inter-action across regions, a notion which has been largely supported by recent literature(see Karlsson and Manduchi, 2001). In section 5.4 we relax this assumption andconsider the technological composition of the regions as important determinants forexternalities.
The tests clearly reject absence of spatial autocorrelation at the 1% level of sig-nificance for both weight matrices, indicating misspecification of the model andpotentially some kind of externalities across regions. Following the classical' specifi-cation search approach adopted in the spatial econometrics literature, and given thatthe value of the LM-LAG test is higher than that for the LM-ERR, the estimationof the spatial lag model by ML is the preferred specification. The model estimated byML provides an increased explanatory power (AIC equal to 357 and 354) and thesignificant value of the likelihood ratio tests implies the statistical adequacy of thespatial lag models. The elasticity of patents with respect to internal R&D is significant,ranging from 0.22 to 0.26 for the two weight matrices, and all control variables keep
1804 R Moreno, R Paci, S Usai
their expected positive sign. The elasticity of patents in one region with respect topatents in the neighbouring regions ranges between 0.05 for the binary contiguitycriteria and 0.09 when the distance is accounted for. The higher elasticity obtainedwith the distance matrix is a result of the fact that this is a full matrix which considersthe whole range of spillovers arising from all regions. This positive and significanteffect of the knowledge externality, proxied by the spatial lag of patents, highlights therole played by interregional spillovers in innovative activity in European regions. Thecontribution of knowledge from outside the region is, however, of limited magnitude.
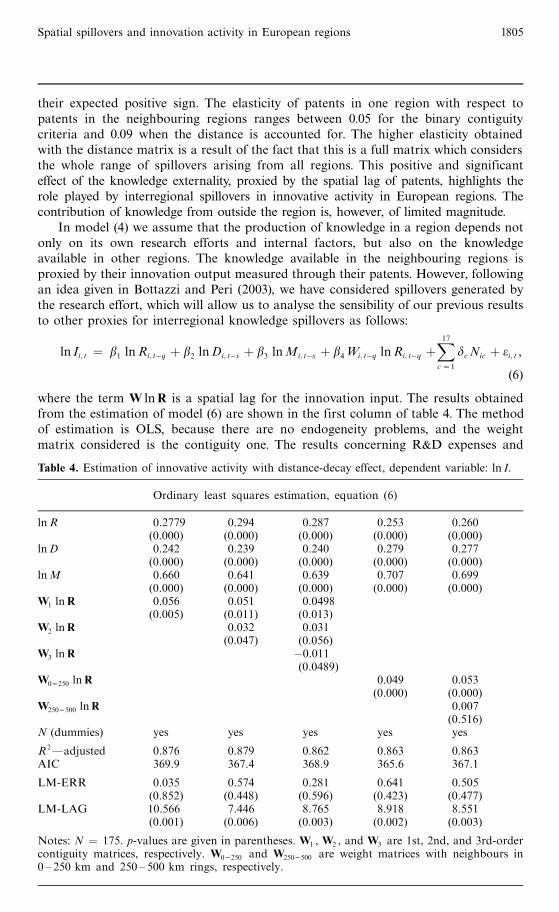
In model (4) we assume that the production of knowledge in a region depends notonly on its own research efforts and internal factors, but also on the knowledgeavailable in other regions. The knowledge available in the neighbouring regions isproxied by their innovation output measured through their patents. However, followingan idea given in Bottazzi and Peri (2003), we have considered spillovers generated bythe research effort, which will allow us to analyse the sensibility of our previous resultsto other proxies for interregional knowledge spillovers as follows:
ln Ii; t � b1 lnRi; tÿq � b2 lnDi; tÿs � b3 lnMi; tÿs � b4Wi; tÿq lnRi; tÿq �X17c � 1
dcNic � ei; t ,
(6)
where the term W lnR is a spatial lag for the innovation input. The results obtainedfrom the estimation of model (6) are shown in the first column of table 4. The methodof estimation is OLS, because there are no endogeneity problems, and the weightmatrix considered is the contiguity one. The results concerning R&D expenses and
Table 4. Estimation of innovative activity with distance-decay effect, dependent variable: ln I.
Ordinary least squares estimation, equation (6)
lnR 0.2779 0.294 0.287 0.253 0.260(0.000) (0.000) (0.000) (0.000) (0.000)
lnD 0.242 0.239 0.240 0.279 0.277(0.000) (0.000) (0.000) (0.000) (0.000)
lnM 0.660 0.641 0.639 0.707 0.699(0.000) (0.000) (0.000) (0.000) (0.000)
W1 lnR 0.056 0.051 0.0498(0.005) (0.011) (0.013)
W2 lnR 0.032 0.031(0.047) (0.056)
W3 lnR ÿ0.011(0.0489)
W0 250 lnR 0.049 0.053(0.000) (0.000)
W250 500 lnR 0.007(0.516)
N (dummies) yes yes yes yes yes
R 2Ðadjusted 0.876 0.879 0.862 0.863 0.863AIC 369.9 367.4 368.9 365.6 367.1
LM-ERR 0.035 0.574 0.281 0.641 0.505(0.852) (0.448) (0.596) (0.423) (0.477)
LM-LAG 10.566 7.446 8.765 8.918 8.551(0.001) (0.006) (0.003) (0.002) (0.003)
Notes: N � 175. p-values are given in parentheses. W1 , W2 , and W3 are 1st, 2nd, and 3rd-ordercontiguity matrices, respectively. W0 250 and W250 500 are weight matrices with neighbours in0 ± 250 km and 250 ± 500 km rings, respectively.
Spatial spillovers and innovation activity in European regions 1805

agglomeration economies are in line with previous findings. The elasticity of patentingactivity with respect to R&D expenditure in the neighbouring regions presents asignificant value of 0.06, very close to the one obtained above. Therefore, irrespectiveof the measures of spatial innovative spillovers, the parameter for interregional knowl-edge externalities is significant and positive, indicating that regions benefit from beingsituated in close spatial proximity to other highly innovative regions.
5.2 Analysing the spatial scope of spilloversResults obtained so far lead us to conclude that localised spillovers are important whencontiguous neighbours are considered as well as when all the regions are consideredöalthough with a lower weight as distance increases. This leads us to question whetherthere is a cutoff point, after which interaction among regions becomes insignificant.
One way to check the existence of a decay effect in the influence of innovationspillovers is through the use of higher order lags of the variable R&D. Using equa-tion (6), we have considered second-order and third-order lags of the variable R. Theresults, in columns 2 and 3 of table 4, show that the spillovers are significant until asecond-order neighbourhood. In other words, innovation made in one region spillsover not only to the physical neighbouring regions, but also to the regions sharing aborder with these first-order neighbours, although with a lower impact. Spillovers stopat this level, because the third-order contiguity lag in R is not significant.
In a second exercise, we define different weight matrices based on increasing valuesfor the cutoff level of distance. Specifically, for any region i, the spatial lag W0 250 lnRis the sum of the R&D expenses in those surrounding regions within a radiusof 250 km. We also computed similar measures for a 500 km range (W250 500 lnR).Columns 4 and 5 in table 4 show the results of this cutoff distance analysis. Thestatistically significant coefficient of the technological spillover is within the rangeof 250 km, whereas the coefficient in the range of 250 ^ 500 km is positive but notsignificant. The highly significant spatial lag for R within the first radius value suggeststhat innovative activity in a region is positively related to the level of innovative activityin regions located within 250 km, but no further. In conclusion, the spatial range ofinteraction between R&D and patents reaches beyond the regions where the R&D isactually carried out, but within a limited distance.
5.3 Analysing the national or transnational scope of spilloversSo far, the scope of our analysis has been Europe as a whole. We have not consideredthe possibility that common national characteristics could have a crucial role in thetransmission of knowledge within the regions of a given country. And, conversely, thatregions belonging to different countries, even if sharing a common border, have alesser flow of knowledge because of the differing national characteristics. Because theflow of ideas across regions is considered a key rationale behind the existence ofinterregional knowledge spillovers, and because previous literature shows that migra-tion and trade flows are more intense between regions belonging to the same country(Helliwell and McKitrick, 1998), the same border effect could apply to innovationspillovers.
In order to check the potential barriers to interregional externalities posed bynational borders, we construct a within-country and an across-countries weight matrix.In the first case we set equal to one only the weights corresponding to regions whichshare a common border and which belong to the same country. In the second version,the weights for regions sharing a border and being within the same country are setequal to zero and those for regions sharing a border but belonging to differentcountries are set equal to one.
1806 R Moreno, R Paci, S Usai

The results are summarised in table 5. In the estimation of equation (3), significantpositive spatial dependence is observed both in the within-country and in the across-countries matrices, a result that goes against the rationale of the existence of spilloversonly between regions belonging to the same country. The significance of the LM-ERRtest when using the within-country matrix points to the estimation of the spatial errormodel in equation (5) as the preferred specification. In contrast, the significance of theLM-LAG test points to the estimation of the spatial lag model when the across-countries weight matrix is considered. The results of the two ML estimations are shownin the second and third columns of table 5. They imply that, when externalities acrossregions within the same country are taken into account, the spatial error coefficient (l)is significant and positive. Additionally, if spillovers across regions of different countriesare analysed, the spatial lag of the endogenous variable is significantly positive.
To remain coherent with the strategy followed so far, the results of the estimationof equation (6) are given in the last column, so that the spillovers referred to R&Dexpenditure are also considered by using the two matrices. The spatial lag of R withinthe same country is significant, with no remaining spatial autocorrelation in theestimation, whereas spillover across countries is not. Thus, although knowledge seemsto cross physical borders, some evidence shows that knowledge spills mainly overregions belonging to the same country. This result is not surprising because it corrob-orates previous findings (Cantwell and Iammarino, 2003) that national innovationsystems, to a certain extent, still dominate the common European one.
Table 5. Estimation of innovative activity within and across countries, dependent varible: ln I.
Variable OLS estimation ML estimation OLS
Wwithin Wacross Wwithin Wacross
estimation
lnR 0.244 0.246 0.240 0.277(0.000) (0.000) (0.000) (0.000)
lnD 0.286 0.271 0.299 0.243(0.000) (0.000) (0.000) (0.000)
lnM 0.741 0.486 0.668 0.677(0.000) (0.000) (0.000) (0.000)
W ln I 0.043(0.007)
Spatial error term (l) 0.107(0.000)
Wwithin lnR 0.056(0.021)
Wacross lnR 0.049(0.240)
N (dummies) yes yes yes yes
R 2Ðadjusted 0.853 0.839 0.874 0.859AIC 376.9 363.1 372.1 372.4
LM-ERR 5.098 0.043 1.385(0.024) (0.835) (0.239)
LM-LAG 2.559 6.921 1.736(0.109) (0.008) (0.187)
Likelihood ratio test 13.745 6.855(0.000) (0.009)
Notes: OLSÐordinary least squares; MLÐmaximum likelihood. N � 175. p-values are givenin parentheses. Wwithin is a contiguity matrix for regions within the same country, Wacross is acontiguity matrix for regions belonging to different countries.
Spatial spillovers and innovation activity in European regions 1807

5.4 Analysing the importance of technological proximity in the diffusion of innovationSo far we have proved the existence of externalities across geographical boundaries.However, interregional spillovers may also take place thanks to technological conti-guity across regions. The rationale underlying this idea comes from economic literatureat the firm level, where firms' capacity to absorb other firms' knowledge depends ontechnological similarity between firms. In other words, spillovers within the sameindustry can be more substantial than those across industries, because each technologyembodies a unique type of language and concerns a precise set of applications.Researchers are expected to benefit more from others who work in the same or relatedtechnological field, irrespective of geographical distance (Bode, 2004).
The paper by Jaffe (1986) has resulted in several others about the effect of technologicalproximity on knowledge spillovers. Using firms' patent data to compute similaritiesbetween firms, he finds that technological spillovers are an important explanatoryfactor of productivity. There are different ways to measure technological proximity(Los, 2000). One method is based on the use of input ^ output tables (Moreno et al,2004; Verspagen, 1997) in which externalities via technology diffusion occur eitherthrough purchases of intermediate goods (supplier-driven externalities) or through salesto other industries (customer-driven externalities). An alternative method would followJaffe's idea of using the distribution of firms' patenting activity across sectors tocharacterise the technological structure of a firm or a region. This is our choice,as already done in the setting of KPF by Autant-Bernard (2001) and Greunz (2003).We assume that the existence of technological spillovers implies that a region's R&Dsuccess is affected by the research activity of its neighbouring regions in technologicalspace. In order to obtain a measure of `technological neighbourhood', we compute atechnological matrix (Wtech ) calculated by means of patent application data (1981 ^ 2001)disaggregated into 101 sectors (three-digit ISIC) for each region. To measure theproximity of regions we follow Jaffe (1986) in whose work the proximity measure takesa value equal to unity for technologically identical regions, and zero otherwise. Thecloser to unity, the greater the degree of similarity of the two regions' technologicalstructure. Consequently, the spatial lag of patents constructed with this matrix,Wtech ln I, implies a weighted sum of other regions' patents, with weights proportionalto the proximity of the firms in technological space. Furthermore, we contemplate bothconcepts of proximity, geographical and technological, in a unique measure. Basically,we construct two new weight matrices in which the technological similarity is weightedby the geographical proximity in terms of either contiguity (Wtech contiguity ) or the inverseof the distance (Wtech distance ).
The results are summarised in table 6. With the estimation of equation (3), thespatial dependence statistic LM-LAG for the pure technological weight matrix (seecolumn 1) rejects the null hypothesis of absence of spatial dependence. The value ofthis statistic is lower than the values of the statistics obtained for the binary contiguityand the inverse of the distance shown in the first two columns of table 3. The spatialdependence process with respect to geographical proximity is stronger than that refer-ring only to technological similarity. Nonetheless, when spatial dependence is testedwith respect to the two weight matrices that consider both types of similarities simul-taneously, a significant autocorrelation is also observed. In such cases, the values of thespatial autocorrelation statistic (LM-LAG) are also lower than the values obtained forthe binary contiguity and the inverse of the distance, but are still higher than thoseobtained when one considers pure technological proximity. In other words, physicalvicinity proves more important than technological proximity.
Once again, following the usual search approach, the significance of the LM-LAGtests points to the estimation of the spatial lag model in all the cases. Results are also
1808 R Moreno, R Paci, S Usai

shown in table 6. The spatial lag of the endogenous variable is significant in the threecases and the LR tests indicate that autocorrelation has disappeared. The elasticities ofpatents with respect to internal R&D expenditures as well as the parameters foragglomeration economies are analogous to previous results, whereas the elasticity ofpatents in one region with respect to patenting in its technological neighbours presentsa value of 0.05, quite similar to those obtained in the case of geographical proximity.As far as the technological spillovers generated within the geographical and techno-logical space are concerned, we find a slightly lower but still significant elasticity, witha value of 0.03 and 0.04 for the Wtech contiguity and Wtech distance , respectively.
In sum, interregional spillovers exist between close regions, both from a geographicaland a technological point of view, although the geographical factors seem to dominate thetechnological factors to a certain extent.
6 ConclusionsIn this paper we sought to provide original empirical evidence on the process of spatialcreation and dissemination of knowledge in Europe, with a special focus on therelevance of interregional technological spillovers.We provide an answer to the questionof whether regional geographical and technological proximity matters in explaininginnovation activity.
We started mapping innovative activity in European regions with two main out-comes. First, there was a strong centre ^ periphery distribution of innovation activity atthe beginning of the period. Innovation activity is concentrated in regions in the north
Table 6. Estimation of innovative activity with tech ^ distance matrices, dependent variable: ln I.
Variable OLS estimation ML estimation
Wtech Wtech contiguity Wtech distance Wtech Wtech contiguity Wtech distance
lnR 0.244 0.222 0.222 0.234(0.000) (0.000) (0.000) (0.000)
Wtech 0.053(0.000)
Wtech contiguity ln I 0.028(0.000)
Wtech distance ln I 0.041(0.000)
ControlslnD 0.286 0.321 0.322 0.303
(0.000) (0.000) (0.000) (0.000)lnM 0.741 0.525 0.474 0.430
(0.000) (0.000) (0.005) (0.011)N (dummies) yes yes yes yes
R 2Ðadjusted 0.854 0.881 0.883 0.886AIC 376.9 361.1 357.9 353.4
LM-ERR 1.972 1.547 1.776(0.162) (0.214) (0.183)
LM-LAG 10.871 13.365 19.235(0.001) (0.000) (0.000)
Likelihood ratio 17.777 20.975 25.474test (0.000) (0.000) (0.000)
Notes: OLSÐordinary least squares; MLÐmaximum likelihood. N � 175. p-values are givenin parentheses. Wtech is a technological distance matrix (see text for details), Wtech contiguity is acontiguity matrix weighted by the technological distance matrix, and Wtech distance is an inversedistance matrix weighted by the technological distance matrix.
Spatial spillovers and innovation activity in European regions 1809

and centre of Europe, and little or no technological activity is performed in mostSouthern European regions. Second, this concentration has tended to decrease overtime, and innovations have spread to regions in Scandinavia and in the south ofEurope. The analysis of global indicators of spatial association confirms the presenceof a strong and positive spatial autocorrelation process in innovative activity. Thismeans that patenting activity in a certain region tends to be correlated to innovationperformed in contiguous areas.
Furthermore, we investigated to what extent knowledge externalities that cross theboundaries of the regions can be behind the spatial association process detected inthe distribution of innovation. Using the KPF framework in conjunction with spatialeconometric techniques we can look for some insights into the mechanisms of inter-regional interdependencies in knowledge. Spatial econometrics turns out to be a verypowerful analytical tool in empirically modelling spillovers when cross-sectional dataare applied, as it generates the statistics to test for potential misspecifications in theform of spatial autocorrelation as well as indicating different modelling strategies andmeasures for interregional spillovers.
The econometric analysis appears particularly revealing. Findings confirm theimportance of internal R&D expenditure on patenting activity, with a highly signifi-cant and stable effect. It also confirms the important role played by other internalfactors reflecting agglomeration economies and national institutions. Moreover, wefind that external effects or innovative spillovers also matter. They arise both throughthe patenting activity and the R&D efforts performed in other regions. Estimationresults on the spatial extent of such spillovers suggest the existence of a clear decayprocess in knowledge diffusion. Additional results show that spillovers occur mainlyacross regions within a country. In other words, interregional external effects ininnovation are mostly constrained by national borders and this in turn suggeststhat national innovation systems, rather than the European one, are predominant.Finally, in order to improve our understanding of the inner mechanics of knowledgediffusion, we have associated diffusion with proximity in the technological structure ofregions. Results are worthy of note: technological proximity matters with an effect of acomparable magnitude to that obtained with geographical proximity.
In sum, the results highlight the relevance of an accurate consideration of the spatialrange of interaction in the analysis of spatial externalities. Once the KPF has beenremodelled after testing the empirical necessity of including explicitly spatial effects, itproduces the important conclusion that the spatial dimension of spillovers cannot beignored. However, we are aware that the KPF approach does not allow for discrimina-tion between different sources of R&D externalities (pure technological externalities orpecuniary externalities) which would imply very different policy suggestions.
Acknowledgements.We thank Barbara Dettori for her excellent research assistance. We would liketo thank the editor as well as the referees for useful suggestions that have improved considerablythe paper. We have benefited from useful comments by participants at the 2003/2004 ERSAconference and at CEPR, London, and Universidad Complutense de Madrid workshops. Thispaper is the result of a joint research project developed within the COST-Action 17. Financialsupport by MIUR (COFIN 2002 project 2002138187 02) and DGICYT SEC2002-00165 aregratefully acknowledged. The usual disclaimer applies.
ReferencesAcs ZAudretschD, FeldmanM,1994,` R&D spillovers and recipient firm size''Review of Economics
and Statistics 100 336 ^ 367Andersson M, Ejermo O, 2003, ` Knowledge production in Swedish regions 1993 ^ 1999'',WP 139,
Centre of Research on Innovation and Internationalization, Bocconi University, MilanAnselin L, 1988 Spatial Econometrics: Methods and Models (Kluwer Academic, Dordrecht)Anselin L, Florax R, 1995 Advances in Spatial Econometrics (Springer, Berlin)
1810 R Moreno, R Paci, S Usai

Anselin L, Moreno R, 2003, ` Properties of tests for spatial error components''Regional Scienceand Urban Economics 33 595 ^ 618
Anselin L,Varga A, Acs Z, 1997, ` Local geographic spillovers between university research andhigh technology innovations'' Journal of Urban Economics 42 422 ^ 448
Anselin L,Varga A, Acs Z, 2000, ` Geographic and sectoral characteristics of academic knowledgeexternalities'' Papers in Regional Science 79 435 ^ 443
Audretsch D, FeldmanM, 1996, ` R&D spillovers and the geography of innovation and production''American Economic Review 86 631 ^ 640
Audretsch D, Feldman M, 2004, ` Knowledge spillovers and the geography of innovation'', inHandbook of Urban and Regional Economics Eds J V Henderson, J F Thisse (Elsevier,Amsterdam) pp 2713 ^ 2739
Audretsch D B, Stephan P E, 1996, ` Company-scientist locational links: the case of biotechnology''American Economic Review 86 641 ^ 652
Autant-Bernard C, 2001, ` The geography of knowledge spillovers and technological proximity''Economics of Innovation and New Technology 10 237 ^ 254
Bode E, 2004, ` The spatial pattern of localized R&D spillovers: an empirical investigation forGermany'' Journal of Economic Geography 4(1) 43 ^ 64
Bottazzi L, Peri G, 2003, ` Innovation and spillovers in regions: evidence from European patentdata'' European Economic Review 47 687 ^ 710
Breschi S, 2000, ` The geography of innovation: a cross-sector analysis''Regional Studies 34213 ^ 229
Breschi S, Lissoni F, 2001, ` Knowledge spillovers and local innovation systems: a critical survey''Industrial and Corporate Change 10 975 ^ 1005
Cantwell J, Iammarino S, 2003 Multinational Corporations and European Regional Systems ofInnovation (Routledge, London)
Ciccone A, 2002, `Agglomeration effects in Europe'', European Economic Review 46 213 ^ 227Coe D, Helpman E, 1995, ` International R&D spillovers'' European Economic Review 39 859 ^ 887FeldmanM P, Florida R, 1994, ``The geographic sources of innovation: technological infrastructure
and product innovation in the United States''Annals of the Association of AmericanGeographers84 210 ^ 229
Fischer M M,Varga A, 2003, ` Spatial knowledge spillovers and university research: evidence fromAustria''Annals of Regional Science 37 302 ^ 322
Greunz L, 2003, ` Geographically and technologically mediated knowledge spillovers betweenEuropean regions''Annals of Regional Science 37 657 ^ 680
Griliches Z, 1979, ` Issues in assessing the contribution of research and development to productivitygrowth'' Bell Journal of Economics 10 92 ^ 116
Griliches Z,1990, ` Patent statistics as economic indicators: a survey''Journal of Economic Literature28 1661 ^ 1707
Helliwell J F, McKitrick R, 1998, ``Comparing capital mobility across provincial and nationalborders'',WP 6624, National Bureau of Economic Research, Cambridge, MA
Henderson J V,Thisse J F, 2004Handbook of Urban andRegional Economics (Elsevier, Amsterdam)Jaffe A B, 1986, ` Technological opportunity and spillovers of R&D: evidence from firms' patents,
profits and market value''American Economic Review 76 984 ^ 1001Jaffe A B, 1989, ` Real effects of academic research''American Economic Review 79 957 ^ 970Karlsson C, Manduchi A, 2001, ` Knowledge spillovers in a spatial contextöa critical review
and assessment'', in Knowledge, Complexity and Innovation Systems Eds M Fisher, J Fro« hlich(Springer, Berlin) pp 101 ^ 123
Krugman P, 1991, ` Increasing returns and economic geography'' Journal of Political Economy99(3) 483 ^ 499
Los B, 2000, ` The empirical performance of a new inter-industry technology spillover measure'',inTechnology and KnowledgeEds P Saviotti, B Nooteboom (Edward Elgar, Cheltenham, Glos)pp 118 ^ 151
Marshall A, 1920 Principles of Economics (Macmillan, London)Martin P, Ottaviano G, 2001, ` Growth and agglomeration'' International Economic Review 42
947 ^ 968Moreno R, Lopez-Bazo E,Vaya E, Art|s M, 2004, ` External effects and cost of production'', in
Advances in Spatial Econometrics Eds L Anselin, R Florax, S Rey (Springer, Heidelberg)pp 297 ^ 317
Paci R, Usai S, 2000, ` Technological enclaves and industrial districts: an analysis of the regionaldistribution of innovative activity in Europe''Regional Studies 34 97 ^ 114
Spatial spillovers and innovation activity in European regions 1811

Romer P M, 1986, ` Increasing returns and long-run growth'' Journal of Political Economy 941002 ^ 1037
Varga A, 2000, ` Local academic knowledge transfers and the concentration of economic activity''Journal of Regional Science 40 289 ^ 309
Varga A, Anselin L, Acs Z, 2005, ` Regional innovation in the US over space and time'', inSpillovers and Innovation: Space, Environment and the Economy Eds G Maier, S Sedlacek(Springer,Vienna) pp 93 ^ 104
Verspagen B, 1997, ` Estimating international technology spillovers using technology flowmatrices''Weltwirtschaftliches Archiv 133 226 ^ 248
vonHipple E,1994,` Sticky information and the locus problem solving: implications for innovation''Management Science 40 429 ^ 439
ß 2005 a Pion publication printed in Great Britain
1812 R Moreno, R Paci, S Usai

Conditions of use. This article may be downloaded from the E&P website for personal researchby members of subscribing organisations. This PDF may not be placed on any website (or otheronline distribution system) without permission of the publisher.