working paper series - core · knowledge spillovers and a lower likelihood to resort to spillovers...
TRANSCRIPT
Inventors and the Geographical Breadth of Knowledge spillovers
Paola Giuri*
Myriam Mariani±
*Department of Management, University of Bologna, Italy± DAIMAP and CESPRI, Bocconi University, Milano, Italy
2007/26 December 2007
LEMLEM
Laboratory of Economics and Management
Sant’Anna School of Advanced StudiesPiazza Martiri della Libertà, 33 - 56127 PISA (Italy)Tel. +39-050-883-343 Fax +39-050-883-344Email: [email protected] Web Page: http://www.lem.sssup.it/
Working Paper Series
Inventors and the Geographical Breadth of Knowledge Spillovers
Paola Giuri Department of Management, Bologna University, Bologna (IT)
Myriam Mariani DAIMAP and CESPRI, Bocconi University, Milan (IT)
December 2007
This paper studies the geographical breadth of knowledge spillovers. Previous research suggests that knowledge spillovers benefit from geographical proximity in technologically active and rich regions more than elsewhere. An alternative view explains the geographical breadth of knowledge spillovers as a function of the characteristics and personal networks of the individuals. We test these two competing theories by using information provided directly by the inventors of 6,750 European patents (PatVal-EU survey). Our results confirm the importance of inventors’ personal background. However, compared to previous research, we find that the level of education of the inventors is key in shaping the geographical breadth of knowledge spillovers. Highly educated inventors rely more on geographically wide research networks than their less educated peers. This holds after controlling for the mobility of the inventors and for the scientific nature of the research performed. Differently, location matters only in the very rare regions in Europe that perform the bulk of the research in the specific discipline of the inventors. Acknowledgements: We thank Davide Castellani, Giovanni Dosi, Maryann Feldman, Koen Frenken, Alfonso Gambardella, Marco Giarratana, Reinhilde Veugelers, John Van Reenen and Antonello Zanfei for useful comments on previous versions of this paper. All responsibilities are ours. We acknowledge financial support from the European Commission (Contract HPV2-CT-2001-00013), the CNR-ESF Projects “Science and Technology in Large and Small Firms,” and Bocconi University.
1
1. Introduction and research setting
The importance of knowledge spillovers has encouraged scholars in economics and
management to document their existence and to study their boundaries (Jaffe, 1989; Acs et al.,
1994; Jaffe, Trajtenberg and Fogarty, 2000; Funke and Niebuhr, 2005). The fact that knowledge
spreads out from its source lowers the incentives to produce it. However, by producing increasing
returns, spillovers foster economic growth (e.g., Romer, 1990; Grossman and Helpman, 1991).
Moreover, the geographical boundaries of the spillovers affect the spatial distribution of innovative
and economic activities (Saxenian, 1994; Verspagen, 1997).
This paper focuses on the knowledge spillovers that the inventors use to develop patented
inventions in Europe. It provides new evidence on the extent to which knowledge flows are
geographically localized, and the factors that affect their geographical breadth. It offers the unique
opportunity to explore these issues by means of an indicator of knowledge spillovers provided
directly by the inventors of 6,750 European patents (the PatVal-EU survey). The indicator is based
on the assessment given by the inventors about the use of interactions such as meetings,
discussions, and circulation of ideas during the research leading to the patented invention.
Our paper builds on the existing literature on the role of geography on knowledge flows. In a
seminal paper, Jaffe et al. (1993) use US patent citations to measure knowledge spillovers. By
employing a matching method that controls for the pre-existing distribution of production activities
they show that knowledge spillovers are geographically concentrated between and within countries
(for Europe see Verspagen, 1997; Verspagen and De Loo, 1999).
More recent contributions, however, show that patent citations are a noisy measure of the
extent and direction of knowledge flows. Alcacer and Gittelman (2006) indicate that an important
fraction of patent citations – 41% for the US patents and 93% for the EPO patents – are inserted by
the patent examiners rather than the inventors (Jaffe et al., 1998, Harhoff et al., 2006). Other authors
cast doubts about the fact that spillovers are geographically bounded. Thompson and Fox Kean
2

(2005) revisit the Jaffe et al. work. They employ finer criteria to select the control sample of patents
and find that this eliminates the intra-national location of knowledge spillovers. Thompson (2004)
uses a different identification methodology, which compares the geographic matching of the US
cited and citing patents when citations are added by the inventors or the patent examiners. He finds
modest evidence of location effects.
Finally, not only are the measurement and geographical breadth of knowledge spillovers
under debate, but also the traditional notion of spillovers being “in the air” is now discussed against
other mechanisms whereby individuals and their personal networks shape geography of knowledge
flows. For example, Zucker et al. (1998) show that what appears to be localized knowledge
spillovers in the US biotechnology industry is in fact a market mechanism through which star
scientists are either employees or collaborators of biotechnology companies in the regions. Almeida
and Kogut (1999) use US patents in semiconductors and find that an important mechanism by
which knowledge is transferred is the inter-firm mobility of human capital. By using the inventor as
the unit of analysis, other authors show that knowledge flows and regional co-location are driven by
the underlying social networks among researchers (e.g., Agrawal et al., 2007; Breschi and Lissoni,
2004; Singh, 2005; Fleming et al., 2007).
Our study makes three major contributions to this literature. First, it employs an indicator of
knowledge spillovers provided directly by the inventors. This indicator mimics the idea of
“marshallian” knowledge spillovers, therefore avoiding the problem of using indirect measures like
patent citations. Second, it investigates the geographical breadth of knowledge spillovers at the
micro level of the users of these spillovers, i.e., the individual inventors, rather than the regions or
groups of patents. This leads to our third contribution; that is, our data provide the opportunity to
estimate the relative effect of both location and inventor individual factors on the geographical
extent of knowledge spillovers. This is important, as most of the existing contributions on this
matter either lacks data at the individual level, or acknowledges the need to control for the
3

characteristics of the regions (e.g., Audretsch and Stephan, 1996). Moreover, this enables us to test
two competing theories about the geographical breadth of knowledge spillovers. As a matter of fact,
one strand of the literature emphasizes the local dimension of knowledge spillovers; that is,
inventors in technologically more “vibrant regions” (Almeida and Kogut, 1999) interact locally to a
greater extent than elsewhere. However, especially in recent years, a new strand of the literature has
emphasized that knowledge spillovers depend on the characteristics of the individual inventors and
their personal networks. In this case, spillovers follow the networks of these individuals, which are
not necessarily local (e.g., links with former colleagues in PhD programs). Our results show that the
key factor shaping the geographical breadth of knowledge spillovers is the inventor, and particularly
his level of education: highly educated inventors are more often involved in geographically wide
research networks. This holds after controlling for the typical factors explored in the literature, i.e.,
inventor mobility and the scientific nature of the research performed. Inter-regional variation in the
extent to which knowledge spillovers develop locally exists as well, but only in the very top regions
in Europe that host the bulk of research in the specific technology of the invention.
This paper is organized as follows. Section 2 develops the hypotheses about the role of
regions and individuals in affecting the breadth of knowledge spillovers. Section 3 discusses our
measure of knowledge spillovers and provides descriptive statistics about their geographical
extension. Section 4 illustrates the variables used in the regression analysis and the identification
method. Section 5 discusses the results and Section 6 concludes.
2. Our hypotheses: knowledge spillovers and heterogeneity across regions and inventors
The traditional argument about knowledge spillovers being geographically localized stems
from the idea that physical proximity makes it easier to access information produced by others (for
a survey, see Doring and Schnellenbach, 2006; Feldman, 1999). The evidence suggests that
inventive activities benefit more than manufacturing from co-location, particularly in skilled and
4

R&D-intensive industries and in sectors that rely to a greater extent on tacit knowledge and
learning-by-doing (Pavitt, 1987; Audretsch and Feldman, 1996; Maskell, 2001).
Some authors also argue that there is variation across regions in the extent to which
spillovers develop locally; that is, knowledge flows are stimulated in some regions more than in
others according to their local technological endowment. Almeida and Kogut (1999) show that the
localization of knowledge varies across US regions, with Silicon Valley, New York, and Southern
California at the top of the list for semiconductors. Thompson (2006) indicates that knowledge
spillovers are stronger in California, Texas, and Massachusetts than elsewhere (see also Jaffe et al.,
1993).
Our first hypothesis develops from this literature, and it focuses on the impact of the
technological milieu external to the inventor’s organization on the probability that he or she benefits
from local knowledge spillovers during the inventive process. The expectation is that inventors
located in technologically well-endowed regions have a higher probability of benefitting from local
knowledge spillovers and a lower likelihood to resort to spillovers produced in other regions
compared to inventors located in technologically poor regions.
Let us label N the pool of people located in all regions with whom an inventor can
potentially interact with and receive knowledge spillovers from. N is unevenly distributed across the
regions. Let us call Pii the probability that an inventor located in region i benefits from knowledge
spillovers produced by people located in his/her region; and Pij the probability to benefit from
knowledge spillovers produced by people in other regions, with j ≠ i. Two factors affect Pii: the
pool of people ni in the home region, and the probability pii to develop interactions with them.
Similarly, the probability Pij depends on the pool of people in these regions (nj) and the probability
pij to interact with them. Given N, our hypothesis is that inventors located in technologically better-
endowed regions have a higher Pii and a lower Pij compared to inventors located in technologically
poorer regions. This is because inventors in “better” regions can rely on higher ni and lower nj than
5
inventors in “worse” regions. Moreover, there is no reason suggesting that pij can be greater than pii.
If anything, the literature suggests the opposite, viz., geographical proximity facilitates knowledge
spillovers. Thus, pii cannot be smaller than pij. Our first hypothesis then is:
Hypothesis 1. Inventors located in technologically more active regions have a higher
probability to benefit from local knowledge spillovers. Moreover, they have a lower probability to
rely on spillovers generated in other regions compared to inventors in technologically poorer
regions.
Note that Hypothesis 1 regards Pii and Pij only. It does not look at the separate effects of nii
(nij) and pii (pij) on Pii (Pij). That is, this hypothesis does not say anything about whether
geographical proximity has an effect on Pii on top of nii.
An alternative view is that, rather than the location in a technological cluster, the individual
characteristics of the researcher and his/her “social” network shape the geographical breadth of
knowledge spillovers (see, among others, Audretsch and Stephan, 1996; Breschi and Lissoni, 2001;
Sorenson and Singh, 2007). By studying patenting co-authorship in the US, Fleming et al. (2007)
argue that previous working relationships among inventors produce robust ties that are then used for
future interactions, also after the inventor moves geographically (see also Agrawal et al., 2006).
They also find that close ties between university professors and their students are maintained by
attending conferences and through personal visits. Earlier work by Allen (1977) indicates that
inventors use their social “networks” composed of friends and colleagues who are knowledgeable
about specific research issues, as sources of new knowledge. By means of patent citations, Singh
(2005) finds that once inventors’ interpersonal ties are controlled for, geographical proximity and
firm co-affiliation produce a small additional effect on the probability of knowledge flows.
Oostergaard (2007) uses survey data from a sample of engineers in the wireless communications
cluster in North Denmark and shows that informal knowledge flows are more likely with former
classmates and friends, and with people with similar educational background or earlier joint work
6

experience. A related literature shows that social institutions provide individuals with a specific set
of norms and values that model their later behavior. This also applies to people attending the same
Universities, making it easier to diffuse ideas and practices among them (for a review see Bercovitz
and Feldman, 2008).
Our survey offers unique data on inventors’ personal characteristics. This makes it possible
to estimate the relative contribution of individual and location factors on the geographical breadth
of knowledge spillovers. Thus, after controlling for the age and mobility of the inventors, we
estimate the marginal effect that the level of education of the inventors produces on the
geographical reach of knowledge spillovers. Our expectation is that the higher the level of
education, the higher the likelihood that the inventors benefit from spillovers with people located
distant from them. There are three reasons for this.
First, inventors with a high level of education spent quite a few years in other institutions
and in specific research communities with university and PhD classmates before working at their
current positions. This creates opportunities to build research connections with individuals sharing
common scientific interests and research languages. These relationships are likely to be “enduring”
as they are established early in the inventors’ lives, during the formative stages, with members of a
scientific community that share rules of trust and reputation. We expect inventors with a higher
level of education to have a higher probability to be part of these networks. And since the
geographical coverage of these networks is typically different and larger than the current inventors’
location, we expect the exchange of knowledge to take place across distances. In other words, the
fact that the inventors rely on these networks limits the importance of co-location for knowledge
interactions. Second, inventors with a high level of education are more likely to meet their peers by
attending conferences, seminars, and meetings that cut across regions and countries. These events
are a locus where interactions take place, therefore enlarging the inventor networks. Third, the level
of education of the inventors contributes to their absorptive capacity. In turn, absorptive capacity is
7
important to appraise the potential value of knowledge and to absorb it, in particular when this
comes from outside the inventors’ organization and when the source is distant from the inventor.
These considerations lead to our second hypothesis:
Hypothesis 2. All else being equal, the higher the education of the inventor, the higher the
probability that he or she benefits from knowledge spillovers with distant people. The lower the
level of education, the higher the probability to rely on local interactions.
3. Our measure of knowledge spillovers
An important contribution of this paper is that it documents the use of knowledge spillovers
in producing invention without resorting to indirect indicators like patent citations. Since
knowledge flows are invisible and they leave “[…] no paper trial” (Krugman 1991), we collected
direct information from the inventors. The PatVal-EU survey interviewed the inventors of 9,550
patents granted by the European Patent Office (EPO) between 1993 and 1998 in Denmark, France,
Germany, Hungary, Italy, the Netherlands, Spain and the United Kingdom. The survey was directed
to the first inventor listed in the patent and provides information on the individual inventors, the
invention process, and the resulting patents. Giuri et al. (2007) report the details of the survey and
the key descriptive statistics. This paper uses information on a sub-sample of 6,750 patents that we
obtained by dropping patents with missing data.1
To the specific purpose of studying the geographical breadth of knowledge spillovers we
asked the inventors the following question:
1 We also excluded the French patents from the analysis. This is because in all countries, but France, the inventors responded to the questions posed by the questionnaire. In France, depending on the issue, the questionnaire was filled out by either the inventors or the managers of the applicant organizations. Since this creates a potential source of bias in the data, we excluded French patents from the dataset.
8
“Were interactions such as discussions, meetings and sources of ideas with the
following types of people (apart from co-inventors) important during the research that
led to the patented invention? (0 = not used, 1 = not important, 5 = very important):
• People belonging to other unaffiliated organizations, and that it typically takes less
than an hour of travel time to reach their office or location (hereafter, Close people);
• People belonging to other unaffiliated organizations, and that typically takes more
than an hour of travel time to reach their office or location (hereafter, Distant
people)”.2
We deliberately defined geographical proximity in terms of the time that the inventor needs to
reach the location of the interacting party. This limits problems associated with other measures of
geographical distance. For example, two locations might be similar in terms of mile distance for an
inventor, but extremely different in terms of effort/time that he needs to reach them. Mile-based
measures would consider them as equivalent for the researcher. Our measure does not. Moreover,
compared to measures of geographical distance based on administrative boundaries, our definition
solves cases in which locations are considered distant because they belong to different
administrative regions, though they are geographically close; or cases in which, though distant in
space, locations are considered close because they belong to the same administrative region.
Further, a recent work by Gittelman (2007) looks at the importance of geography for research
collaborations in the US biotechnology industry. For more than 5,000 collaborative research papers
published by small US biotechnology firms she calculated the mile distance between co-authoring
organizations in each paper, and found that distance is largely bimodal: there is one mode in which
2 We explicitly asked the inventors to exclude interactions with co-inventors. We did not ask to exclude informal interactions set up within other forms of collaborative agreements. However, our data indicate that more than 40% of “non-collaborative” patents involve informal interactions. Yet, the importance of the latter is higher for “collaborative” than for “non-collaborative” patents. This is consistent with the idea that when knowledge spillovers are important inputs for the invention process, firms also engage in cooperative R&D agreements (Cassiman and Veugelers, 2002).
9
team members are co-located within 50 miles (about 18% of the cases) and a second larger group of
papers (60% of the sample) with an average distance between team members higher than 800 miles.
Our Close and Distant measures are consistent with this bimodal distribution.
We transformed the 0-5 scores into two dichotomous variables: Close is equal to 0 if the
inventors did not establish any Close interaction for developing the patent (score = 0); it is equal to
1 if they used them, regardless of their importance (score = 1 to 5). The same applies to Distant
interactions (0/1). This transformation is based on the consideration that the 1-5 score might be
highly subjective and therefore difficult to compare across inventors. This problem is unlikely to
apply to the distinction between 0 (i.e., no interactions at all) and 1 (i.e., interactions are used,
regardless of their importance).
Our empirical analysis develops in three steps. It first shows the unconditional probabilities of
the use of Close and Distant interactions during the inventive process. It then moves to the Bivariate
Probit regressions to study the factors that affect the use of Close and Distant interactions. This is
the premise for our third step in which we compute the marginal effects of the covariates for the
predicted probabilities of different combinations of outcomes.
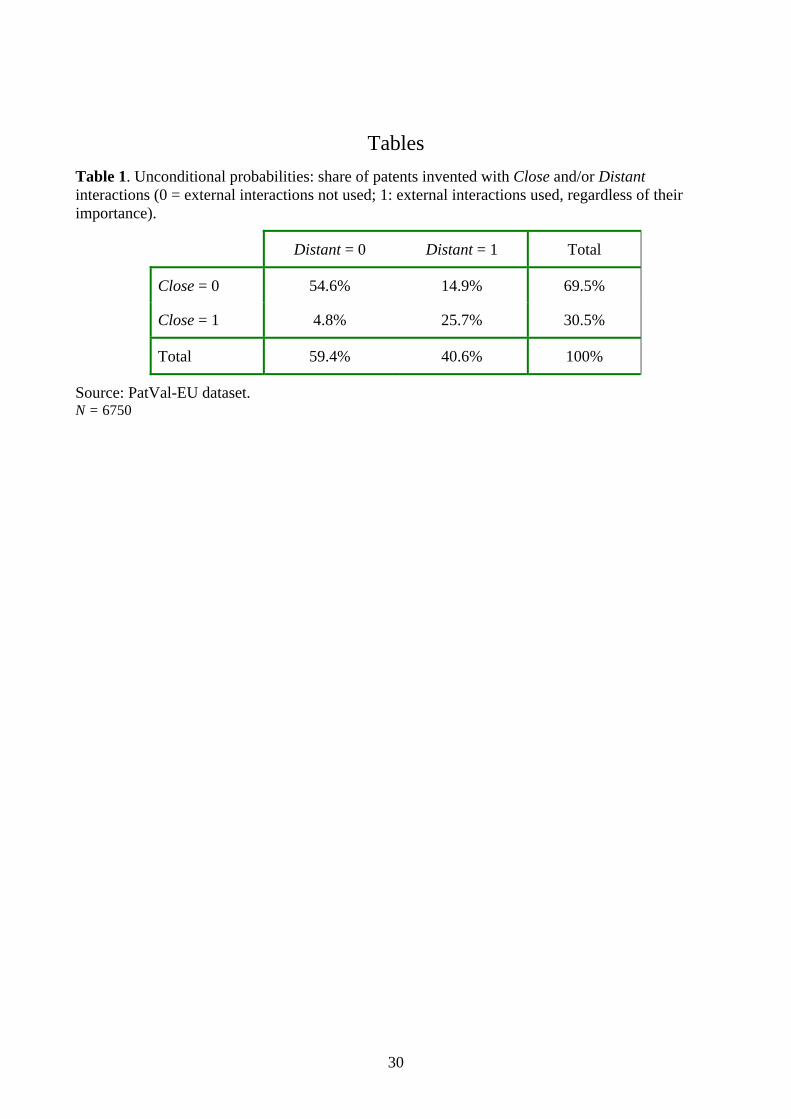
The unconditional probabilities of Close and Distant interactions are in Table 1. The table
reports the share of patents invented with either Close or Distant interactions, with both Close and
Distant interactions, and with none of them.
[TABLE 1]
Over half of the patents (54.6%) are developed with no interactions with people external to
the inventor’s organization. This suggests that external interactions, those with geographically close
or distant people, are not a major input in the inventive process or, at least, they are not as diffused
10
as one might think according to the numerous contributions on the importance of knowledge
spillovers.3 Further, the inventors of 25.7% of the patents establish external interactions regardless
of the distance with the interacting parties (both Close and Distant). Geographical proximity matters
only in 4.8% of the cases: this is the share of patents developed by using interaction with Close
individuals only. This share is lower that the share of patents (14.9%) developed with interactions
with Distant people.
Though unexpected, given the many contributions on the role of geographical proximity for
knowledge spillovers, this evidence is consistent with the following two considerations. The first
one is that the share of potentially matching people outside a one hour reach of the inventor (nj) is
much larger than the share of people within a one hour reach (ni). This makes the unconditional
probability to interact with Distant people higher than the probability to link with Close individuals.
Second, other authors find similar results. Audretsch and Stephan (1996) find that most of the links
between scientists and private biotechnology companies in the USA are not local. Gittelman (2007)
shows that, apart from a core of regional ties, a much larger number of research collaborations by
US biotechnology firms are across distance. For a sample of SMEs in New Zealand, Davenport
(2005) finds that non-local interactions matter for innovation more than local links (see also Hendry
et al., 2000; Staber, 1996). Our share of local interactions is also consistent with the paper by Jaffe
et al. (1993), who find that the share of local citations (excluding self-citations) within a
Metropolitan Statistical Area is between 4.3% and 8.8%, depending on the type of applicant
organization.
4. Empirical analysis: method and measures
3 We also have information on the importance of interactions with people Internal to the inventor’s organization. Only 19.5% of the patents are invented with no internal interactions (excluding co-inventors), suggesting that knowledge spillovers in the form of discussions, meetings, etc., are mostly internalized within the organization of the inventor.
11

We estimate two equations to explain the geographical breadth of knowledge spillovers. Our
dependent variables are the dichotomous Close and Distant variables. Close (Distant) takes the
value 1 if the inventors use Close (Distant) interactions during the inventive process; it takes the
value 0 if no Close (Distant) interactions are established.
By means of a Bivariate Probit regression we estimate the two equations simultaneously.
This does not produce gains in efficiency compared to the univariate estimations (i.e., same
coefficients and same standard errors).4 It helps, however, to estimate the net effect of the
covariates on the geographical breadth of the spillovers (Close vs. Distant), regardless of the impact
they have on the institutional setting of the spillovers (Internal vs. External). To do this we estimate
the marginal effects of the regressors on the predicted probabilities of the four combinations of
outcomes (i.e., Close=1&Distant=1, Close=0&Distant=0, Close=1&Distant=0,
Close=0&Distant=1) computed after the Bivariate Probit model.
To test our hypotheses, we include variables for the technological endowment of the regions
and for the level of education of the inventors, as well as a large number of controls for the regions,
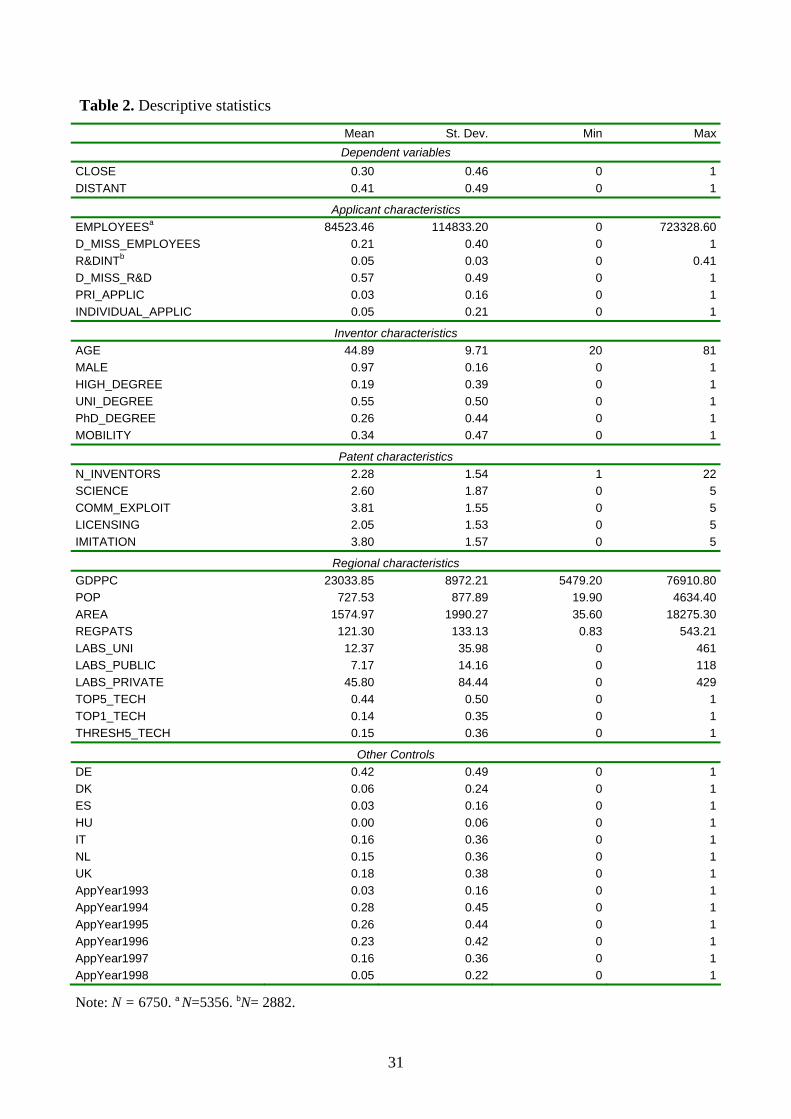
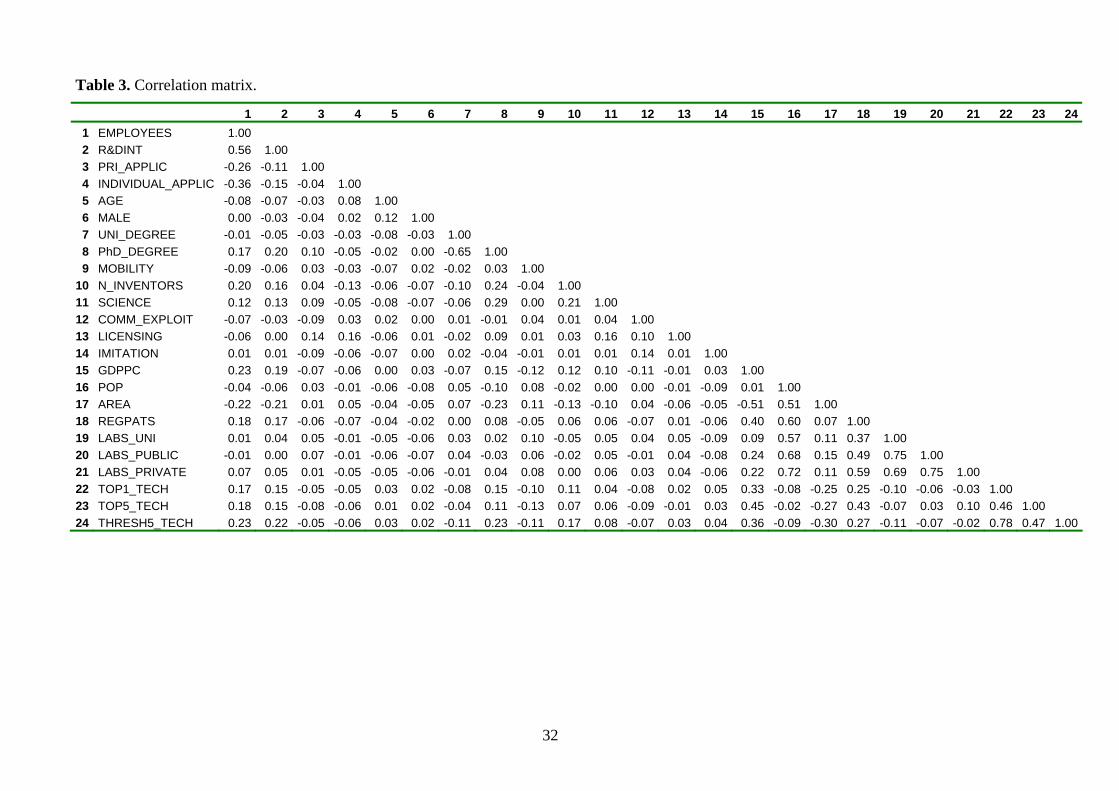
the inventors, the patented inventions, and the applicant organizations. Table 2 provides the
descriptive statistics of the variables. Table 3 shows the correlation matrix.
[TABLE 2]
The regions. We complemented the PatVal-EU database with information on the
technological endowment of the regions where the inventors were located at the time of the
invention, and incorporated this information in different specifications of the econometric model.
4 We thank Brownyn Hall for helpful suggestions on this point. As a robustness check we also employed the 0-5 importance score of Close and Distant interactions as dependent variables, and estimated them by means of two Ordered Probit regressions. These produced no relevant changes in the signs and statistical significance of the estimated coefficients compared to those of the Bivariate Probit model. The results are available from the authors.
12

General technological endowment. The “general” technological endowment of the regions is
measured by REGPATS: the total number of patents applied in all sectors (average in 1994-1996)
and invented in the NUTS3 region of the inventor (source: Regio Eurostat). We use this variable as
a proxy for the size of the local pool of potential ties.5 Then, in order to distinguish between private
and public sources of knowledge (e.g., Jaffe, 1989; Zucker et al.,1998; Furman et al., 2007; Alcacer
and Chung, 2007) we downloaded from the European R&D database a stock of about 20,000 R&D
laboratories located in Europe in 1995 and included them in the PatVal-EU database: the 1995 stock
of private research laboratories (LABS_PRIVATE), public research laboratories (LABS_PUBLIC)
and higher education laboratories (LABS_UNI) located in the NUTS3 region of the inventors.
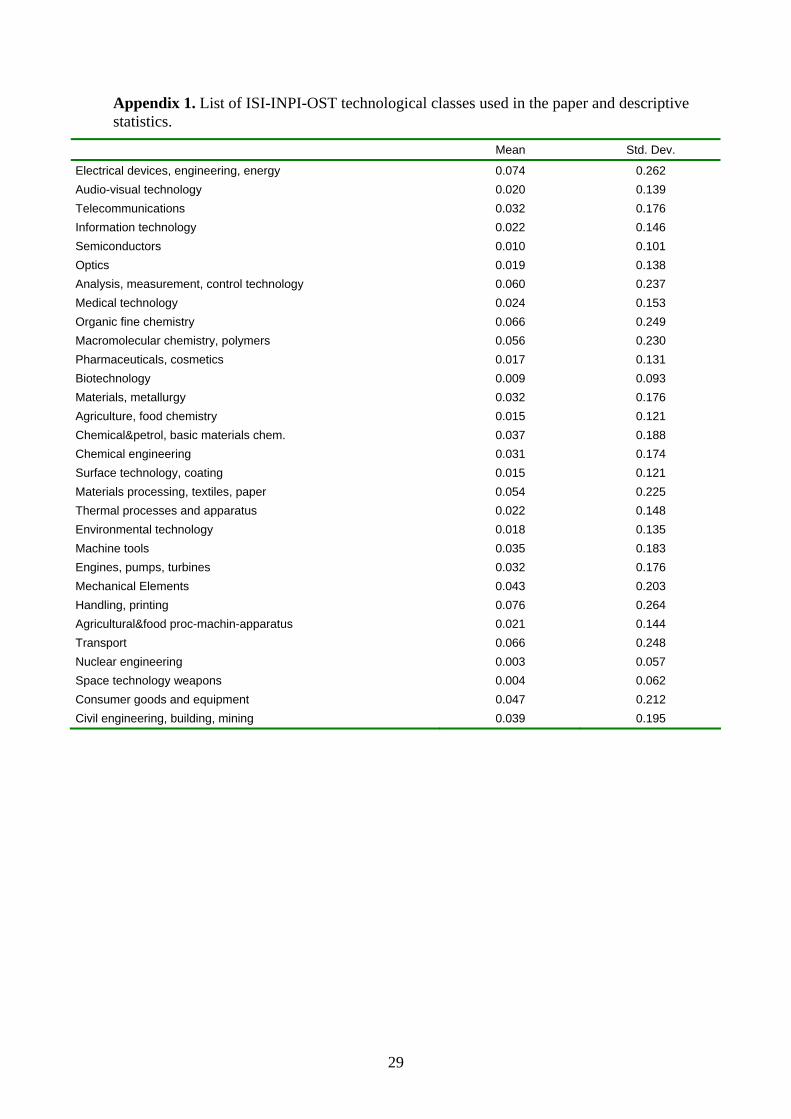
“Specific” technological endowment. We control for the strength of the region in the
specific technology of the patent (see, for example, Jaffe, 1989; Furman et al., 2007). We classified
the patents in our sample according to the ISI-INPI-OST classification (see Appendix 1 for the list
of the technological classes). The breadth of the technological classes is such that they include inter-
connected micro fields, without being too narrow to capture only research in the very micro-
specialty. From the Regio-Eurostat database we collected the 1994-1996 number of regional patents
applied at the EPO in each ISI-INPI-OST class. We used them to compute the ratio Techit/Techt,
that is, the ratio between the patents invented in the region i in the specific technology t and the total
number of patents invented in that technology in all regions. Based on this ratio we constructed
three dummy variables that indicate the strength of the region in the discipline of the invention:
TOP5_TECH that is equal to 1 if the region is top 5% in the specific technology, and 0 otherwise
(ratio between 1.4% and 15%); TOP1_TECH that is 1 if the region is top 1% (ratio between 4% and
15%); TRESH5_TECH for regions with more than 5% of the patents in the technology. By
employing these variables we limit the problem of variation in patenting activity across
5 By using the number of patents rather than the individuals that developed them, we account for differences in inventors’ productivity. In most of the cases, the size of the NUTS3 regions is consistent with our “within one hour travel distance.” The list of regions is available from the authors and from the website http://ec.europa.eu/comm/eurostat/ramon/nuts/codelist_en.cfm?list=nuts.
13

technologies (e.g., 100 patents in a discipline might cover 80% of all patents in that discipline; it
might cover only 10% of total patenting in a different field). Also, we can capture possible
threshold effects in the rise of knowledge spillovers.6
Regional controls. In order to estimate the net effect of the technological characteristics of
the regions after controlling for their scale, density, and development we include exogenous
regional controls for size (AREA, i.e., area of the region in square kilometers), population (POP,
thousands of people living in the region, average 1994-1996), and general economic conditions
(GDPPC, i.e., regional per capita Gross Domestic Product in 000 of purchasing power parity
corrected for inflation, average 1994-1996) at the NUTS3 level.
The inventor. The PatVal-EU survey provides information on the individual characteristics
of the inventor who established the interactions. Our key explanatory variable for Hypothesis 2 is
the level of education of the inventors.
Education. We know the degree of education of the inventors at the time of the invention.
We employ three dummy variables, i.e., Secondary and High School (HIGH_DEGREE), University
BSc or Master (UNI_DEGREE), PhD (PhD_DEGREE), to test our second hypothesis that the
higher the level of education of the inventor, the higher (lower) the probability that he or she
benefits from knowledge spillovers with geographically distant (close) people.
Age. The age of the inventors (AGE) is calculated as the years between the date of birth and
the date of the patent application. Our suspicion is that older and more experienced inventors are
more likely to be a source rather than a recipient of knowledge spillovers: they are more likely to
produce knowledge that is beneficial to others than to benefit from spillovers generated by others.
We therefore expect older inventors to rely less frequently on knowledge interactions external to
their organization compared to their younger peers. As far as the geographical breadth of the
6 These dummy variables are calculated at the NUTS2 regional level because NUTS3 level data by micro technological classes are not available from Regio-Eurostat. However, as a robustness check, we used the IPC1-digit technological classification to compute the three dummies at the NUTS3 regional level, with no significant changes in the estimated results.
14

interactions is concerned, older inventors might have wide personal networks developed over their
life cycle, leading to more Distant interactions.
Gender. The gender of the inventor (MALE, which is 1 if male; 0 if female) controls for the
effort and time that, on average, male inventors can spend in doing research compared to women.
Mobility. Finally, a specification of our econometric model includes a variable on inventors’
mobility across employer organizations before the patent was invented. MOBILITY, that is equal to
1 if the inventor changed employer at least once in the ten years before the patent (0 otherwise) is
provided by the survey. Mobility of people across organizations and places is described in the
literature as an important mechanism through which knowledge spillovers take place. The source of
these spillovers is twofold. First, the inventor himself, by moving, transfers knowledge (see Song et
al 2004). Second, he/she can develop personal networks in the different locations and organizations
that he/she visits (see, for example, Almeida and Kogut, 1999; Fleming, King and Juda, 2007,
Agrawal et al., 2006). Our goal is to estimate the additional effect of the level of education of the
inventors on the breadth of knowledge spillovers after controlling for other inventors’
characteristics, including mobility.
The patented invention. We control for the following characteristics of the inventions.
Science as a source of knowledge. The variable SCIENCE indicates the importance of the
scientific literature as a source of knowledge for the research leading to the patent. It is provided by
the PatVal-EU survey. It ranges between 0 (not used) and 5 (very important). Because of the more
open nature of scientific research compared to applied work (Merton, 1942; Dasgupta and David,
1994) we expect the probability to interact with people external to the inventor’s organization and
geographically Distant to be higher for science-based patents than for patents that rely less on
scientific knowledge. This would be consistent with recent work by Sorenson and Singh (2007) and
Gittelman (2007) who show that, because of the more open and spatially dispersed communities of
15
individuals involved in science, the benefits of geographical proximity are less important in science
than in technology.
Co-inventorship. We deliberately asked the inventors to exclude interactions with co-
inventors from the answer to the question on Close and Distant interactions. Yet, we use the number
of inventors listed in the patent (N_INVENTORS) to control for the role of other types of
interactions in the invention process. This variable is also an indicator of the research effort and the
scale of the project leading to the patent (see, for example, Gittelman and Kogut, 2003).
Reasons to patent. Inventors might be more inward-looking when inventions are patented in
order to be exploited commercially or to prevent others from imitation. Differently, they might
interact more with external parties when patents are to be licensed out. By using our survey
information we include three variables on whether the patent was applied for commercial
exploitation (COMM_EXPLOIT), to be licensed out (LICENSING), or to prevent others from
imitation (IMITATION). All three variables range between 0 (not important) to 5 (very important).
The applicant organization. The attributes of the applicant organization may affect the use,
costs and benefits of Close and Distant interactions, as well as the decision to develop external
links.
Type of applicant. About 92% of the patents in our database are granted to business
companies. In the remaining 8% of the cases they are granted to individual inventors and public
research organizations including universities. We use three dummy variables for the type of
applicant organization: PRI_APPLIC takes the value 1 if the applicant organization is a university
or a public research institution, INDIVIDUAL_APPLIC takes the value 1 if the applicant is an
individual inventor, and the baseline FIRM_APPLIC.
Size and R&D intensity. For patents granted to private companies we complemented the
PatVal-EU database with information on the size and R&D intensity of the firms (average 1990-
1996). We collected these data from Compustat (1998) and Amadeus (2005). Both variables are at
16
the level of the parent company. The number of employees (EMPLOYEES) is a proxy for the size
of the firms, while the ratio between R&D expenditure and sales (R&DINT) measures their R&D
intensity. For missing observations we include two dummy variables: D_MISS_EMPLOYEES and
D_MISS_R&D.7 By controlling for both firm size and R&D intensity, we separate the effect of the
scale of the organization from its capacity and effort devoted to innovation. The development of
inventions requires technical equipment, research laboratories, instruments, research personnel, and
complementary expertise. Firm size and R&D intensity might signal the availability of these
resources internally, and therefore the extent to which inventors might need to resort to interactions
external to firm. The sign of the correlations depends on whether, in the case of patents, internal and
external resources are complements or substitutes.8 These variables also control for the different
costs that firms can bear to set up the interactions. More specifically, if Distant interactions requires
higher organizational capabilities and financial resources than Close interactions, then inventors in
smaller firms might suffer more from this constrain and interact Close more frequently than Distant.
Other controls. All regressions include dummies for the application year (YEAR, 1993 to
1998), country of the inventors (DE, DK, ES, IT, HU, NL, UK) and the 30 ISI-INPI-OST
technological classes of the patent (TECH_FIELD).
5. Results
5.1 Univariate probabilities
The dependent variables of the two equations in the Bivariate Probit model are the dichotomous
variables Close and Distant. The two equations are correlated with rho 0.81 (chi-sq1 = 1077.37, p =
7 Data on EMPLOYEES are available for 77.78% of the patents; data on R&DINT for 41.92% of the patents. 8 See, for example, Acs, Audretsch and Feldman (1994), Feldman (1999), Cassiman and Veugelers (2002).
17
0.00).9 While interpreting the results shown in Tables 4 and 5, however, it is worth bearing in mind
that the purpose of the Bivariate Probit regressions is to set the stage for the next step of the
empirical analysis in Section 5.2.
[TABLES 4 and 5]
The six specifications in Tables 4 and 5 differ for the inclusion of the regional variables and
for MOBILITY that is in Model 6 only. The Tables report the marginal effects that a one unit
change in the independent variables produce on the probability of having Close (Distant)
interactions. For continuous variables, the marginal effect is calculated at the mean of the
independent variables. For dummy variables, it measures the difference in the dependent variable
between having and not having the specific characteristic. For the covariates with a large range of
variation (EMPLOYEES, GDPPC, POP, AREA, REGPATS, LABS) we used logs as indicated in
the Tables. All specifications include dummies for missing values in EMPLOYEES and R&DINT,
as well as dummies for the country of the inventor, year of application, and technological field of
the patent (not shown in the Tables).
Hypothesis 1 is about the role of inventors’ location on the probability to set up Close and
Distant interactions. Model 1 estimates the effect of REGPATS, the general technological
environment. The results show that, after controlling for other regional characteristics, the
correlation has the expected signs on Close and Distant, but it is not statistically significant. Model
2 differentiates between different sources of spillovers in the region: public, private, and University
9 All regressions include Cluster robust estimators on firms and sampling weights for the hypothetical unbiased sample of patents that we initially selected. This differs from the final dataset due to the non-responses and to the over-sampling of “important” patents (for details, see Giuri et al., 2007).
18

research laboratories. Again, none of these variables produces a statistically significant effect on
Close and Distant.10
It might be, however, that knowledge spillovers are more likely to come from people who
share close research interests. We therefore introduce in Models 3, 4 and 5 the variables
TOP5_TECH, TOP1_TECH and THRESH5_TECH that measure the strength of the regions in the
specific technology of the patent. These variables are positively correlated with Close and
negatively correlated with Distant interactions. The effect, however, is statistically significant (10%
level) only for TOP1_TECH and THRESH5_TECH. This suggests that location matters for
knowledge spillovers only in the top regions in Europe in the specific technology of the invention.
When the inventors are located in these rare regions the probability to interact with local people
increases, while the probability to link to people in other regions decreases.11
We now turn to Hypothesis 2. The signs of UNI_DEGREE and PhD_DEGREE are positive
and statistically significant (1% level) on Distant. They are not correlated with the probability of
setting up Close interactions. This result holds across all specifications and after controlling for the
other inventors’ characteristics. In particular, the age of the inventors is negative and statistically
significant on both Close and Distant interactions and the magnitude of the marginal effects is
similar in the two equations. This suggests that AGE is negatively correlated with the probability of
developing external linkages, rather than with their geographical breadth: senior researchers are less
likely to receive spillovers from people external to their organization. A 10-year increase in age
corresponds to a lower probability of Close and Distant interactions of the about 3.5% and 2.7%
10 We are aware of the fact that a firm location decision might depend on the characteristics of the region (e.g., Alcacer and Chung, 2006) and that the firm itself might contribute to shape the regional technological characteristics. However, since our unit of analysis is the individual inventor, these issues are not a major concern in our paper. It is unlikely that the strategic behavior of a firm applies also to the individual employees. It is also unlikely that the specific inventor determines the technological characteristics of the region. Moreover, we use pre-determined regional variables that, as such, are not the results of later knowledge interactions.
11 We also performed Models 3 to 5 by using the number (or the share) of patents in the technology rather than the dummy variables. Number and share were not statistically significant, suggesting that a threshold effect exists. We also employed the number of patents in all technologies rather those in the specific technology of the invention to construct the three dummy variables. Again, these variables were never statistically significant, both at the NUTS3 and NUTS2 regional level.
19
respectively.12 In Model 6 we add MOBILITY. The estimated marginal effect is positive and
statistically significant (5% level) on both Close and Distant, with similar magnitude. This suggests
that MOBILITY increases the probability to set up interactions external to the organization, but it
does not affect their geographical extent.13
At the level of the invention, the marginal effect of SCIENCE is positive on both Close and
Distant and it is statistically significant at 1% level. A one unit change in the importance of
SCIENCE from its mean produces an increase of 3.1% in the predicted probability of Close
interactions and of 4% of Distant interactions. This suggests that science-based research relies more
on long-distance spillovers.14 Also, LICENSING has a positive and statistically significant effect on
both Close and Distant, with similar marginal effects: inventors are more likely to engage in both
Close and Distant interactions if the invention is intended to be licensed out.
Finally, at the level of the applicant organization, the higher the R&D intensity of a firm, the
lower the probability to establish both Close and Distant interactions (statistically significant at 5%
and 10% level respectively). Again, the magnitude of the marginal effects is similar in the two
equations, suggesting that R&DINT is negatively correlated with the probability of establishing
interactions external to the firm.
Thus, so far, our results indicate that, first, the location of the inventors in a technological
cluster increases the probability of local interactions only in the restricted club of top regions in
Europe in the specific technology of the invention. Second, the educational background of the
12 A specification of our model used AGE2 together with AGE to test for possible non linear effects of AGE (e.g., Cole, 1979). AGE2 was never statistically significant. 13 We include MOBILITY only in Model 6 because of its potential endogeneity with respect to other inventor’s characteristics like the level of education. However, the correlation between MOBILITY and education is 0.03 for PhD_DEGREE (statistically significant at 10% level) and -0.02 for UNI_DEGREE (not statistically significant). Moreover, the marginal effect of MOBILITY does not change if it is included in place of the educational of the inventors. 14 The correlation between SCIENCE and PhD_DEGREE is 0.29. When we drop SCIENCE from the estimations, the marginal effect of PHD becomes positive and statistically significant on both Close and Distant, but the effect on Close is much smaller than that on Distant. This suggests that if we do not control for SCIENCE, the PHD variable captures part of the effect due to the scientific nature of the patent.
20
inventors and the scientific nature of the research conducted matter as well. Specifically, inventors
with a PhD degree and those who rely more on science as a source of knowledge have a higher
probability to benefit from spillovers with distant people. Yet, an issue arises here concerning the
effect of our covariates on the “geographical” breadth of the interactions net of the effect on the
“institutional” choice. The next Section will take care of this issue.
5.2 Institutional and geographical breadth of knowledge interactions: bivariate probabilities
Both dependent variables of the Bivariate Probit regressions are the result of two choices: the
choice of the institutional setting of the interactions (Internal vs. External) and the choice of their
geographical breadth (Close vs. Distant). The marginal effects in Tables 4 and 5 do not indicate the
effect of the regressors on each dimension separately. In other words, they do not reveal the net
effect of the covariates on the geographical breadth of the spillovers.15
One way to address the problem is to estimate the marginal effects of the covariates on the
predicted probabilities of the four combinations of outcomes computed after the Bivariate Probit
model; that is, Close=1&Distant=1, Close=0&Distant=0, Close=1&Distant=0,
Close=0&Distant=1. Table 6 reports the results for the variables in Model 4. Table 7 shows the
marginal effects for selected regressors introduced in Models 2, 3, 5 and 6.
[TABLES 6 and 7]
The first column in Tables 6 and 7 shows the factors correlated with the probability to
interact with people external to the inventor’s organization, irrespective of their geographical
15 Thus, the Close equation indicates the factors that influence the probability to set up interactions External to the inventor’s organization and geographically Close. Similarly, the Distant equation show the factors that affect the probability to develop interactions External to the inventor’s organization and geographically Distant.
21
distance pr(Close=1&Distant=1). The second column reports the effects of the covariates on the
probability of not having any external interaction pr(Close=0&Distant=0). We can therefore use
these two columns to isolate the effects of the covariates on the choice of the institutional setting of
the interactions. Differently, the last two columns in the Tables indicate the net effect of the
regressors on the geographical breadth of the spillovers. Indeed, given that the inventors benefit
from interactions with people external to their organization, the only difference between
pr(Close=1&Distant=0) and pr(Close=0&Distant=1) is the geographical breadth of the spillovers.
The results show that a group of factors influences the institutional setting in which the
spillovers take place, irrespective of the geography of the links. The AGE of the inventors has a
positive and statistically significant effect on pr(Close=0&Distant=0) while it is negative and
statistically significant on pr(Close=1&Distant=1). Differently, the marginal effects of
PhD_DEGREE and MOBILITY are positive and statistically significant on
pr(Close=1&Distant=1); they are negative and statistically significant on pr(Close=0&Distant=0).
The same correlations hold for SCIENCE and LICENSING. Thus, younger, highly educated, and
mobile inventors are more likely to take advantage of spillovers generated outside the employer
organization. This is particularly true for science-based inventions and inventions that are intended
to be licensed out. As expected, however, the higher the R&D intensity of the firm, the lower the
likelihood to interact with external people: the marginal effect of R&DINT is positive and
statistically significant on pr(Close=0&Distant=0) and it is negative and statistically significant on
pr(Close=1&Distant=1).
Let us now answer the question of our paper: What shapes the geographical breadth of
knowledge spillovers? The level of education of the inventors plays a key role: not only do highly
educated inventors establish interactions with people external to the organization, but these
interactions also tend to be with Distant people. In particular, inventors with PhD level training
enter into geographically wide research networks more than their less educated peers. This supports
22
Hypothesis 2 and it is robust to different specifications. A 0 to 1 change in PHD_DEGREE
corresponds to a 4.9% increase of pr(Close=0&Distant=1) and a 1.4% decrease of
pr(Close=1&Distant=0). It is worth keeping in mind that this effect comes after controlling for
inventors’ mobility, age and gender.
It also holds after controlling for the more open nature of science-based research
(SCIENCE) that, as expected, is positively correlated with the probability of setting up
geographically Distant interactions (the marginal effect of SCIENCE is positive and statistically
significant on pr(Close=0&Distant=1)). Also, inventors in large firms and in public research
institutions are more likely to interact with Distant people, as shown by the marginal effects of
EMPLOYEES and PRI_APPLIC.
Finally, Hypothesis 1 is also confirmed, but only for the very rare regions in Europe where
the bulk of the research in the specific technology is performed. TOP1_TECH and
THRESH5_TECH are positive and statistically significant on pr(Close=1&Distant=0); negative
and statistically significant on pr(Close=0&Distant=1).
5.3 Robustness checks
We performed a number of robustness checks in addition to those described in various parts
of the paper. We first controlled for the possible multicollinearity between the regional variables.
We alternately omitted GDPPC, POP and AREA, and all of them together. We also performed
Models 3 to 6 without controlling for REGPATS and LABS, and used the density of
REGPATS/POP and REGPATS/GDPPC. In all these specifications the sign and statistical
significance of the remaining variables did not change significantly compared to those in Tables 4
and 5.
At the inventor level, we controlled for the possible unobserved heterogeneity across
individuals. For each inventor we collected the number of patents applied at the EPO before the
23

patent in our sample.16 This marginal effect of this variable was not statistically significant, while
the coefficient and the statistical significance of the other variables did not change.
Finally, we checked for the correlation between the firm level variables. We perform the
regressions by omitting R&DINT. The statistical significance of EMPLOYEES did not change with
respect to Tables 4 to 7. Also, the marginal effect of PHD_DEGREE does not change significantly
when R&DINT is dropped from the regressions, which reduces the potential problem of correlation
between the two variables. All these results are available from the authors.
6. Conclusions
This paper provides new evidence about the geographical breadth of knowledge spillovers.
It employs information provided directly by the inventors of EPO patents that we interviewed
through a large scale survey (the PatVal-EU survey).
We found that, during the inventive process, knowledge spillovers from geographically
distant people are more frequent than those from nearby individuals. We then investigated the
factors that explain the geographical breadth of these spillovers. Our results show that the
educational background of the inventors plays a key role. Specifically, a higher level of education,
particularly a PhD, increases the likelihood of knowledge spillovers from geographically distant
individuals. It also decreases the probability of interaction with people located close to the
inventors. This result holds after controlling for other explanations provided by the existing
literature on this matter, such as the age, gender, and mobility of the inventors. Our interpretation is
that inventors with a higher level of education have better absorptive capacity and geographically
wide personal networks. By helping inventors scout and obtain useful knowledge, irrespective of
16 Though individual productivity might be a good variable to control for unobserved heterogeneity, it is also correlated with other inventors’ characteristics such as age, education, gender, mobility, and, as such endogenous with respect to them (see, for example, Levin and Stephan, 1991, Turner and Mairesse, in press, Mariani and Romanelli, 2007). This is why we do not show the results in the Tables.
24

where it is generated, education and the resulting openness of the inventors reduce the importance
of geographical proximity to exchange knowledge.
We also find inter-regional differences in the extent to which inventors benefit from close
vs. distant knowledge spillovers. These differences, however, apply only to the rare regions in
Europe (top 1%) that host the bulk of the research in the specific technology of the patent. Inventors
located in these regions have a higher probability to benefit from local spillovers and a lower
probability to resort to distant ties. Finally, our results confirm previous findings in the literature
about the open nature of scientific research: science-based patents are more likely to benefit from
spillovers with people external to the inventor’s organization and geographically distant.
Implications for the design of regional policies that, among other things, aim at fostering
local knowledge spillovers, arise. Our paper shows that, at least in Europe, a strong threshold effect
exists, as knowledge spillovers develop locally in the top 1% of regions in the specific technological
field of the invention. This suggests that, in order to be effective, regional policies would need large
investments in the creation of a critical mass of firms, institutions, and people working out related
activities. This adds to the fact that, in general, there is not consensus in the literature on the specific
role of geographical proximity in fostering knowledge spillovers beyond the effect of the
concentration of the pool of potential interacting people.
Our paper, however, suggests that policy interventions directed to the individuals to
stimulate their “openness” – by means of education, travelling, exchange of students, etc. – can be
effective in fostering the transmission of knowledge spillovers. They can be implemented in place
of, or in addition to, regional policies, and allow people to benefit from spillovers also when
knowledge is produced by geographically distant people. This reduces the importance of
geographical proximity. In this sense, the reliance on local spillovers seems to be an option that
inventors play when they do not have the capacity to take part in geographically wider networks.
25
References
Acs Z., Audretsch, D.B. and M.P. Feldman, 1994, R&D Spillovers and recipient firm size, The Review of Economics and Statistics, 76 (2), pp 336-340
Agrawal, A., I. Cockburn and J. McHale, 2006, Gone But Not Forgotten: Labor Flows, Knowledge Spillovers and Enduring Social Capital, Journal of Economic Geography, 6 (5), pp. 571-591
Agrawal, A., D. Kapur, and J.McHale, 2007, Birds of a Feather – Better Together? How Co-Ethnicity and Co-Location Influence Knowledge Flows, Working Paper 12823, National Bureau of Economic Research, Cambridge, MA
Alcacer J. and W. Chung, 2006, Location Strategies and Knowledge Spillovers, Management Science, 53(5) pp. 760-776
Alcacer, J. and M. Gittelman, 2006, Patent Citations as a Measure of Knowledge Flows: The Influence of Examiner Citations, The Review of Economics and Statistics, 88(4), pp 774-779
Allen, T. J. 1977. Managing the Flow of Technology: Technology Transfer and the Dissemination of Technological Information Within the R&D Organization. Cambridge, MA: MIT Press
Almeida, P. and B. Kogut, 1999, Localization of Knowledge and the Mobility of Engineers in Regional Networks, Management Science, 45(7), pp. 905-17
Audretsch, D.B. and M.P. Feldman, 1996, R&D Spillovers and the Geography of Innovation and Production, The American Economic Review, 86(3), pp. 630-640
Audretsch D., Stephan P., 1996, Company-Scientist Locational Links: The Case of Biotechnology, The American Economic Review, 86(3), pp. 641-652
Bercovitz J. and M.P. Feldman, (forthcoming), Academic Entrepreneurs: Organizational Change at the Individual Level, Organization Science
Cassiman B. and R. Veugelers, 2002, R&D Cooperation and Spillovers: Some Empirical Evidence from Belgium, American Economic Review, 92(4), pp. 1169-1184
Cole, S., 1979. Age and scientific performance, American Journal of Sociology, 84, pp. 958-977
Breschi S. and F. Lissoni, 2001, Localized knowledge spillovers vs. innovative milieux: Knowledge ‘tacitness’ reconsidered, Regional Science, 80(3), pp. 255-73
Dasgupta P. and P. David, 1994, Towards a new economics of science, Research Policy, 23, pp. 487-521
Davenport S., 2005, Exploring the role of proximity in SME knowledge-acquisition, Research Policy, 34, pp. 683-701
Doring T. and Schnellenbach J., 2006, What do we know about geographical knowledge spillovers and regional growth?: A survey of the literature, Regional Studies, 40(3), pp. 375-395
Feldman M., 1999, The new economics of innovation, spillovers and agglomeration: A review of empirical studies, Economics of Innovation and New Technology, 8, pp. 5-25
Fleming, L., C. King, and A. Juda., 2007, Small Worlds and Regional Innovation." Organization Science, forthcoming
Funke M. and A. Niebuhr, 2005, Regional geographic research and development spillover and economic growth: Evidence from West Germany, Regional Studies, 39(1), pp. 143-153
Furman, J., Kyle M., Cockburn I. and R. Henderson, 2007, Public and Private Spillovers, Location and the Productivity of Pharmaceutical Research, Annales d'Economie et de Statistique, forthcoming
26

Gittelman, M., 2007, Does geography matter for science-based firms? Epistemic communities and the geography of research and patenting in biotechnology, Organization Science, 18, pp. 724-741
Gittelman, M. and B. Kogut, 2003, Does Good Science Lead to Valuable Knowledge? Biotechnology Firms and the Evolutionary Logic of Citation Patterns, Management Science, 49 (4), pp. 366-382
Giuri P., Mariani M., Brusoni S., Crespi G., Francoz D., Gambardella A., Garcia-Fontes W., Geuna A., Gonzales R., Harhoff D., Hoisl K., Lebas C., Luzzi A., Magazzini L., Nesta L., Nomaler O., Palomeras N., Patel P., Romanelli M., Verspagen B., 2007, Inventors and Invention Processes in Europe. Results from the PatVal-EU survey, Research Policy, 36(8), pp. 1107-1127
Grossman, G. and E. Helpman, 1991, Innovation and Growth in the Global Economy, Cambridge, MA: MIT Press
Harhoff, D., Hoisl, K., Webb, C., 2006, European patent citations. How to count and how to interpret them, Unpublished Manuscript, Ludwig-Maximilian University of Munich
Hendry C, Brown, J. and R. J. DeFillippi, 2000, Regional Clustering of High Technology-Based Firms: Opto-Electronics in Three Countries, Regional Studies, 34(2), 129-144
Jaffe, A., 1989, Real Effects of Academic Research, American Economic Review, 79(5), pp. 957-970
Jaffe, A.B., Fogarty, M.S., B.A. Banks, 1998, Evidence from Patents and Patent Citations on the Impact of NASA and other Federal Labs on Commercial Innovation, Journal of Industrial Economics, 46(2), pp. 183-205
Jaffe A., Trajtenberg M. and M. Fogarty, 2000, Knowledge spillovers and Patent Citations: Evidence from a Survey of Inventors, The American Economic Review, 90(2), pp. 215-218
Jaffe, A., Trajtenberg M. and Henderson R., 1993, Geographic knowledge spillovers as evidenced by patent citations, Quarterly Journal of Economics, 108(3), pp. 577-98
Krugman, P. R., 1991, Geography and Trade. Cambridge, MA: MIT Press
Levin, S.G. and , P.E. Stephan, 1991. Research productivity over the life cycle: evidence for academic scientist. American Economic Review, 81(1), pp. 114–132
Mariani, M. and M. Romanelli, 2007, “Stacking” and “picking” inventions: The patenting behavior of European inventors”, Research Policy, 36(8), pp 1128-1142
Merton, R. K. 1942. Science and technology in a democratic order. Journal of Legal and Political Sociology, 1, pp. 115-126
Maskell, P., 2001, Towards a Knowledge-based Theory of the Geographical Cluster, Industrial and Corporate Change, 10(4), 919-941
Østergaard C. R., 2007, Knowledge flows through social networks in a cluster: Interfirm vs. university-industry contacts, Druid Working Paper series
Pavitt K., 1987. On the nature of technology, University of Sussex, SPRU, Brighton
Romer, P., 1990, Endogenous technological change, Journal of Political Economy, 98(5), pp.71-102
Saxenian, A.L,1994, Regional Advantage, Culture and Competition in Silicon Valley and Route 128, Cambridge (MA) and London
27
Singh J., 2005, Collaborative Networks as Determinants of Knowledge Diffusion Patterns, Management Science, 51(5), pp. 756-770
Sorenson, O and L. Fleming, 2004, Science and the diffusion of knowledge, Research Policy, 33, pp. 1615-1634
Sorenson O. and J. Singh, 2007, Science, social networks and spillovers, Industry & Innovation, 14, pp. 219-238
Staber U., 1996, Accounting for variations in the performance of industrial districts, International Journal of Urban and Regional Research, 20, pp. 299-316
Thompson P., 2006, Patent Citations and the Geography of Knowledge Spillovers: Evidence from Inventor- and Examiner-added Citations, The Review of Economics and Statistics, 88(2), pp. 383-388
Thompson P. and M. Fox-Kean, 2005, Patent Citations and the Geography of Knowledge Spillovers: A Reassessment, American Economic Review, 95(1), pp. 450-460
Turner, L., Mairesse, J., in press. Productivity differences across individuals in public research: an econometric study of French physicists’ publications and citations (1980–1997), Annales d’Economie et de Statistique
Verspagen B., 1997, European Regional Clubs: Do They Exist and Where Are They Heading? On Economic and Technological Differences between European Regions, in: Adams J., Pigliaru F. (Eds.), Economic Growth and Change: National and Regional Patterns of Convergence and Divergence, Edward Elgar, Cheltenham
Verspagen, B. and I. De Loo, 1999, Technology spillovers between sectors and over time, Technological Forecasting and Social Change, 60, pp. 215-235
Zucker, L., Darby, M. and J. Armstrong, 1998, Geographically localized knowledge: Spillovers or markets?, Economic Inquiry, 36, pp. 65-86
28
Appendix 1. List of ISI-INPI-OST technological classes used in the paper and descriptive statistics.
Mean Std. Dev.
Electrical devices, engineering, energy 0.074 0.262 Audio-visual technology 0.020 0.139 Telecommunications 0.032 0.176 Information technology 0.022 0.146 Semiconductors 0.010 0.101 Optics 0.019 0.138 Analysis, measurement, control technology 0.060 0.237 Medical technology 0.024 0.153 Organic fine chemistry 0.066 0.249 Macromolecular chemistry, polymers 0.056 0.230 Pharmaceuticals, cosmetics 0.017 0.131 Biotechnology 0.009 0.093 Materials, metallurgy 0.032 0.176 Agriculture, food chemistry 0.015 0.121 Chemical&petrol, basic materials chem. 0.037 0.188 Chemical engineering 0.031 0.174 Surface technology, coating 0.015 0.121 Materials processing, textiles, paper 0.054 0.225 Thermal processes and apparatus 0.022 0.148 Environmental technology 0.018 0.135 Machine tools 0.035 0.183 Engines, pumps, turbines 0.032 0.176 Mechanical Elements 0.043 0.203 Handling, printing 0.076 0.264 Agricultural&food proc-machin-apparatus 0.021 0.144 Transport 0.066 0.248 Nuclear engineering 0.003 0.057 Space technology weapons 0.004 0.062 Consumer goods and equipment 0.047 0.212 Civil engineering, building, mining 0.039 0.195
29
Tables Table 1. Unconditional probabilities: share of patents invented with Close and/or Distant interactions (0 = external interactions not used; 1: external interactions used, regardless of their importance).
Distant = 0 Distant = 1 Total
Close = 0 54.6% 14.9% 69.5%
Close = 1 4.8% 25.7% 30.5%
Total 59.4% 40.6% 100%
Source: PatVal-EU dataset. N = 6750
30
31
Table 2. Descriptive statistics
Mean St. Dev. Min MaxDependent variables
CLOSE 0.30 0.46 0 1DISTANT 0.41 0.49 0 1
Applicant characteristics EMPLOYEESa 84523.46 114833.20 0 723328.60D_MISS_EMPLOYEES 0.21 0.40 0 1R&DINTb 0.05 0.03 0 0.41D_MISS_R&D 0.57 0.49 0 1PRI_APPLIC 0.03 0.16 0 1INDIVIDUAL_APPLIC 0.05 0.21 0 1
Inventor characteristics AGE 44.89 9.71 20 81MALE 0.97 0.16 0 1HIGH_DEGREE 0.19 0.39 0 1UNI_DEGREE 0.55 0.50 0 1PhD_DEGREE 0.26 0.44 0 1MOBILITY 0.34 0.47 0 1
Patent characteristics N_INVENTORS 2.28 1.54 1 22SCIENCE 2.60 1.87 0 5COMM_EXPLOIT 3.81 1.55 0 5LICENSING 2.05 1.53 0 5IMITATION 3.80 1.57 0 5
Regional characteristics GDPPC 23033.85 8972.21 5479.20 76910.80POP 727.53 877.89 19.90 4634.40AREA 1574.97 1990.27 35.60 18275.30REGPATS 121.30 133.13 0.83 543.21LABS_UNI 12.37 35.98 0 461LABS_PUBLIC 7.17 14.16 0 118LABS_PRIVATE 45.80 84.44 0 429TOP5_TECH 0.44 0.50 0 1TOP1_TECH 0.14 0.35 0 1THRESH5_TECH 0.15 0.36 0 1
Other Controls DE 0.42 0.49 0 1DK 0.06 0.24 0 1ES 0.03 0.16 0 1HU 0.00 0.06 0 1IT 0.16 0.36 0 1NL 0.15 0.36 0 1UK 0.18 0.38 0 1AppYear1993 0.03 0.16 0 1AppYear1994 0.28 0.45 0 1AppYear1995 0.26 0.44 0 1AppYear1996 0.23 0.42 0 1AppYear1997 0.16 0.36 0 1AppYear1998 0.05 0.22 0 1
Note: N = 6750. a N=5356. bN= 2882.
32
1 2 3 4 5 6 7 8 9 10 1 12 13 14 15 16 17 18 19 20 21 2 23 24 1 2 1 EMPLOYEES 1.00 2 R&DI NT 0.5 6 1. 00 3 PRI_APPLIC -0.26 -0.11 1.00 4 INDIVIDUAL_APPLIC -0.36 -0.15 -0.04 1.00 5 AGE -0.08 -0.07 -0.03 0.0
0 10
1 0
8 1.00 6 MALE 0.00 -0.03 -0.04 0. 2 0. 2 1.00 7 UNI_DEGREE -0.01 -0.05 -0.03 -0.03 -0.08 -0. 3 1.00 8 PhD_DEGREE 0.17 0.20 0.10 -0.05 -0.02 0.00 -0.65 1.00 9 MOBILITY -0.09 -0.06 0.03 -0.03 -0.07 0.02 -0.02 0.03 1.00
10 N_INVENTORS 0.20 0.16 0.04 -0.13 -0.06 -0.07 -0. 0 0.24 -0. 4 1.00 11 SCIENCE 0.12 0.13 0.09 -0.05 -0.08 -0.07 -0.06 0.29 0.00 0.21 1.00 12 COMM_EXPLOIT -0.07 -0.03 -0.09 0.03 0.02 0.00 0.01 -0.01 0.04 0.01 0.04 1.00 13 LICENSING -0.06 0.00 0.14 0.16 -0.06 0.01 -0.02 0.09 0.01 0.03 0.16 0.10 1.00 14 IMITATION 0.01 0.01 -0.09 -0.06 -0.07 0.00 0.02 -0.04 -0.01 0.01 0.01 0.14 0.01 1.00 15 GDPPC 0.23 0.19 -0.07 -0.06 0.00 0.03 -0.07 0.15 -0.12 0.12 0.10 -0.11 -0.01 0.03 1.00 16 POP -0.04 -0.06 0.03 -0.01 -0.06 -0.08 0.05 -0.10 0.08 -0.02 0.00 0.00 -0.01 -0.09 0.01 1.00 17 AREA -0.22 -0.21 0.01 0.05 -0.04 -0.05 0.07 -0.23 0.11 -0.13 -0.10 0.04 -0.06 -0.05 -0.51 0.51 1.00 18 REGPATS 0.18 0.17 -0.06 -0.07 -0.04 -0.02 0.00 0.08 -0.05 0.06 0.06 -0.07 0.01 -0.06 0.40 0.60 0.07 1.00 19 LABS_UNI 0.01 0.04 0.05 -0.01 -0.05 -0.06 0.03 0.02 0.10 -0.05 0.05 0.04 0.05 -0.09 0.09 0.57 0.11 0.37 1.00 20 LABS_PUBLIC -0.01 0.00 0.07 -0.01 -0.06 -0.07 0.04 -0.03 0.06 -0.02 0.05 -0.01 0.04 -0.08 0.24 0.68 0.15 0.49 0.75 1.00 21 LABS_PRIVATE 0.07 0.05 0.01 -0.05 -0.05 -0.06 -0.01 0.04 0.08 0.00 0.06 0.03 0.04 -0.06 0.22 0.72 0.11 0.59 0.69 0.75 1.00 22 TOP1_TECH 0.17 0.15 -0.05 -0.05 0.03 0.02 -0.08 0.15 -0.10 0.11 0.04 -0.08 0.02 0.05 0.33 -0.08 -0.25 0.25 -0.10 -0.06 -0.03 1.00 23 TOP5_TECH 0.18 0.15 -0.08 -0.06 0.01 0.02 -0.04 0.11 -0.13 0.07 0.06 -0.09 -0.01 0.03 0.45 -0.02 -0.27 0.43 -0.07 0.03 0.10 0.46 1.00 24 THRESH5_TECH 0.23 0.22 -0.05 -0.06 0.03 0.02 -0.11 0.23 -0.11 0.17 0.08 -0.07 0.03 0.04 0.36 -0.09 -0.30 0.27 -0.11 -0.07 -0.02 0.78 0.47 1.00
Table 3. Correlation matrix.
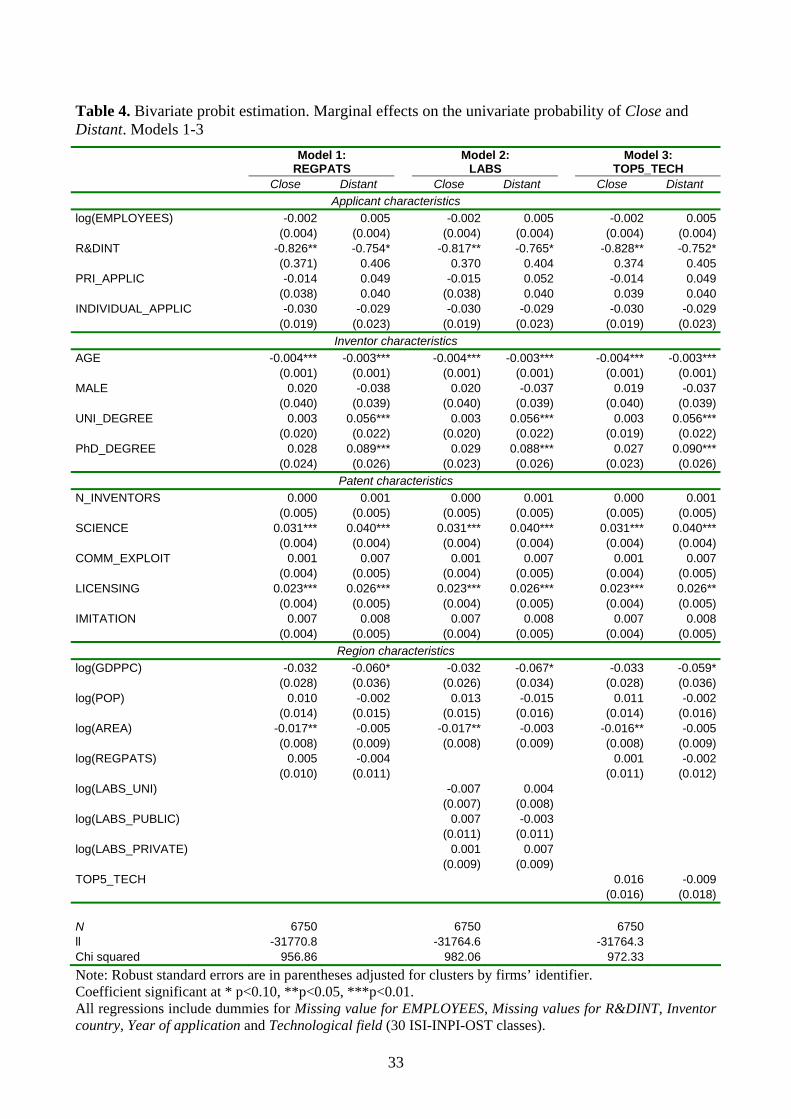
Table 4. Bivariate probit estimation. Marginal effects on the univariate probability of Close and Distant. Models 1-3
Model 1: REGPATS Model 2:
LABS Model 3: TOP5_TECH
Close Distant Close Distant Close Distant Applicant characteristics
log(EMPLOYEES) -0.002 0.005 -0.002 0.005 -0.002 0.005 (0.004) (0.004) (0.004) (0.004) (0.004) (0.004)R&DINT -0.826** -0.754* -0.817** -0.765* -0.828** -0.752* (0.371) 0.406 0.370 0.404 0.374 0.405PRI_APPLIC -0.014 0.049 -0.015 0.052 -0.014 0.049 (0.038) 0.040 (0.038) 0.040 0.039 0.040INDIVIDUAL_APPLIC -0.030 -0.029 -0.030 -0.029 -0.030 -0.029 (0.019) (0.023) (0.019) (0.023) (0.019) (0.023)
Inventor characteristics AGE -0.004*** -0.003*** -0.004*** -0.003*** -0.004*** -0.003*** (0.001) (0.001) (0.001) (0.001) (0.001) (0.001)MALE 0.020 -0.038 0.020 -0.037 0.019 -0.037 (0.040) (0.039) (0.040) (0.039) (0.040) (0.039)UNI_DEGREE 0.003 0.056*** 0.003 0.056*** 0.003 0.056*** (0.020) (0.022) (0.020) (0.022) (0.019) (0.022)PhD_DEGREE 0.028 0.089*** 0.029 0.088*** 0.027 0.090*** (0.024) (0.026) (0.023) (0.026) (0.023) (0.026)
Patent characteristics N_INVENTORS 0.000 0.001 0.000 0.001 0.000 0.001 (0.005) (0.005) (0.005) (0.005) (0.005) (0.005)SCIENCE 0.031*** 0.040*** 0.031*** 0.040*** 0.031*** 0.040*** (0.004) (0.004) (0.004) (0.004) (0.004) (0.004)COMM_EXPLOIT 0.001 0.007 0.001 0.007 0.001 0.007 (0.004) (0.005) (0.004) (0.005) (0.004) (0.005)LICENSING 0.023*** 0.026*** 0.023*** 0.026*** 0.023*** 0.026** (0.004) (0.005) (0.004) (0.005) (0.004) (0.005)IMITATION 0.007 0.008 0.007 0.008 0.007 0.008 (0.004) (0.005) (0.004) (0.005) (0.004) (0.005)
Region characteristics log(GDPPC) -0.032 -0.060* -0.032 -0.067* -0.033 -0.059* (0.028) (0.036) (0.026) (0.034) (0.028) (0.036)log(POP) 0.010 -0.002 0.013 -0.015 0.011 -0.002 (0.014) (0.015) (0.015) (0.016) (0.014) (0.016)log(AREA) -0.017** -0.005 -0.017** -0.003 -0.016** -0.005 (0.008) (0.009) (0.008) (0.009) (0.008) (0.009)log(REGPATS) 0.005 -0.004 0.001 -0.002 (0.010) (0.011) (0.011) (0.012)log(LABS_UNI) -0.007 0.004 (0.007) (0.008) log(LABS_PUBLIC) 0.007 -0.003 (0.011) (0.011) log(LABS_PRIVATE) 0.001 0.007 (0.009) (0.009) TOP5_TECH 0.016 -0.009 (0.016) (0.018) N 6750 6750 6750 ll -31770.8 -31764.6 -31764.3 Chi squared 956.86 982.06 972.33 Note: Robust standard errors are in parentheses adjusted for clusters by firms’ identifier. Coefficient significant at * p<0.10, **p<0.05, ***p<0.01. All regressions include dummies for Missing value for EMPLOYEES, Missing values for R&DINT, Inventor country, Year of application and Technological field (30 ISI-INPI-OST classes).
33
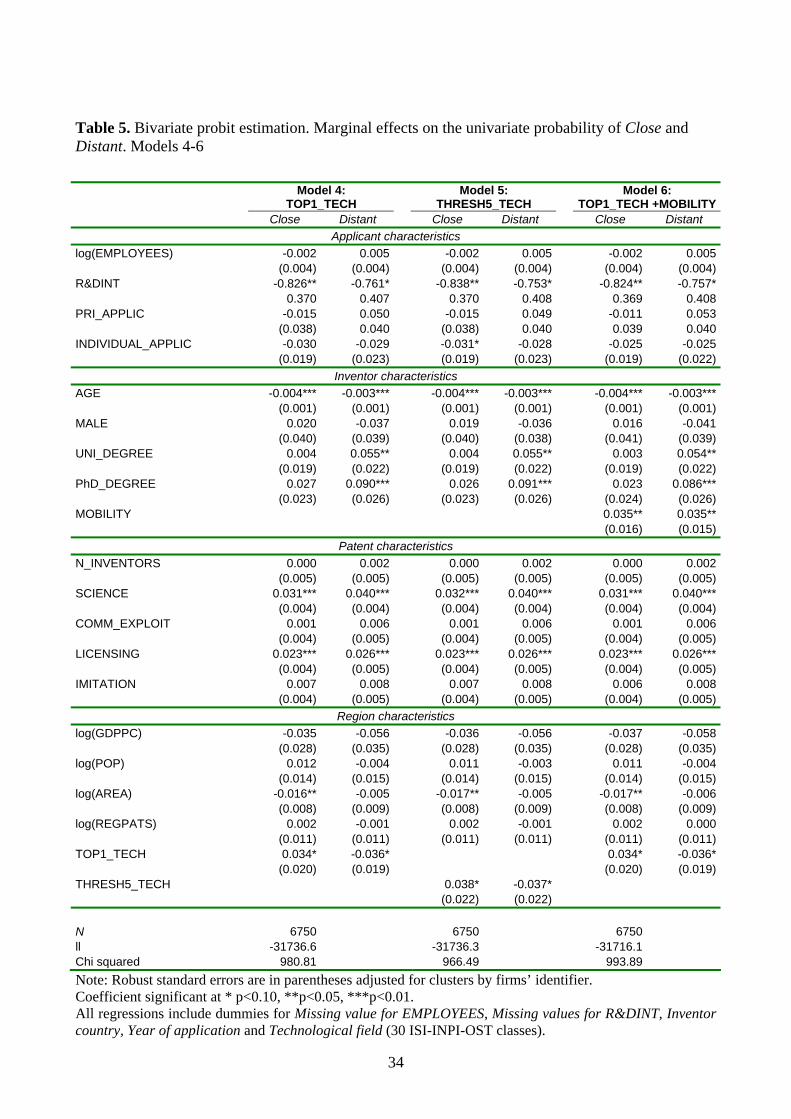
Table 5. Bivariate probit estimation. Marginal effects on the univariate probability of Close and Distant. Models 4-6
Model 4:
TOP1_TECH Model 5: THRESH5_TECH Model 6:
TOP1_TECH +MOBILITY Close Distant Close Distant Close Distant
Applicant characteristics log(EMPLOYEES) -0.002 0.005 -0.002 0.005 -0.002 0.005 (0.004) (0.004) (0.004) (0.004) (0.004) (0.004)R&DINT -0.826** -0.761* -0.838** -0.753* -0.824** -0.757* 0.370 0.407 0.370 0.408 0.369 0.408PRI_APPLIC -0.015 0.050 -0.015 0.049 -0.011 0.053 (0.038) 0.040 (0.038) 0.040 0.039 0.040INDIVIDUAL_APPLIC -0.030 -0.029 -0.031* -0.028 -0.025 -0.025 (0.019) (0.023) (0.019) (0.023) (0.019) (0.022)
Inventor characteristics AGE -0.004*** -0.003*** -0.004*** -0.003*** -0.004*** -0.003*** (0.001) (0.001) (0.001) (0.001) (0.001) (0.001)MALE 0.020 -0.037 0.019 -0.036 0.016 -0.041 (0.040) (0.039) (0.040) (0.038) (0.041) (0.039)UNI_DEGREE 0.004 0.055** 0.004 0.055** 0.003 0.054** (0.019) (0.022) (0.019) (0.022) (0.019) (0.022)PhD_DEGREE 0.027 0.090*** 0.026 0.091*** 0.023 0.086*** (0.023) (0.026) (0.023) (0.026) (0.024) (0.026)MOBILITY 0.035** 0.035** (0.016) (0.015)
Patent characteristics N_INVENTORS 0.000 0.002 0.000 0.002 0.000 0.002 (0.005) (0.005) (0.005) (0.005) (0.005) (0.005)SCIENCE 0.031*** 0.040*** 0.032*** 0.040*** 0.031*** 0.040*** (0.004) (0.004) (0.004) (0.004) (0.004) (0.004)COMM_EXPLOIT 0.001 0.006 0.001 0.006 0.001 0.006 (0.004) (0.005) (0.004) (0.005) (0.004) (0.005)LICENSING 0.023*** 0.026*** 0.023*** 0.026*** 0.023*** 0.026*** (0.004) (0.005) (0.004) (0.005) (0.004) (0.005)IMITATION 0.007 0.008 0.007 0.008 0.006 0.008 (0.004) (0.005) (0.004) (0.005) (0.004) (0.005)
Region characteristics log(GDPPC) -0.035 -0.056 -0.036 -0.056 -0.037 -0.058 (0.028) (0.035) (0.028) (0.035) (0.028) (0.035)log(POP) 0.012 -0.004 0.011 -0.003 0.011 -0.004 (0.014) (0.015) (0.014) (0.015) (0.014) (0.015)log(AREA) -0.016** -0.005 -0.017** -0.005 -0.017** -0.006 (0.008) (0.009) (0.008) (0.009) (0.008) (0.009)log(REGPATS) 0.002 -0.001 0.002 -0.001 0.002 0.000 (0.011) (0.011) (0.011) (0.011) (0.011) (0.011)TOP1_TECH 0.034* -0.036* 0.034* -0.036* (0.020) (0.019) (0.020) (0.019)THRESH5_TECH 0.038* -0.037* (0.022) (0.022) N 6750 6750 6750 ll -31736.6 -31736.3 -31716.1 Chi squared 980.81 966.49 993.89 Note: Robust standard errors are in parentheses adjusted for clusters by firms’ identifier. Coefficient significant at * p<0.10, **p<0.05, ***p<0.01. All regressions include dummies for Missing value for EMPLOYEES, Missing values for R&DINT, Inventor country, Year of application and Technological field (30 ISI-INPI-OST classes).
34
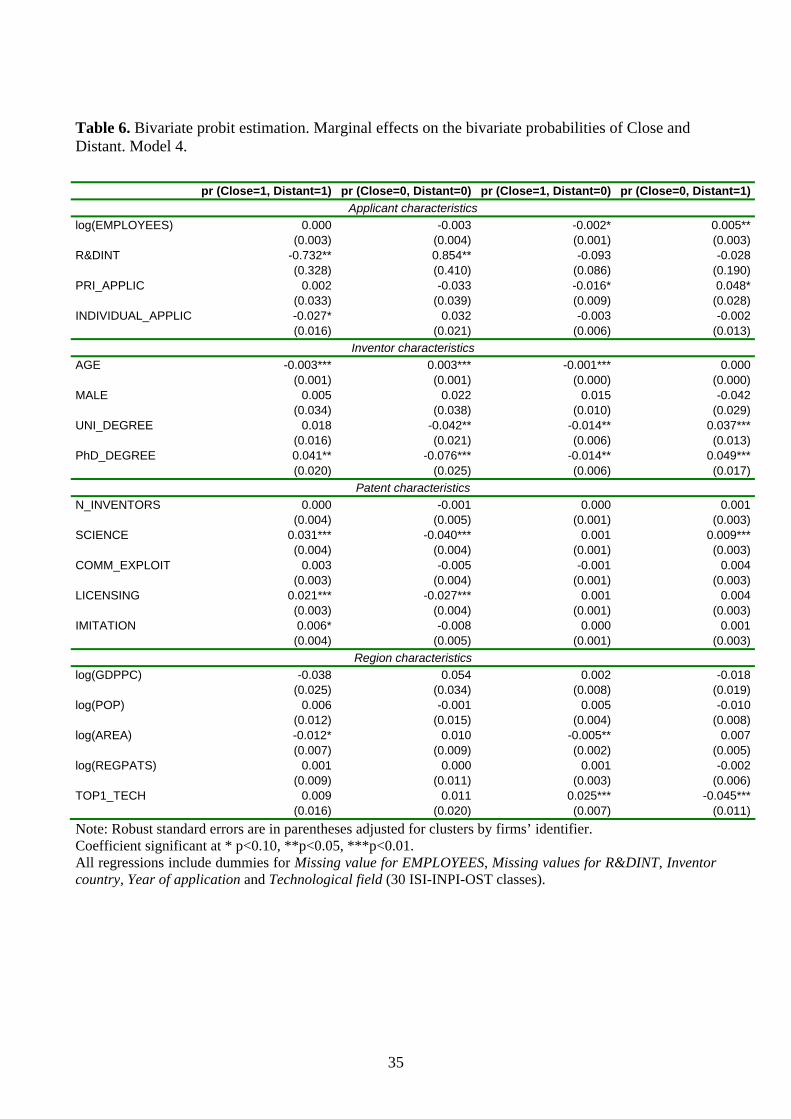
Table 6. Bivariate probit estimation. Marginal effects on the bivariate probabilities of Close and Distant. Model 4.
pr (Close=1, Distant=1) pr (Close=0, Distant=0) pr (Close=1, Distant=0) pr (Close=0, Distant=1)
Applicant characteristics log(EMPLOYEES) 0.000 -0.003 -0.002* 0.005** (0.003) (0.004) (0.001) (0.003)R&DINT -0.732** 0.854** -0.093 -0.028 (0.328) (0.410) (0.086) (0.190)PRI_APPLIC 0.002 -0.033 -0.016* 0.048* (0.033) (0.039) (0.009) (0.028)INDIVIDUAL_APPLIC -0.027* 0.032 -0.003 -0.002 (0.016) (0.021) (0.006) (0.013)
Inventor characteristics AGE -0.003*** 0.003*** -0.001*** 0.000 (0.001) (0.001) (0.000) (0.000)MALE 0.005 0.022 0.015 -0.042 (0.034) (0.038) (0.010) (0.029)UNI_DEGREE 0.018 -0.042** -0.014** 0.037*** (0.016) (0.021) (0.006) (0.013)PhD_DEGREE 0.041** -0.076*** -0.014** 0.049*** (0.020) (0.025) (0.006) (0.017)
Patent characteristics N_INVENTORS 0.000 -0.001 0.000 0.001 (0.004) (0.005) (0.001) (0.003)SCIENCE 0.031*** -0.040*** 0.001 0.009*** (0.004) (0.004) (0.001) (0.003)COMM_EXPLOIT 0.003 -0.005 -0.001 0.004 (0.003) (0.004) (0.001) (0.003)LICENSING 0.021*** -0.027*** 0.001 0.004 (0.003) (0.004) (0.001) (0.003)IMITATION 0.006* -0.008 0.000 0.001 (0.004) (0.005) (0.001) (0.003)
Region characteristics log(GDPPC) -0.038 0.054 0.002 -0.018 (0.025) (0.034) (0.008) (0.019)log(POP) 0.006 -0.001 0.005 -0.010 (0.012) (0.015) (0.004) (0.008)log(AREA) -0.012* 0.010 -0.005** 0.007 (0.007) (0.009) (0.002) (0.005)log(REGPATS) 0.001 0.000 0.001 -0.002 (0.009) (0.011) (0.003) (0.006)TOP1_TECH 0.009 0.011 0.025*** -0.045*** (0.016) (0.020) (0.007) (0.011)Note: Robust standard errors are in parentheses adjusted for clusters by firms’ identifier. Coefficient significant at * p<0.10, **p<0.05, ***p<0.01. All regressions include dummies for Missing value for EMPLOYEES, Missing values for R&DINT, Inventor country, Year of application and Technological field (30 ISI-INPI-OST classes).
35

Table 7. Bivariate probit estimation. Marginal effects on the bivariate probabilities of Close and Distant. Selected variables in Models 2, 3, 5 and 6.
pr (Close=1, Distant=1) pr (Close=0, Distant=0) pr (Close=1, Distant=0) pr (Close=0, Distant=1)
Model 2 log(LABS_UNI) -0.003 -0.000 -0.004* 0.007 (0.006) (0.008) (0.002) (0.005)log(LABS_PUBLIC) 0.004 -0.001 0.003 -0.006 (0.009) (0.011) (0.003) (0.006)log(LABS_PRIVATE) 0.003 -0.005 -0.001 0.004 (0.008) (0.009) (0.003) (0.006)Model 3 TOP5_TECH 0.007 0.001 0.008 -0.017 (0.014) (0.017) (0.005) (0.011)Model 5 THRESH5_TECH 0.011 0.010 0.027*** -0.048*** (0.018) (0.022) (0.008) (0.012)Model 6 MOBILITY 0.032** -0.038** 0.003 0.003 (0.013) (0.015) (0.005) (0.011)
36