spatial frequency of the human short-wavelength-sensitive (blue) cone mechanism
TRANSCRIPT

Documenta Ophthalmologica 77: 165-183, 1991. �9 1991 Kluwer Academic Publishers. Printed in the Netherlands.
Spatial frequency of the human short-wavelength-sensitive (blue) cone mechanism Psychophysical studies and pattern-reversal visual evoked potentials
LI D U , F A N G S H E N & E B E R H A R D D O D T
Max-Planck-Institute for Physiological and Clinical Research, D-6350 Bad Nauheim, Germany
Accepted 4 June 1991
Key words: chromatic adaptation, color mechanism, psychophysics, short-wavelength-sensitive cones, spectral sensitivity, visual evoked potentials
Abstract. The interactions of spatial and chromatic processing of the short-wavelength-sensitive cone mechanism were studied in humans with patterned (checkerboard) stimuli of various spatial frequency (10, 22, 44, and 85 min of arc respectively), under steady exposure to yellow light (575 nm, 390 cd/m2). Psychophysical studies and pattern-reversal visual evoked potentials were employed. Parameters of the transient pattern-reversal visual evoked potentials (pattern reversal rate of 2.4 s l) especially observed were the latencies of P2 (P100) and N3 and the amplitude of P2-N3. It was only with the largest applicable check size (85 min of arc) that both the psychophysical studies and visual evoked potentials could succeed in satisfactorily isolating the short-wavelength-sensitive cone mechanism. Pattern-reversal visual evoked potential laten- cies are recommended in the evaluation of this cone mechanism because of their smaller variance and higher selectivity in isolating the short-wavelength-sensitive cone mechanism than the amplitude. The peak sensitivity of this cone mechanism was shown to be at about 449 nm at the corneal level. The short-wavelength sensitive cone mechanism represented the characteris- tics of low spatial resolution and long latencies of the pattern-reversal visual evoked potentials.
Abbreviations: LERG, luminance electroretinograms; LVEP, luminance visual evoked poten- tials; LWS, long-wavelength-sensitive; MWS, medium-wavelength-sensitive; P-VEP, pattern- reversal visual evoked potentials; SWS, short-wavelength-sensitive
Introduction
C o n e p h o t o r e c e p t o r s (cones) in the v e r t e b r a t e r e t ina m e d i a t e co lor vision. T h e t h r e e types of cones , l ong-wave leng th - sens i t i ve ( L W S ) , m e d i u m - w a v e -
l eng th -sens i t ive ( M W S ) , and sho r t -wave leng th - sens i t i ve ( S W S ) cones , a re r e spons ive to red , g reen , and b lue l ight , r espec t ive ly , and hence are i nvo lved in d i f fe ren t co lo r d i s c r imina t ion mechan i sms . The SWS cones are o u t n u m b e r e d by the M W S and L W S cones and are qui te d i f fe ren t in the i r t o p o g r a p h y and in m a n y of the i r phys io log ic charac te r i s t i cs [1-3] . T h e y are l o c a t e d ma in ly in the pe r i fovea , whi le M W S and L W S cones a re mos t

166
common in the fovea [4]. Clinical studies [1, 5-8] have established the high vulnerability of SWS cones to retinal diseases, which is different from MWS and LWS cones. Thus, it is of interest to many investigators to probe into the characteristics of the SWS cone mechanism.
The SWS cone mechanism cannot be isolated, however, without special treatment since the cone response is dominated by the MWS and LWS cone mechanisms. Stiles [9, 10] successfully isolated the SWS cone mechanism through a psychophysical approach by using a two-color increment threshold technique he devised. Wald [11] later improved this technique. The fun- damental mechanism of the incremental threshold technique is that selective chromatic adaptation will increase the threshold of the mechanism under adaptation more than the threshold(s) of the unadapted mechanisms. Stiles' technique was later incorporated into the electrophysiologic approaches. At the retinal level, the contribution of the SWS cone mechanism has been studied in the luminance electroretinograms (LERG) during exposure to yellow light in the rabbit [12], cat [13], primate [14-17], and human [18-21]. Generally the LERG of the SWS cone mechanism differed from the MWS and LWS cone mechanisms by its rod-like (negative) off-effect [12, 13]. At the cortical level the three different cone mechanisms have also been investigated in the luminance visual evoked potential (LVEP) in humans under selective chromatic adaptation [22-28]. The SWS cone mechanism thus isolated had a longer latency and lower amplitude than the MWS and LWS cone mechanisms.
All the above cited reports of the SWS cone mechanism used unstructured stimuli, usually a test light beam periodically superimposed on a larger adapting field of yellow light. Historically, color vision and spatial vision have almost invariably been studied separately [29], however, through research on single-unit recording it has become clear that this separation is unrealistic because the spatial and chromatic processing of many cells are interactive [30]. The realization that if one's aim is to understand visual processing it is necessary to consider spatial and color properties together has also emerged in psychophysics, perhaps most explicitly in the Retinex theory of Land [31]. By recording the pattern electroretinogram (PERG) to a reversing checkerboard stimulus (69 min of arc), Niepel and Dodt [32] were able to isolate the SWS cone mechanism under yellow light adaptation. They found the early saturating potentials of low amplitude and long latency of the SWS cone mechanism similar to that manifested in LERG. However, the spatial parameters of the stimulus were not systematically investigated in their report.
The aim of the present study was to isolate, in humans, the SWS cone mechanism by patterned (checkerboard) stimuli under steady exposure to yellow light (575 nm). An attempt was made to compare the spatial charac- teristics of the SWS cone mechanism with both the psychophysical and the pattern-reversal VEP (P-VEP) approaches. We successfully isolated the

167
SWS cone mechanism as proved psychophysically and electrophysiological- ly, and we established the characteristics of low spatial resolution of the SWS cone mechanism.
Materials and methods
Stimulating system. Pattern-contrast stimuli were obtained from a checker- board slide projected onto a translucent screen subtending a visual angle of 13 • 13 ~ and viewed at a distance of 1 m (Fig. 1). The individual checks of the pattern were presented at a Michelson contrast of 0.96. The visual angle subtended by the checks was 85, 44, 22, and 10 min of arc as required in different tests. Seventeen interference band filters (Schott Glaswerke, AL, half-width of 20 nm) between 407 and 693 nm and neutral density filters (Schott Glaswerke, NG) were inserted into the beam to control the wave- length and intensity of the test light beam. The bright and dark checks were interchanged at a rate of 2.4 s i using a pivoted mirror (General Scanning model CX-660/G325D). Each reversal was completed within 5ms. A function generator (Hewlett-Packard model 3314A) provided the triggering square-wave signal synchronizing the action of the pattern reversal and the P-VEP recording. A homogeneous, monochromatic yellow (575 nm) field was superimposed onto the test light, and its intensity was adjusted by neutral density filters.
Radiometry and photometry. Irradiance of monochromatic illumination at the plane of the observer's entrance pupil was repeatedly measured on a quantum basis ( /xEcm 2s i) using a spectroradiometer (Macam Photo- metrics model SR3000B) and luminance (cd/m 2) was measured with a digital luminance meter (Minolta). Spectral transmission of the neutral density filters and interference band filters was measured using a spectro- photometer (Beckman model DU-50).
Subjects. Two of the authors (LD, FS) served as the subjects. The ages of subjects 1 and 2 were 35 and 31 years, respectively. Both had normal visual acuity (or when corrected in subject 2 with glasses of flat absorbance of about 10% in the visible spectrum of 380-780 nm) and normal color vision as tested with the Farnsworth-Munsell Panel D-15 test and Ishihara's pseudoisochromatic plates. No medication for accommodation and pupil size was given so that sharp images of the pattern on the retina were assured. Within the range of the luminance variation in this study, the pupil diameters were between 3 and 3.5 mm as measured with a pupil diameter chart. The subjects fixed binocularly on the center of the stimulus field marked by a red laser beam. Each subject was first exposed for 2 min to the adaptation light, which was present throughout the subsequent procedure.

168
ELECTRICALLY SHIELDED ROOM
ACTIVE ELECTRODE: Oz
GROUND ELECTRODE." . ~
FIXATION RIGHT ~ . LASER EARLOBE / . ~ - ]
BEAM k ] ~ . , ' u ~ / ~ REFERENCE it& . / tl / ~" ~ ELECTRODE:~.-~ ,h4iil /
Z t F z ' / .LIAr"/.".3 1)~ ' "~/'", 2. Cz" ~ ~ VIEWING
"-,.. - - DISTANCE ~"% 1 �9 .. 0 0 0 mm
'-... T R A N S L U C E N T "-,.. S C R E E N t
' - . . . ( 2 3 c m x 2 3 c m ) [
C H E C K E R ~ SLIDE \ \ / /
~ F (p) I
PRO EC g 'g ECTOR
PIVOTED V SURFACE GALVANOMETER MIRROR SCANNER
TESTLIGHT ADAPTIVE ILLUMINATION Fig. 1. Schematic drawing (not to scale) of the projector system. It produced checkerboard reversal stimuli of various wavelengths (A, test light) on a translucent screen subtending 13 • 13 ~ of visual angle, superimposed by a homogeneous field (/z, adaptive illumination). NDF, neutral density filter; IF, interference band filter inserted into the test and adaptive beams.
Psychophysical test. The spectral sensitivity funct ion was measured by de- te rmining the test i r radiance necessary for a just-discernible pat tern rever- sal, using the staircase me thod of 0.1 log unit smallest step. The test sequence of the 17 in terference filters was randomized . The luminances of the yel low light (575 nm) adapta t ion fields were-390, i95, and 98 c d / m 2 as

169
required in different situations. A white light adaptation field of 385 cd/m= was also used in comparison with the yellow light adaptation of a similar luminance.
P-VEP test. The P-VEP was recorded via an active electrode (Grass gold- disk electrode) placed at Oz of the 10-20 System. The two reference electrodes were placed at Fz and Cz and were connected to two parallel amplification channels. A ground electrode was placed at the right earlobe. The signals from the electrode connections (Oz-Fz, Oz-Cz) were led off into two preamplifiers (Schwarzer models UME48 and UMV48) employing a band pass of 0.3-150 Hz. Signals were then displayed on an oscilloscope (Tektronix model 2225) and fed into a signal averaging system (Nicolet model 1170). A sweep time of 410 ms was chosen. 128, 256, or 512 sweeps were superimposed and averaged. Data were stored on a floppy disk with a diskette system (Nicolet model NIC-285) for off-line analysis. P-VEP laten- cies of P2 (P100) and N3, as defined by Lowitzsch [33], were measured on the cathode ray tube of the signal averager by a movable cursor, with an accuracy of 0.2 ms. The P-VEPs recorded were plotted by an X-Y recorder (Hewlett-Packard model 7015B), and the peak-to-peak amplitude of P2-N3 was measured.
We intended to compare the signals from the two different channels of Oz-Fz and Oz-Cz, but they appeared identical most of the time so we used the data from Oz-Fz for the final analysis.
Eight different wavelengths (407, 430, 449, 468, 487, 507, 545, and 625 nm) were selected for the test light. Different irradiance levels with steps of 0.3-0.5 log units were chosen, starting from about 0.3 log unit above the psychophysical threshold. The test sequence of different wavelengths and irradiant levels were randomized. Two to five tests for a given wavelength at a given irradiant level were performed on different days, and the mean value was noted.
The logarithmic quantum irradiance required for a constant (interpolated) criterion amplitude (11 and 5.5 #V in subjects 1 and 2, respectively) and criterion latency (both subjects: 140ms for P2, 200ms for N3) were employed to plot the spectral sensitivity function of P-VEPs.
Results
Psychophysical studies
Selective chromatic adaptation to yellow light is a suitable means to measure psychophysically the luminance increment threshold of the SWS cone mech- anism [9, 10]. We attempted to find what would happen when we employed patterned stimuli. Fig. 2A shows that a check size of 10 min of arc failed to isolate the SWS cone mechanism. Its spectral sensitivity function resembles
@
T Z < O
(.9
O
_1
LU
> _J
iii
II
0 0.5
1.0
1.5
2.0
2.5
3.0
3.5
Am
ax
,= 4
49
nm
C
HE
CK
SI
ZE
(min
of
arc)
z~
,~
85
&--
--
A
44
O
O
2
2
e--
----
O
10
;" "
Am
ax=5
45nm
\e
. ~ k
'~
(•
.~
max
=
449n
m
\
j:):
LO
,,
/;,
", x"
--
O
"'O "x
3.
"O.
~1
[]
"0
O
--~
~
~o
~ ~
"o'"
,,..
MI'I
(cd
m
-2 )
\\\-
-"',,\D
D\
O ..
....
....
O
98
~\
"~
, D
----
--~
1
95
"~
\\\ ~
A
.~ 3
90
\\
400
500
600
700
40
0
500
60
0
70
0
~400
50
0 6
00
7
00
WA
VE
LE
NG
TH
A
(ri
m)
WA
VE
LE
NG
TH
/t
(nm
) W
AV
EL
EN
GT
H
A (
nm
) F
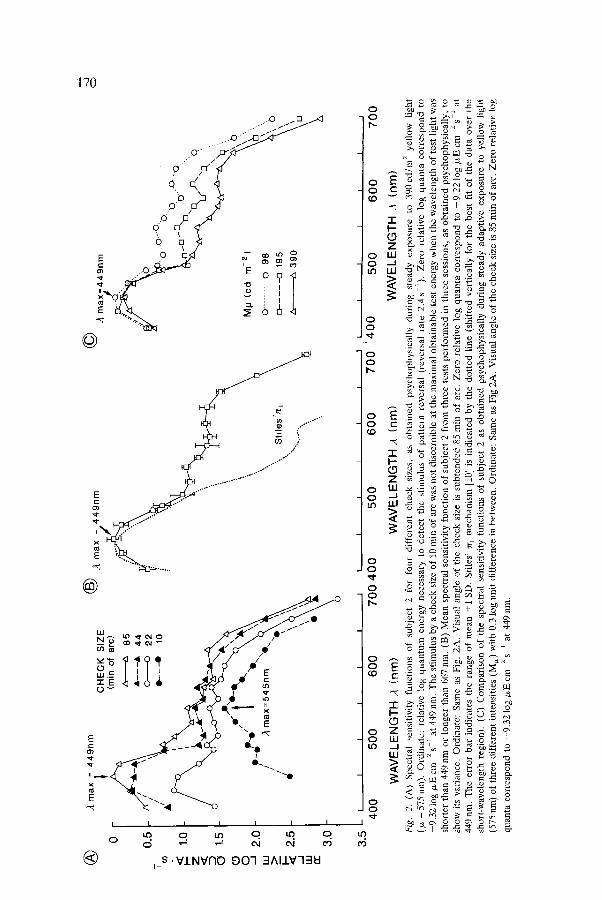
ig.
2.
(A)
Spe
ctra
l se
nsit
ivit
y fu
ncti
ons
of
subj
ect
2 fo
r fo
ur
diff
eren
t ch
eck
size
s,
as
obta
ined
ps
ycho
phys
ical
ly d
urin
g st
eady
ex
posu
re
to
39
0cd
/m 2
yel
low
li
ght
(/x
= 57
5 nm
).
Ord
inat
e: r
elat
ive
log
qu
antu
m e
nerg
y ne
cess
ary
to d
etec
t th
e st
imul
us o
f pa
tter
n re
vers
al (
reve
rsal
rat
e 2.
4 s
1).
Zer
o r
elat
ive
log
qu
anta
co
rres
po
nd
to
-9.3
2 l
og/L
E c
m
2 s-
1 at
449
nm
. T
he s
tim
ulus
by
a ch
eck
size
of
10 r
ain
of a
rc w
as n
ot d
isce
rnib
le a
t th
e m
axim
al o
btai
nabl
e te
st e
nerg
y w
hen
the
wav
elen
gth
of t
est
ligh
t w
as
shor
ter
than
449
nm
or
long
er t
han
667
nm.
(B)
Mea
n s
pect
ral
sens
itiv
ity
func
tion
of
subj
ect
2 fr
om t
hree
tes
ts p
erfo
rmed
in
thre
e se
ssio
ns,
as o
bta
ined
psy
chop
hysi
call
y, to
sh
ow i
ts v
aria
nce.
Ord
inat
e: S
ame
as F
ig.
2A.
Vis
ual
angl
e of
the
che
ck s
ize
is s
ubte
nded
85
rain
of
arc.
Zer
o r
elat
ive
log
qu
anta
cor
resp
ond
to -
9.2
2 l
og b
~E c
m
2 s-
1 at
44
9 nm
. T
he e
rror
bar
ind
icat
es t
he r
ange
of
mea
n +
1 S
D.
Sti
les'
7"/"
1 m
echa
nism
[10
] is
ind
icat
ed b
y th
e do
tted
lin
e (s
hift
ed v
erti
call
y fo
r th
e be
st f
it o
f th
e da
ta o
ver
the
shor
t-w
avel
engt
h re
gion
). (
C)
Com
pari
son
of t
he
spec
tral
sen
siti
vity
fun
ctio
ns o
f su
bjec
t 2
as o
btai
ned
psyc
hoph
ysic
ally
dur
ing
stea
dy a
dapt
ive
exp
osu
re t
o ye
llow
lig
ht
(575
ran
) of
thr
ee d
iffe
rent
int
ensi
ties
(M
s) w
ith
0.3
log
unit
dif
fere
nce
in b
etw
een.
Ord
inat
e: S
ame
as F
ig 2
A.
Vis
ual
angl
e of
the
che
ck s
ize
is 8
5 m
in o
f ar
c. Z
ero
rel
ativ
e lo
g
quan
ta c
orre
spon
d to
-9
.32
log
~zE
cm
2
s L
at
449
nm.

171
that of the photopic vision with its maximum sensitivity (A . . . . ) at about 545 nm (between 525 nm and 574nm). The isolation of the SWS cone mechanism was obvious as the check size became larger. More complete isolation was achieved with the largest applicable check size (85 min of arc), with the Amax at 449 nm. There was a sensitivity difference of about 1 log unit between test wavelengths of 449 nm and 554 nm. This characteristic of low spatial frequency preference of the SWS cone mechanism was consistent as revealed by repeated tests (Fig. 2B). Figure 2B shows that the psycho- physical spectral sensitivity function obtained in this study was similar to Stiles' ,77-1 mechanism [9, 10] (with the /~max of 440nm) in the short- wavelength region (below 500 nm), with its Ama x shifted about 9 nm toward the right. The difference at the longer-wavelength region (above 500 nm) of the two curves in Fig. 2B is apparently due, at least in part, to the different intensities of adaptive light employed (Fig. 2C). The different adaptive intensities of yellow light had their effects mainly on the longer-wavelength region, while there were only slight changes in the short-wavelength region (Fig. 2C). Higher adaptive intensities of yellow light (more than 390 cd m -2) were not tested in this study because of the limitation of the light radiation available. One can infer, however, from Fig. 2C that greater sensitivity difference of blue/green could be achieved with higher adaptive intensities of yellow light. Fig. 2C also indicates that we were dealing with genuine properties of the SWS cone mechanism since the "~max took the same position in different adaptive levels, as has been similarly observed by Wald [11].
To elucidate further the mechanism of the yellow light adaptation in isolating the SWS cone mechanism, we exposed the subjects' retinas to white light of about the same luminance as that of the yellow light and compared the effects. Figure 3 shows that the spectral sensitivities of the yellow or white light adaptation were very similar at the wavelength region longer than 500 nm. The major difference was in the shorter-wavelength region where the SWS cone mechanism operates. This finding confirms the effectiveness of the yellow light adaptation in isolating the SWS cone mechanism. That the spectral sensitivity curve under white light adaptation did not show the typical shape of photopic vision as has been suggested [34] may be due to the following: (1) The large check size of 85 min of arc did not coincide with the spatial preference of the MWS and LWS cone mechanisms as implied by the spectral sensitivity curve with a check size of 10 min of arc in Fig. 2A; (2) When no interference band filter was used, the spectral distribution of radiant energy of the light source in this study (a halogen lamp) showed the dominance of wavelength longer than 500 nm (not illustrated). The sensitivity of the MWS and LWS cone mechanisms were therefore more strongly suppressed under the intense adaptation of such a light source. King-Smith and Carden [35] observed a similarly shaped spectral sensitivity curve while they used a flash stimulus of 1 ~ and 200 ms under white light adaptation. They interpreted their result as that a white background selectively depresses the sensitivity of the luminance (ach- romatic) system relative to the opponent-color system.

172
| 0
T 0.5
z < 1,0
c3 (5 4.5 O J
UA > 2.0
d
~z 2.5
3.0
~. m a x = 4 4 9 n r n ( ~ .~ m a x = 4 4 9 nm
o.O.~ o-0"2o / / ~ = \ / / 5 7 5 n r n \
O/ 5 7 5 n m \\ o o
O~Oo--O, \
L I I I i I ~ I I I I I I I
400 500 600 700 400 500 600 700
WAVELENGTH .~ (nm) WAVELENGTH .4 (nm)
Fig. 3. Comparison of the spectral sensitivity functions as obtained psychophysically during steady exposure to 390 cd/m 2 yellow light (/x = 575 nm; open circles) or to 385 cd/m 2 white light (/x = 0 ; solid circles). Ordinate: log relative quantum energy necessary to detect the stimulus of pat tern reversal (reversal rate 2.4 s ~; visual angle subtended 85 min of arc). (A) Results of subject 2. The curve of /x = 575 nm is from the mean value as in Fig. 2B. Zero relative log quanta correspond to -9 .22 log /xE cm -2 s 1 at 449 nm. (B) Results of subject 1. Zero log relative quanta correspond to -9 .02 log /zE cm -2 s -~ at 449 nm.
P-VEP studies
The low spatial resolution of SWS cone mechanism was also reflected in the P-VEP studies (Fig. 4). The amplitude at a test wavelength of 449 nm increased continuously as the check size became larger, whereas the P-VEP under a test wavelength of 545 nm or 625 nm showed their maximal am- plitudes at a check size of 22 min of arc. This manifestation was consistent during repeated tests in separate sessions.
The longer latency of the SWS cone mechanism also manifested in the P-VEP like that observed in LVEP [23, 24, 26, 27], as strikingly shown in Fig. 5. It should be noted that the latencies of both P2 and N3 under the yellow light adaptation showed the same pattern of changes, suggesting the similarity of their underlying mechanisms. For all test wavelengths the P-VEP latencies (both P2 and N3) became shorter with higher test light intensities.
We sometimes observed a double positive waveform before N3. It ap- peared more frequently at test wavelengths of 487 nm or longer (Fig. 5). This phenomenon was also reported in LVEP in other studies [22, 361. According to the gradual shortening of P-VEP latency vs. the increase of test light energy, it is obvious from Fig. 5 (C-E) that a single positive wavelet before N3 cannot be P1 but is P2. At the highest test light energy of

173
v ( ~ ~ = 4 4 9 nm ~=~ .~= 5 4 5 nm ~ .I. = 6 2 5 nm CHECK SIZE ( rain of arc )
N3
+T 5#V [- - - t
ISI 417 ms 100 ms
10
Fig, 4. P-VEP recordings of subject 2 at three different test wavelengths to the stimuli of pattern reversal of four different check sizes. The steady adaptive yellow light (/x = 575 nm) was 390 cd/m 2, and the same radiant quantum energy was adjusted for the three different test wavelengths. Pattern reversal rate: 2.4 s 1. The P2 and N3 wavelets of P-VEP are indicated in the top row. Note that the amplitude at test wavelength 449 nm increased continuously as the check size increased.
the 545 nm test wavelength, the P2 latency of subject 1 did not show a further shortening but became longer (Fig. 5D). This manifestation was consistent during three separate testing sessions. We believe that it may be accounted for as the nonlinear response when the test light energy was above a certain range.
P-VEP response-intensity functions as obtained from the mean value of two to five tests are shown in Figs. 6 (amplitude) and 7 (P2 latency). The response-intensity functions of P-VEP N3 latency (not shown) were in general very similar to those of P2 latency. Quite frequently the response amplitude showed some saturation at higher test intensities, especially for subject 1 (Fig. 6), while it was not so obvious in the latency responses (Fig. 7). Subject 1 generally had a much larger P-VEP amplitude than subject 2; hence different criterion amplitudes were selected to plot the spectral sensitivity function based on the P-VEP amplitude. The criterion latencies for P2 and N3 were selected on the linear section of their response-intensity functions. The lines of criterion latency failed to cut across the response- intensity curves under test light wavelengths of 507,545, and 625 nm as their locations were far from the others.
The spectral sensitivities of P-VEP (amplitude and latencies of P2 and N3) are presented in Fig. 8. They showed the ama ~ at 449 nm, which is consistent with the psychophysical approach. The overall spectral sensitivity from the P-VEP data showed a good agreement with that from the psychophysical data (Fig. 9).

174
@ . & = 4 0 7 n m ~ ~" ~" ~"
J ~ g g +r ~ 5 ,,z, z
I �9 lOOms .a < .a .a
1.61 16.7 117 172
~ ~ 1.31 10.8 137 192
1.00 10.6 157 218
0,70 6.4 170 240
ISl 417 ms
-'1. = 4 8 7 n m ~ ~" ~-
tu
;vT lO ~ 5 ~ ~5 i
lOOms o ~ ~ <~ <~ ..1 .1( .u d
2.38 15.9 97 138
1.88 17.5 109 157
1,39 14.1 119 176
0.69 11.4 157 224
0.59 5.6 184 256
g ISl 417 ms
~c .~ = 4 4 9 n m ~ ~ - ~ | o
J
1o ~ ~ ~ lOOms "J < "J -J
2.15 15.2 90 149
1.55 17.1 101 165
~ 1.06 14.6 119 151
~ 0.56 10.0 146 201
~ ~ 0.35 9.8 161 233 q
0.05 6.3 189 254
@
[sI 417 ms
= 5 4 5 n m
3. = 6 2 5 n m ,,=, ~ ~ ,,=, == - _
= ~ ,,=,
< .J J
10.6 91 126 2.79
2.29 12.9 94 136
1.80 8.6 101 156
1.31 3.6 139 186
I ISI 417 ms
,o;, T - I
l O O m s
2.61 9.1 100 128
uJ ~ ~ v
..~ ,,z, uJZ
...I < .,.l ,..i
Fig. 5. Representat ive P-VEPs of subject 1 of different relative log energy levels for test lights of 407 nm (A), 449nm (B), 487nm (C), 545 nm (D), and 625 nm (E), under steady adaptive yellow light (/x = 575 nm) of 390 c d / m 2. Check size of 85 min of arc; re- versal rate, 2 .4s -1. Interstimulus interval (ISI) = 417 ms. The corresponding am- plitude and latencies of P2 and N3 are shown to the right of the P-VEP recordings.
2.11 14.3 87 128
1.62 17.2 94 140
1.01 3.8 111 175
[ ISI 417 ms

175
|
|
11
10
9
8
N6 2 s ~ 4
3
2
]
CRITERION . . . . . . . . . . . . . . . . .
- ~,M-PLTfLTD E- . . . . . . . . .
.4 (rim)
O 407
�9 430
449
�9 468
[~ 487
�9 507
I I I
RELATIVE LOG QUANTA
18
17
16
15
14
13
12
=l-
v 11 ui s
2 1o g_ :~ 9 <
2
0 01~ 110 115 210 21~ 310 RELATIVE LOG QUANTA
Fig. 6. P-VEP amplitudes as a function of relative log quanta at each test wavelength, A (nm), under steady exposure to yellow light (/z = 575 nm), from subject 2 (A, mean value of 2-5 tests) and subject 1 (B, mean value of 2 -4 tests). Zero relative log quanta correspond to - 8 . 8 6 log # E cm 2s 1. The criterion amplitude selected was 5.5/~V for subject 2 and 11 /zV for subject 1.

176
| 19o 180 170
" ~ 1 6 0
~ 150
140 - ,_1
|
130
120
110
100
90
�9 80
200
0- . t (nm)
�9 4 0 7
�9 4 3 0
4 4 9
�9 4 6 8
[ ] 4 8 7
�9 5O7
~) 545
0 625
I [ I I I I
0 0.5 1.0 1.5 2.0 2.5 RELATIVE LOG QUANTA
190
I
3.0
180
170
160
E 150 >..
O 140
-- 130
120
C R I T E R I O N L A T E N C Y
�9 407
�9 430
~. 4 4 9
110 �9 468 [ ] 4 8 7
100 �9 ~o7 s 545
90 $ 625
80 i I I I I I i
0 0,5 1.0 1.5 2.0 2,5 3.0 RELATIVE LOG QUANTA
Fig. 7. P2 latency of P-VEP as a function of relative log quanta at each test wavelength, A (nm), under steady exposure to yellow light (/x = 575 nm), from subject 2 (A, mean value of 2-5 tests) and subject 1 (B, mean value of 2-4 tests). Zero relative log quanta correspond to -8 .86 log /xE cm -~ s -1. The criterion latency selected was 140 ms.

0.0
7
2.5
. / k m a x = 4 4 9 n m
0.5
E~ Z "~ 1.0 (3"
0 1.5
r~ >
2.0
0.0
|
I
400 I I I I
450 500 550 600
WAVELENGTH X(nm)
I
650
177
X = 4 4 9 n m ---* ~ . r r l ( I x / ~ .
/ / \
/ \
7 r~ 0 .2
0.4
r~ o
0.6
>
0.8 r-~
1.0 I I I
400 450 500
WAVELENGTH X(nm)
Fig. 8. (A) Spectral sensitivity functions of P-VEP amplitude of subjects 1 (solid circles) and 2 (open circles), using the criterion amplitude of 5.5/.tV (subject 2) and 11 /xV (subject 1). The curves show their original ratio. Zero relative log quanta correspond to -8.42 log/*E cm 2 s-~ at 449 rim. (B) Spectral sensitivity functions of P2 latency (solid line; criterion latency of 140 ms) and N3 latency (dashed line; criterion latency of 200 ms) for subjects 1 (solid symbols) and 2 (open symbols). All curves show their original ratio. Zero relative log quanta correspond to -8 .401ogbtEcm-2s ~ at 449nm.

0.0
0.5
E-4 ~; 1.0
C~
1.5 O
> z.0
2.5
3.0
A P-VEP P2 Latency b v P-VEP N3 Latency
178
I I I I I I I
400 450 500 550 600 650 700
WAVELENGTH X(nm) Fig. 9. Spectral sensitivity functions of psychophysical data compared with P-VEP data. Mean values of both subjects are presented. Ordinate: log relative quantum energy where the zero relative log quanta correspond to -9.12 log/xE cm-2s i. The psychophysieal data have their original ratio with the ordinate. The P-VEP data were shifted upward to have their Am~ • locate at the level of zero relative log quanta. The data sets of P2 and N3 latencies have their values only from 407 nm to 487 nm. All data sets have their Ama ~ at 449 rim.
Discussion
Extensive research has been done on single-unit recording. In their work, Livingstone and Hubel [30] pointed out that 'the anatomy and physiology of a color system in the primate visual cortex suggests that a system involved in the processing of color information, especially color-spatial interactions, runs parallel to and separate from the orientation specific system'. Potential- ly more information can be extracted from investigations that incorporate spatial and color properties, as suggested in the present study. That interac- tions exist between the color and spatial channels, as psychophysically and electrophysiologically demonstrated in our study, correlates well with the conclusions of studies based on single-unit recording [30, 37].
The color channels also have their interaction with the temporal param- eters [38-43]. Thus, one must consider an additional variable if higher stimulating frequency is to be employed to elicit steady-state VEPs. We undertook this study with transient VEPs to simplify the interaction between color and spatial parameters.

179
Past attempts were not successful in correlating the spectral sensitivity functions of the SWS cone mechanism between criterion VEP latency data and psychophysical data [34]. Our success is apparently due to the selection of a suitable stimulating parameter. Our findings give further proof that spatial property strongly influences color mechanism. The low spatial resolu- tion of the SWS cone mechanism has also been observed in psychophysical studies of contrast sensitivity [41, 44-46]. The underlying mechanism, like many other peculiar characteristics of the SWS cone mechanism, is still obscure and requires further investigation [1].
The longer latency is characteristic of the SWS cone mechanism at the retinal level as investigated with PERG [32] and at the cortical level as investigated with both P-VEP (in this study) and LVEP [23, 24, 26, 27]. Boynton and Whitten [14], who studied selective chromatic adaptation in primate photoreceptors, suggest that these longer latencies can already be seen at the receptor level. In addition, it has been shown that lights stimulating primarily the SWS cone mechanism are associated with longer psychophysical reaction times than are characteristic of those associated with light flashes in other regions of the visible spectrum [47]. All these data support the notion of a relatively independent channel of the SWS cone mechanism running from the photoreceptor to the visual cortex.
It is suggested that in ordinary P-VEP checks subtending 50 min of arc are likely introducing the luminance effect [48]. We believe that this was not likely in our P-VEP studies, although we used a check size of 85 min of arc. We base our arguments on the following: (1) The spectral sensitivity curves derived from our P-VEP latency data closely resembled those derived from psychophysical data, a sharp distinction from the latency data from LVEP; (2) Unlike the MWS and LWS cone mechanisms, the SWS cone mechanism is believed to be uninvolved in the coding not of brightness but of hue only [49-53], especially at low stimulating frequencies [43, 54] as in this study; (3) The sensitivity of the MWS and LWS cone mechanisms were greatly reduced, and the rods were bleached under our intense steady yellow light adaptation. It is unlikely that these cone mechanisms or the rods could play a significant role in such circumstances.
The Area x of SWS cone mechanism at the corneal level is 440 nm in Stiles' 77-1 mechanism [9, 10] and about 436nm in Wald's observation [11]. The actual /~max of our data was 449 nm but might be slightly shorter, i.e., closer to the hma x Of Stiles and Wald. This is indicated in our Fig. 9, which shows that the spectral sensitivity data of P-VEP are not symmetrical but somewhat skewed toward the shorter-wavelength side. This phenomenon is not so noticeable with the psychophysical data. A more precise h ..... might have been confirmed if we had added another test wavelength between 430 and 449 nm.
It is also apparent from Fig. 9 that the spectral sensitivities from the P-VEP latency data are in closer agreement with the psychophysical data

180
than the P-VEP amplitude data. This finding is consistent with the observa- tions that the VEP latencies parallel psychophysical data more closely than VEP amplitudes under both scotopic [55, 56] and photopic [57] conditions. Furthermore, the P-VEP latency data may be superior to those of amplitude in terms of their selectivity in isolating the SWS cone mechanism. The response-intensity curves from the latency data showed a 'clustering' of the curves with test wavelengths between 400 and 500 nm so that they were separated from those with test wavelengths above 500 nm (Fig. 7). Conse- quently it is not possible to find a line of criterion latency cutting across the linear parts of all the curves, although this is possible with the P-VEP data of amplitude (Fig. 6).
Estdvez and Spekreisje, Est6vez et al. [58-60] used the approach of spectral compensation method (silent substitution) to independently mod- ulate the three different cone mechanisms with the P-VEP technique. To stimulate the SWS cone mechanism, they employed a check size of 40 rain of arc, which was larger than what they used for the MWS and LWS cone mechanisms. They found the SWS cone mechanism had the largest am- plitude with that check size, although no systematic observation was pre- sented. This is consistent with our observation of the relationship of P-VEP amplitude and spatial resolution of the SWS cone mechanism. But once again they did not observe P-VEP latency, possibly owing to the fact that they used a reversal rate of 6s -1, which is near the frequency to elicit steady-state VEP.
Our findings may have clinical application if P-VEP latencles are used to investigate the SWS cone mechanism. Reports on the practical application of VEPs with this approach are rare. One of the major reasons is that the variability of VEP amplitude excludes its routine application. An alternative approach is to plot the spectral sensitivity curve from criterion VEP amplitude, which is time-consuming [22, 28]. The value of this special VEP technique will be enhanced based on the grounds that (1) VEP latencies, especially with patterned stimuli, are more stable and hence more reliable [34]; (2) VEP latencies parallel psychophysical data more closely; and (3) P-VEP latency with this approach can isolate the SWS cone mechanisms better as previously discussed. We envision that fewer test wavelengths or sometimes even a single test wavelength might be sufficient to compare normal and abnormal subjects. Together with the LERG [61] and PERG [32] technique allowing selective evaluation of different cone mechanisms, it is now possible to obtain insight into the color mechanism at different levels of the visual system.
Acknowledgements
We thank Prof. E. Zrenner for his critical reading of the manuscript, Mr. D.

181
Hietel for technical assistance, Dr. H. Meissl for his enthusiastic support, and Mrs. E. Baruth for producing the figures.
References
1. Zrenner E. What is special about the blue cone mechanism? In: Zrenner E, ed. Neuro- physiological aspects of color vision in primates. Berlin: Springer-Verlag, 1983: 81-88.
2. Dartnall HJA, Bowmaker JK, Mollon JD. Microspcctrophotometry of human photo- receptors. In: Mollon JD, Sharpe LT, eds. Colour vision: physiology and psychophysics. London: Academic Press, 1983: 69-80.
3. Gouras P. Color vision. In: Osborne NN, Chader GJ, eds. Retinal research, Vol. 3. Oxford: Pergamon Press, 1984: 236-38.
4. Marc RE, Sperling HG. Chromatic organization of primate cones. Science 1977; 196: 454-456.
5. Hood DC, Benimoff NI, Greenstein VC. The response range of the blue-cone pathways: a source of vulnerability to disease. Invest Ophthalmol Vis Sci 1984; 25: 864-67.
6. Mollon JD, A taxonomy of tritanopias. Doc Ophthalmol Proc Ser 1982; 33: 87-101. 7. Zisman F, Adams AJ. Spectral sensitivity of cone mechanisms in iuvenile diabetics. Doc
Ophthalmol Proc Ser 1982; 33: 127-31. 8. Zrenner E. Electrophysiological characteristics of the blue sensitive mechanism: test of a
model of cone interaction under physiological and pathological conditions. Doc Opbthal- mol Proc Ser 1982; 33: 103-25.
9. Stiles WS. Increment thresholds and the mechanisms of colour vision. Doc Ophthalmol 1949; 3: 138-65,
10. Stiles WS. Color vision: the approach through increment threshold sensitivity. Proc Natl Acad Sci 1959; 45: 100-14.
11. Wald G. The receptors of human color vision: action spectra of three visual pigments in human cones account for normal color vision and color-blindness. Science 1964; 145: 1007-17.
12. Ksinsik R. Adaptive Parameter der Blauverschiebung der Spektralsensitivitaet des Kanin- chenauges. Graefes Arch Clin Exp Ophthalmol 1967; 172: 112-24.
13. Zrenner E, Gouras P. Blue-sensitive cones of the cat produce a rodlike electroretinogram. Invest Ophthalmol Vis Sci 1979; 18: 1076-81.
14. Boynton RM, Whitten DN. Selective chromatic adaptation in primate photoreceptors. Vision Res 1972; 12: 855-74.
15. Evers HU, Gouras R Three cone mechanisms in the primate electroretinogram: two with, one without off-center bipolar responses. Vision Res 1986; 26: 245-54.
16. Gouras P. Electroretinography: some basic principles. Invest Ophthalmol 1970; 9: 557-69. 17. Mehaffey L, Berson EL. Cone mechanisms in the electroretinogram of the cynomolgus
monkey. Invest Ophthalmol 1974; 13: 266-73. 18. Norren D van, Padmos P. Human and macaque blue cones studied with electroretinog-
raphy. Vision Res 1973; 13: 1241-54. 19. Padmos P, Norren D van. Cone spectral sensitivity and chromatic adaptation as revealed by
human flicker electroretinography. Vision Res 197l; 11: 27-42. 20. Padmos P, Norren D van, Jaspers Faijer JW. Blue cone function in a family with an
inherited tritan defect tested with electroretinography and psychophysics. Invest Ophthal- mol Vis Sci 1978; 17: 436-41.
21. Sawusch M, Pokorny J, Smith Vc. Clinical electroretinography for short wavelength sensitive cones. Invest Ophthalmol Vis Sci 1987; 28: 966-74.
22. Adachi-Usami E, Heck J, Gavriysky V, Kellermann FJ. Spectral sensitivity function

182
determined by the visually evoked cortical potential in several classes of color deficiency (cone monochromatism, rod monochromatism, protanopia, deuteranopia). Ophthalmic Res 1974; 6: 273-90.
23. Huber C. Visual evoked responses during exposure to strong colored lights. Ophthalmic Res 1972; 3: 55-62.
24. Jankov E. Spektralsensitivitfit der off-Antwort im menschlichen VECP bei verschiedenfar- biger Adaptation. Graefes Arch Clin Exp Ophthalmol 1978; 206: 121-33.
25. Jankov E. New observations on the violet mechanism in man as revealed by the VECP. Acta Physiol Pharmacol Bulg 1988; 14: 68-76.
26. Kellermann FJ, Adachi-Usami E. Spectral sensitivities of colour mechanisms isolated by the human visual evoked response. Ophthalmic Res 1972/73; 4: 199-210.
27. Krauskopf J. Contributions of the primary chromatic mechanisms to the generation of visual evoked potentials. Vision Res 1973; 13: 2289-98.
28. Zrenner E, Kojima M. Visually evoked cortical potential (VECP) in dichromats. In: Streiff EB, ed. Modern problems in ophthalmology, Vol. 17. Basel: Karger, 1976: 241-46.
29. Arden GB. The importance of measuring contrast sensitivity in cases of visual disturbance. Br J Ophthalmol 1978; 62: 198-209.
30. Livingstone M, Hubel D. Anatomy and physiology of a color system in the primate visual cortex. J Neurosci 1984; 4: 309-56.
31. Land EH. Recent advances in Retinex theory. Vision Res 1986; 26: 7-21. 32. Niepel G, Dodt E. Pattern electroretinogram of the blue cones. Graefes Arch Clin Exp
Ophthalmol 1989; 227; 45-50. 33. Lowitzsch K. Visuell evozierte Potentiale. In: Lowitzsch K, Maurer K, Hopf HC.
Evozierte Potentiale in der Klinischen Diagnostik. Stuttgart: Georg Thieme Verlag, 1983: 32-33.
34. Siegfried JB. VECP: its spectral sensitivity. In: Armington JC, Krauskopf J, Wooten BR, eds. Visual psychophysics and physiology. New York: Academic Press, 1978: 257-66.
35. King-Smith PE, Carden D. Luminance and opponent-color contributions to visual detec- tion and adaptation and to temporal and spatial integration. J Opt Soc Am 1976; 66: 709-17.
36. Shipley T, Jones RW, Fry A. Spectral analysis of the visually evoked occipitogram in man. Vision Res 1968; 8: 409-31.
37. Zeki S. The representation of colours in the cerebral cortex. Nature 1980; 284: 412-18. 38. Brindley GS, Du Croz JJ, Rushton WAH. The flicker fusion frequency of the blue-sensitive
mechanism of colour vision. J Physiol 1966; 183: 497-500. 39. Burkhardt DA, Riggs LA. Modification of the human visual evoked potential by mono-
chromatic backgrounds. Vision Res 1967; 7: 453-59. 40. Green DG. Sinusoidal flicker characteristics of the color-sensitive mechanisms of the eye.
Vision Res 1969; 9: 591-601. 41. Kelly DH. Spatio-temporal frequency characteristics of color-vision mechanisms. J Opt Soc
Am 1974; 64: 983-90. 42. Regan D. Chromatic adaptation and steady-state evoked potentials. Vision Res 1968; 8:
149-58. 43. Stockman A, MacLeod DIA, DePriest DD. The temporal properties of the human
short-wave photoreceptors and their associated pathways. Vision Res 1991; 31: 189-208. 44. Cavonius CR, Est~vez O. Contrast sensitivity of individual color mechanisms of human
vision. J Physiol 1975; 248: 649-62. 45. Green DG. The contrast sensitivity of the color mechanisms of the human eye. J Physiol
1968; 196: 415-29. 46. Green DG. Visual acuity in the blue cone monochromat. J Physiol 1972; 222: 419-26. 47. Mollon JD, Krauskopf J. Reaction time as a measure of the temporal response properties
of individual color mechanisms. Vision Res 1973; 13: 27-40.

183
48. Michael WF, Halliday AM. Differences between the occipital distribution of upper and lower field pattern-evoked responses in man. Brain Res 1971; 34: 311-24.
49. Cavanagh P, MacLeod DIA, Anstis SM. Equiluminance: spatial and temporal factors and the contribution of blue-sensitive cones. J Opt Soc Am 1987; 4A: 1428-38.
50. Eisner A, MacLeod DIA. Flicker photometric study of chromatic adaptation: selective suppression of cone inputs by colored backgrounds. J Opt Soc Am 1981; 71: 705-18.
51. Gouras P, Eggers H. Ganglion cells mediating the signals of blue sensitive cones in primate retina detect white-yellow borders independently of brightness. Vision Res 1982; 22: 675-79.
52. Walraven J. Colour signals from incremental and decremental light stimuli. Vision Res 1977; 17: 71-76.
53. Walraven J. Perceived colour under conditions of chromatic adaptation: evidence for gain control by II mechanisms. Vision Res 1981; 21: 611-620.
54. Verdon W, Adams AJ. Short-wavelength-sensitive cones do not contribute to mesopic luminosity. J Opt Soc Am 1987; 4: 91-95.
55. Adachi-Usami E, Kellermann FJ. Spatial summation of retinal excitation as obtained by the scotopic VECP and the sensory threshold. Ophthalmic Res 1973; 5: 308-16.
56. Adachi-Usami E. Incremental threshold as obtained by the visually evoked cortical potential (VECP). Ophthalmic Res 1974; 6: 55-63.
57. DeVoe RG, Ripps H, Vaughan HG. Cortical responses to stimulation of the human fovea. Vision Res 1968; 8: i35-47.
58. Estdvez O, Spekreijse H. A spectral compensation method for determining the flicker characteristics of the human colour mechanisms. Vision Res 1974; 14: 823-30.
59. Est6vez O, Spekreijse H. The 'silent substitution' method in visual research. Vision Res 1982; 22: 681-91.
60. Est6vez O, Spekreijse H, Van Den Berg TJTP, Cavonius CR. The spectral sensitivities of isolated human color mechanisms determined from contrast evoked potential measure- ments. Vision Res 1975; 15: 1205-12.
61. Gouras P, MacKay CJ. Electroretinographic responses of the short-wavelength-sensitive cones. Invest Ophthalmol Vis Sci 1990; 31: 1203-09.
Address for correspondence: Prof. Dr. E. Dodt, Parkstr. 1, Max-Planck-Institute, W.G. Kerckhoff-Institute, D-6350 Bad Nauheim, Germany. Tel. 06032-705271; Fax. 06032-705211.