spatial coherence of interannual variability in water properties on the u.s. northeast shelf david...
TRANSCRIPT
Spatial coherence of Spatial coherence of interannual variability in water interannual variability in water properties on the U.S. northeast properties on the U.S. northeast
shelfshelf
David G. Mountain and David G. Mountain and Maureen H. TaylorMaureen H. TaylorPresented by: Presented by: Yizhen LiYizhen Li

1. Introduction --Position1. Introduction --Position
Chesapeake Bay

1 Introduction – Significance of 1 Introduction – Significance of interannual variationinterannual variation
The interannual variability of the water properties aThe interannual variability of the water properties as temperature and salinity on the continental shelf s temperature and salinity on the continental shelf off the northeast United States has been proven to boff the northeast United States has been proven to be significant during several recent decadese significant during several recent decades
important for the biological process of the northeasimportant for the biological process of the northeast shelf ecosystem. t shelf ecosystem.
the changes in water property will likely be the prithe changes in water property will likely be the primary consequence of a change in climate that may mary consequence of a change in climate that may occur in future decades (Manabe and Stouffer, 198occur in future decades (Manabe and Stouffer, 1980).0).
1 Introduction—Former research1 Introduction—Former research Empirical Orthogonal Function (EOF) analysis to study Empirical Orthogonal Function (EOF) analysis to study
the interannual variability in sea surface temperature the interannual variability in sea surface temperature (SST) over a long region from Southern Greenland and (SST) over a long region from Southern Greenland and Labrador to Cape Hatteras. Labrador to Cape Hatteras. two primary modes that two primary modes that account for 44% of the entire variations over a length of account for 44% of the entire variations over a length of over 1000km. over 1000km.
only four points in the northeast shelf region was only four points in the northeast shelf region was represented so the spatial structure within it is represented so the spatial structure within it is unknown. (Thompson et al ,1988) unknown. (Thompson et al ,1988)
SST interannual variability was largely affected by the SST interannual variability was largely affected by the surface atmospheric heat flux (Thompson et al,1993); surface atmospheric heat flux (Thompson et al,1993);
in the Scotian Shelf region : the influx of offshore water in the Scotian Shelf region : the influx of offshore water at depth on the shelf (Petrie and Drinkwater, 1993). at depth on the shelf (Petrie and Drinkwater, 1993).
the interannual variability of salinity and temperature the interannual variability of salinity and temperature within western Gulf of Maine (WGOM) was strongly within western Gulf of Maine (WGOM) was strongly correlated with those of Georges Bank and Middle correlated with those of Georges Bank and Middle Atlantic Bight (MAB). The SST change was due to Atlantic Bight (MAB). The SST change was due to surface heat flux while salinity is caused by local surface heat flux while salinity is caused by local precipitation and river runoff. (Mountain et al, 1994 )precipitation and river runoff. (Mountain et al, 1994 )

the main purpose of his paper:the main purpose of his paper:
to determine the degree and pattern to determine the degree and pattern of spatial coherence in the of spatial coherence in the interannual variation of water interannual variation of water properties on the northeast shelf.properties on the northeast shelf.
1 Introduction— Objective1 Introduction— Objective
2 Data and Methods2 Data and Methods Data: the Northeast Fisheries Science center (NEFSC) Marine Data: the Northeast Fisheries Science center (NEFSC) Marine
Resources Monitoring, Assessment, and Prediction (MARMAP) Resources Monitoring, Assessment, and Prediction (MARMAP) program. program.
3~6 surveys every year during 1977~1987 to measure the 3~6 surveys every year during 1977~1987 to measure the plankton and water properties over the continental shelf from plankton and water properties over the continental shelf from Cape Hatteras to the Gulf of Maine (GOM). 160 standard Cape Hatteras to the Gulf of Maine (GOM). 160 standard stationsstations
reversing thermometers at up to 15 standard depths to reversing thermometers at up to 15 standard depths to measure temperature most of the year, with an accuracy of measure temperature most of the year, with an accuracy of ~0.02°C and ~0.01 in salinity. ~0.02°C and ~0.01 in salinity.
Methods: remove the annual cycle of salinity (surface/bottom) Methods: remove the annual cycle of salinity (surface/bottom) and temperature (surface/bottom) of each MARMAP station and temperature (surface/bottom) of each MARMAP station using a harmonic analysis methodusing a harmonic analysis method
EOF analysis (winter (calendar days 304~120) ;summer periods EOF analysis (winter (calendar days 304~120) ;summer periods (121~303) (121~303) EOFs) & spatial distribution of the correlation EOFs) & spatial distribution of the correlation between the anomalies at different stations (also include between the anomalies at different stations (also include autocorrelation of SST and salinity in the same stations) are autocorrelation of SST and salinity in the same stations) are used to determine and visualize the spatial structure within the used to determine and visualize the spatial structure within the anomaly time series. anomaly time series.
a second station group was selected to focus on GOM to help a second station group was selected to focus on GOM to help interpret the results within the gulf from the primary station interpret the results within the gulf from the primary station set. set.
Ancillary data :SST series measured over 6 years (1985~1991) Ancillary data :SST series measured over 6 years (1985~1991) at Ambrose Light Tower ad at five NOAA offshore buoys. at Ambrose Light Tower ad at five NOAA offshore buoys.

2 Data and 2 Data and MethodsMethodsAsterisk: MARMAP station No clear annual
salinity cycle
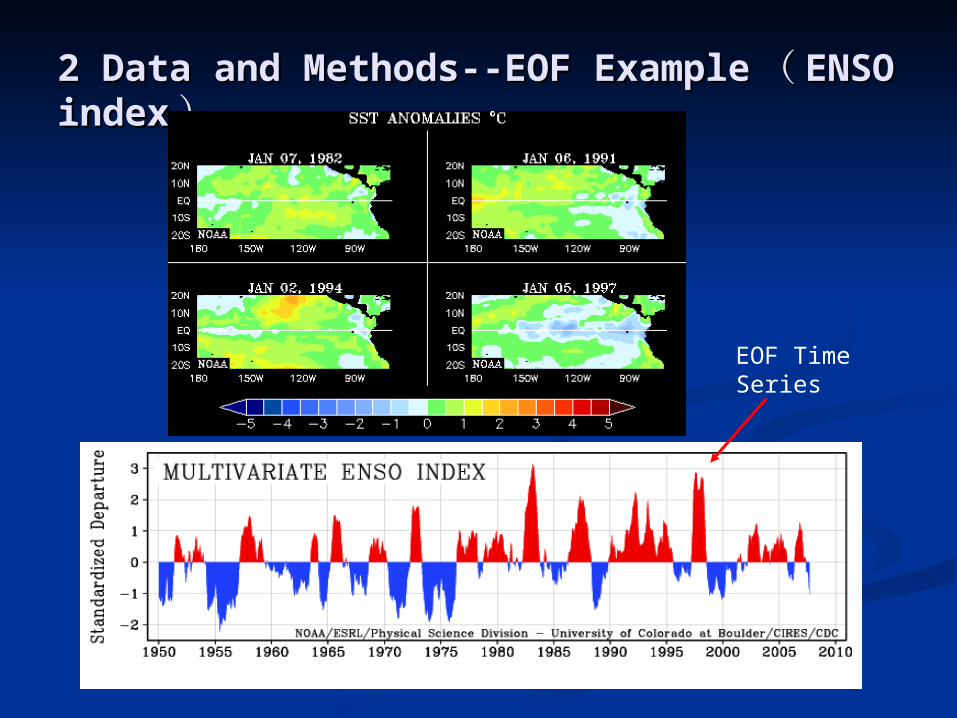
2 Data and Methods--EOF Example2 Data and Methods--EOF Example (( ENSO iENSO indexndex))
EOF Time Series

3 Results– Standard Deviation/Surface 3 Results– Standard Deviation/Surface TemperatureTemperature
0.5°C~2.0°C , larger near the shelf edge and near Cape Hatteras 0.5°C~2.0°C , larger near the shelf edge and near Cape Hatteras The bottom temperature distribution is similar to the surface. The bottom temperature distribution is similar to the surface.
0.5°C~2.0°C
Winter Summer
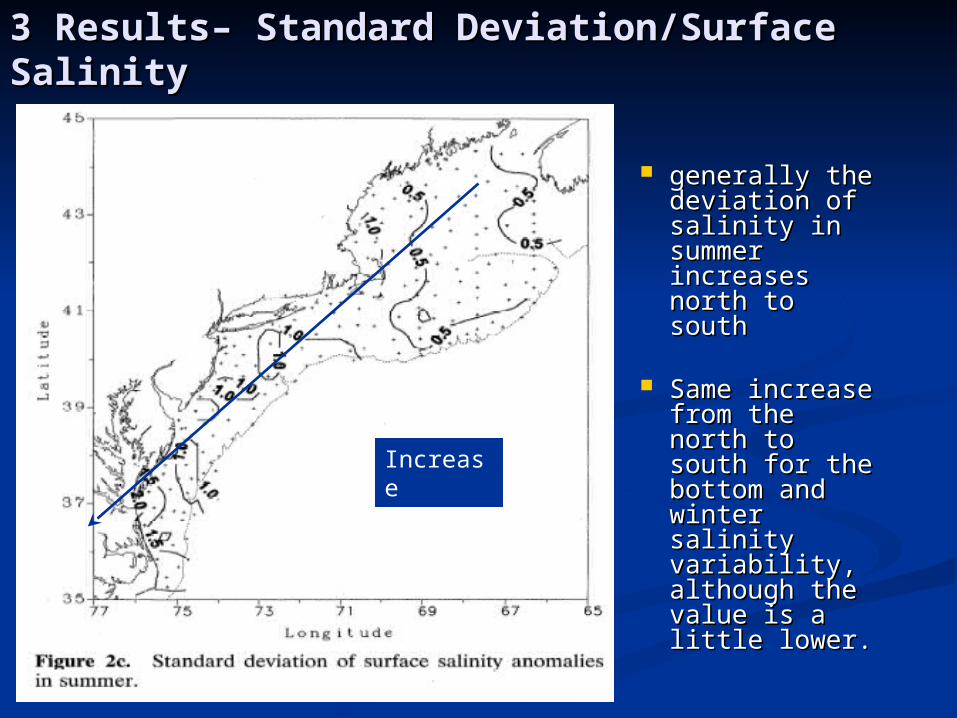
generally the generally the deviation of deviation of salinity in salinity in summer summer increases increases north to southnorth to south
Same increase Same increase from the from the north to south north to south for the bottom for the bottom and winter and winter salinity salinity variability, variability, although the although the value is a value is a little lower.little lower.
3 Results– Standard Deviation/Surface 3 Results– Standard Deviation/Surface SalinitySalinity
Increase
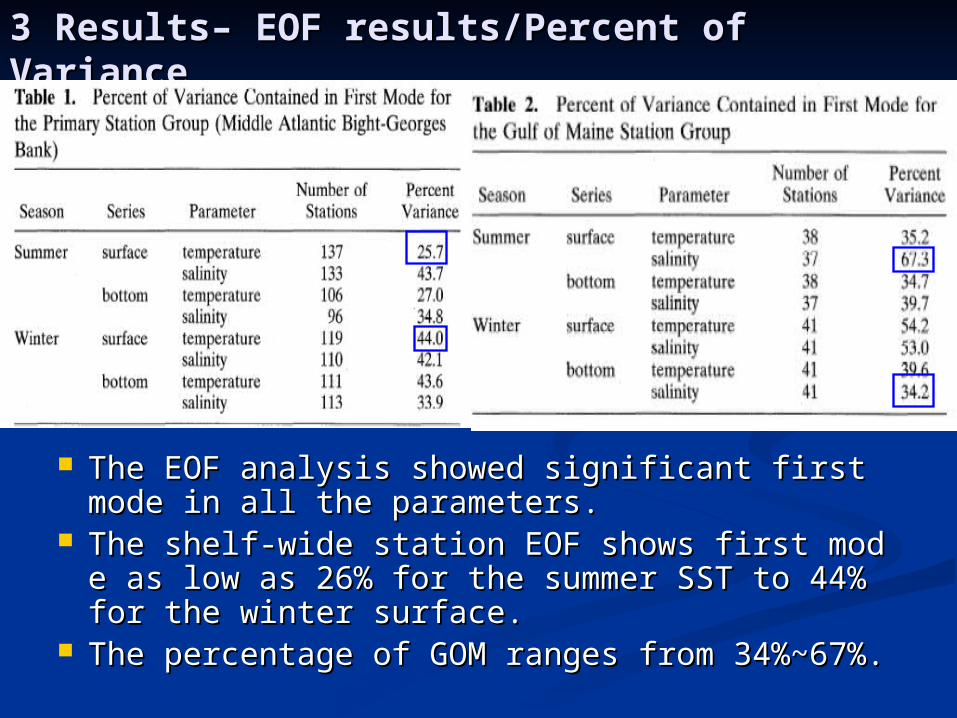
The EOF analysis showed significant first mode in alThe EOF analysis showed significant first mode in all the parameters.l the parameters.
The shelf-wide station EOF shows first mode as low The shelf-wide station EOF shows first mode as low as 26% for the summer SST to 44% for the winter suras 26% for the summer SST to 44% for the winter surface.face.
The percentage of GOM ranges from 34%~67%. The percentage of GOM ranges from 34%~67%.
3 Results– EOF results/Percent of 3 Results– EOF results/Percent of VarianceVariance
3 Results– EOF results/Surface 3 Results– EOF results/Surface Temperature/WinterTemperature/Winter
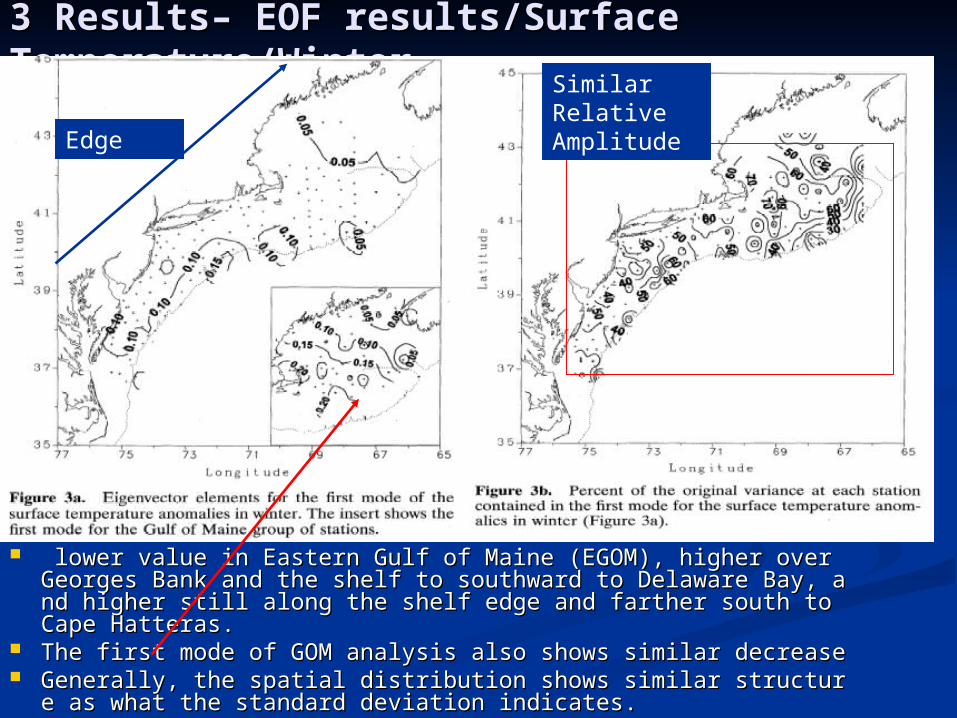
lower value in Eastern Gulf of Maine (EGOM), higher over Gelower value in Eastern Gulf of Maine (EGOM), higher over Georges Bank and the shelf to southward to Delaware Bay, and hiorges Bank and the shelf to southward to Delaware Bay, and higher still along the shelf edge and farther south to Cape Hattergher still along the shelf edge and farther south to Cape Hatteras. as.
The first mode of GOM analysis also shows similar decrease The first mode of GOM analysis also shows similar decrease Generally, the spatial distribution shows similar structure as Generally, the spatial distribution shows similar structure as
what the standard deviation indicates. what the standard deviation indicates.
Edge
Similar Relative Amplitude

3 Results– EOF results/Surface 3 Results– EOF results/Surface Salinity/SummerSalinity/Summer
Surface Salinity has similar variation as standard variationSurface Salinity has similar variation as standard variation We also found similarity between EOF mode and original We also found similarity between EOF mode and original
data for most occasions except the Summer SST. data for most occasions except the Summer SST.
Increase

3 Results– EOF results/Surface 3 Results– EOF results/Surface Temperature/SummerTemperature/Summer
It has high values in MAB off New Jersey, with decreasing values It has high values in MAB off New Jersey, with decreasing values toward Cape Hatteras and toward the east, south of New toward Cape Hatteras and toward the east, south of New England, leading to a change in sign in the WGOM. the GOM England, leading to a change in sign in the WGOM. the GOM results show different structure of the shelf-wide EOF results show different structure of the shelf-wide EOF
This is quite different from the standard deviation distributionThis is quite different from the standard deviation distribution the percentage variance has high values only in the MAB region. the percentage variance has high values only in the MAB region.
Change in SignLarge
r Value
Larger Value
Different
The ‘two modes’The ‘two modes’

3 Results–correlations between property anomalies at 3 Results–correlations between property anomalies at
different stationsdifferent stations
show results similar to EOF for winter show results similar to EOF for winter and summer. and summer.
significant correlation for the shelf-significant correlation for the shelf-wide SST during winterwide SST during winter
Winter

3 Results–correlations between property anomalies at 3 Results–correlations between property anomalies at
different stationsdifferent stations Summer
only have two localized correlation during summer one in the WGOM and one in MAB.
3 Results--correlation between SST and 3 Results--correlation between SST and surface salinity at each station in the summer surface salinity at each station in the summer
time at MAB and WGOM.time at MAB and WGOM.
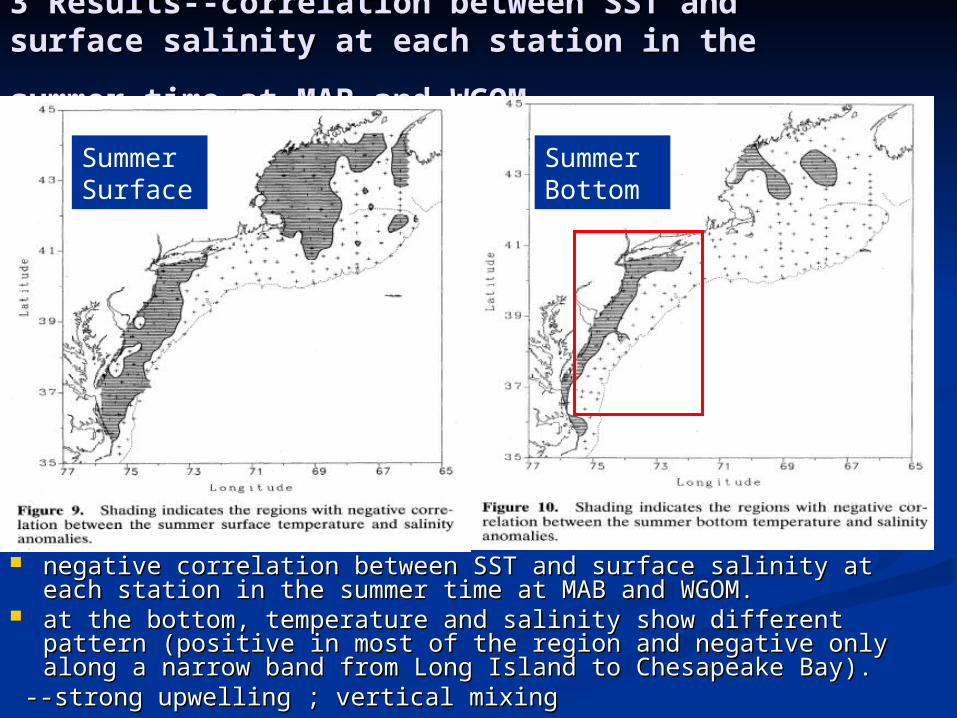
negative correlation between SST and surface salinity at each negative correlation between SST and surface salinity at each station in the summer time at MAB and WGOM.station in the summer time at MAB and WGOM.
at the bottom, temperature and salinity show different pattern at the bottom, temperature and salinity show different pattern (positive in most of the region and negative only along a narrow (positive in most of the region and negative only along a narrow band from Long Island to Chesapeake Bay). band from Long Island to Chesapeake Bay).
--strong upwelling ; vertical mixing --strong upwelling ; vertical mixing
Summer Surface
Summer Bottom

3 Results--The autocorrelation for the daily SST from 3 Results--The autocorrelation for the daily SST from ALT and NOAA buoys as well as the correlation of ALT and NOAA buoys as well as the correlation of MARMAP stations MARMAP stations MARMAP correlations
drop off only slightly rapidly than the buoy autocorrelation
MARMAP anomaly correlations may have been influenced as much by the time between the observations as by the spatial separation.
4 Conclusion and Discussion4 Conclusion and Discussion
In this paper, the interannual variability of the In this paper, the interannual variability of the surface and bottom temperature and salinity on the surface and bottom temperature and salinity on the U.S northeast shelf is carefully described using the U.S northeast shelf is carefully described using the 10-year hydrographic data from the NEFSC 10-year hydrographic data from the NEFSC MARMAP program. MARMAP program.
(1) All parameters show significant first modes in (1) All parameters show significant first modes in the EOF analysis, with 40~50% variance in winter the EOF analysis, with 40~50% variance in winter and 25~35% in the summer period and 25~35% in the summer period
(2)Most parameters (except for the summer SST) (2)Most parameters (except for the summer SST) exhibit coherent variability across the entire shelf exhibit coherent variability across the entire shelf region from Cape Hatteras to the central Gulf of region from Cape Hatteras to the central Gulf of Maine. This high degree of coherence and the long Maine. This high degree of coherence and the long coherence length scales indicate that the coherence length scales indicate that the interannual variability of this shelf region could be interannual variability of this shelf region could be derived from observations at relatively few derived from observations at relatively few locations.locations.
Conclusion and DiscussionConclusion and Discussion (3)The summer SST shows two separate regions of (3)The summer SST shows two separate regions of
coherent variability (with lower salinity and higher SST) coherent variability (with lower salinity and higher SST) in the central of MAB and WGOM, but compared to the in the central of MAB and WGOM, but compared to the winter SST it’s less coherent (25~35%). This winter SST it’s less coherent (25~35%). This regionalization is believed due to the local coastal runoff regionalization is believed due to the local coastal runoff effect in spring— the less saline coastal water can effect in spring— the less saline coastal water can stabilize the upper water column and inhibit vertical stabilize the upper water column and inhibit vertical mixing, so the solar insolation accumulates in the mixing, so the solar insolation accumulates in the surface layer. However, the degree of surface warming surface layer. However, the degree of surface warming depends on a localdepends on a local balancebalance between the run-off induced between the run-off induced structure, the surface heating and wind-induced structure, the surface heating and wind-induced mixing ,and the coherence in the MAB and WGOM is mixing ,and the coherence in the MAB and WGOM is according to the heating distribution caused by the local according to the heating distribution caused by the local wind and runoff over the water column.wind and runoff over the water column.
(4) Spatially the water property variation in the EGOM is (4) Spatially the water property variation in the EGOM is incoherent with the variability of rest of the shelf region. incoherent with the variability of rest of the shelf region. This is because the EGOM water property is less This is because the EGOM water property is less influenced locally but rather dominated by the influenced locally but rather dominated by the interannual variability of the inflow (advection process) interannual variability of the inflow (advection process) from Scotian Shelf and Northeast Channel.from Scotian Shelf and Northeast Channel.

Thank you!Thank you!