spatial assessment of corporate environmental management ... · workers in each company. the...
TRANSCRIPT

Pyrex Journal of Geography and Regional Planning Pyrex Journal of Geography and Regional Planning Vol 4 (1) pp.1-18 May, 2019 Copyright © 2019 Pyrex Journals Author(s) retain the copyright of this article http://www.pyrexjournals.org/pjgrp
Full Length Research Paper
Spatial Assessment of Corporate Environmental Management Systems of Selected Companies in
Eleme Local Government Area, Rivers State, Nigeria
Kika HA* and Arokoyu SB
Department of Geography and Environmental Management, University of Port Harcourt, Port Harcourt, Nigeria.
Accepted 23rd April, 2019 Abstract
Corporate governance of organizational environmental behavior has been largely inadequate to attain desired levels of environmental protection in Nigeria. However, the studies considering the corporate environmental management systems are still few in the literature. The study examined the spatial assessment of corporate environmental management systems (EMSs) of selected companies in Eleme Local Government Area, Rivers State Nigeria. The study made use of Indorama Petrochemical Company Ltd, Port Harcourt Refinery Corporation and Notore Chemical Industries. Three hundred copies of questionnaire were administered to elicit information from the Supervisors and other workers from the selected companies. Descriptive statistics in form of frequencies and percentages were used for the data analysis. Findings showed that the industries were manufacturing and extractive industries. Results revealed that 68.7% of the respondents agreed that they practiced EMS while 63.3% agreed that the commencing of EMS was after 2014 while 36.7% agreed that EMS commenced before 2014. Findings confirmed that more than 90% of the total respondents agreed that all the companies emit or discharge waste into the environment. Majority (68.7%) agreed that pattern or intervals of waste or pollution monitoring was structured at periodic intervals of 7 days while 68.0% of respondents agreed that emission target is set and 32.0% disagreed. Results showed that 93.3% of respondents that all the companies located in the study area were very sensitive to the discharge of waste or emissions into the environment. The study recommended among others that a strict adherence to the established standards be maintained to guide their operations and a periodic audit be also maintained to ensure sustainability of the environment. Keywords: Corporate, EMS, Periodic Audit, Sustainability, Eleme LGA.
INTRODUCTION Nigeria’s economy is heavily dependent on the oil and gas industries. These industries and their activities, coupled with the activities of pipeline vandalism, oil theft
Corresponding author email: [email protected]
and artisanal oil refining activities have been established to be the reason behind the wanton environmental degradation (Balogun and Francis, 2015) particularly in the Niger Delta Area of the country which includes Eleme Local Government Area. The damage impacted on the environment has attained a growing

J. Geogr. Reg. Plann. 2 status ever since the 1960s (Welford, 1998). This trend has brought in to the limelight the issues arising from this environmental impact from the industrial revolution and globalization for about four decades since 1960 till date. Scientific studies were of the view that man’s survival in the planet is questionable as a result of great environmental hazard impacted on the environment by human arrival on the planet (Barrow, 2005; Seymour, 2016).
The continuous introduction of substance to the environment has greatly affected the environment by the depletion of the ozone layer by the emission of emission levels of chlorofluorocarbons which are chemicals used in cooling technologies (Melbinger and Vergassola, 2015; Wong and Candolin, 2015). The introduction of gaseous and chemical substances (Green House Gases) into the environment has raised concern by environmental scientist in the alarming rate of rising temperature generally known as global warming (Cunningham, 2012). The continuous logging of forest resources from the world forest reserve depreciate the forest capacity to sustain continuous circulation of Oxygen and Carbon dioxide which is required for the sustenance of live in the atmosphere (Sampson et al., 2008). These in turn and the release of toxic chemicals from industrial activities are threatening the ecological balance of the earth and the very existence of man.
The growing threat to the environment as a result of these alterations caused by industrialization led to an Earth Summit conveyed in Rio de Janeiro, Brazil hence, in 1992, whereby the relationship between the environment and development was emphasized. At the end of the conference, the leaders of the world agreed to the need to stem the continuous deterioration of the environment. Combating the impact of human activities on the environment has been girdled by an attitudinal change which Ajai, (2004) categorized as a shift in paradigm to that of sustainable development with the aim of attain environmental resource exploitation with emphasis on the sustainable management of exploitation (Noah and Bradley, 2007).
However, the old ways of development which cause pollution and atmospheric damage that disrupts traditional ways of living and destroys ecosystems through industrial structures need to be changed into sustainable ways (Welford, 1998). The Brundtland Report, commissioned by the United Nations to examine long-term environmental strategies, argued that this would require quite radical changes in economic practices throughout the world especially among nations and corporate organizations. Corporate governance of organizational environmental behavior has been largely inadequate to attain desired levels of environmental protection. Indeed, at its core, environmental law is an activist form of governmental
regulation (Case, 2006). The perception that federal and state regimes enforcement of environmental laws is weak and sporadic worsens the problem of corporate regulatory noncompliance (Case, 2006). Managers within organization should be made not only to reduce costs, but also to minimize the environmental impacts on their operations. Unfortunately, a substantial impact on the environment has left Nigeria with an enormous economic, social, and environmental legacy.
This pressure is coming from a broad group of stakeholders, including regulatory bodies, employees, customers, investors, non-government organization and finance provider. Various stakeholders, such as business customers, investors, local communities and government are applying pressure on organizations to improve and report environmental performance. Secondly, as a result of the stakeholders’ pressure, environmental costs are not matching with its earning and benefits and becoming more important part of the organizational decision making.
There is therefore an increasing recognition that conventional management accounting practices should provide sufficient and accurate information for environmental management and environmental-related cost management. This will ensure that companies and organizations are increasingly aware that maximizing profits at any cost is no longer the most beneficial way to operate their business or to maintain and improve their competitive advantage. Generally, several studies had been done on environmental management systems but few were related to corporate companies especially in Nigeria. Since 1988, the Federal Environmental Protection Act (FEPA) of the Federal Government of Nigeria has developed guidelines to tackle environmental problems; existing impact studies in the area have not incorporated the issue of enforcement and implementation or adherence to corporate environmental governance and regulation in these industries located in Nigeria. Against this backdrop, the present study examined the spatial assessment of corporate environmental management systems of selected companies in Eleme Local Government Area, Rivers State, Nigeria using ISO14001. MATERIALS AND METHODS The study was carried out in Eleme Local Government Area (LGA) (Figure 1) whereby Indorama Eleme Petrochemical Company Limited, Port Harcourt Refinery Corporation (4.833oN and 7.1010oE), Notore Chemical Industries Limited (4.7364oN and 7.151765oE) and Port Harcourt Refinery Corporation (PHRC) Alesa-Eleme (4.7676 oN and 7.10054 oE) were selected. Eleme LGA is situated in the sub-equatorial region and thus enjoys the tropical climate. The area is

characterized by a mean yearly rainfall of about 2300 mm (Ogungbenro and Morakinyo, 2014; Kolebaje, Ikusika and Morakinyo, 2016). The mean annual temperature is 30oC and a mean annual relative humidity is 80% -100%. The vegetation of Port-Harcourt is consistently nourished with high rainfall and high temperature, which provide favorable condition for the growth of a varieties of tall and big trees like Khaya grandifoliola, Triplochiton scleroxylon, Terminalia superba and abundance of oil palm trees and several other species of economically valuable trees (Aisuebeogun, 1995; Eludoyin, Oderinde and Azubuike, 2010). Eleme LGA lies on the low lying coastal plain with mean elevation of about 20m (Umeuduji and Aisuebeogun, 1999). The population of Port Harcourt Metropolis was estimated to be 1,865,000 inhabitants, as at 2016 (National Population Commission, 2017).
The cross sectional research design was adopted for this study (Lavrakas, 2008). The major instrument used by the study was questionnaire. The population of the study was derived from the companies operating in Eleme Local Government Area whereby three companies were purposively selected for the study. These companies were selected based on the accessibility to the company’s management staff and other workers. These companies included the Indorama Eleme Petrochemical Company, Notore Chemical Industries and Port Harcourt Refinery Alesa Eleme. The Manager, Supervisors and other workers in each company were the target population for this study. There were ten departments in each company. In each company, the Manager, Supervisor of a Unit or Department and 9 other workers in each Unit or Department were sampled. In each company, a total of one hundred and eleven people were selected. In total, three hundred and thirty three people were selected for the study from all the selected companies in which three hundred copies of questionnaire were retrieved (Table 1). The copies of the questionnaire were administered on the Manager, Supervisor and other workers in each company. The questionnaire was administered using both purposive and simple random techniques. Data on collected from the respondents were analyzed using simple descriptive statistics of frequencies and percentage ratings. The hypothesis which stated that corporate environmental management systems (EMS) of the selected companies do not differ significantly from each other was tested using analysis of variance (ANOVA) at p < 0.05 significant levels.
RESULTS AND DISCUSSIONS Nature of Business From the analysis in Figure 2, the manufacturing
Kika and Arokoyu. 3 industry only was the highest (31.3%) while 26.3%, 21.7% and 20.7% were manufacturing only, extractive only and processing only respectively. This is so because Indoroma was engaged in the manufacturing and processing activities while PHRC was concerned with extraction of raw materials. The extraction industry are mostly waste like topsoil, overburden, waste rocks dredge spoil and so on while waste generated from the extraction and processing industries are chemical waste in form of emissions and discharge as effluent in to the environment.
Operational Sector Table 2 shows the companies in the region are of three categories which included publicly owned, privately owned and both publicly and privately owned. Analysis revealed that 32.0% agreed that the industries were privately owned, 31.3% agreed that they were publicly owned while 36.7% agreed that they were privately and publicly owned. This is shown that PHRC was publicly owned and managed, privately owned and managed as was the case with Notore and Indoroma which is public–private partnership making ownership to be cooperative.
Practice of EMS among companies The analysis of the application of environmental management system and processes in the day to day activities employed by the company is shown in Figure 3. It is revealed that 68.7% of the respondents agreed that they practiced environmental management system while 31.3% did not practice environmental management system.
Implantation or commencing year of EMS in companies Figure 4 shows the commencing year of EMS in companies. The analysis revealed that 63.3% of the respondents agreed that the commencing of EMS was after 2014 while 36.7% agreed that EMS commenced before 2014. Indoroma was found to be the oldest in the business of applying environmental management system in their projects and activities among the selected industries while PHRC and Notore started applying environmental management system in their projects and activities from 2014 which is an indicator that the environment is becoming of concern to the companies operating within the area.

J. Geogr. Reg. Plann. 4
Figure 1. Eleme Local Government showing selected Companies Table 1. Analysis of Questionnaire Administered and Retrieved
Industry Number of Questionnaire Distributed
Number of Questionnaire Retrieved
Percentage Retrieved
Indorama 111 110 99.1 PHRC 111 96 86.5 Notore 111 94 84.7 Total 333 300 90.1
Figure 2. Nature of Business Source: Researcher’s Fieldwork, 2018
05
101520253035
Manufacturing only
Extractive only Processing only Manufacturing and Extractive
Frequency

Kika and Arokoyu. 5
Table 2. Operational Sector among the Industries
Operational Sector Frequency Percentage (%)
Private 96 32.0 Public 94 31.3 Private-Public Partnership 110 36.7 Total 300 100
Source: Researcher’s Fieldwork, 2018
Figure 3. Practice of EMS among companies
Source: Researcher’s Fieldwork, 2018
Figure 4. Implantation or commencing year of EMS in companies
Source: Researcher’s Fieldwork, 2018 Waste product or pollutant emission by companies From the analysis displayed on the Figure 5, it is obvious that more that more than 90% of the total respondents agreed that all the companies emit or discharge waste in to the environment. Hence, there is need for them to all incorporate environmental management system in to their activities on a daily basis. This will mitigate the impact the company activities will have on the people and their environment.
206
94
0
50
100
150
200
250
Yes No
Frequency
0
10
20
30
40
50
60
70
Before 2014 After 2014
Frequency

J. Geogr. Reg. Plann. 6
Figure 5. Waste product or pollutant emission by companies
Source: Researcher’s Fieldwork, 2018 Company monitoring of waste or emissions From the Figure 6, it is revealed that 63.3% of the respondents agreed that company ensured that waste generated Is properly monitored from the source to discharge or emission point. From some observations made, it was shown that PHRC and Notore ensure that waste generated is properly monitored while Indorama did not.
Figure 6. Company Monitoring of waste or emissions
Source: Researcher’s Fieldwork, 2018 Pattern or intervals of waste or pollution monitoring From the analysis in Figure 7, it shown that majority of the respondents agreed that pattern or intervals of waste or pollution monitoring was scheduled and structured at periodic intervals of 7 days while about 31.3% disagreed. Observations show that PHRC and Notore are involved in waste monitoring; their monitoring procedure is scheduled and hence done at structured periodic interval of 7 days.
0
10
20
30
40
50
60
70
80
90
100
Yes No
Frequency
0
50
100
150
200
250
Yes No
Frequency

Kika and Arokoyu. 7
Figure 7. Pattern or intervals of waste or pollution monitoring
Source: Researcher’s Fieldwork, 2018 Emission or waste discharge maximum level (benchmark) From the Figure 8, 68.0% of respondents agreed that emission target is set while 32.0% disagreed. From the observation, Indoroma do not set emission target or maximum level expected to be emitted. This development or findings is not healthy when emissions are not monitored and target not set for emission.
Figure 8: Emission or waste discharge maximum level (benchmark)
Source: Researcher’s Fieldwork, 2018 Specialized units trained to maintain pollutant at lowest level It is shown in Figure 9 that 32..0% of the respondents agreed that there were some personnel trained as specialized unit to enforce emission limit in the company while 68.0% viewed that there was no limit to emissions in the industries.
0
20
40
60
80
100
120
140
160
180
200
Scheduled Not Scheduled
Frequency
204
96
0
50
100
150
200
250
Yes No
Frequency

J. Geogr. Reg. Plann. 8
Figure 9. Specialized units trained to maintain pollutant at lowest level Source: Researcher’s Fieldwork, 2018 Environmental less sensitive discharge of waste or emissions Figure 10 presents that 93.3% of respondents agreed that all the companies located in the study area are very sensitive to the discharge of waste or emissions into the environment while 6.7% did not. Thus, their environmental concern was commendable.
Figure 10. Environmental less sensitive discharge of waste or emissions Source: Researcher’s Fieldwork, 2018 Access to environmental Education From the analysis in Figure 11, it is revealed that 63.3% of the respondents viewed that members of staff acquire environmental education while 36.7% did not. Sequel to this, there is high level sensitivity by members of staff who were trained in the area of environmental education to govern their conduct in the environment which will reduce the impact company activities has on the environment through waste of pollutant emission.
204
96
0
50
100
150
200
250
No Limit Set Limit
Frequency
280
200
50
100
150
200
250
300
Sensitive Not Sensitive
Frequency
Kika and Arokoyu. 9
Figure 11. Access to environmental education
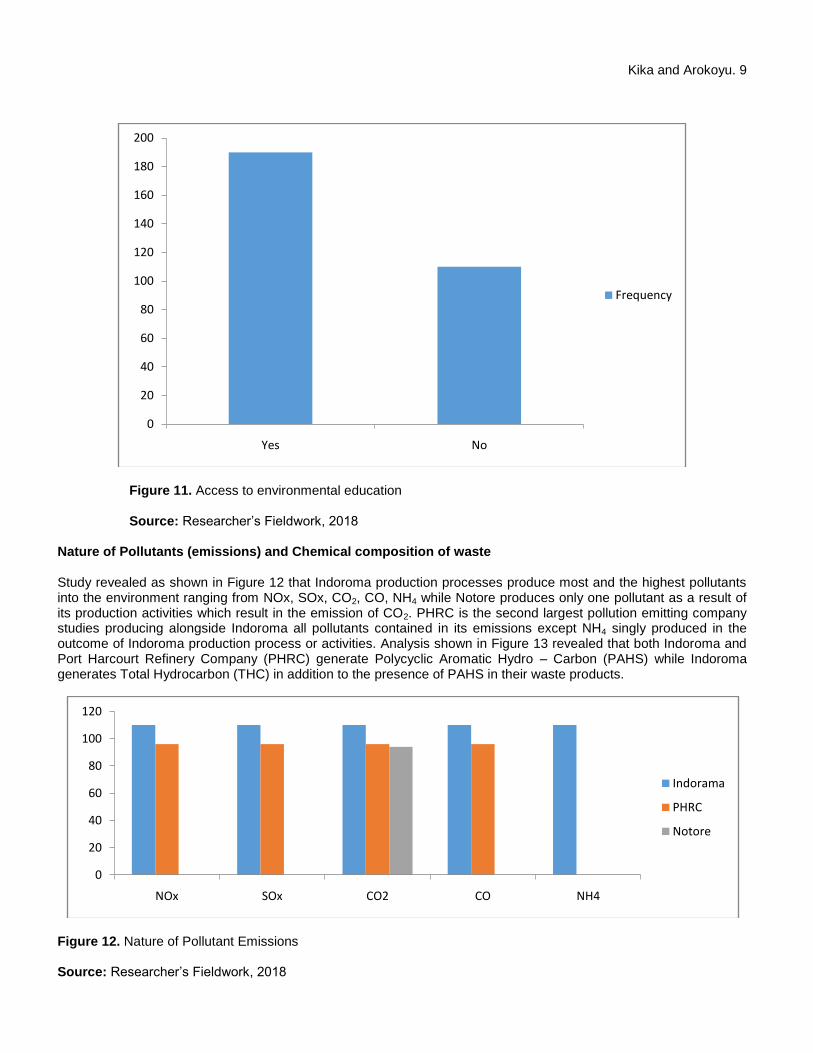
Source: Researcher’s Fieldwork, 2018 Nature of Pollutants (emissions) and Chemical composition of waste Study revealed as shown in Figure 12 that Indoroma production processes produce most and the highest pollutants into the environment ranging from NOx, SOx, CO2, CO, NH4 while Notore produces only one pollutant as a result of its production activities which result in the emission of CO2. PHRC is the second largest pollution emitting company studies producing alongside Indoroma all pollutants contained in its emissions except NH4 singly produced in the outcome of Indoroma production process or activities. Analysis shown in Figure 13 revealed that both Indoroma and Port Harcourt Refinery Company (PHRC) generate Polycyclic Aromatic Hydro – Carbon (PAHS) while Indoroma generates Total Hydrocarbon (THC) in addition to the presence of PAHS in their waste products.
Figure 12. Nature of Pollutant Emissions Source: Researcher’s Fieldwork, 2018
0
20
40
60
80
100
120
140
160
180
200
Yes No
Frequency
0
20
40
60
80
100
120
NOx SOx CO2 CO NH4
Indorama
PHRC
Notore

J. Geogr. Reg. Plann. 10
Figure 13. Chemical Composition of waste among the industries
Source: Researcher’s Fieldwork, 2018 Activities generating Pollutants among Companies The activities that were used to generate pollutants among companies were power generation, use of boiler houses and the act of gas flaring and waste pipe. It shows that 33% agreed on gas flaring, 61.3% agreed on boiler houses, 18.3% agreed on power generation while 17% agreed on waste pipe (Figure 14).
Figure 14. Activities generating Pollutants among Companies Source: Researcher’s Fieldwork, 2018 Sources of pollutants emission among companies It is shown in Figure 15 that 88.0% of respondents agreed that wastes were discharged through smoke stack while others agreed on exhaust pipe.
0
20
40
60
80
100
120
Indorama PHRC Notore
Polycyclic Aromatic Hydro – Carbon (PAHS)
Total Hydrocarbon (THC)
0
20
40
60
80
100
120
Boiler Houses Gas flaring Power Generation Waste Pipe
Frequency

Kika and Arokoyu. 11
Figure 15. Pollutants emission among companies
Source: Researcher’s Fieldwork, 2018 Operational Standards employed It is necessary for companies to adopt standard laid by regulatory agencies for their daily activities. In the study it was discovered in Figure 16 that all the companies’ studies adopted the standard laid out by National Environmental Standards and Regulations Enforcement Agency (NESRA). Not leaving any stone un-turn, Indoroma went step further to adopting other benchmark laid out for environmental standard for pollutant emission. These were standard created by World Health Organisation (WHO), Department of Petroleum Resources (DPR), United States Environmental Protection Agency (USEPA) and Federal Ministry of Environment of Nigeria (FEMV). More indicators observed in Indorama than the other two companies is a way to show that Indorama satisfied more regulations as laid down by NESRA, WHO, DPR, EPA, and FEMV than PHRC and Notore.
Figure 16. Operational Standard employed Source: Researcher’s Fieldwork, 2018
0
50
100
150
200
250
300
Through smoke stack Exhaust Pipe
Frequency
0
5
10
15
20
25
30
35
40
45
50
NESRA WHO DPR EPA FEMV
Indorama
PHRC
Notore

J. Geogr. Reg. Plann. 12 Pollution Potentials of companies Figure 17 shows that the risk of polluting the environment is more pronounced with Indoroma as they possess overhead tanks, underground tanks and these tanks has large product storage capacity which makes it easy for leakage. Other firms only possess above ground storage capacity which in the event of leakage, it is easier to detect the leakage source.
Figure 17. Pollution Potentials of companies
Source: Researcher’s Fieldwork, 2018 Facilities monitoring for integrity test From Figure 18, 86.0% of total respondents agreed that there are facilities monitoring for integrity test while 14% did not agree. The risk of polluting the environment is more pronounced with Indoroma as they possess overhead tanks, underground tanks and these tanks has large product storage capacity which makes it easy for leakage. Other firms only possess above ground storage capacity which in the event of leakage, it is easier to detect the leakage source. Though, all the companies embark on proper integrity test to ensure that the facilities still maintain build capacity for handling the products.
Figure 18. Facilities monitoring for integrity test
Source: Researcher’s Fieldwork, 2018
0
20
40
60
80
100
120
Indorama PHRC Notore
Overhead tanks
Underground tanks
Bulk Storage
0
50
100
150
200
250
300
Yes No
Frequency

Kika and Arokoyu. 13 Nature of facility/integrity test The analysis in Figure 19 presents that all the companies embarked on proper integrity test which are done or conducted via many avenues which included joint monitoring, auditing of monitoring report and independent monitoring. All were carried out in Indorama without much difference but independent monitoring was prominent in PHRC while auditing of monitoring report was more pronounced in Notore.
Figure 19. Nature of facility/integrity test Source: Researcher’s Fieldwork, 2018 Indicators of Corporate environmental management systems Thirty one different indicators were listed in Table 4 and it shows that Indorama had the highest indicators. From the findings, it could be revealed that there was no significant difference in the corporate environment management systems of the selected companies in Eleme LGA, Rivers State, Nigeria (F=0.716; p=0.492). Challenges facing implementation of EMS Figure 4.20 shows the challenges facing the implementation of EMS among the selected companies. It is shown that weak regulation was noticed as the major cause of poor implementation of environmental management system in these companies as 51.3% of the respondents agreed to this. It is also shown that poor training was attested to by 27.3% while 20% agreed on poor management commitment. The practice of environmental management system in their areas of domain makes it easy for the companies to continually audit their policies to ensuring that it is in conformity to what is expected from a standard environmental management system applied by firms. Though their year of incorporating the environmental management system into their daily activities varies from one company to another, it is obvious that all companies are
conscience of the environmental implication of their activities hence have launched the EMS in their activities. Waste monitoring practice is obvious in the companies schedule but it is done at periodic intervals which are scheduled rather than on a daily basis especially for PHRC and Notore. PHRC went beyond the scheduled monitoring of waste to the placement of emission target on waste emission or disposal into the environment to ensure that only controllable waste are let out in to the environment with a standby trained unit that ensures compliance to the set target in the organization. The companies especially Notore and PHRC ensured that members of staff were trained in the areas of environmental education and also designated areas that are environmental less sensitive to discharge waste effluent or emit pollutants into the environment. This became necessary as they emitted large amount of pollutants into the environment with Indoroma taking the lead of pollutants emission while at regulation they also became first from the rear. With the level of activities that could generate pollution of the environment, all the companies adopted the regulation standard put in place by NESRA while Indoroma went further to adopting the regulation that are laid out by WHO, DPR, EPA, and FEMV inclusively and believed that this has a way of putting them in check on the issues regarding the environment.
0
10
20
30
40
50
60
70
80
90
Indorama PHRC Notore
Joint monitoring
Auditing of monitoring report
Independent monitoring
All of the above

J. Geogr. Reg. Plann. 14 Table 3. Indicators of Corporate EMS and Policies
Indicators Indorama PHRC Notore
Availability of EMS 1 0 1 Years of implementation 9 2 2 Monitoring of Emission 0 1 1 Intervals of Pollution Monitoring 0 1 1 Availability of emission target 0 1 0 Specialized unit for pollution monitoring 0 1 0 Environmental sensitivity for pollution discharge 1 1 1 Environmental education of members of staff 0 1 1 Number of pollutants 5 4 1 Potential of pollution generation 2 2 1 Environmental risk in discharge 1 1 0 Regulatory standard laid out 4 1 1 Availability of Procedure for Environmental Monitoring 1 0 1 Trained Personnel for environmental monitoring 0 1 1 Frequency of environmental Audit 1 0 1 Treatment of Waste water 1 1 1 Conduct of contamination survey 1 1 1 Availability of Noise receptors 1 1 1 Activities that promote wildlife 0 0 1 Communication with suppliers to minimise environmental impacts 1 1 1 Influence on suppliers to improve environmental quality 1 1 1 Availability of EMS to the public 1 1 1 Availability of documented environmental policy 1 1 1 Impact of company product on environment Quality 0 0 1 Relationship between product and human health 1 1 1 Presence of radioactive source 1 1 1 Use of Ozone depleting products 0 1 0 Activities that give rise to Dust 0 1 0 Activities that give rise to Vibration 1 1 0 Activities that give rise to Odour 1 1 1 Activities that give rise to Visual Impact 0 1 0 Total 36 31 25
F = 0.716; p=0.492 Finally integrity test are conducted for facilities by all the companies to ensure that the built capacity is sustained though week regulation is outlined as the basic factors hindering the proper implementation of the environmental management system plan across companies. The dominating challenges noted in the present study were weak regulation and poor training. This is not so in Famiyeh, Kuttu & Anarfo (2014) study which noted that implementation cost and too much paper work seemed to be the most two important factors that hinders the implementation of environmental management systems in Ghana. This is possible because all challenges may not be equally applicable to each and every organization (Barve and Muduli, 2011). Meanwhile, poor management commitment which is noted as a major challenge towards achieving adequate implementation of
environmental management systems is in consonance with the study of Barve and Muduli (2011) in Indian mining industries.

Kika and Arokoyu. 15
Figure 4.20: Challenges facing implementation of EMS
Source: Researcher’s Fieldwork, 2018 DISCUSSION OF FINDINGS Findings revealed that the application of environmental management system and processes in the day to day activities of the company was only employed by Indoroma and Notore while the PHRC did not employ environmental management system enlisted in their daily management of the company extraction activities and waste. This may be attributed to the voluntary compliance behavior of the company. Case (2006) reported that achievement of environmental regulatory goals is substantially dependent on voluntary compliance behavior by corporate environmental actors. It was discovered in the analysis that Indoroma was the oldest in the business of applying environmental management system in their projects and activities while PHRC and Notore recently started applying environmental management system in their projects and activities from 2014. This is an indicator that the environment is becoming of concern to the companies operating within the area and the awareness is for this environmental approach is becoming more popular to safeguard the environment. The potentials of pollutants generated by Indorama and PHRC were enormous.
The pollutants were NOx, SOx, CO2, CO, NH4, hence the quality of life of people in this vicinity and the surrounding communities will have been affected.
Urban areas are characterized by intense emissions from industrial activities (Emenike and Orjinmo, 2017). Ambient concentrations of air pollutants are often several times higher in developing country cities compared to those in industrial countries (Gwilliam, et al., 2004). The diffusion of pollutants from industries lies in human’s respiratory zone and threat human’s health directly (Wang, 2006). The training of the members of staff which was discovered in PHRC and Notore ensures that members of staff acquire environmental education and as a result, there is sensitivity by members of staff who were trained in the area of environmental education to govern their conduct in the environment and this will reduce the impact company activities has on the environment through waste of pollutant emission. Reilly (2008) reported that environmental education encourages citizens to make knowledgeable and informed decisions about their environmental behavior based on the awareness, knowledge, skills, and attitudes instilled in them.
Thus, environmental education would also encourage citizens to make informed and positive actions toward the environment (Environmental Education and Training Partnership, 2000). Findings reveal that PHRC and Notore ensured that waste generated is properly monitored from the source to discharge or emission point while despite Indoroma long term implementation of environmental management system, their waste
0
20
40
60
80
100
120
140
160
Poor training Weak regulation Poor management commitment
No comment
Frequency

J. Geogr. Reg. Plann. 16 disposal and management is still inappropriate as the pollutants can be easily released and filtered into the human food chain through soil and water bodies (surface and groundwater) and this can lead to several health challenges. Sankoh, Yan and Tran (2013) reported that school children, waste workers and workers in facilities are group of people at higher risk of waste pollutants. It has been shown that exposure to hazardous waste can affect human health, children being the most vulnerable to these pollutants and direct exposure can lead to diseases through chemical exposure as the release of chemical waste into the environment leads to chemical poisoning (Nwanta and Ezenduka, 2010; Sankoh et al., 2013). The challenges discovered in this study are needed to help a manager develop strategies to minimize the impact of those barriers in future. Barve and Muduli (2010) viewed that the barriers that have been identified can help managers evaluate the degree to which these barriers are present in their organization. It will also bring about the improvement in the environmental improvement (Ho, Law and Lim, 2017; Botchway and Gbedemah, 2018). CONCLUSION AND RECOMMENDATIONS From the findings above the companies under study are involved in extraction, manufacturing and processing activities. These activities have actually exposed the environment to an adverse degradation. Hence, there is the need for a continual environmental audit to ensure that there is a sustainability of the environment; the companies under study should maintain a trained staff unit to monitor any emission or discharges arising from their activities; and there should be a strict adherence to the established environmental standards guiding their operations. REFERENCES Anderson, B., Bryce M., Theobald J, Oakley J.and Wilkes
T.(2007). Habitat management for tanks a Tuans: Evolving approaches at Puckapunyal military area. Ecol. Manage. Restorat., 8: 11-25. DOI: 10.1111/j.1442-8903.2007.00327.x
Ann, G.E., Zailani S. and Wahid N.A. (2006). A study on the impact of Environmental Management System (EMS) certification towards firms’ performance in Malaysia. Manage. Environ. Q. An. Int. J., 17: 7393. DOI: 10.1108/14777830610639459
Arbuckle, G. K. (2004). A comparative study of selected measures of performance of organizations before and after obtaining ISO 9000 certification as compared to the S and P 500 index. Indiana State University. ProQuest dissertations and theses, Retrieved from Block, M. R., & Marash, R. I. (1999). Integrating ISO 14001 into a quality management system Milwaukee, WI: ASQ Press.
Arimura, T.H., Hibiki A. and Katayama, H. (2008). Is a voluntary
approach an effective environmental policy instrument? A case for environmental management systems. J. Environ. Econ. Manage., 55: 281-295. DOI: 10.1016/j.jeem.2007.09.002
Barve A. and Muduli K. (2011). Challenges to Environmental Management Practices in Indian Mining Industries. 2011 International Conference on Innovation, Management and Service, IPEDR, 14(2011):297-301.
Beeby, R., (2008). Defence wants free rein on training. Canberra Times
Botchway N. and Gbedemah S.F. (2018). Corporate Environmental Management Systems and Outcomes: A Case Studyof ISO 14001 Implementation in a Cable Manufacturing Company in Tema, Ghana. European Scientific Journal, 14(31):320-336.
Burgess, N. (1993). The role of consulting in quality development. Proceedings of the World Quality Congress, Helsinki.
Casadesus, M., and Gimenez, G. (2000). The benefits of implementation of the ISO 9000 standard: Empirical research in 288 Spanish companies. The TQM Magazine, 12(6), 432-441.
Case D.W. (2006). Changing Corporate Behaviour Through Environmental Management Systems, 31 Wm. & Mary Envtl. L. & Pol'y Rev. 75, http://scholarship.law.wm.edu/wmelpr/vol31/iss1/4 pp 1-38.
Chow-Chua, C., Goh, M., and Boon Wan, T. (2003). Does ISO 9000 certification improve business performance? International Journal of Quality and Reliability Management, 20(8), 936-953.
Corbett, C. J., Montes, M. J., Kirsch, D. A., and Alvarez-Gil, M. J. (2002). Does ISO 9000 certification pay? ISO Management Systems, 2(4), 31-40.
Corbett, C., Montes-Sancho, M., and Kirsch, D. (2005). The financial impact of ISO 9000 certification in the United States: An empirical analysis. Management Science, 51, 1046-1059.
Corbett, L., and Cutler, D. (2000). Environmental management systems in the New Zealand plastics industry. International Journal of Operations and Production Management, 20, 204-224.
Dawson, M., (2004). Environmental Management Systems (EMS) in the Military Sector-Promoting Broader Implementation. In: In: Defense and the Environment: Effective Scientific Communication, Mahutova, K., J.J. Barich and R.A. Kreizenbeck (Eds.), Springer, Dordrecht, ISBN-10: 1402020821, pp: 75-83.
Delmas, M., and Montiel, I. (2008). The diffusion of voluntary international management standards: Responsible care, ISO 9000, and ISO 14001 in the chemical industry. Policy Studies Journal, 36(1), 65-93. Retrieved from EBSCOhost.
Easton, G. S., and Jarrell, S. L. (1998). The effects of total quality management on corporate performance: An empirical investigation. Journal of Business, 71, 253-307.
Eludoyin O.S., Oderinde F.A. and Azubuike, O.J. (2010): Effects of Rubber (Hevea brasiliensis) Plantation on a Hydromorphic Soil of South-South Region of Nigeria. Journal of Tropical Forest Resources, University of Ibadan, Ibadan, 26(1):1-14.
Emenike, G. C. and Orjinmo, C. (2017): Vehicular Emissions Around Bus Stops In Port Harcourt Metropolis, Rivers State, Nigeria European Journal of Research in Social Sciences, Vol. 5 (3):19-36.
Emilsson, S. and Hjelm, O. (2002). Implementation of standardised environmental management systems in Swedish local authorities: Reasons, expectations and outcomes. Environ. Sci. Policy, 5: 443-448. DOI: 10.1016/S1462-9011(02)00090-4
Famiyeh S., Kuttu S. and Anarfo E.B. (2014). Challenges of Environmental Management Systems Implementation in Ghanaian Firms. Journal of Sustainable Development; 7(1):105-114.

Feng, M., Terzioski, M., and Samson, D. (2008). Relationship of
ISO 9001:2000 quality system certification with operational and business performance: A survey in Australia and New Zealand-based manufacturing and service companies. Journal of Manufacturing Technology Management, 19(1), 22-37.
Guasch, J. L., Racine, J. L., Sanchez, I., and Diop, M. (2007). Quality systems and standards for a competitive edge. Washington, DC: World Bank Publications.
Gupta, M., and Sharma, K. (1996). Environmental operations management: An opportunity for improvement. Production and Inventory Management Journal, 37, 40- 46.
Gwilliam, K., M. Kojima, and T. Johnson. 2004. Reducing Air Pollution from Transport. Washington, DC: World Bank.
Hale, M., 1995. Training for environmental technologies and environmental management. J. Cleaner Product. 3: 19-23. DOI: 10.1016/0959-6526(95)00060-R.
Hart, S. L. (1995). A Natural Resource Based View of the Firm. Academy of Management Review, 20: 986-1014.
Haversjo, T. (2000). The financial effects of ISO 9000 registration for Danish companies. Managerial Auditing Journal, 15(1), 47-52.
Hendricks, K., and Singhal, V. (1997). Does implementing an effective TQM program actually improve operating performance? Empirical evidence from firms that have won quality awards. Management Science, 43(9), 1258-1274.
Heras, I., Casadesus, M., and Dick, G. P. M. (2002). ISO 9000 certification and the bottom line: A comparative study of the profitability of Basque region companies. Managerial Auditing Journal, 17(1), 72-78.
Hertin, J., F. Berkhout, Wagner M and Tyteca D. (2008). Are EMS environmentally effective? The link between environmental management systems and environmental performance in European companies. J. Environ. Plann. Manage., 51: 259-283. DOI: 10.1080/09640560701865040
Ho, L.L., Law, P.L. and Lim, S. F. (2017). Environmental management systems (EMS) adoption in Sarawak (Malaysia): Implementation motivations. Fronteiras: Journal of Social, Technological and Environmental Science 6 (2): 198-216.
ISO, 2004. ISO 14001:2004, Environmental Management Systems-Requirements with guidance for use. International Organization for Standardization, Switzerland.
Johnson, P. (1997). ISO 14000: The business manager’s complete guide to environmental management. New York, NY: Wiley.
Kartha, C. P. (2004). A comparison of ISO 9000:2000 quality system standards, QS 9000, ISO/TS 16949 and Baldrige criteria. The TQM Magazine, 16(5), 331-340.
Kitazawa, S., and Sarkis , J. (2000). The relationship between ISO 14001 and continuous source reduction programs. International Journal of Operations and Production Management, 20, 225-248.
Klassen, R. D. (2000). Exploring the linkage between investment in manufacturing and environmental technologies. International Journal of Operations Management, 20, 127-147.
Kolebaje O.T., Ikusika A. and Akinyemi P. (2016). Estimating Solar Radiation In Ikija And Port Harcourt Via Correlation With Relative Humidity and Temperature. Int. J. of Energy Prod. & Mgmt., 1(3) 253–262.
Kolk, A. and Mauser, A. (2002). The evolution of environmental management: From stage models to performance evaluation. Bus. Strategy Environ., 11: 14-31. DOI: 10.1002/bse.316
Lavrakas P.J. (2008). Cross-Sectional Survey Design. In: Encyclopedia of Survey Research Methods. Encyclopedia DOI: http://dx.doi.org/10.4135/9781412963947.n120 (Accessed on 28/11/2017).
Lloyd’s Register Quality Assurance Ltd. (LRQA) (1995). The
Kika and Arokoyu. 17 effects of ISO 9000 on business performance. London: LRQA Publication.
Magretta J. 1997. “Growth Through Global Sustainability.” Harvard Business Review , January-February, 79-88.
Maier, S. and Vanstone, K. (2005). Do good environmental management systems lead to good environmental performance? Ethical Investment Research Services (EIRIS) Research Briefing, pp: 112
Martinez-Costa, M., and Martinez-Lorente, A. R. (2008). A triple analysis of ISO 9000 effects on company performance. International Journal of Productivity and Performance Management, 56(5/6), 484-499.
McAdam, R., and McKeown, M. (1999). Life after ISO 9000: An analysis of the impact of ISO 9000 and total quality management on small businesses in Northern Ireland. Total Quality Management, 10(2), 229-241. Retrieved from EBSCOhost.
Melbinger A. and Vergassola M. (2015). The Impact of Environmental Fluctuations on Evolutionary Fitness Functions, Scientific Reports, 5(15211):1-11
Moore, R.T., (2004). A Corporate EMS for the UK Ministry of Defence. In: In: Defense and the Environment: Effective Scientific Communication, Mahutova, K., J.J. Barich and R.A. Kreizenbeck (Eds.), Springer, Dordrecht, ISBN-10: 1402020821, pp: 85-89.
Morris, A. S. (2004). ISO 14000 environmental management standards: Engineering and financial aspects. Hoboken, NJ: Wiley.
National Research Council (1995). Standards, conformity assessment, and trade: Into the 21st century. New York: National Academies Press.
NATO-CCMS, (2000). Pilot study on environmental management systems in the military sector.
Nwanta J. A. and Ezenduka E. (2010): Analysis of Nsukka Metropolitan Abattoir Solid Waste in South Eastern Nigeria: Public Health Implications,” Archives of Environmental and Occupational Health, Vol. 65, No. 1, 2010, pp. 21- 26. doi:10.1080/19338240903390263.
Ogungbenro B.S. and Morakinyo T.E. (2014). Rainfall distribution and change detection across climatic zones in Nigeria. Weather and Climate Extremes, 5-6(2014):1-6
Pantouvakis, A., and Dimas, A. (2010). Does ISO 9000 series certification matter for the financial performance of ports? Some preliminary findings from Europe. Maritime Policy & Management, 37(5), 505-522. Retrieved from EBSCOhost.
Porter, L., and Rayner, P. (1991). BS 5750/ISO 9000 – the experience of small and medium sized businesses. International Journal of Quality and Reliability, 18(6), 16-29.
Powell, T. C. (1995). Total quality management as competitive advantage: A review and empirical study. Strategic Management Journal, 16, 15-37.
Quazi, H. A., and Padibjo, S. R. (1998). A journey towards total quality management through ISO certification: A study on small and medium-sized enterprises in Singapore. International Journal of Quality and Reliability Management, 15(5), 364-371.
Quinn, T. (1992). The role of ISO 9000 in a market led company. Business and Finance, 27-31.
Ramos, T.B., Alves, I. Subtil R. and Melo J.J. (2007). Environmental pressures and impacts of public sector organizations: The case of the Portuguese military. Progress Indus. Ecol.: Int. J., 4: 363-381. DOI: 10.1504/PIE.2007.015617
Rao, N.H., (2005). Environmental management: Relevance and implications for management of defence installations for sustainability. Curr. Sci., 88: 1753-1758.
Reilly S. (2008). Environmental Education’s Role in Sustainable Development: Three Case Studies from India, South Africa &

J. Geogr. Reg. Plann. 18
the United States. NR 523 – International Resource Management. https://www.uwsp.edu/forestry/StuJournals/Documents/IRM/Reilly.pdf (Accessed on 25/11/2017).
Renzi, M. F., and Cappelli, L. L. (2000). Integration between ISO 9000 and ISO 14000: Opportunities and limits. Total Quality Management, 11(4/5/6), S849. Retrieved from EBSCOhost.
Rowland-Jones, R., Pryde M and Cresser, M. (2005). An evaluation of current environmental management systems as indicators of environmental performance. Manage. Environ. Q.: Int. J., 16: 211-219. DOI: 10.1108/14777830510591642
Samson, D. A., and Terziovski, M. (1999). The relationship between total quality management practices and operational performance. Journal of Operations Management, 17(5), 393-409.
Sankoh F.P, Yan X. and Tran Q. (2013). Environmental and Health Impact of Solid Waste Disposal in Developing Cities: A Case Study of Granville Brook Dumpsite, Freetown, Sierra Leone. Journal of Environmental Protection, 4, 665-670. http://dx.doi.org/10.4236/jep.2013.47076
Sayre, D. (1996). Inside ISO 14000: The competitive advantage of environmental management. Delray Beach, FL: St Lucie Press.
Seymour V. (2016). The Human–Nature Relationship and Its Impact on Health: A Critical Review. Front Public Health, 4 (260):1-12.
Sinclair, R. and R. Tschirhart, (2001). Army Environmental Policy and ISO 14001. Federal Facilities Environ. J., 12: 53-65. DOI: 10.1002/ffej.1005
Sroufe R.P., Melnyk S.N.A.and Vastag G. (1998). Environmental Management Systems As A Source of Competitive Advantage. Available at http://www.asse.org/assets/1/7/EMS-CA.pdf (Accessed 28/11/2017).
Starik, M., Rands, and G. P. 1995. “Weaving an Integrated Web: Multilevel and Multisystem Perspectives of Ecologically Sustainable Organizations.” Academy of Management Review , 20: 908 - 935.
Staw, B., and Epstein, L. (2000). What bandwagons bring: Effects of popular management techniques on corporate performance, reputation, and CEO pay. Administrative Science Quarterly, 45, 523-556.
Taylor, W. (1995). Organizational differences in ISO 9000
implementation practices. International Journal of Quality and Reliability, 12(7), 10-38.
Terziovski, M., Samson, D. A., & Dow, D. (1997). The business value of quality management systems certification: Evidence from Australia and New Zealand. Journal of Operations Management, 15, 1-18.
Todorov, B. (1996). ISO 9000 required: Your worldwide passport to customer confidence. Portland, OR: Productivity Press.
Troy, K (Ed.). (1992). Baldrige winners on world-class quality. New York: The Conference Board.
Vastag, G., Rondinelli, D. A., and Kerekes, S. (1996). How Corporate Executives Perceive Environmental Issues: Comparing Hungarian and Global Companies.” Journal of Euromarketing, 5,(3), 5-27.
Wang, Y., and Nancy L.N., (2000). Freeway Speed Estimation Using Single Loop Outputs. In Transportation Research Record. TRB National Research Council, Washington, D.C., 1727, 120-126.
Wayhan, V. B., Kirche, E. T., & Khumawala, B. M. (2002). ISO 9000 certification: The financial performance implications. Total Quality Management, 13(2), 217-231. Retrieved from EBSCOhost.
Wilson, J. P., Walsh, M. T., and Needy, K. L. (2003). An examination of the economic benefits of ISO 9000 and the Baldrige Award to manufacturing firms. Engineering Management Journal, 15(4), 3-10. Retrieved from EBSCOhost.
Witcher, B. (1994). The adoption of total quality management in Scotland. The TQM Magazine, 6(2), 48-53.
Wong B.B.M. and Candolin U. (2015). Behavioral responses to changing environments, Behavioral Ecology, 26, (3):665–673, https://doi.org/10.1093/beheco/aru183
Zutshi, A., Sohal A.S. and Adams, C. (2008). Environmental management system adoption by government department/agencies. Int. J. Public Sector Manage., 21: 525-539. DOI: 10.1108/09513550810885813